Article

Modeling Exchange Rate Volatility in India in Relation to COVID-19 and Lockdown Stringency: A Wavelet Coherence and Quantile Causality Approach

1
Institute of Management, Commerce and Economics, Shri Ramswaroop Memorial University, Barabanki 225003, India
2
School of Economics and Management, Hainan Normal University, Haikou 571127, China
3
Department of Insurance and Risk Management, Faculty of Economics, Management and Accountancy, University of Malta, MSD 2080 Msida, Malta
4
Faculty of Economics and Social Sciences, University of Latvia, LV-1586 Riga, Latvia
5
Department of Economics, Abdul Wali Khan University, Mardan 23200, Pakistan
6
Chitkara Business School, Chitkara University, Rajpura 140401, India
7
Women Researchers Council, Azerbaijan State University of Economics (UNEC), Istiglaliyyat Street 6, AZ1001 Baku, Azerbaijan
*
Author to whom correspondence should be addressed.
Risks 2025, 13(9), 182; https://doi.org/10.3390/risks13090182
Submission received: 13 July 2025 / Revised: 20 August 2025 / Accepted: 10 September 2025 / Published: 22 September 2025

Abstract

The COVID-19 pandemic and the implementation of strict lockdown measures have significantly impacted various dimensions of the global economy. This study examines the impact of COVID-19 and lockdown stringency on exchange rate volatility in India using three core variables, i.e., COVID-19 cases, the lockdown stringency index, and exchange rate volatility. To achieve the above objectives, we have employed advanced econometric techniques, such as wavelet coherence and a hybrid non-parametric quantile causality framework, on the dataset spanning from 30 December 2020 to 24 January 2022. Robustness is assessed using Troster–Granger causality in quantiles and Breitung–Candelon Spectral Causality tests. The wavelet coherence analysis indicates that the initial outbreak of COVID-19 increased the exchange rate volatility, while the enforcement of stringent lockdowns in the later phases helped reduce this volatility. Similarly, the hybrid quantile causality results indicate that both COVID-19 cases and lockdown measures possess predictive power over exchange rate fluctuations. The robustness checks confirm these findings and establish a causal relationship between the pandemic, policy responses, and currency market behaviour. This study helps clarify the complex, nonlinear dynamics between pandemic-related variables and exchange rate volatility in emerging markets. Based on the aforementioned result, it is recommended that policymakers implement targeted lockdown strategies coupled with timely monetary interventions (such as foreign exchange reserve management or interest rate adjustments) to mitigate volatility and maintain currency stability during future pandemic-induced shocks.

1. Introduction

The global economic impact of the COVID-19 pandemic, which began in early 2020, has been devastating, leading to significant disruptions across various sectors, including healthcare, travel, tourism, and manufacturing. The most recent edition of the International Labour Organization reports that the COVID-19 pandemic in 2020 led to the loss of 114 million jobs, resulting in working-hour losses approximately four times greater than those during the 2009 financial crisis. This unprecedented job loss, coupled with stringent government measures to curb the spread of the virus, such as lockdowns and travel restrictions, has created a climate of economic uncertainty that has profound implications for exchange rate stability. The growing uncertainty and economic loss due to the pandemic have prompted scholars to investigate its impact on various macroeconomic dimensions, particularly focusing on exchange rate volatility. Previous studies have highlighted the importance of understanding how COVID-19 influences financial markets, as the daily and weekly fluctuations associated with the pandemic introduce significant uncertainty that can exacerbate exchange rate volatility (Feng et al. 2021; Wu et al. 2022). This volatility is not merely a reflection of the market sentiment; it can also lead to real economic consequences, such as increased costs for imports and exports, which can further strain a country’s economic recovery.
Numerous scholars have also examined the impact of COVID-19 on commodity markets, including exchange rates. For instance, Mensi et al. (2020), Atri et al. (2021), and Gharib et al. (2021) examined the influence of COVID-19 on oil and gold prices. Likewise, Rajput et al. (2021), Amar et al. (2021), and Sharma et al. (2023) investigated the impact of the COVID-19 pandemic on industrial metals like silver, copper, zinc, etc.; Iyke (2021) and Feng et al. (2021) explored the influence of COVID-19 on exchange rate volatility. According to the baseline findings in most of the studies above, the pandemic has not only negatively affected the oil market and other industrial metals but also gold prices. Still, it has also led to an exponential increase in global exchange rate volatility. This heightened volatility is crucial because it can impact capital flows and foreign investment decisions, which are vital for a country’s ability to finance its healthcare systems and support economic recovery efforts. Furthermore, fluctuations in exchange rates can affect inflation rates, impacting the affordability of essential goods and services and exacerbating the financial challenges faced by vulnerable populations (Ha et al. 2020).
Two main issues drive the present study. First is the contagious effect caused by the financial crisis, as depicted in the following studies (Celık 2012; Dimitriou et al. 2013; Gulzar et al. 2019; Wei et al. 2022), and second are the aberrations in international trade and capital flows due to the sudden outbreak of the COVID-19 pandemic. The conventional literature on finance has expressed the importance of exchange rate volatility for the stability of countries’ trade and external economic environment. Instability in the exchange rate severely deepens financial market risks, increases financial market uncertainties, and disrupts social welfare programmes (Kasman et al. 2011). Previous studies suggest that uncertain situations play a significant role in predicting exchange rate volatility. For instance, studies have projected that terrorist attacks and geopolitical risks often lead to appreciation in some currencies and depreciation in other currencies (Balcilar et al. 2017; Salisu et al. 2022; Syed et al. 2025). Likewise, Sharma et al. (2021) examined the influence of the U.S. government shutdown on exchange rate volatility and suggested that the government shutdown had a direct impact on exchange rate volatility. However, the consequences of shutdowns were experienced mostly for a day after a shutdown.
Additionally, the influence of the COVID-19-induced lockdown stringency on exchange rate volatility can be interlinked with several theoretical arguments. First and foremost, we can refer to uncertainty theory, which argues that stringent lockdowns implemented due to COVID-19 may lead to increased macroeconomic uncertainty, hindering investments and capital inflow, potentially creating exchange rate volatility. Second, we can draw inferences from the theoretical arguments of the balance of payment theory, which elucidate that restrictions on trade and cross-border investments can alter current account balances, potentially leading to currency fluctuations and exchange rate volatility. Third, we can also refer to the theoretical background stemming from the behavioural finance literature, which indicates how stringent policy responses aggravate the risk perception among investors, leading to herding, speculative trading, and market overreactions, which drive volatility in the currency markets. Finally, we can also borrow inferences from the conceptual argument put forth by Salisu et al. (2022), which explains how the lockdown-induced disruption in small and medium enterprises, which are considered vital for capital inflows and trades, limits foreign earnings and exerts pressure on the currency markets. These theoretical justifications and inferences drawn from the existing literature provide adequate theoretical arguments and motivations for exploring how lockdown stringency affects exchange rate volatility within the Indian market during the COVID-19 pandemic.
To achieve the aforementioned objectives, we have used a novel wavelet coherence and causality in quantile approaches, utilising the dataset from 30 December 2020 to 24 January 2022. The results show that, overall, COVID-19 increases the exchange rate volatility in India, whereas lockdown stringency decreases it. The findings also reveal that the lockdown stringency index has a lead-and-follow relationship with the exchange rate volatility in India. The current study specifically focuses on the Indian exchange rate volatility for several reasons: India is a rapidly growing economy on a global scale, benefiting from a large population and a developing market structure. India’s trade and external sectors contribute significantly to the GDP growth, per capita income expansion, and exchange rate volatility. The Indian foreign currency market exhibits an average daily turnover ranging from approximately USD 40 to 45 billion, positioning it among the most liquid markets within emerging economies. The majority of this is derived from transactions occurring in the spot, swap, and forward markets. Commercial banks, international institutional investors, and enterprises significantly contribute to this phenomenon. The Reserve Bank of India plays a crucial role in maintaining market stability and ensuring adequate liquidity in the economy. This is achieved via direct intervention and the implementation of a macroprudential policy. The foreign exchange market exhibits considerable depth and liquidity, facilitating the discovery of prices; however, it remains susceptible to global disruptions, such as the COVID-19 pandemic. Moreover, India’s total exports of goods and services in April–March 2021–2022 amounted to USD 669.7 billion, representing a 34.5% rise compared to the previous year and a 27.2% increase compared to April–March 2019–2020. Despite global economic instability resulting from the pandemic and geopolitical developments, projections indicate that India will surpass its export target of USD 650 billion. However, according to the WTO’s Committee on Trade and Development, India’s exports shrank by 14.7% to USD 276.5 billion in 2020, while imports fell by 23.2% to USD 373.3 billion. Moreover, as per the estimate of the Reserve Bank of India, the Indian rupee demonstrated considerable volatility throughout the pandemic period. In 2019, the average USD to INR exchange rate was around 70.9. However, in 2020, it experienced a depreciation, averaging 74.1, which indicates a significant decline exceeding 4.5%. The exchange rate surpassed the 76 threshold during the peak pandemic months of early 2020, indicating heightened investor uncertainty, capital outflows, and a general aversion to global risk. This sharp depreciation highlights the exchange rate’s sensitivity to pandemic-induced economic shocks, reinforcing the need to examine the pandemic’s effect on currency volatility. The pandemic-induced disruption in supply chains, combined with a recession in many countries, reduced the demand for goods. Among the top export destinations of developing countries, India slipped from 9th position (2018) to 10th position (2020). In addition to the disruption in capital inflows, undue pressure from equity outflows, higher crude prices, inflation, and geopolitical risks have also widened the current account deficit and weakened the rupee. The COVID-19 pandemic, in addition to the aforementioned factors, had a profound impact on the Indian economy. In 2022, the World Health Organisation reported that India had the highest incidence of COVID-19 cases (43,023,215) and deaths (521,101) among developing nations. In response, the Indian government implemented a total of five lockdowns, two of which were complete and three were partial, to control the spread of the pandemic. The strict lockdown measures have had a significant negative impact on the Indian economy, and the Indian currency has also borne the brunt of this economic hardship. Furthermore, these lockdowns have also impacted the supply chain of small- and medium-scale enterprises, which are highly preferred channels for capital inflows. Hence, in light of the worldwide unpredictability and the negative consequences of the high number of COVID-19 cases and deaths, we endeavoured to assess the impact of the strict lockdown measures and the COVID-19 pandemic on the volatility of the Indian exchange rate.
The present study makes a significant contribution to the existing literature in several aspects. Primarily, it is the first study to assess the impact of COVID-19 and lockdown stringency on exchange rate volatility in India. While a few previous studies have touched on the relationship between COVID-19 and exchange rate volatility, for instance Feng et al. (2021) and Rao et al. (2022), our research stands out due to the inclusion of a substantial dataset spanning from 30 December 2020 to 24 January 2022, covering both waves of the pandemic. This extended timeline allows for a more in-depth analysis of the dynamics between COVID-19 and Indian exchange rate volatility. Understanding exchange rate volatility is crucial because it can significantly impact capital flows and foreign investment decisions, as well as a country’s ability to finance its healthcare systems, stimulate its economy, and effectively address pandemic-related challenges. Furthermore, this analysis not only explores the impact of COVID-19 on exchange rate volatility but also investigates the influence of lockdown stringency on exchange rate volatility in India. To the best of our knowledge, empirical studies have not previously examined this aspect. As already discussed, the Indian government imposed five lockdowns during the COVID-19 pandemic. Among the five lockdowns, two were characterised as total lockdowns, while the remaining three were categorised as partial lockdowns. As a result, examining the impact of lockdowns on the exchange rate will add a new domain to the existing body of literature. Moreover, exploring the above relationship will aid in understanding the impact of restrictive measures on exchange rate volatility, which will help policymakers and the government comprehend the effects of such measures on exchange rate volatility. Finally, the present study employs innovative wavelet coherence and hybrid non-parametric quantile causality techniques. Wavelet coherence and hybrid non-parametric quantile causality techniques offer significant advantages over conventional methods. They provide an enhanced time-frequency resolution, enabling the analysis of non-stationary and dynamic relationships without requiring data stationarity assumptions. Moreover, these techniques excel at detecting nonlinear dependencies and interactions, which conventional linear methods often overlook. They are robust to outliers and deviations from normality, making them suitable for data with non-standard distributions. Their versatility enables applications across diverse fields, such as economics and finance, accommodating complex datasets and various data structures. Additionally, these techniques facilitate causal inference, enabling the exploration of potential causal relationships in a data-driven manner, which is crucial in understanding systems where causal directionality is of interest. Together, these capabilities position wavelet coherence and non-parametric quantile causality techniques as powerful tools for modern data analysis and research (Balcilar et al. 2017; Hossain et al. 2023).
This work is additionally organized in the following manner: Section 2 encompasses the analysis of the existing literature. Section 3 scrutinises the methodology and data employed. Section 4 presents the result analysis and discussion part, and finally Section 5 provides the concluding remarks.

2. Literature Review

In the preceding section, we discussed numerous studies that measured the influence of COVID-19 on financial and macroeconomic variables. However, to further explore the existing literature, the present section focuses on the extant literature available on the interaction between COVID-19 and exchange rate volatility. In a recent study, Feng et al. (2021) attempted to examine the response of exchange rate volatility to COVID-19 cases and government intervention using the Generalised Method of Moments on a panel dataset of 20 countries. The study suggested that COVID-19 cases initially had a profound impact on exchange rate volatility; however, government intervention measures, such as lockdowns and fiscal stimulus, assisted in maintaining exchange rate stability. In another study, Hung et al. (2022) used a novel DECO-GARCH approach to examine the connectedness between the global currency market and the COVID-19 outbreak. Their study suggested that the global COVID-19 outbreak had a positive correlation with the currency market. The findings depict that a causal association between COVID-19 and exchange rate volatility exists in three forms, i.e., no effect, unidirectional, and bidirectional. Similarly, Chowdhury and Garg (2022) investigated the connectedness between exchange rate volatility and COVID-19 on the panel data of China, Japan, and Korea using bivariate GARCH and VAR models. The study suggested a profound and significant break between COVID-19 and exchange rate volatility, and this effect intensified as the spread increased. The author suggests that during the pandemic, investors should consider switching portfolios to avoid domestic currency devaluation. Likewise, Hoshikawa and Yoshimi (2021) also explored the connectedness between the COVID-19 outbreak, stock market returns, and exchange rate volatility in South Korea using the VAR model. The result indicates that new COVID-19 infections spiked stock market volatility and indirectly decreased the value of the South Korean won. Aggarwal et al. (2021) reported a comparable outcome while exploring the impact of COVID-19 on the stock market and exchange rate volatility of 12 countries. Additionally, the authors also added a novel insight by evaluating the impact of government-induced lockdowns on the stock markets of selected countries and concluded that lockdown has a two-way impact on the market returns. On one hand, it affects the return negatively through the growth forecasts; conversely, on the other hand, it also affects the return positively through the market risk premium. In another breakthrough study, Benzid and Chebbi (2020) attempted to forecast and evaluate the relationship between COVID-19 deaths and exchange rate volatility in the United States of America using the GARCH model. The findings suggest that an increase in the number of COVID-19 cases and deaths in the U.S. has a positive impact on the USD/Yuan, USD/EUR, and USD/Sterling exchange rates. Moreover, the study also assists in forecasting the daily volatility of the above exchange rates with respect to the USD.
In a similar vein, Beckmann and Czudaj (2022) also explored the impact of COVID-19 on a set of 50 currencies using a comprehensive set of survey and event analysis methods. They used two approaches to measure the above relationship. The first approach examines the impact of policy responses to COVID-19 on exchange rate volatility, while the second approach investigates the events of COVID-19-related abnormal returns and exchange rate fluctuations. The study highlights that the excess and abnormal returns in the foreign exchange market are due to macroeconomic vulnerabilities. However, government responses to COVID-19 have had a significant impact on stabilising the foreign exchange market. They also suggested that smaller currencies respond more favourably to policy responses. In another study, Narayan (2022) attempted to understand exchange rate shocks during COVID-19 using a dynamic fitted VAR on hourly data. The observation suggested that the exchange rate shock spillover explains 38% of the error variance during the COVID-19 period. Additionally, the author also proposed that fluctuations in exchange rates account for around 75% of the variability in exchange rates. Furthermore, Iyke (2021) also attempted to quantify the potential for exchange rate returns to be predicted during the COVID-19 pandemic. The author proposes that the GARCH model demonstrates that COVID-19 has a greater ability to predict volatility compared to over-returns for a one-day forecast. Contrary to expectations, COVID-19 had a greater impact on shaping returns rather than volatility within a five-day prediction period. Recently, Yilanci and Pata (2023) investigated the influence of COVID-19 cases on the stock markets, exchange rates, and sovereign bonds of two emerging economies, i.e., India and Brazil. Using wavelet transform coherence (WTC) and continuous wavelet transform (CWT) techniques, the author concluded that COVID-19 has no impact on exchange rates, but COVID-19 cases are a critical predictor of stock prices and the sovereign bond yield movement across different time–frequency dimensions.
In addition to the above studies, several other scholars (please refer to Narayan 2020; Syahri and Robiyanto 2020; Wei et al. 2020; Abedin et al. 2021; Jamal and Bhat 2022) have also attempted to investigate the influence of COVID-19 on exchange rate volatility using different econometric tools and methodologies. However, the majority of these studies focus on developed economies, with only a small number examining the impact of COVID-19 in emerging economies, such as India. Furthermore, most previous studies have covered the timeline of the first wave of COVID-19. However, the present study differs from earlier studies due to its inclusion of a large dataset spanning from 30 December 2020 to 24 January 2022. We emphasise the inclusion of a large sample covering both waves of COVID-19, which will assist in providing a more comprehensive and in-depth view of the relationship between COVID-19 and the Indian exchange rate volatility. Furthermore, to the best of the authors’ knowledge—except for a few studies, such as Banerjee et al. (2020), Aggarwal et al. (2021), and Klose (2023), who explored the link between COVID-19, stock market returns, exchange rate volatility, and lockdown stringency measures—none of the previous studies have explored the impact of lockdowns on exchange rate volatility using the lockdown stringency index, thereby contributing to the existing literature on the relationship between COVID-19 and exchange rate volatility. Moreover, as previously discussed in the introduction section, the present study uses a variety of novel methodologies to examine the aforementioned relationship, thereby facilitating a robust understanding of it. Therefore, we proceed with our empirical estimation, considering the existing research gaps in the literature and adding to the growing body of knowledge on the intricate relationship between the pandemic, lockdown, and exchange rate volatility.
Alongside the aforementioned review and research gap, we can also refer to the following rationale extracted from the existing literature to establish the theoretical framework for exploring the complex interactions between COVID-19, lockdowns, and exchange rate volatility. Recent literature highlights the multifaceted relationship between COVID-19, lockdowns, and exchange rate volatility from various theoretical perspectives. While analysing the influence of lockdowns on macroeconomic dimensions, De et al. (2022) advocated that lockdown-induced disruptions in economic activity may heighten uncertainty regarding future economic prospects and policies, thereby influencing investor sentiment and impacting exchange rate movements. Moreover, Tang et al. (2024) stated that perceptions of increased economic and financial risk during lockdowns and pandemics can elevate investor risk aversion, potentially triggering capital flows that may further exacerbate exchange rate volatility. In another piece of literature, Cheung et al. (2021) highlighted that government responses to the pandemic, such as fiscal stimulus measures and monetary policy adjustments, also have an important effect on determining market expectations regarding economic recovery and policy directions, thereby influencing exchange rate dynamics. Disruptions in global supply chains due to lockdown measures further complicate the scenario, affecting trade flows and commodity prices, particularly impacting exchange rates for export-dependent economies. Additionally, Balcilar et al. (2021) highlighted that behavioural factors, such as investor biases and sentiment changes during uncertain times, can amplify exchange rate fluctuations as market participants react to evolving pandemic-related news and conditions. Therefore, based on this interconnected theoretical and conceptual argument regarding the influence of the pandemic and lockdown on the exchange rate and economic dynamics, as well as recognising the time-varying nature of these impacts across different phases of the pandemic, we attempt to empirically analyse how these dynamics affect exchange rate fluctuations in the context of the Indian economy.

3. Data and Empirical Methodology

3.1. Data

This study intends to capture the impact of COVID-19 and lockdown stringency on the Indian exchange rate; thus, to confirm the above association, this study is designed with three core variables, i.e., COVID-19 cases, lockdown stringency, and exchange rate volatility. The inclusion of each variable is grounded in economic theory and validated by empirical support. We have taken the daily data of COVID-19 cases (CVD) from the CEIC data source as a proxy to measure the pandemic intensity. The theoretical justification for incorporating the aforementioned variable lies in uncertainty theory and market sentiment models, which explain that pandemic shocks lead to economic and financial uncertainty, creating increased volatility in exchange rates. The existing literature indicates that surges in COVID-19 cases lead to risk aversion and capital outflows, which may exert downward pressure on emerging market currencies (Syahri and Robiyanto 2020). To measure lockdown stringency (SRI), we have referred to the CEID lockdown stringency index. The aforementioned index explains the severity of government-imposed restrictions as a response to the COVID-19 pandemic. The literature asserts that strict lockdowns have the potential to escalate macroeconomic uncertainty, while also serving as a signal for government control and containment measures. Taking references from the behavioural finance and balance of payments models, we can claim that stricter lockdowns, particularly those implemented in a phased manner, may reduce exchange rate volatility or vice versa. Finally, exchange rate volatility (XRV) is calculated from the exchange rate through the GARCH (1,1) approach using the FRED data stream. This model is suitable for modelling time-varying volatility in financial time series. Volatility in the exchange rate captures the sensitivity of the Indian currency to domestic and global shocks. High volatility may be detrimental to trade and capital flows, which underscores the potential to comprehend its macroeconomic drivers during a pandemic. The inclusion and modelling of the aforementioned variables permit us to empirically explore the causal and dynamic interactions between pandemic-related shocks and financial market volatility.
We have extracted the daily data of all the variables from 30 December 2020 to 24 January 2022.1 We restricted our sample period to December 2020 to 24 January 2022, which corresponds to the second and third wave of the COVID-19 pandemic in India. This period was selected based on the following rationale. First, high-frequency and comparable data on lockdown stringency, exchange rate fluctuations, and macrofinancial indicators became systematically available starting in December 2020. During the first wave, all lockdown measures were implemented abruptly, which created heightened uncertainty and resulted in data that was not adequately available to provide reliable estimates. Second, this timeframe provides a more organised approach to policy responses and highlights pronounced financial market volatility, creating a clearer environment to study the influence of lockdown stringency on exchange rate volatility. Third, concentrating on this specific timeframe enables us to delineate effects with greater investor awareness and policy maturity, making it more suitable for evaluating the behavioural and macroeconomic mechanisms outlined in our theoretical arguments.

3.2. Empirical Methodology

We utilised the wavelet coherence approach developed by Grossmann and Morlet (1984) and the hybrid non-parametric quantile causality approach developed by Balcilar et al. (2017) to examine the effects of COVID-19 and lockdown stringency on the volatility of the Indian exchange rate. Furthermore, we have conducted a comprehensive robustness assessment by employing the Troster–Granger causality in quantiles and the Breitung–Candelon Spectral Causality test. In addition, we have conducted tests using the Augmented Dickey–Fuller (ADF) and Phillips–Perron (PP) unit root tests to confirm the linearity and nonlinearity aspects of the series. We have also employed the BDS nonlinearity test. The wavelet coherence methodology, initially introduced by Grossmann and Morlet (1984), allows for the analysis of the relationship between two time series in both the frequency and time domains. Unlike traditional time series modelling, this method captures the co-movement between the two series, therefore, aiding in the analysis of the cause-and-effect relationship between COVID-19, the strictness of lockdown measures, and fluctuations in exchange rates in India, both in the short and long term. Furthermore, this strategy is centred on a bivariate framework, which allows for the possibility of scaled localisation. Therefore, employing the Torrence and Compo (1998) methodology, the following equation describes the cross-wavelet transform of x(t) and y(t).
W n x y u , s = W n x u , s W n y u , s
In the given Equation (1), * depicts the complex conjugate,   u denotes the location, s represents scale, and W n y u , s ,   W n x u , s is the cross-wavelet transform (CWT). The CWT identifies regions with significant power and displays the local co-variance of two time series data at each scale.
In addition, we have utilised wavelet coherence approaches, taking into consideration this study’s goals. The equation presented below represents the squared form of the wavelet coherence:
R 2 u , s = | S ( s 1 W x y u , s ) | 2 S ( s 1 | W x u , s | 2 ) S ( s 1 | W y u , s | 2 )
The smoothing operator is represented by S, while the wavelet squared coherence is denoted by R 2 u , s . The R 2 u , s value ranges from 0 to 1, with higher values indicating stronger co-movements. Several colours show the association between two time series. For example, when the wavelet coherence approaches 0, it indicates a lack of co-movement and is represented by the colour blue. Similarly, when the value is close to one, it indicates a correlation and is represented by a black line and the colour red. Torrence and Compo (1998) argued that R 2 u , s does not accurately represent the positive and negative correlations between two time series. They suggested that indicators of deferrals should be considered while analysing the fluctuations of these two time series. Equation (3) represents the wavelet coherence phase differential.
Φ x y u , s = t a n 1 P { S s 1 W x y u , s } Q { S s 1 W x y u , s }
P and Q in Equation (3) represent the real and imaginary components of the smoothed cross-wavelet transform in the given equation. The graphical presentation of the wavelet coherence displays the time on the horizontal axis and the frequency on the vertical axis, respectively. Furthermore, the graphical representation of the wavelet coherence also emphasises the following relationship: In a cold area, there is no association between the series. The arrows indicate the lead and lag phases. An arrow going left indicates a negative association, whereas arrows pointing right indicate a positive association. Furthermore, the arrows indicating right–down, left–up, and down represent the initial time series variable that influences the second variable. In contrast, the upward, downward–left, and upward–right arrows indicate that the second time series variable is the source of the first one. The following section explains the hybrid non-parametric quantile causality technique.

3.3. Hybrid Non-Parametric Quantile Causality Approach

As already mentioned, in addition to the wavelet coherence, a non-parametric quantile causality approach by Balcilar et al. (2017) was also used to test the above relationship. This method builds upon the background work of Nishiyama et al. (2011) and Jeong et al. (2012), utilising the k-th order non-parametric causality framework introduced by Nishiyama et al. (2011) and the non-parametric quantile framework developed by Jeong et al. (2012). This technique is superior to other causality approaches for the following reasons. First, it helps in identifying nonlinear causality. Second, it helps determine the general nonlinear dynamic dependencies and provide reliable estimates for extreme values. The yt represents the dependent variable, which is COVID-19 cases and the lockdown stringency index, whereas Xt explains the outcome variable, which is the exchange rate volatility. In the present study, we follow the work of Jeong et al. (2012) in demonstrating that the quantile-based causality of Xt does not cause yt in the θ quantile with respect to the lag vector of ( y t 1 , … ..   y t p , X t 1 , … ..   X t p , ), if
Q θ = ( y t y t 1 ,   . .   y t p , X t 1 ,   . .   X t p ) = Q θ ( y t y t 1 ,   . .   y t p ) ,
Xt probably leads to yt in the θ quantile with respect to ( y t 1 , … ..   y t p , X t 1 , … ..   X t p , ), if
Q θ = ( y t y t 1 ,   . .   y t p , X t 1 ,   . .   X t p ) Q θ ( y t y t 1 ,   . .   y t p ) ,
Here in Equation (4), Q θ = ( y t . ) depicts the θ t h quantile of y t , which is dependent on t, and the quantile varies within the range of 0 or 1, i.e., 0 < θ < 1.
In order to show the causality in the quantile test in a compressed manner, we have referred to the following vectors:
y t 1 ( y t 1 ,   . .   y t p , ) , X t 1 ( X t 1 , … .. X t p , ) , Z t = ( X t , y t ) are explained. We have also explained the condition distribution, which is F. y t Z t 1 ( y t Z t 1 ), and F y t y t 1 ( y t y t 1 ). These distribution functions explain the distribution function y t condition on the vectors Z t 1 and y t 1 , respectively. Furthermore, based on Equations (1) and (2) we have tested the following hypothesis for the quantile causality test
H 0 = P { F y t Z t 1 { Q θ ( y t 1 ) Z t 1 } = θ } = 1 ,
H 1 = P { F y t Z t 1 { Q θ ( y t 1 ) Z t 1 } = θ } < 1 ,
Moreover, to explain the usefulness of causality in the quantile test, Jeong et al. (2012) used the distance measure depicted by J = { ε t E ( ε t Z t 1 ) F z ( Z t 1 ) } , where ε t represent error terms, and Z t 1 is the marginal density function. Based on the error term, the distance measure as proposed by Jeong et al. (2012) can be explained as follows:
J = E [ { F y t 1 Z t 1 Q θ y t 1 Z t 1 θ } 2   F z ( Z t 1 ) ] ,
It is worth mentioning that in Equation (3), J 0 and the equality J = 0 holds if, and only if, H0 in Equation (8) is true, whereas J > 0 holds under H1 in Equation (7). Furthermore, below Equation (9), describe the feasible kernel-based sample analogue of J.
J T ^ = 1 T T 1 h 2 p Σ T = P + 1 T Σ S P + 1 T s t   K ( Z t 1 Z s 1 h )   ε t ^ ε s ^ ,
In the above equation, k is the kernel function, h depicts the bandwidth, p denotes the lag order, t is the sample size, and ε t ^ is the unknown regression error and can be estimated by the equation below.
ε t ^ =   1 { y t   Q ^ θ ( y t 1 ) } θ
In Equation (10), Q ^ θ ( y t 1 ) shows the estimate of the θ t h conditional quantile of y t given as y t 1 . Q ^ θ ( y t 1 ) can also be calculated using the non-parametric kernel method, as given below:
Q ^ θ y t 1 =   F ^ y t y t 1 1 ( θ y t 1 )
Here in the above Equation (11), F ^ y t y t 1 1 ( y t y t 1 ) is the Nadarya kernel estimator, estimated by
F ^ y t y t 1 1 ( y t y t 1 ) = [ Σ S = P + 1 T s t   L ( y t 1 y s 1 h )   1 ( y s y t ) ] / [ Σ S = P + 1 T s t   L ( y t 1 y s 1 h ) ]
Here, in Equation (12), L(.) represents the kernel functions, and h represents the bandwidth. In addition, we also want to estimate the causality running either from the lockdown stringency and COVID-19 cases to the exchange rate volatility or from the exchange rate volatility to COVID-19 cases and lockdown stringency. Previous studies have revealed that volatility transmission may exist even when there is no causality. Therefore, to resolve this problem, we have also employed the causality test at the second moment (Wang et al. 2022). As the second-moment test involves complications, we have referred to the Granger quantile causality of Nishiyama et al. (2011). The following equation is used to test the causality for y t .
y t = g ( y t 1 ) +   σ ( X t 1 ) ε t
In the above equation ε t is the white noise process, whereas σ . and g (.) depict the unknown functions and accomplish the stationary properties of y t . Yet this illustration does not permit linear and nonlinear causality from X t 1 to y t 1 , but it only shows the predictive power of X t 1 to y t 2 , and σ . is a general nonlinear function. Therefore, we can infer that Equation (10) only shows the square for X t 1 and does not necessarily enter the nonlinear function. Thus, we formulate Equation (13) into Equations (14) and (15) to ascertain the null and alternative hypotheses of the causality in variance.
H 0 =   P { F y t 2 Z t 1 { Q θ ( y t 1 ) Z t 1 }   =   θ } = 1 ,
H 1 =   P { F y t 2 Z t 1 { Q θ ( y t 1 ) Z t 1 }   =   θ } < 1 ,
To obtain the desired test statistics in Equation (10), y t in Equations (9)–(12) is replaced by y t 2 . Furthermore, to avoid the issue of causality in the first moment (mean), we have employed the following model to understand causality at higher moments.
y t = g ( X t 1 , y t 1 ) +   ε t
The causality at the higher order can be further defined as
H 0 =   P { F y t k Z t 1 { Q θ ( y t 1 ) Z t 1 }   =   θ } = 1 , for   K = 1 ,   2 ,   . .   K ,
H 1 =   P { F y t k Z t 1 { Q θ ( y t 1 ) Z t 1 }   =   θ } < 1 , for   K = 1 ,   2 ,   . .   K ,
In a nutshell, we try to confirm that xt Granger causes yt in the θ quantile up to the K-th moment by using Equation (14) to develop a test statistic of Equation (9) for each k. Therefore, as the statistics are jointly correlated it is cumbersome to join a different K. Therefore, to overcome the above issue we have also employed the sequential testing of Nishiyama et al. (2011) with modifications. Initially, we tested the non-parametric granger causality at the first moment; in this, rejection at the first moment does not confirm any causality at the second moment; however, it confirms the presence of strong causality at the variance. Therefore, we perform the test at K = 2 because it permits the confirmation of the existence of causality at variance and at invariance and mean. Previous studies show that there are three selection criteria for testing causality using quantiles, i.e., the kernel type for K (.) and L(.), lag order (p), and bandwidth (h) in Equations (6)–(9). We have restricted p to 1 using SIC as VAR, comprising COVID-19 deaths, lockdown stringency, and the exchange rate. We have chosen SIC over other lag selection criteria because it overcomes the over-parameterization issues. Finally, we have also employed least squares cross-validation to choose the bandwidth and the Gaussian-type kernels.
We have computed the volatility of the exchange rate via the standard GARCH model introduced by Bollerslev (1987). This model is capable of measuring complex conditional variance. The model is estimated as follows:
h t = ω 2 + i = 1 p α i ε t 1 2 + j = 1 q β j h t 1 + k = 1 r γ j h t 1 ε t 1 2
where h t is the conditional variance at time t ;   α i is lagged squared residuals; and β j is the lagged conditional variance. γ is known as the leverage or asymmetry term (refer to Appendix A).

4. Results and Discussions

Before proceeding with the empirical analysis of the model framework, we first examined the stochastic properties of the dependent and independent variables reported in Table 1. The descriptive statistics depict the mean, median, skewness, and kurtosis values of all the variables. The kurtosis value reveals a fat-tailed distribution, whereas the skewness value indicates that the data is highly skewed, which provides sufficient evidence that the series is not normally distributed. The Jarque–Bera test also strengthens the above outcome and further encourages us to proceed with the nonlinear estimation.
It is not mandatory to determine the stationarity properties of the variables while employing the wavelet coherence approach (WTC). However, we have determined the stationarity characteristics of the variables, as previous studies conclude that time series estimation entails the condition of data stationarity. Therefore, considering the importance of data stationarity, we have also employed the Augmented Dicky–Fuller (ADF) and the Phillip–Perron (PP) unit root test. The results of both unit root tests confirm that all the series are stationary at I(1) (see Table 2 and Table 3).
The estimates of the ADF and PP tests show that the data of the lockdown index (SRI) was non-stationary with the constant and trend. However, after taking the first difference, all three series reveal satisfactory results; i.e., the series are stationary at I(1).
Moving further, after confirming the presence of stationarity, we have also examined the pairwise linear association between the variables (please refer to Figure 1’s correlation matrix). Figure 1 indicates that the largest absolute association is between COVID-19 and the exchange rate volatility (p = 0.34), followed by COVID-19 and lockdown stringency (0.34), and the lockdown stringency and exchange rate volatility is (0.22), thus, explaining and validating the existence of the high correlation between the lockdown stringency, exchange rate volatility, and COVID-19 in India.
In the subsequent step, before proceeding with the wavelet coherence approach and the non-parametric quantile-in-causality approach, we also estimated the nonlinear association between COVID-19, lockdown stringency, and exchange rate volatility using the BDS test developed by Broock et al. (1996). The outcome of the BDS test, summarised in Table 4, reveals the rejection of the null hypothesis and strongly supports the existence of the nonlinear association between COVID-19, lockdown stringency, and exchange rate volatility in India. These outcomes warrant the utilisation of wavelet coherence and hybrid non-parametric quantile causality approaches. Wavelet coherence and hybrid non-parametric quantile causality approaches are effective in addressing the challenges posed by nonlinearity in data, as evidenced in the literature. Wavelet coherence stands out for its ability to localise both time and frequency components, allowing researchers to uncover intricate, time-varying relationships between variables that conventional linear methods often miss. On the other hand, hybrid non-parametric quantile causality techniques excel in capturing nonlinear dependencies without the constraints of parametric assumptions, thus accommodating real-world datasets characterised by outliers and non-normal distributions. Comparative studies underscore their superiority over traditional linear methods, highlighting their capacity to provide deeper insights into the nuanced dynamics of systems where nonlinear relationships play a pivotal role (Grinsted et al. 2004). In essence, these approaches offer robust tools for modern data analysis across various disciplines, enabling a more comprehensive understanding of complex systems.
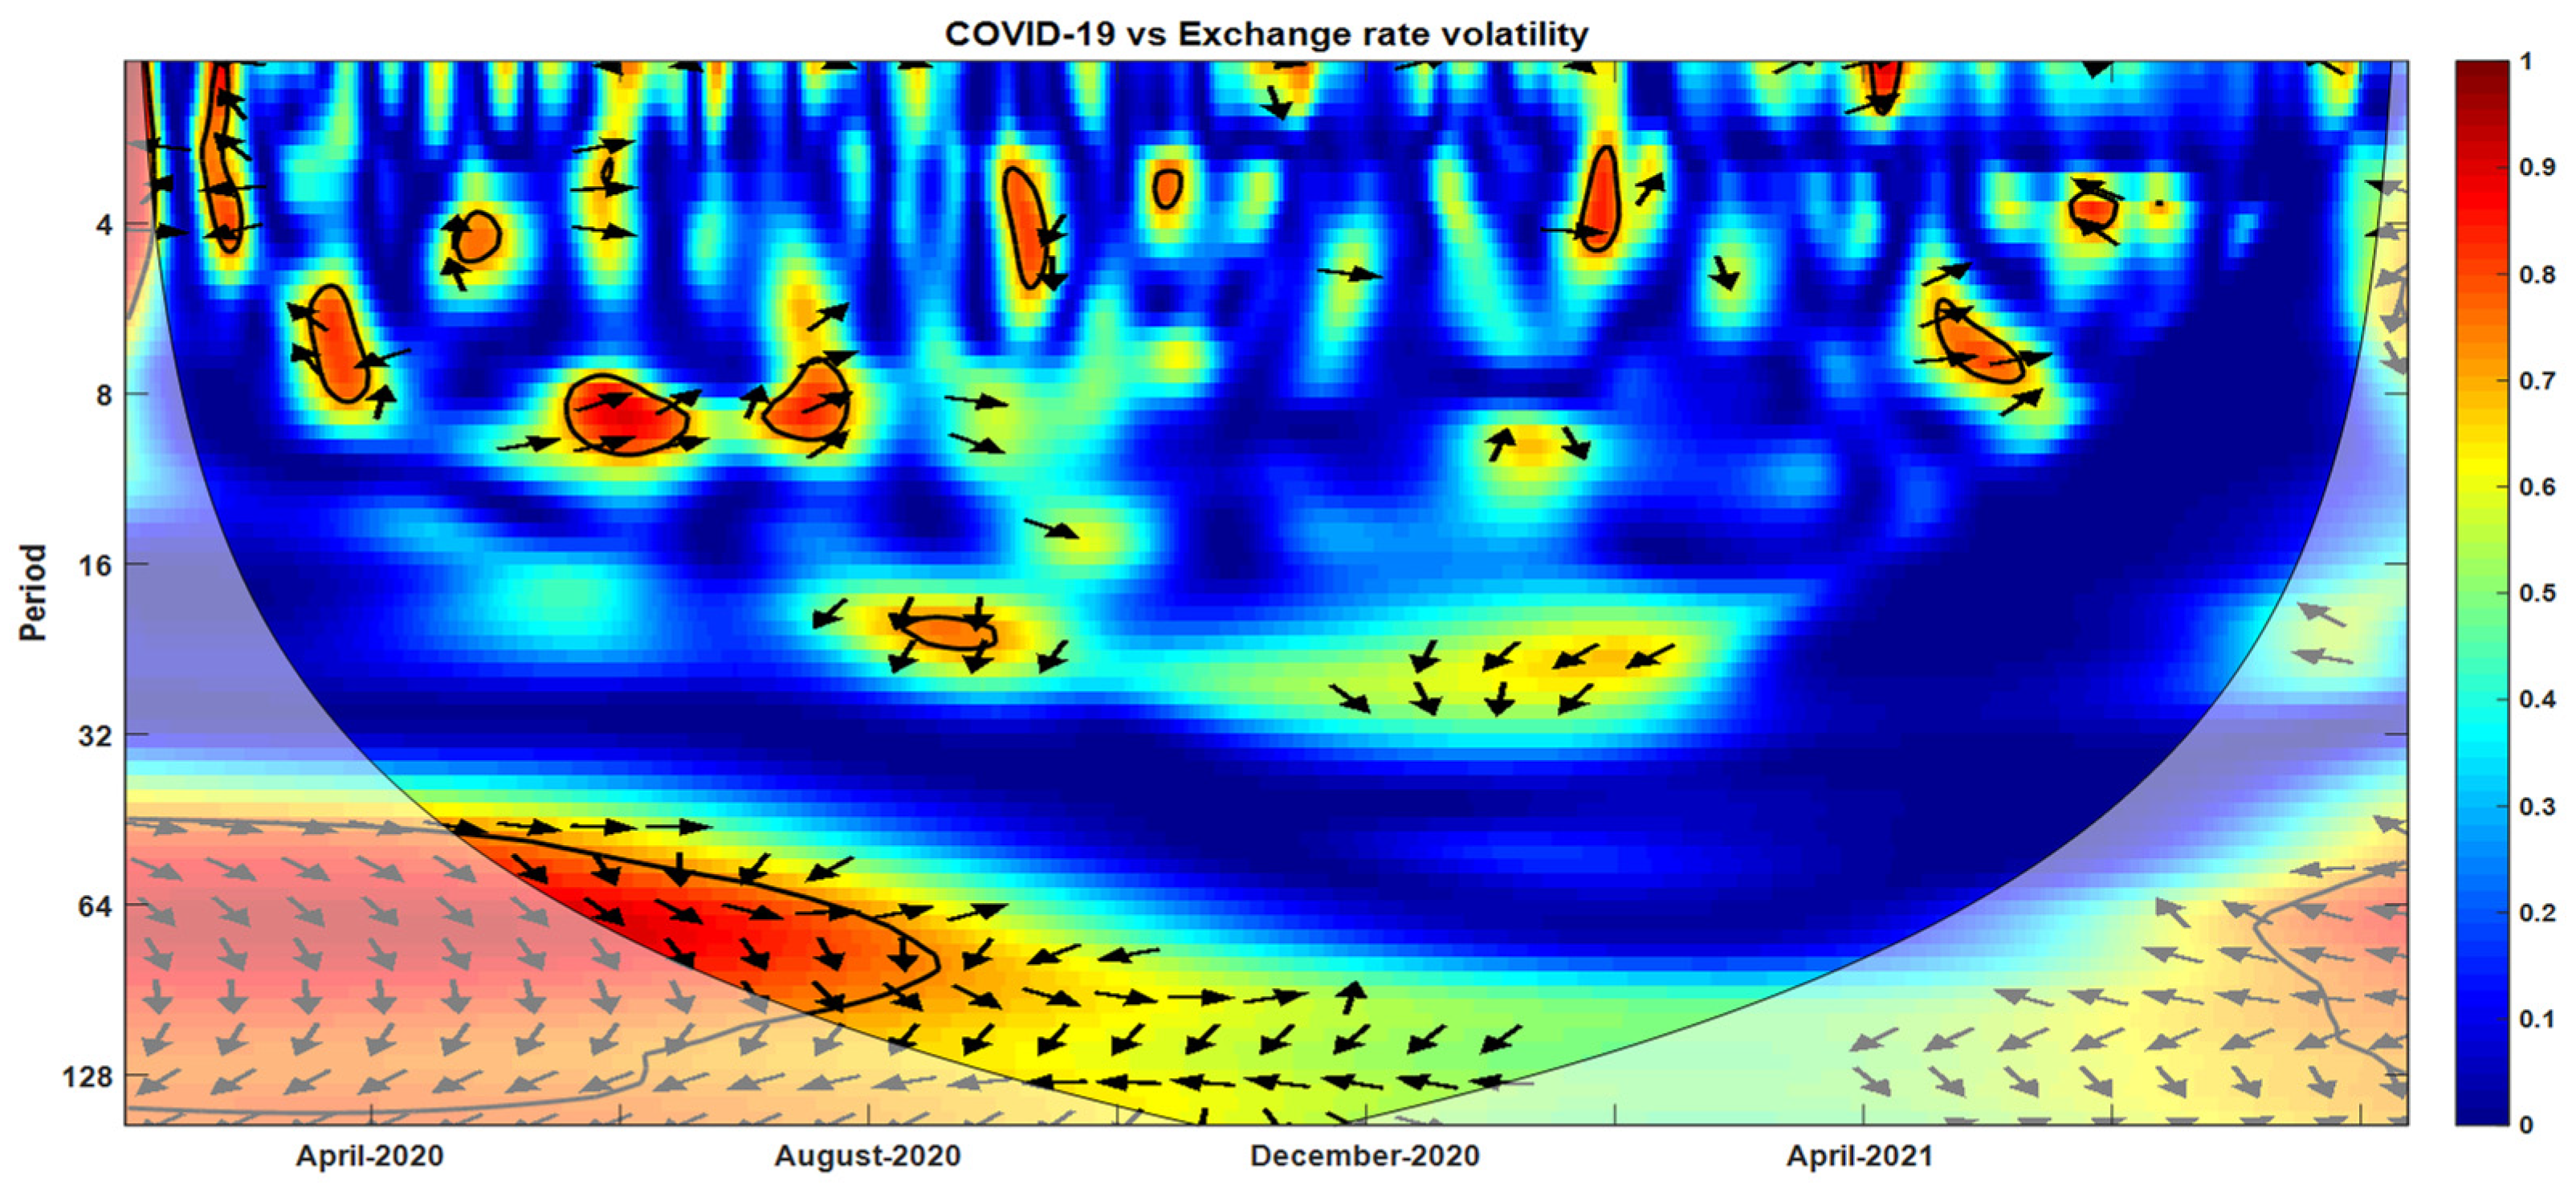
After confirming the presence of nonlinearity, we proceed with the estimation of the wavelet coherence and the hybrid non-parametric quantile causality approach by Balcilar. The result of the wavelet coherence between exchange rate volatility and COVID-19, presented in Figure 2, concludes that, overall, COVID-19 increases the exchange rate volatility in India, as the majority of the arrows are in phase. Our findings are consistent with those of Sharif et al. (2020), who found that an increase in the number of reported cases led to increased volatility in the US financial market. The result is also in parallel with a study conducted by Feng et al. (2021) for a sample of 20 countries. An elevated degree of economic policy uncertainty, according to Obstfeld and Rogoff (1996), drives investors to shift their anticipations for policies and the economy, resulting in exchange rate volatility. COVID-19 increased exchange rate volatility on the 4th and 10th dates of 2020. Moreover, COVID-19 also propelled exchange rate volatility on 4 February and 8 June 2021. These outcomes underscore that, much like other macroeconomic variables, the exchange rate in India also exhibited fluctuations. However, on 3 January 2020, COVID-19 exerted a negative influence on the exchange rate volatility, as the straight arrows in the black contour are moving towards the left. One plausible reason for this outcome may be the initial methods adopted by the government to curtail the COVID-19 pandemic.
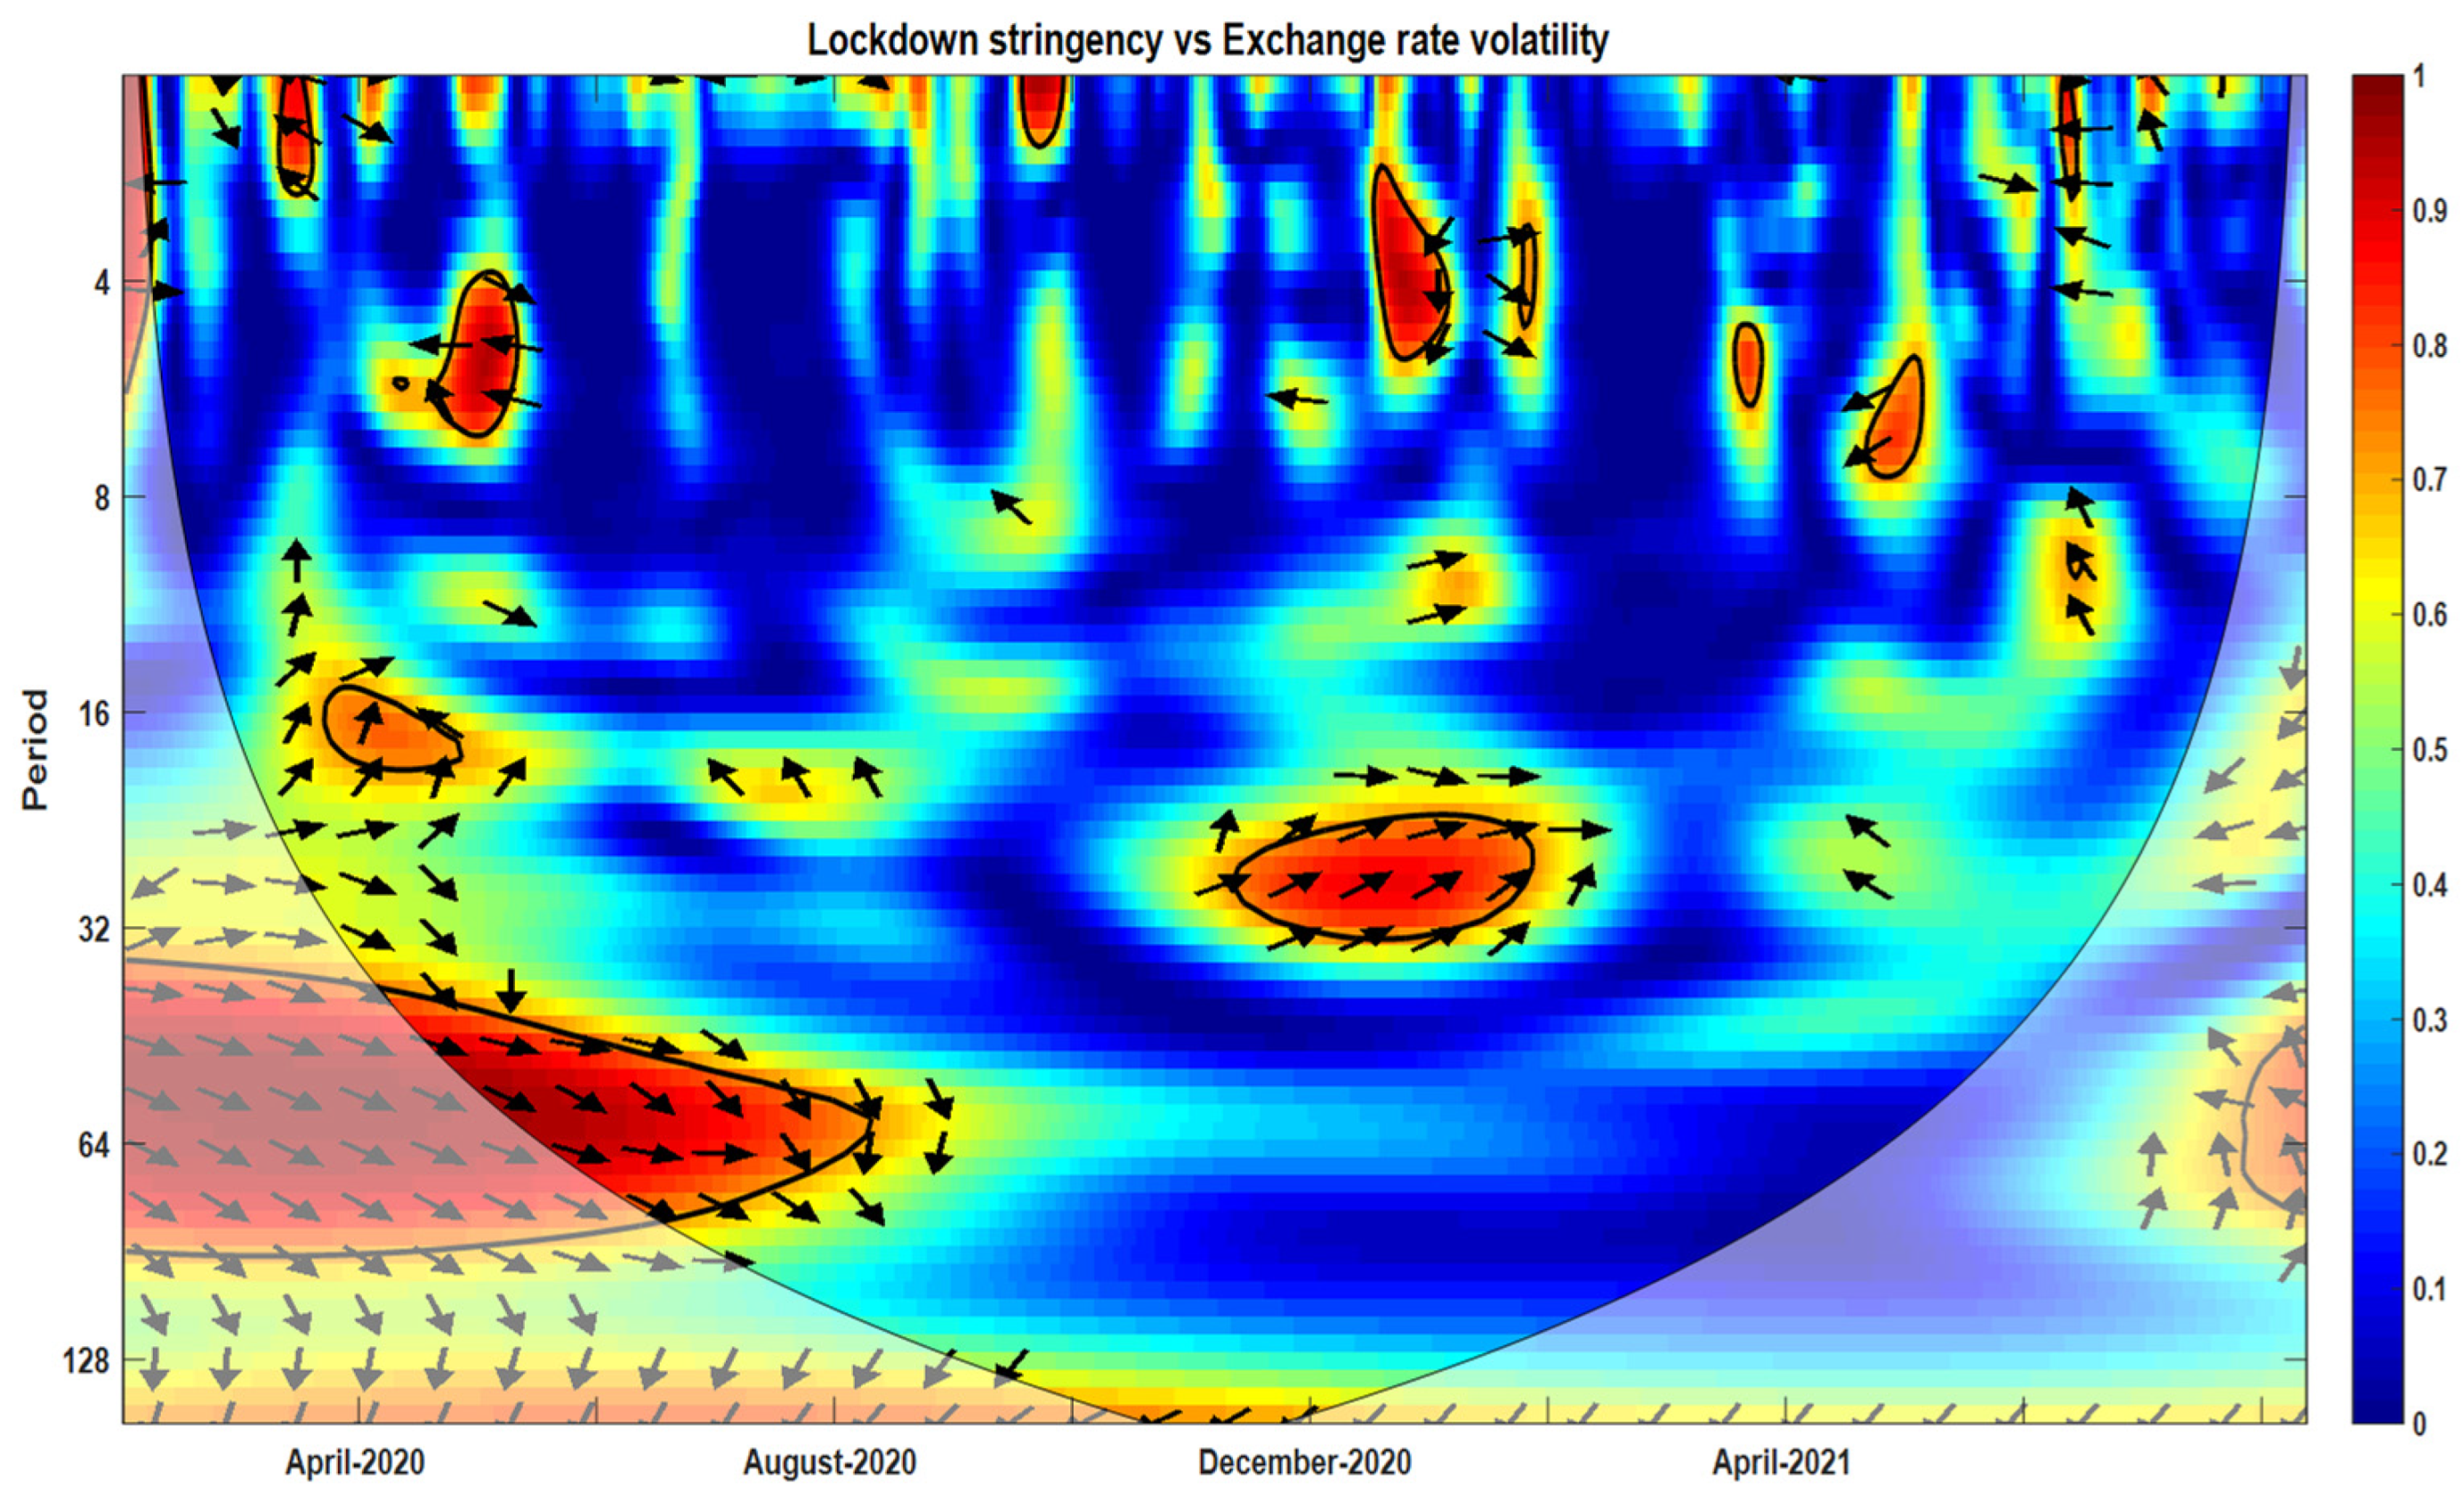
In addition, the wavelet coherence result of the lockdown stringency and exchange rate volatility presented in Figure 3 shows that lockdown stringency decreases exchange rate volatility in India in 5–7-day windows of May 2020 and 1 to 3-day windows in December 2021. The arrows pointing upward in the black contour indicate that lockdown stringency leads and exchange rate volatility follows. These outcomes suggest that lockdown stringency was one of the key factors contributing to exchange rate volatility during the pandemic period.
The outcome of the wavelet coherence analysis between COVID-19, lockdown stringency, and exchange rate volatility reveals that the initial outbreak of COVID-19 exerted a positive influence on the exchange rate, resulting in high volatility. The plausible reason for such high volatility is the uncertainty in the economic environment. During the initial outbreak, investors and policymakers were uncertain about the magnitude of the outbreak and unaware of how the global economic environment would react to the fear and pessimism created by COVID-19. In addition, the number of fatalities and devastation caused by COVID-19 in Wuhan, China, also created a negative influence on the investors’ perceptions. These cumulative effects of uncertainty and fear created a pessimistic environment for business and trade in India and globally, thus, resulting in high exchange rate volatility. The result of the wavelet coherence between lockdown stringency and exchange rate volatility suggests that lockdowns have resulted in stabilising the exchange rate. The findings are similar to those of other research, such as Ge et al. (2022), which found that non-pharmaceutical interventions, including inner mobility limitations and public education campaigns, may successfully alleviate the uncertainty and panic associated with COVID-19. On average, any physical distance adjustment can lower the total number of COVID-19 incidents by 13 percent (Islam et al. 2020). As a result, the enactment of robust government evaluations transmits an authoritative message to market participants and investors that the government is capable of preventing the spread of the epidemic, thus improving investor confidence, stabilising the financial market, and reducing currency volatility (Huang and Zheng 2020). This outcome exists because lockdowns helped restrict the spread and curb business uncertainty. Although the initial lockdowns severely affected trade and business, resulting in exchange rate fluctuations, the exchange rate later witnessed substantial stability due to a reduction in cases and partial lockdowns. The aforementioned results can also be explained through several theoretical arguments. From the perspective of uncertainty theory, the implementation of strict lockdowns during the initial phases amplifies economic uncertainty, resulting in heightened investor anxiety and increased volatility. However, as the pandemic advances and policy responses were implemented, the stringency of lockdowns began to reduce uncertainty, thereby making markets more stable and less volatile. In addition, as per the balance of payments theory, initially stringent lockdowns can restrict imports and exports. India’s significant dependence on imported goods and services suggests that implementing certain restrictions could potentially enhance the current account balance in the short term. This may result in alleviating pressure on the domestic currency and mitigating volatility. However, over prolonged durations, such limitations may also diminish export revenues, particularly from SMEs, exerting depreciative pressure on the currency. This phenomenon aligns with the principles of behavioural finance theory, which posits that investor sentiment and overreaction can significantly influence market volatility in times of crisis. Speculative trading and heightened volatility may have resulted from the interpretation of early lockdowns as signals of deeper economic trouble. Over time, as stringent policies became normalised or perceived as effective risk management tools, they may have helped reduce panic and speculative behaviour, hence lowering volatility. Finally, the outcomes from Salisu et al. (2022), showing lockdown-induced disruption in the SME activity critical to India’s foreign earnings, also explain the exchange rate pressure in early phases. Nevertheless, it is plausible that targeted government interventions and stimulus measures have mitigated these effects in subsequent phases, which may account for the reduced volatility observed after 2021.
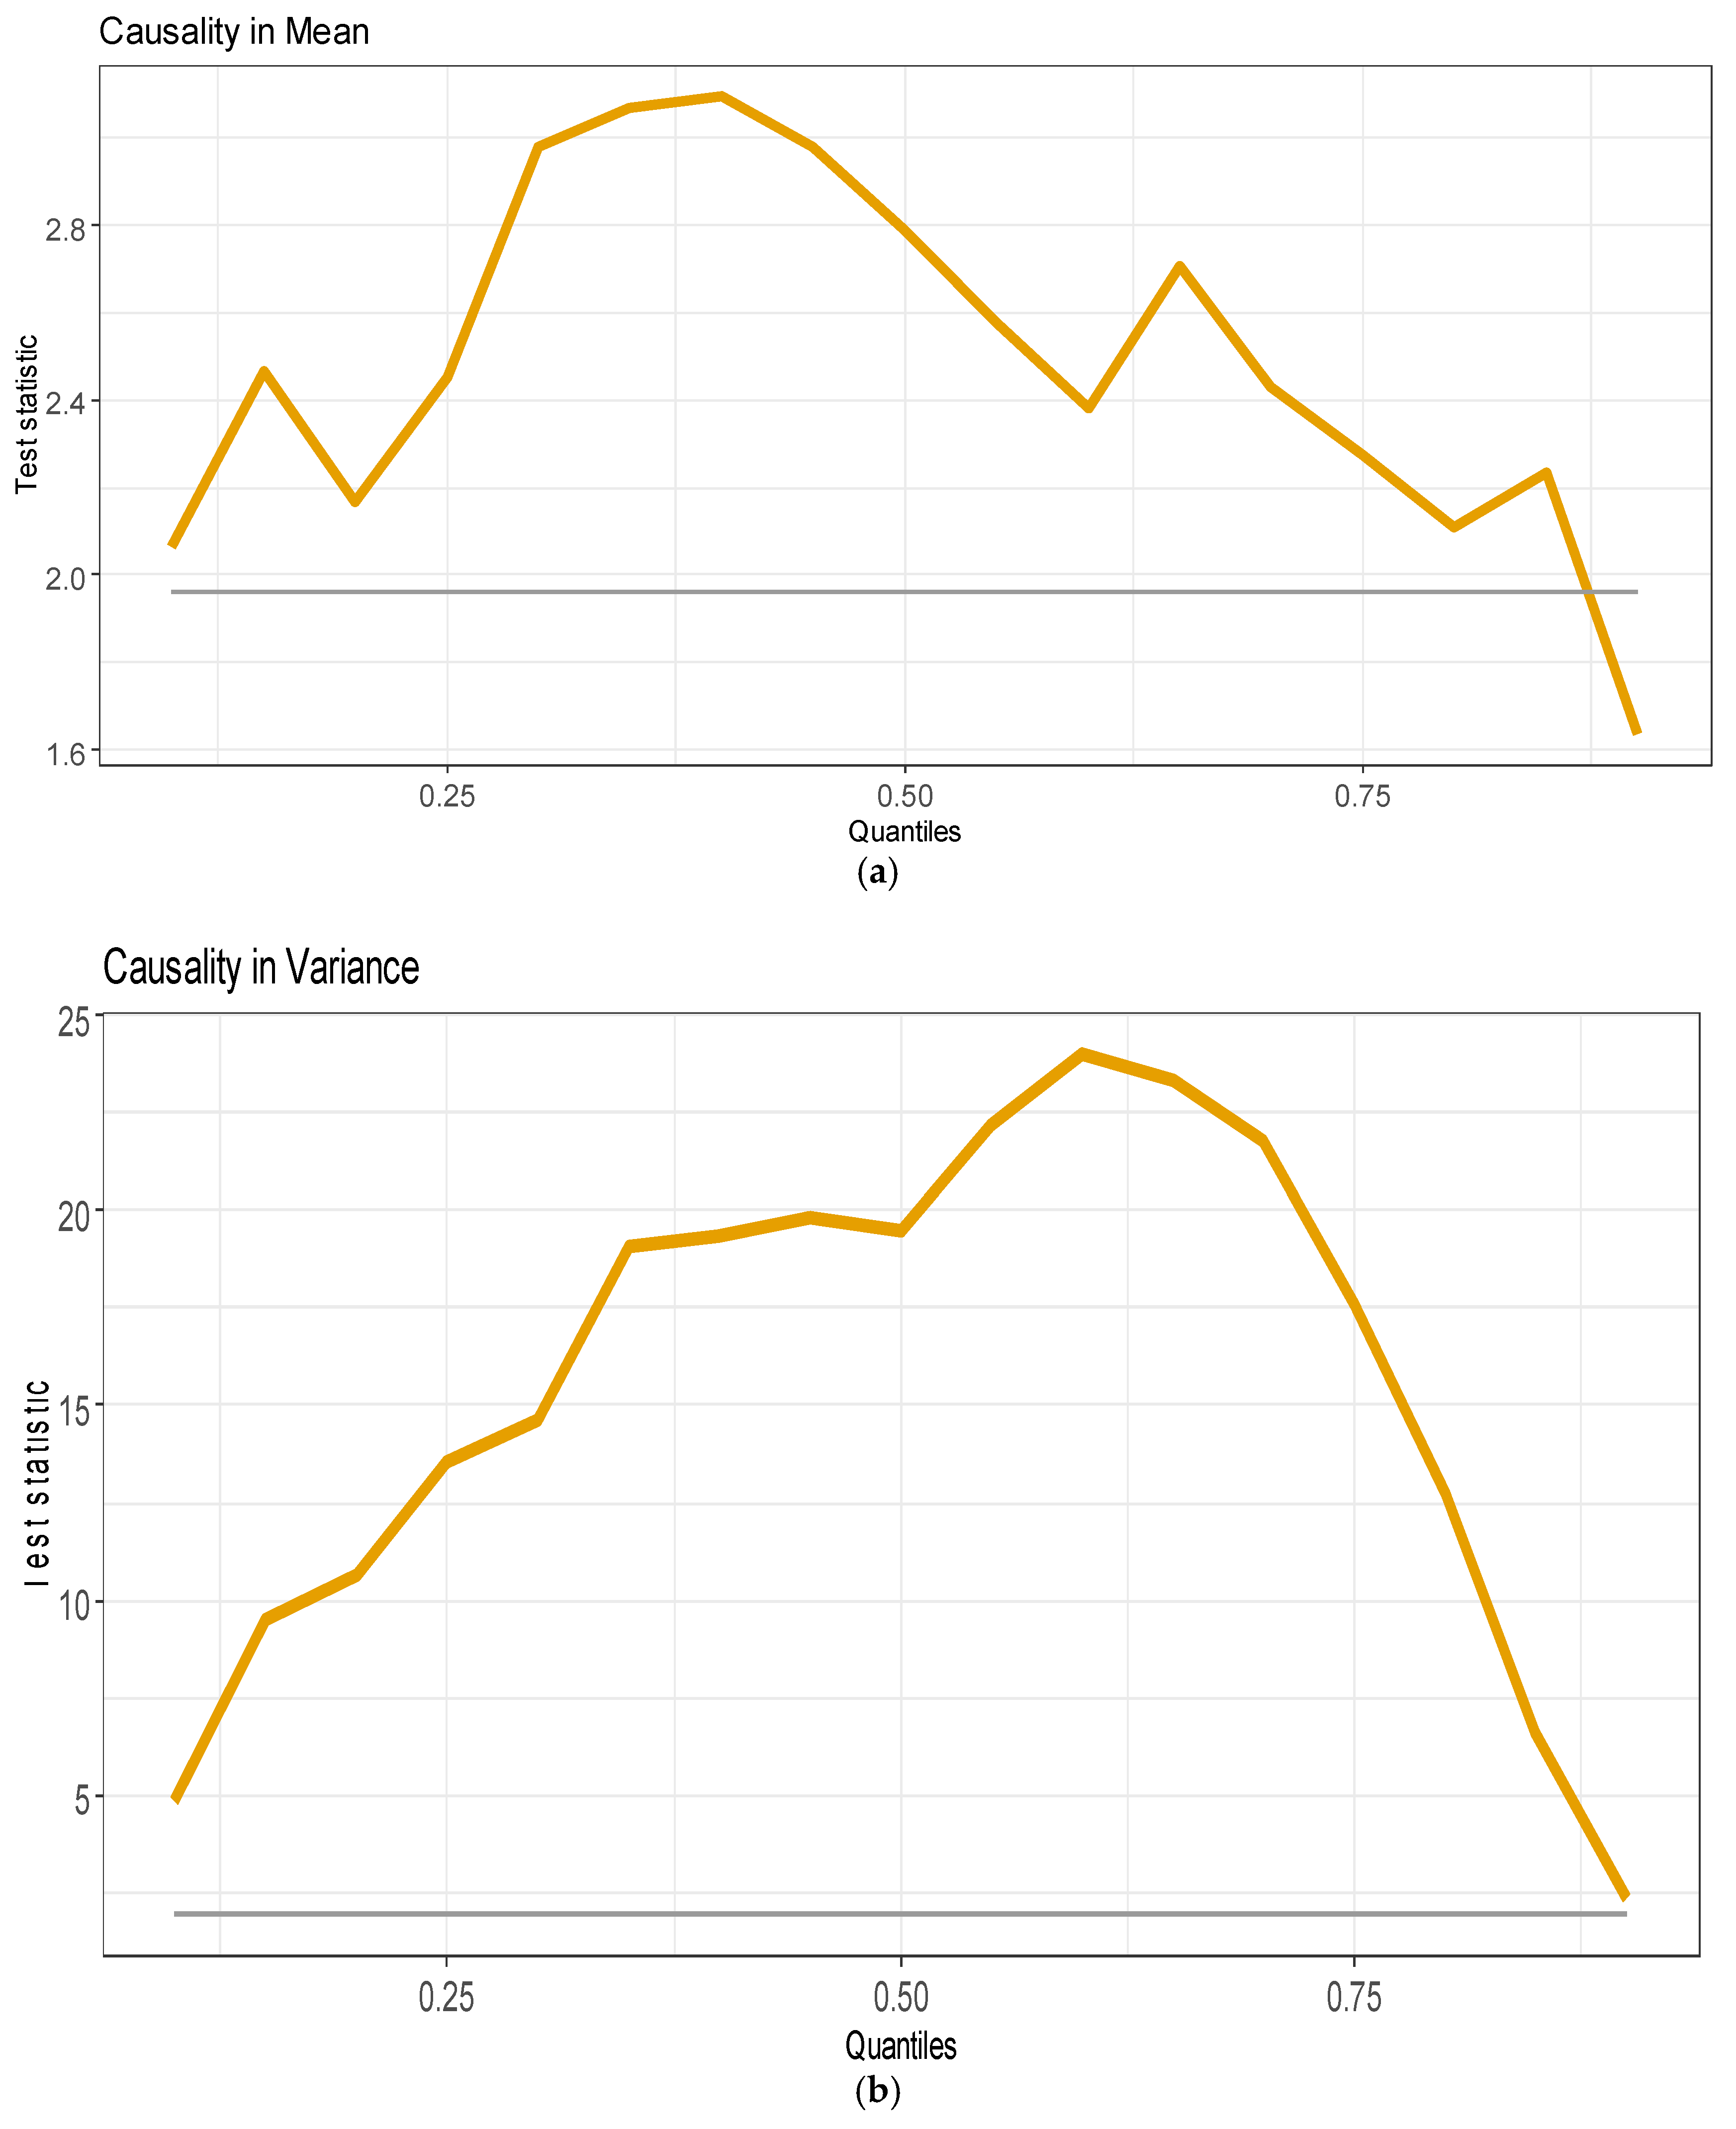
Besides the wavelet coherence causality approach, we have also examined the non-parametric quantile causality by using the hybrid non-parametric quantile causality approach by Balcilar. This approach not only determines causality in mean but also delineates the causal associations among variables in variance across various quantiles. The findings of the causality in mean and variance between COVID-19 and exchange rate volatility are presented in Figure 4a,b. The results show that, at most quantiles except the lower ends of the distribution, the null hypothesis is rejected, implying that COVID-19 has predictive power for exchange rate volatility. Although our empirical estimate indicates that COVID-19 and lockdown stringency cause fluctuations in exchange rates across most quantiles, it is worth noting that this influence becomes less significant at extreme upper quantiles. This behaviour underscores that in times of extreme volatility, other macroeconomic indicators or geopolitical factors take precedence over the influence of COVID-19. The analysis indicates that in periods of heightened volatility, market dynamics are primarily influenced by compound shocks, including speculative trading, central bank interventions, and shifts in risk sentiment, which mitigate the direct effects of COVID-19. Moreover, the existing literature indicates that during high uncertainty, investor behaviour becomes highly unpredictable, reducing the likelihood of detecting systematic causality using non-parametric tools. The observed asymmetry across quantiles illustrates the nonlinear and regime-dependent characteristics of exchange rates. This finding aligns with behavioural finance theories, which suggest that markets exhibit disproportionate behaviour during extreme crisis situations. Consequently, the diminished significance observed at elevated quantiles does not negate the predictive relationship; instead, it elucidates that factors associated with COVID-19 exhibited greater explanatory strength during periods of low to moderate volatility in contrast to extreme quantiles.
Likewise, the outcome of the hybrid non-parametric quantile causality between lockdown stringency and exchange rate volatility, presented in Figure 5a,b, also reveals a similar result by rejecting the null hypothesis that lockdown stringency does not Granger cause exchange rate volatility at different quantiles. This means that the lockdown stringency also has predictive power for exchange rate volatility in India. The results of the non-parametric quantile causality approach by Balcilar also support the empirical findings of the wavelet coherence approach.
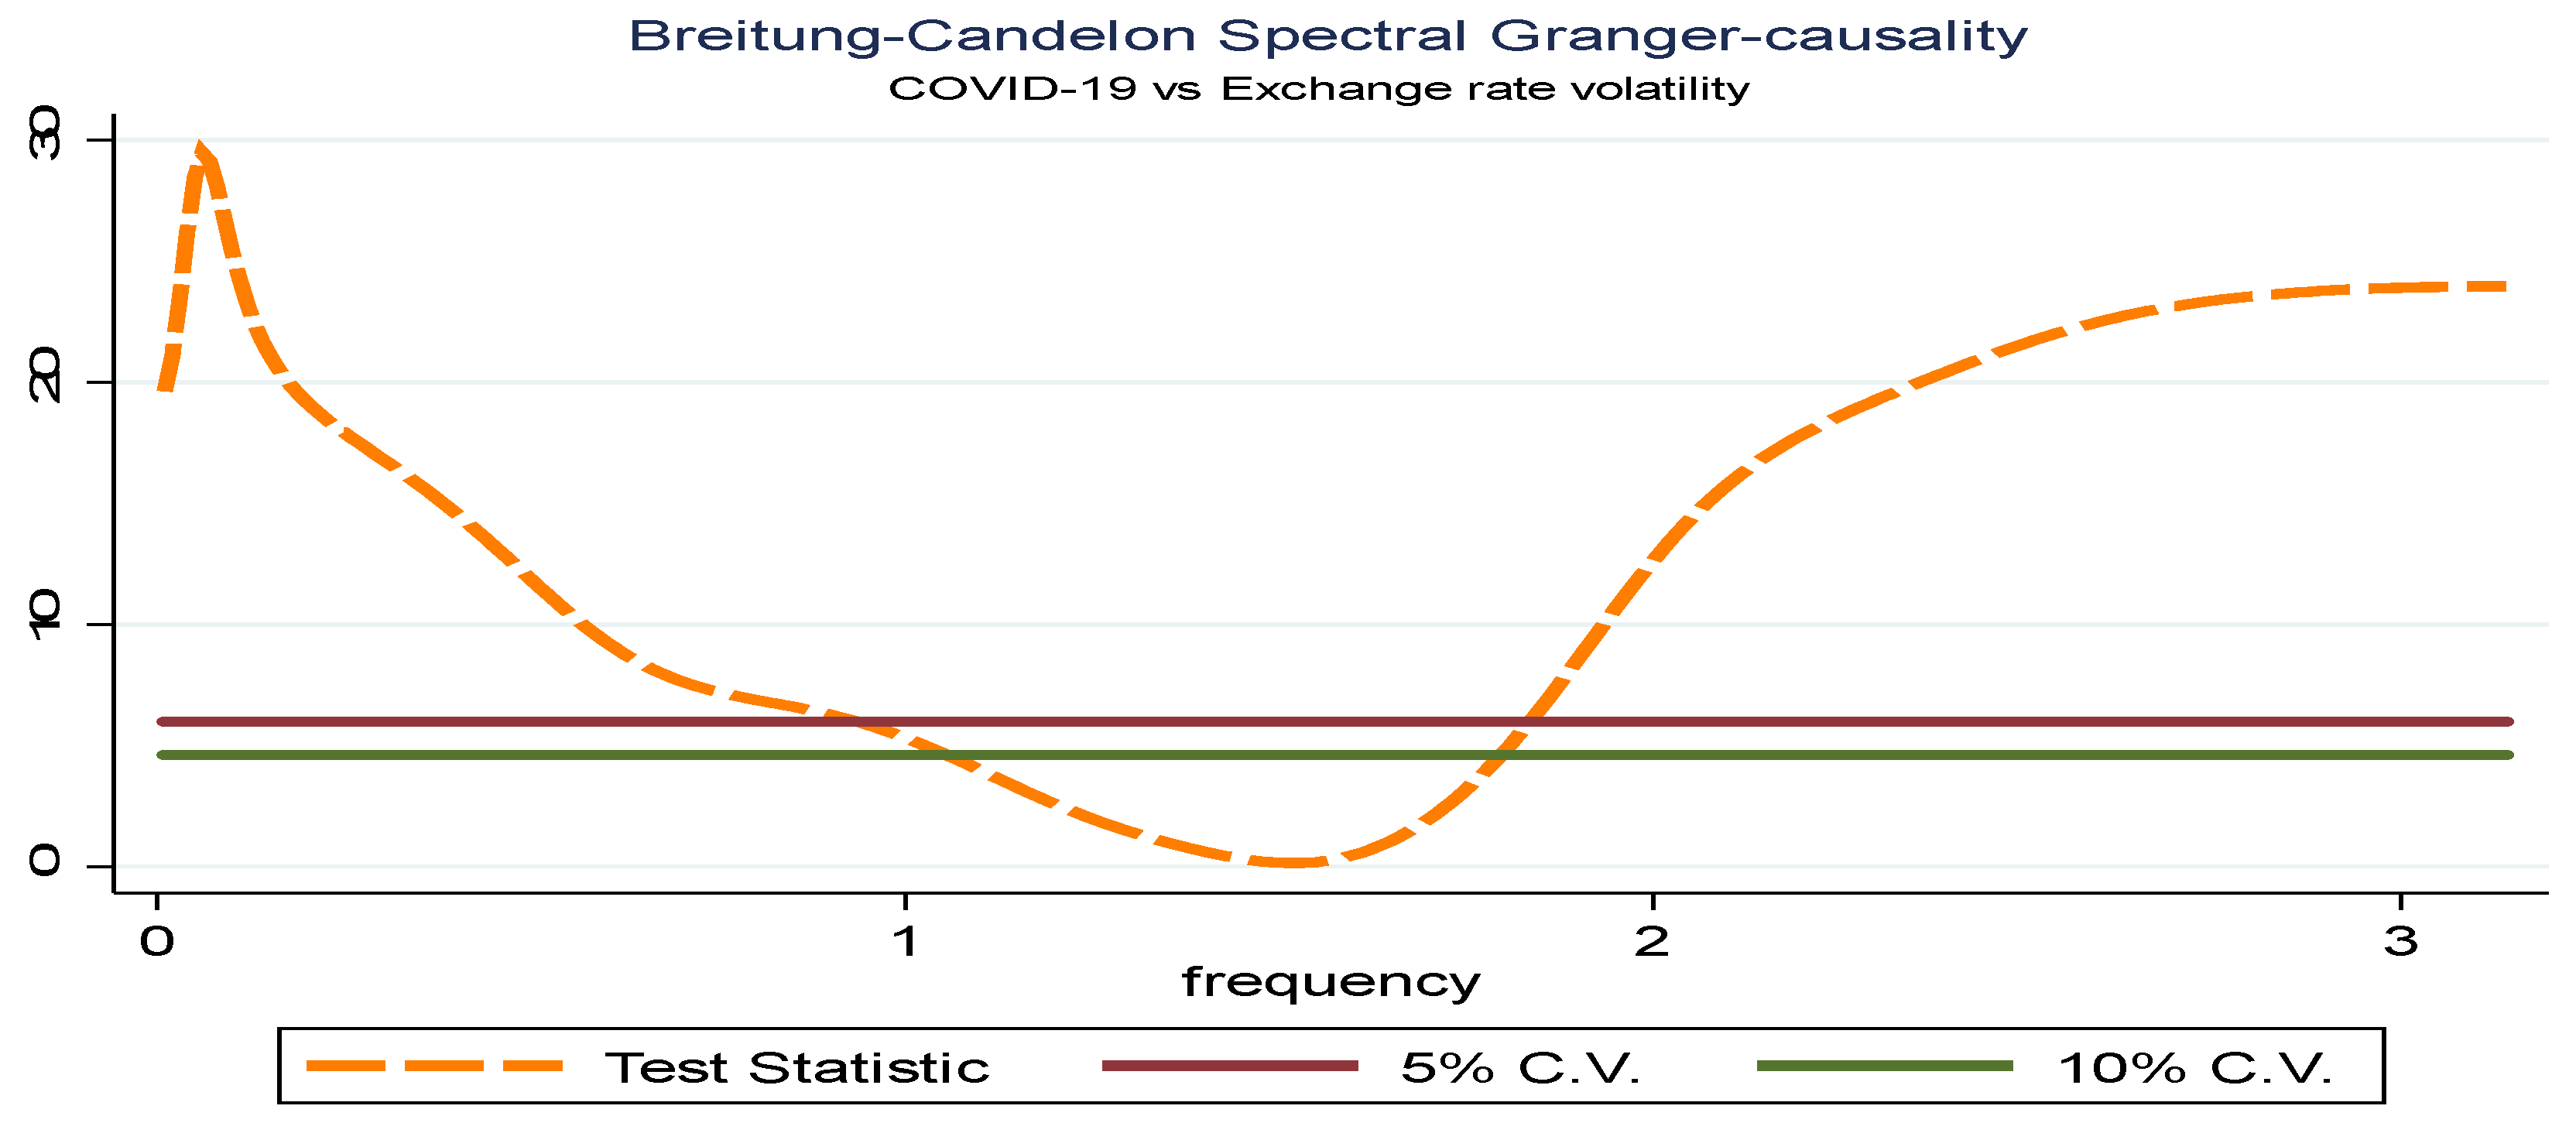
Furthermore, for the robustness analysis, we have re-examined the outcome of the wavelet coherence and hybrid non-parametric quantile causality approach by employing two robustness tests: the Troster–Granger causality in quantiles and Breitung–Candelon Spectral Causality. The outcomes of the Troster–Granger causality test and the findings of the Breitung–Candelon Spectral Causality test are displayed in Table 5 and Figure 6 and Figure 7. The Troster–Granger causality analysis reveals the impact of COVID-19 and lockdown stringency on the currency rate volatility in India, taking into account various quantiles of the distribution. Granger causality is observed at the upper tail of the distribution (0.05, 0.10, 0.15), indicating a significant causative relationship between exchange rate volatility, COVID-19, and lockdown stringency at a one percent level of significance. Additionally, the outcomes remain stable when using various parameters of the quantile autoregressive model. Hence, significant positive or negative swings in COVID-19 cases and the strictness of lockdown measures result in substantial variances in the volatility of exchange rates. Nevertheless, it is worth mentioning that at the highest quantiles (0.95), the causality becomes statistically insignificant. This explains that during periods of significant market volatility, the impacts of COVID-19 and stringent lockdown measures might be overshadowed by other market dynamics or fluctuations, such as global shocks or abrupt policy shifts. This revalidates the value of quantile-based approaches, as they indicate that pandemic-related variables exerted a more significant influence during normal to moderately volatile periods. The strong estimates of the Troster–Granger causality also support the approaches above.
  • Robustness Analysis 1: Troster–Granger Causality in Quantiles
Finally, we have determined the causal relationship through the utilisation of the Breitung–Candelon Spectral Granger Causality test. The straight lines in Figure 6 and Figure 7 represent the significance thresholds at 5% and 10%. The dashed curve displays the results of the statistical test at various frequencies. Both tests’ results reject the null hypothesis of no causal relationship between COVID-19, lockdown stringency, and exchange rate volatility. Furthermore, it establishes a robust correlation between COVID-19, the strictness of lockdown measures, and the volatility of currency rates. These statistics suggest that the COVID-19 cases and lockdown measures have greatly influenced the exchange rate volatility in India. This aligns with the result above.
  • Robustness Analysis 2: Breitung–Candelon Spectral Causality

5. Conclusions

Over the years, financial crises and business uncertainty have increased the risk of exchange rate volatility. These exchange rate fluctuations not only hinder trade balances but also lead to lower economic growth and development. Recently, the outbreak of COVID-19 has drawn the attention of researchers and policymakers to examine the fluctuations in financial markets. A battery of literature is available on the modelling and forecasting of financial market volatility. However, studies on exchange rate volatility remain scarce. Therefore, this paper aims to address this gap and enhance the existing literature by assessing the influence of COVID-19 and lockdown stringency on the volatility of the exchange rate risk in India. As already discussed, the present study offers the following key contributions to the existing literature. Primarily, it is the first study to assess the impact of COVID-19 and lockdown stringency on exchange rate volatility in India, covering both waves of the pandemic. This extended timeline permits a more in-depth analysis of the dynamics between COVID-19, lockdown stringency, and Indian exchange rate volatility. Thus, exploring the above relationship provides an in-depth understanding of the impact of restrictive measures on exchange rate volatility, which will help policymakers and the government to comprehend the effects of such measures on exchange rate volatility. Second, this study employs innovative wavelet coherence and hybrid non-parametric quantile causality techniques. Wavelet coherence and hybrid non-parametric quantile causality techniques offer significant advantages over conventional methods. They provide an enhanced time-frequency resolution, excel at detecting nonlinear dependencies and interactions, and are robust to outliers and deviations from normality. Additionally, these techniques facilitate causal inference, enabling the exploration of potential causal relationships in a data-driven manner, which is crucial in understanding systems where causal directionality is of interest. In addition, as a robustness test, we have also employed Troster–Granger causality in the Quantiles and Breitung–Candelon Spectral Causality approaches for estimating the causal relationship.
Initially, we have examined the stochastic properties of the explanatory and outcome variables, which confirm that the data is not normally distributed and hence substantiate the application of the nonlinear approach. Second, we have confirmed the stationarity properties of the series by using ADF and PP unit root tests, which also provide satisfactory results. Next, we have verified the nonlinearity by using the BDS nonlinear test. Finally, after confirming all the preconditions, we have examined the above relationship by using wavelet coherence and the hybrid non-parametric quantile causality approach by Balcilar. Our empirical analysis concludes that COVID-19 has a positive influence on exchange rate volatility. During the initial outbreak of the COVID-19 pandemic, the exchange rate volatility was higher; however, it became more stable at a later stage. The result also concludes that lockdown stringency has a negative impact on exchange rate volatility, which means that the government’s measures to curb the spread of the COVID-19 pandemic have resulted in subsidising exchange rate volatility. The outcome of the hybrid non-parametric quantile causality analysis concludes that there is a causal relationship between COVID-19, lockdown stringency, and exchange rate volatility, indicating that COVID-19 and lockdown stringency can be used as predictive factors for the exchange rate volatility at different quantiles of the distribution. Finally, the outcome of the robustness test (Troster–Granger causality in quantiles and Breitung–Candelon Spectral Causality approach) also validates our empirical outcome.
This study’s empirical findings offer a set of pertinent policy suggestions that are grounded in thorough research. To begin, the analysis reveals a significant relationship between COVID-19 dynamics, lockdown severity, and the resulting exchange rate volatility in the context of India. As a result, policymakers must adopt proactive actions to mitigate these temporary instabilities. This may include the implementation of prudent fiscal stimulus measures, as well as the promotion of seamless information symmetry, to create a more predictable environment. During instances of financial market downturns, authorities should take a proactive stance by implementing a set of well-considered policy measures aimed at attracting foreign capital inflows. Such an infusion of external investment has the potential to enhance exchange rate stability significantly. This method includes the clear articulation of a complete recovery plan, supplemented by the unrestricted release of market-relevant information. Authorities can successfully entice potential investors and nurture new market confidence by methodically detailing the recovery process. Furthermore, this study emphasises the practical value of taking a nuanced approach to implementing complete lockdown measures. Rather than acting abruptly, regulatory agencies should take a more inclusive approach, engaging the ideas and guidance of industry professionals before imposing such restrictive measures. This consultation technique ensures that the consequences of such measures are thoroughly reviewed and that the nuances of various industries are adequately considered. Furthermore, rather than being imposed as a surprise, the systematic application of lockdown measures allows corporate organisations to analyse and plan for alternate operational modes.
The importance of maintaining exchange rate stability, particularly in the context of emerging economies, cannot be overstated. The findings that COVID-19 increases exchange rate volatility while lockdown stringency decreases it highlight critical considerations across economic, policy, and social dimensions. Economically, heightened exchange rate volatility poses significant challenges for businesses that rely on international trade, affecting their competitiveness and profitability. Conversely, lower volatility during lockdowns can stabilise economic conditions, boost investor confidence, and support recovery efforts. From a policy perspective, governments may need to adopt targeted interventions to manage exchange rate fluctuations effectively and balance economic stability with stringent public health measures. Socially, stable exchange rates can mitigate adverse effects on employment and consumer prices, influencing public perception and compliance with government policies. Globally, coordinated policy responses are essential to reduce spillover effects and enhance resilience amid ongoing economic uncertainties. Overall, understanding these dynamics is crucial for crafting integrated strategies that promote both economic recovery and public health during and beyond the COVID-19 pandemic. To that end, regulatory agencies are being encouraged to develop a comprehensive plan aimed at fostering renewed corporate confidence in the aftermath of economic turmoil. Regulators can effectively navigate the contours of uncertainty by developing well-calibrated plans, thereby creating a favourable climate for long-term economic growth. In light of the empirical findings from this study, it is imperative that policy recommendations are formulated with greater specificity to address the issue of exchange rate volatility. The wavelet coherence analysis indicates that shocks related to COVID-19 exert a positive influence on exchange rate volatility. This indicates the necessity for improved real-time monitoring systems for exchange rates in the context of public health emergencies. The observed dampening effect of lockdown stringency on volatility underscores the importance of maintaining clarity and predictability in the implementation of containment measures. Policymakers can use this information to better align fiscal and monetary announcements with the timelines of public health policies. This would contribute to a reduction in volatility within currency markets. Furthermore, the empirical validation derived from the hybrid non-parametric quantile causality method enhances the formulation of targeted strategies for managing capital flows, especially in extreme quantiles where the effects are more pronounced. These policy insights remain grounded in the exchange rate domain, offering practical guidance rooted in data-driven evidence. The prudent adoption of these diverse proposals is a crucial requirement aimed at bolstering the robustness of the exchange rate and the broader economic environment.
This study is limited to examining the impact of COVID-19 and the lockdown intensity on exchange rate volatility inside India. As a result, it is prudent to use caution when applying these results to areas or nations with varying economic structures, policy orientations, and pandemic histories. While the findings are advantageous in the Indian context, their application to other contexts requires careful examination. It is critical to recognise that each region has distinct elements that may impact the interaction between pandemic-induced disruptions, policy responses, and exchange rate dynamics. As a result, before generalising this study’s findings, the delicate interaction of variables unique to each environment should be adequately assessed. Another major limitation is the exclusion of the first wave of the pandemic due to data constraints. Subsequent studies could expand the timeframe by including early 2020, which would permit a thorough comparison across all pandemic phases and improve the generalisability of the outcome. Moreover, future studies can also conduct a comprehensive comparative study that encompasses multiple nations or regions. This method provides a thorough examination of how COVID-19 and various degrees of lockdown stringency affect exchange rate volatility. Researchers can identify both commonalities and distinctive variances across different economic environments by adopting a cross-national approach, offering a holistic understanding of the issue. Finally, digging into sector-specific concerns is an essential avenue for future research. This specialised analysis aims to elucidate the complex implications of COVID-19 and lockdown measures on various companies or sectors of the economy. This technique provides insights into the various impacts by exposing the ramifications within distinct economic areas and their translation into changes in exchange rates. Tailoring plans based on these findings can better fit with each sector’s distinct characteristics and offer effective policy development and strategic decision-making.

Author Contributions

Conceptualization, A.A.S. and S.G.; methodology, A.A.S., A.U. and M.A.K.; software, S.G.; validation, S.G.; formal analysis, A.A.S.; investigation, S.G.; resources, S.G.; data curation, A.A.S.; writing—original draft preparation, A.A.S., A.U., M.A.K. and K.S.; writing—review and editing, S.G.; visualisation, A.U.; supervision, S.G. All authors have read and agreed to the published version of the manuscript.

Funding

This research received no external funding.

Data Availability Statement

The raw data supporting the conclusions of this article will be made available by the authors on request.

Conflicts of Interest

The authors declare no conflicts of interest.

Appendix A

Table A1. Exchange rate volatility GARCH (1,1) estimations.
VariableCoefficientStd. Errorz-StatisticProb.
C0.00020.01660.01340.9893
XR (−1)0.00070.05390.01400.9888
Variance Equation
C0.01570.00582.72840.0064
RESID (−1)20.09590.02593.70810.0002
GARCH (−1)0.77880.068711.33620.0000
R-squared−0.0007Mean dependent var0.0095
Adjusted R-squared−0.0029S.D. dependent var0.3567
S.E. of regression0.3573Akaike info criterion0.7120
Sum squared resid58.2031Schwarz criterion0.7570
Log likelihood−158.0378Hannan–Quinn criter.0.7297
Durbin–Watson stat2.0825
Risks 13 00182 i001
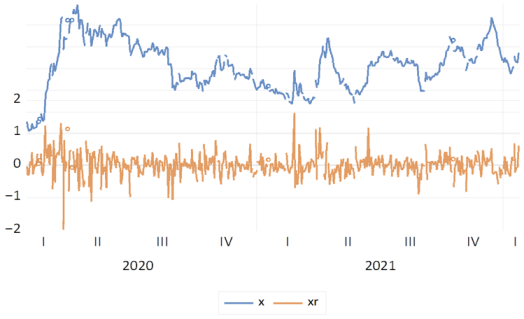
Graph of Exchange Rate and Exchange Rate Returns
Risks 13 00182 i002

Note

1
We have used mean imputation for some missing values in the data by taking insights from the work of Maheswari et al. (2019).

References

  1. Abedin, Mohammad Zoynul, Mahmudul Hasan Moon, M. Kabir Hassan, and Petr Hajek. 2021. Deep learning-based exchange rate prediction during the COVID-19 pandemic. Annals of Operations Research 345: 1335–86. [Google Scholar] [CrossRef]
  2. Aggarwal, Shobhit, Samarpan Nawn, and Amish Dugar. 2021. What caused global stock market meltdown during the COVID pandemic–Lockdown stringency or investor panic? Finance Research Letters 38: 101827. [Google Scholar] [CrossRef]
  3. Amar, Amine Ben, Fateh Belaid, Adel Ben Youssef, Benjamin Chiao, and Khaled Guesmi. 2021. The unprecedented reaction of equity and commodity markets to COVID-19. Finance Research Letters 38: 101853. [Google Scholar] [CrossRef]
  4. Atri, Hanen, Saoussen Kouki, and Mohamed imen Gallali. 2021. The impact of COVID-19 news, panic and media coverage on the oil and gold prices: An ARDL approach. Resources Policy 72: 102061. [Google Scholar] [CrossRef]
  5. Balcilar, Mehmet, David Roubaud, Gizem Uzuner, and Mark E. Wohar. 2021. Housing sector and economic policy uncertainty: A GMM panel VAR approach. International Review of Economics & Finance 76: 114–26. [Google Scholar] [CrossRef]
  6. Balcilar, Mehmet, Rangan Gupta, Christian Pierdzioch, and Mark E. Wohar. 2017. Do terror attacks affect the dollar-pound exchange rate? A nonparametric causality-in-quantiles analysis. The North American Journal of Economics and Finance 41: 44–56. [Google Scholar] [CrossRef]
  7. Banerjee, Indrajit, Atul Kumar, and Rupam Bhattacharyya. 2020. Examining the Effect of COVID-19 on Foreign Exchange Rate and Stock Market--An Applied Insight into the Variable Effects of Lockdown on Indian Economy. arXiv arXiv:2006.14499. [Google Scholar]
  8. Beckmann, Joscha, and Robert Czudaj. 2022. Price-Exchange Rate Link?—The Role. In Applications in Energy Finance: The Energy Sector, Economic Activity, Financial Markets and the Environment. New York: Springer, p. 27. [Google Scholar]
  9. Benzid, Lamia, and Kaouther Chebbi. 2020. The impact of COVID-19 on exchange rate volatility: Evidence through GARCH model. SSRN Electronic Journal. [Google Scholar] [CrossRef]
  10. Bollerslev, Tim. 1987. A conditionally heteroskedastic time series model for speculative prices and rates of return. The Review of Economics and Statistics 69: 542–547. [Google Scholar] [CrossRef]
  11. Broock, W. A., José Alexandre Scheinkman, W. Davis Dechert, and Blake LeBaron. 1996. A test for independence based on the correlation dimension. Econometric Reviews 15: 197–235. [Google Scholar] [CrossRef]
  12. Celık, Sibel. 2012. The more contagion effect on emerging markets: The evidence of DCC-GARCH model. Economic Modelling 29: 1946–59. [Google Scholar] [CrossRef]
  13. Cheung, Calista, Jerome Lyons, Bethany Madsen, Sarah Miller, and Saarah Sheikh. 2021. The Bank of Canada COVID-19 Stringency Index: Measuring Policy Response Across Provinces. No. 2021-1. Ottawa: Bank of Canada. [Google Scholar]
  14. Chowdhury, Kushal Banik, and Bhavesh Garg. 2022. Has COVID-19 intensified the oil price–exchange rate nexus? Economic Analysis and Policy 76: 280–98. [Google Scholar] [CrossRef]
  15. De, Indranil, Soumyadip Chattopadhyay, Hippu Salk Kristle Nathan, and Kingshuk Sarkar. 2022. COVID-19 Pandemic, Public Policy, and Institutions in India. London: Routledge. [Google Scholar]
  16. Dimitriou, Dimitrios, Dimitris Kenourgios, and Theodore Simos. 2013. Global financial crisis and emerging stock market contagion: A multivariate FIAPARCH–DCC approach. International Review of Financial Analysis 30: 46–56. [Google Scholar] [CrossRef]
  17. Feng, Gen-Fu, Hao-Chang Yang, Qiang Gong, and Chun-Ping Chang. 2021. What is the exchange rate volatility response to COVID-19 and government interventions? Economic Analysis and Policy 69: 705–19. [Google Scholar] [CrossRef]
  18. Ge, Yong, Wen-Bin Zhang, Haiyan Liu, Corrine W. Ruktanonchai, Maogui Hu, Xilin Wu, Yongze Song, Nick W. Ruktanonchai, Wei Yan, Eimear Cleary, and et al. 2022. Impacts of worldwide individual non-pharmaceutical interventions on COVID-19 transmission across waves and space. International Journal of Applied Earth Observation and Geoinformation 106: 102649. [Google Scholar] [CrossRef]
  19. Gharib, Cheima, Salma Mefteh-Wali, and Sami Ben Jabeur. 2021. The bubble contagion effect of COVID-19 outbreak: Evidence from crude oil and golda markets. Finance Research Letters 38: 101703. [Google Scholar] [CrossRef]
  20. Grinsted, Aslak, John C. Moore, and Svetlana Jevrejeva. 2004. Application of the cross wavelet transform and wavelet coherence to geophysical time series. Nonlinear Processes in Geophysics 11: 561–66. [Google Scholar] [CrossRef]
  21. Grossmann, Alexander, and Jean Morlet. 1984. Decomposition of Hardy functions into square integrable wavelets of constant shape. SIAM Journal on Mathematical Analysis 15: 723–36. [Google Scholar] [CrossRef]
  22. Gulzar, Saqib, Ghulam Mujtaba Kayani, Hui Xiaofen, Usman Ayub, and Amir Rafique. 2019. Financial cointegration and spillover effect of global financial crisis: A study of emerging Asian financial markets. Economic Research-Ekonomska Istraživanja 32: 187–218. [Google Scholar] [CrossRef]
  23. Ha, Jongrim, M. Marc Stocker, and Hakan Yilmazkuday. 2020. Inflation and exchange rate pass-through. Journal of International Money and Finance 105: 102187. [Google Scholar] [CrossRef]
  24. Hoshikawa, Takeshi, and Taiyo Yoshimi. 2021. The Effect of the COVID-19 Pandemic on S outh K orea’s Stock Market and Exchange Rate. The Developing Economies 59: 206–22. [Google Scholar] [CrossRef] [PubMed]
  25. Hossain, Md Emran, Soumen Rej, Mohammad Razib Hossain, Arunava Bandyopadhyay, Riffat Ara Zannat Tama, and Assad Ullah. 2023. Energy mix with technological innovation to abate carbon emission: Fresh evidence from Mexico applying wavelet tools and spectral causality. Environmental Science and Pollution Research 30: 5825–46. [Google Scholar] [CrossRef]
  26. Huang, Wenli, and Yuqi Zheng. 2020. COVID-19: Structural changes in the relationship between investor sentiment and crude oil futures price. Energy Research Letters 1: 1–4. [Google Scholar] [CrossRef]
  27. Hung, Ngo Thai, Linh Thi My Nguyen, and Xuan Vinh Vo. 2022. Exchange rate volatility connectedness during COVID-19 outbreak: DECO-GARCH and Transfer Entropy approaches. Journal of International Financial Markets, Institutions and Money 81: 101628. [Google Scholar] [CrossRef]
  28. Islam, Nazrul, Stephen J. Sharp, Gerardo Chowell, Sharmin Shabnam, Ichiro Kawachi, Ben Lacey, Joseph M. Massaro, Ralph B. D’Agostino, and Martin White. 2020. Physical distancing interventions and incidence of coronavirus disease 2019: Natural experiment in 149 countries. BMJ 370: m2743. [Google Scholar] [CrossRef]
  29. Iyke, Bernard Njindan. 2021. The disease outbreak channel of exchange rate return predictability: Evidence from COVID-19. In Research on Pandemics. London: Routledge, pp. 145–65. [Google Scholar]
  30. Jamal, Aamir, and Mudaser Ahad Bhat. 2022. COVID-19 pandemic and the exchange rate movements: Evidence from six major COVID-19 hot spots. Future Business Journal 8: 17. [Google Scholar] [CrossRef]
  31. Jeong, Kiho, Wolfgang K. Härdle, and Song Song. 2012. A consistent nonparametric test for causality in quantile. Econometric Theory 28: 861–87. [Google Scholar] [CrossRef]
  32. Kasman, Saadet, Gülin Vardar, and Gökçe Tunç. 2011. The impact of interest rate and exchange rate volatility on banks’ stock returns and volatility: Evidence from Turkey. Economic Modelling 28: 1328–34. [Google Scholar] [CrossRef]
  33. Klose, Jens. 2023. European exchange rate adjustments in response to COVID-19, containment measures and stabilization policies. Economic Modelling 128: 106494. [Google Scholar] [CrossRef]
  34. Maheswari, K., P. Packia Amutha Priya, S. Ramkumar, and M. Arun. 2019. Missing data handling by mean imputation method and statistical analysis of classification algorithm. In EAI International Conference on Big Data Innovation for Sustainable Cognitive Computing: BDCC 2018. Cham: Springer International Publishing, pp. 137–49. [Google Scholar]
  35. Mensi, Walid, Ahmet Sensoy, Xuan Vinh Vo, and Sang Hoon Kang. 2020. Impact of COVID-19 outbreak on asymmetric multifractality of gold and oil prices. Resources Policy 69: 101829. [Google Scholar] [CrossRef] [PubMed]
  36. Narayan, Paresh Kumar. 2020. Has COVID-19 changed exchange rate resistance to shocks? Asian Economics Letters 1: 1–4. [Google Scholar] [CrossRef]
  37. Narayan, Paresh Kumar. 2022. Understanding exchange rate shocks during COVID-19. Finance Research Letters 45: 102181. [Google Scholar] [CrossRef] [PubMed]
  38. Nishiyama, Yoshihiko, Kohtaro Hitomi, Yoshinori Kawasaki, and Kiho Jeong. 2011. A consistent nonparametric test for nonlinear causality—Specification in time series regression. Journal of Econometrics 165: 112–27. [Google Scholar] [CrossRef]
  39. Obstfeld, Maurice, and Kenneth Rogoff. 1996. Foundations of International Macroeconomics. Cambridge, MA: MIT Press. [Google Scholar]
  40. Rajput, Himadri, Rahil Changotra, Prachi Rajput, Sneha Gautam, Anjani R. K. Gollakota, and Amarpreet Singh Arora. 2021. A shock like no other: Coronavirus rattles commodity markets. Environment, Development and Sustainability 23: 6564. [Google Scholar] [CrossRef] [PubMed]
  41. Rao, Amar, Mansi Gupta, Gagan Deep Sharma, Mandeep Mahendru, and Anirudh Agrawal. 2022. Revisiting the financial market interdependence during COVID-19 times: A study of green bonds, cryptocurrency, commodities and other financial markets. International Journal of Managerial Finance 18: 725–55. [Google Scholar] [CrossRef]
  42. Salisu, Afees A., Juncal Cuñado, and Rangan Gupta. 2022. Geopolitical risks and historical exchange rate volatility of the BRICS. International Review of Economics & Finance 77: 179–90. [Google Scholar] [CrossRef]
  43. Sharif, Arshian, Chaker Aloui, and Larisa Yarovaya. 2020. COVID-19 pandemic, oil prices, stock market, geopolitical risk and policy uncertainty nexus in the US economy: Fresh evidence from the wavelet-based approach. International Review of Financial Analysis 70: 101496. [Google Scholar] [CrossRef]
  44. Sharma, Gagan Deep, Aviral Kumar Tiwari, Mansi Jain, Anshita Yadav, and Burak Erkut. 2021. Unconditional and conditional analysis between COVID-19 cases, temperature, exchange rate and stock markets using wavelet coherence and wavelet partial coherence approaches. Heliyon 7: e06181. [Google Scholar] [CrossRef]
  45. Sharma, Gagan Deep, Muhammad Shahbaz, Sanjeet Singh, Ritika Chopra, and Javier Cifuentes-Faura. 2023. Investigating the nexus between green economy, sustainability, bitcoin and oil prices: Contextual evidence from the United States. Resources Policy 80: 103168. [Google Scholar] [CrossRef]
  46. Syahri, Alfi, and Robiyanto Robiyanto. 2020. The correlation of gold, exchange rate, and stock market on Covid-19 pandemic period. Jurnal Keuangan dan Perbankan 24: 350–62. [Google Scholar] [CrossRef]
  47. Syed, Aamir Aijaz, Sahar Loukil, Azza Béjaoui, and Ahmed Jeribi. 2025. Dual perspectives on market spillovers: G7 indices with S&P 500 versus AI-driven integration. Quality & Quantity, 1–34. [Google Scholar] [CrossRef]
  48. Tang, Pan, Tiantian Tang, and Chennuo Lu. 2024. Predicting systemic financial risk with interpretable machine learning. The North American Journal of Economics and Finance 71: 102088. [Google Scholar] [CrossRef]
  49. Torrence, Christopher, and Gilbert P. Compo. 1998. A practical guide to wavelet analysis. Bulletin of the American Meteorological Society 79: 61–78. [Google Scholar] [CrossRef]
  50. Wang, Yijun, Meiyun Wei, Usman Bashir, and Chao Zhou. 2022. Geopolitical risk, economic policy uncertainty and global oil price volatility—An empirical study based on quantile causality nonparametric test and wavelet coherence. Energy Strategy Reviews 41: 100851. [Google Scholar] [CrossRef]
  51. Wei, Na, Wen-Jie Xie, and Wei-Xing Zhou. 2022. Robustness of the international oil trade network under targeted attacks to economies. Energy 251: 123939. [Google Scholar] [CrossRef]
  52. Wei, Zhixi, Yu Luo, Zili Huang, and Kun Guo. 2020. Spillover effects of RMB exchange rate among B&R countries: Before and during COVID-19 event. Finance Research Letters 37: 101782. [Google Scholar] [CrossRef] [PubMed]
  53. Wu, Wanshan, Lijun Wang, Yaman Omer Erzurumlu, Giray Gozgor, and Gaoju Yang. 2022. Effects of country and geopolitical risks on income inequality: Evidence from emerging economies. Emerging Markets Finance and Trade 58: 4218–30. [Google Scholar] [CrossRef]
  54. Yilanci, Veli, and Ugur Korkut Pata. 2023. COVID-19, stock prices, exchange rates and sovereign bonds: A wavelet-based analysis for Brazil and India. International Journal of Emerging Markets 18: 4968–86. [Google Scholar] [CrossRef]
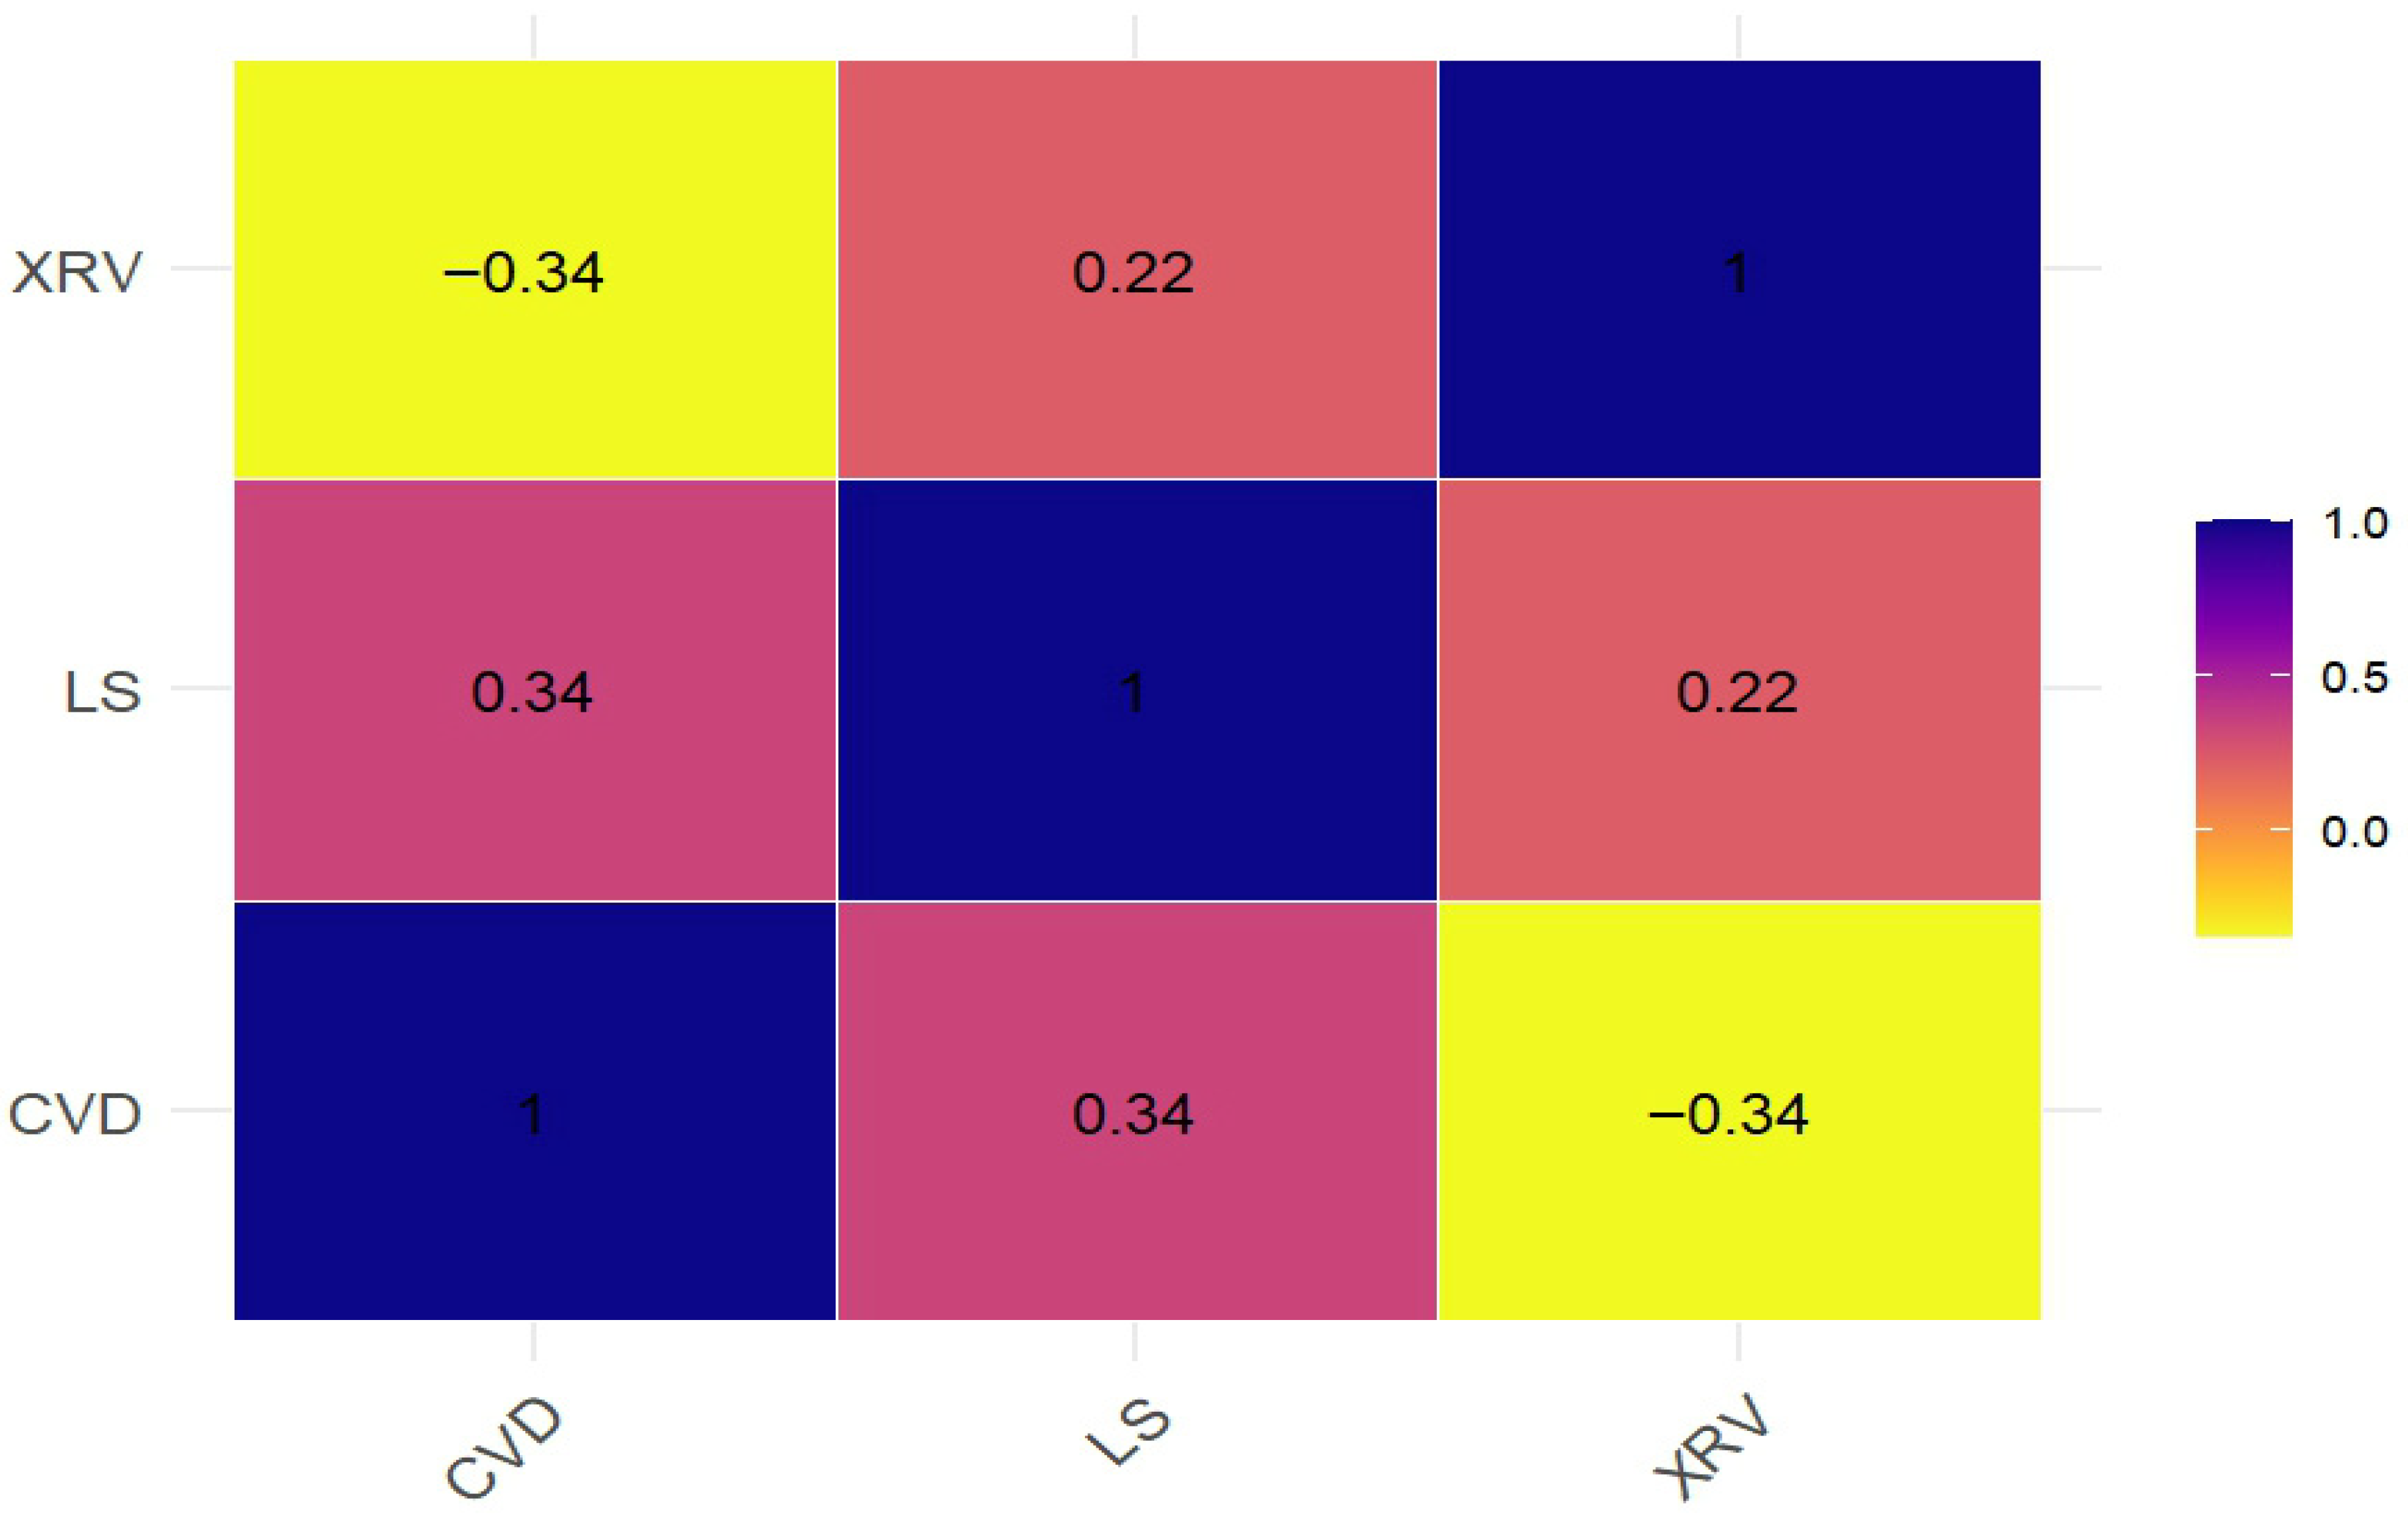
Figure 1. Correlation matrix between COVID-19 (CVD), lockdown stringency (LR), and exchange rate volatility (XRV).
Risks 13 00182 g001
Figure 2. Wavelet coherence between COVID-19 and exchange rate volatility.
Risks 13 00182 g002
Figure 3. Wavelet coherence between lockdown stringency and exchange rate volatility.
Risks 13 00182 g003
Figure 4. (a) The null hypothesis for quantile causality is that COVID does not Granger cause exchange rate volatility. (b) The null hypothesis for quantile causality is that COVID does not Granger cause exchange rate volatility.
Risks 13 00182 g004
Figure 5. (a) The null hypothesis for quantile causality is that lockdown stringency does not Granger cause exchange rate volatility. (b) The null hypothesis for quantile causality is that lockdown stringency does not Granger cause exchange rate volatility.
Risks 13 00182 g005
Figure 6. BC spectral causality COVID-19 vs. exchange rate volatility.
Risks 13 00182 g006
Figure 7. BC spectral causality lockdown stringency vs. exchange rate volatility.
Risks 13 00182 g007
Table 1. Descriptive analysis.
XRVCVDSRI
Mean0.00914.70669.113
Median0.01316.18570.830
Maximum1.60917.493100.000
Minimum−1.9571.09910.190
Std. Dev.0.3573.96119.280
Skewness0.016−2.080−1.285
Kurtosis6.6116.5474.932
Jarque–Bera249.387571.705197.805
Probability0.0000.0000.000
Note: p values relate to the Jarque–Bera test.
Table 2. Unit root test results (ADF).
At LevelAt First Difference
XRVCVDSRId (XRV)d (CVD)d (SRI)
With Constantt-Statistic−22.2734−6.4488−3.2037t-Statistic−14.4389−3.2233
Prob.0.00000.00000.0204Prob.0.00000.0193
******** *****
With Constant and Trend t-Statistic−22.2697−10.9102−3.4571t-Statistic−14.4233−5.9962
Prob.0.00000.00000.0454Prob.0.00000.0000
******** ******
Without Constant and Trend t-Statistic−22.28250.5043−0.0004t-Statistic−14.4544−2.8740
Prob.0.00000.82410.6820Prob.0.00000.0040
*** ******
Note: **, and *** explain significance level at 10% and 5%.
Table 3. Unit root test estimates (PP).
At LevelAt First Difference
XRVLCVDSRIXRVd (XRV)d (LCVD)d (SRI)
With Constant−22.2891−6.7233−3.2300−22.2891−23.8347−20.8154−20.3918
0.00000.00000.01890.00000.00010.00000.0000
********************
−22.2884−4.0026−3.3744−22.2884−23.2112−21.3558−20.3851
With Constant and Trend 0.00000.00920.05610.00000.00010.00000.0000
*******************
Without Constant and Trend −22.29661.5481−0.1799−22.2966−232.6243−19.8961−20.4010
0.00000.97040.62100.00000.00010.00000.0000
*** ************
Note: *, **, and *** explain significance level at 10%, 5%, and 1%.
Table 4. BDS test results.
DimensionCOVIDLockdown StringencyExchange Rate Volatility
BDS StatisticProb.BDS StatisticProb.BDS StatisticProb.
20.2080.0000.2010.0000.0140.000
30.3550.0000.3390.0000.0280.000
40.4580.0000.4330.0000.0360.000
50.5300.0000.4950.0000.0430.000
60.5810.0000.5350.0000.0420.000
Table 5. Troster–Granger causality in quantiles.
Quantiles COVID   XRV X R V COVID LS   XRV XRV   LS COVID   L S LS   COVID
[0.05; 0.95]0.0040.0040.0180.0750.1900.004
0.050.0040.0040.0500.0930.2260.004
0.100.0040.0040.0500.0500.1360.004
0.150.0040.0040.0540.0360.1040.004
0.200.0040.0040.0680.0430.1610.004
0.250.0040.0040.0500.0680.2110.004
0.300.0040.0040.0680.0430.0650.004
0.350.0140.0040.0470.0860.1610.007
0.400.6200.0040.7560.0430.1790.047
0.450.0040.6560.0390.0220.0970.090
0.500.0040.0040.0360.0610.1680.004
0.550.0040.0040.0540.2110.3010.004
0.600.0040.0040.0320.1150.3150.004
0.650.0040.0040.0430.1000.3080.004
0.700.0040.0040.0570.1220.3050.004
0.750.0040.0040.0540.1330.2940.004
0.800.0040.0040.0140.2370.3010.004
0.850.0040.0040.0360.2690.3050.004
0.900.0040.0040.0390.3120.3050.065
0.950.0750.1250.4010.4410.2010.634
Where denotes the hull hypothesis (does not Granger cause).
Disclaimer/Publisher’s Note: The statements, opinions and data contained in all publications are solely those of the individual author(s) and contributor(s) and not of MDPI and/or the editor(s). MDPI and/or the editor(s) disclaim responsibility for any injury to people or property resulting from any ideas, methods, instructions or products referred to in the content.