Article

AI-Powered Reduced-Form Model for Default Rate Forecasting

by
Jacopo Giacomelli
1,2,†
1
SACE S.p.A., Piazza Poli 42, 00187 Rome, Italy
2
Department of Statistics, Sapienza University of Rome, Viale Regina Elena 295, 00161 Rome, Italy
The views and opinions expressed in this article are those of the author and do not necessarily reflect the official policy or position of SACE S.p.A.
Risks 2025, 13(8), 151; https://doi.org/10.3390/risks13080151
Submission received: 30 June 2025 / Revised: 29 July 2025 / Accepted: 11 August 2025 / Published: 13 August 2025

Abstract

This study aims to combine deep and recurrent neural networks with a reduced-form portfolio model to predict future default rates across economic sectors. The industry-specific forecasts for Italian default rates produced with the proposed approach demonstrate its effectiveness, achieving significant levels of explained variance. The results obtained show that enhancing a reduced-form model by integrating it with neural networks is possible and practical for multivariate forecasting of future default frequencies. In our analysis, we utilize the recently proposed RecessionRisk+, a reduced-form latent-factor model developed for default and recession risk management applications as an improvement of the well-known CreditRisk+ model. The model has been empirically verified to exhibit some predictive power concerning future default rates. However, the theoretical framework underlying the model does not provide the elements necessary to define a proper estimator for forecasting the target default rates, leaving space for the application of a neural network framework to retrieve the latent information useful for default rate forecasting purposes. Among the neural network models tested in combination with RecessionRisk+, the best results are obtained with shallow LSTM networks.

1. Introduction

Intense research activity devoted to modeling multivariate default probability distributions has been ongoing for nearly three decades. Indeed, the so-called first-generation models (Crouhy et al. 2000; Joe 1997; McNeil et al. 2015), developed between the late 1990s and the early 2000s, laid the groundwork for the application of more modern approaches, including copula theory (Li 2000; Sklar 1951; Nelsen 1999; Mai and Scherer 2017) and, more recently, machine learning techniques (Bhatore et al. 2020; Farazi 2024; Shi et al. 2022). Some credit portfolio models base the description of interdependency among defaults on the stock price dynamics of defaultable names, exploiting correlations among the stock returns of risky firms to infer the dependency among their default probabilities. Two notable examples of this approach are CreditMetrics (J.P. Morgan & Co., Inc. 1997; RiskMetrics Group, Inc. 2007), still used in the industry to describe multivariate rating migration dynamics in loan portfolios, and the Vasicek model (Vasicek 1987, 1991, 2002), which implies the widely known Basel II formula for estimating capital absorption. CreditPortfolioView has introduced a different approach (Wilson 1997a, 1997b), which explicitly represents the diverse influence of the same macroeconomic factors on each risky firm, allowing for the simulation of multivariate dynamics of default probabilities as a function of the macroeconomic factors’ dynamics. A third approach relies only on the default frequency time series to represent both the marginal default probability distributions and the dependence structure. CreditRisk+ (“CR+” in the following) (CSFB 1998; Wilde 2010), first established in 1997 by CSFB, is undoubtedly one of the foundational models that comply with these premises.
In the CR+ framework, default events are assumed to be conditionally independent from each other. Indeed, the model is characterized by a set of independent gamma-distributed latent variables, known as “market factors”. Those variables simultaneously affect the value of each debtor’s default probability through a linear relationship. As their name suggests, the values taken by those factors represent the different states of the market context in which those debtors operate. The model is highly flexible, allowing for a different dependency structure from the market factors per debtor. As the gamma random variable domain may lead to ill-defined probabilities, the model considers each default event as not perfectly absorbing, replacing the proper Bernoulli representation with a Poisson random variable. Thus, multiple default events are allowed per debtor with exponentially decreasing probabilities. On the other hand, this slightly improper representation of defaults significantly enhances the analytical tractability of CR+. Indeed, the combined gamma and Poisson distributional assumptions enable the semi-analytical computation of the portfolio loss distribution through the application of Panjer’s recursive algorithm (CSFB 1998; Panjer 1988). Furthermore, a variance reduction technique is also available for the Monte Carlo implementation of CR+ (Glasserman and Li 2005).
These appealing computational advantages and the financial interpretability of the model’s parameters have kept the model popular in both industry and academia for roughly three decades. Nonetheless, the original CR+ formulation presents a variety of limitations, some of the most relevant ones being the deterministic severity of each default event, the complexity of calibration due to the large number of parameters defining the dependence structure, and the fact that the model is defined in a single-period framework, the latter preventing the model user from describing the creditworthiness dynamics through stochastic processes defined within the model’s framework. Intense research activity (Gundlach and Lehrbass 2004; Klugman et al. 2012), still ongoing to date (Huang and Kwok 2021; Jakob 2022; Liu et al. 2024), has been conducted concerning these and other issues. In particular, the calibration problem has been adequately formalized and handled through an SNMF approach (Vandendorpe et al. 2008). Further improvements regarding calibration precision have been achieved through generalizing the model to a multi-period framework (Giacomelli and Passalacqua 2021a). This CR+ extension has also enabled its application in contexts where the scarcity of available data for calibration typically represented a significant limitation, such as credit insurance (Giacomelli and Passalacqua 2021b) and suretyship (Giacomelli and Passalacqua 2021c).
Extending CR+ to a multi-period framework has enabled the introduction of discrete-time stochastic processes to describe the dynamics of both market factors and default probabilities. The further consideration of autocorrelation in the market factor processes and the restoration of the proper Bernoulli representation of default events have led to the recent introduction of the RecessionRisk+ model (Giacomelli and Passalacqua 2024) (“RR+” in the following), which provides both point-in-time and through-the-cycle multivariate probability distributions for all the considered debtors given any arbitrary projection horizon. Although developed for risk management applications, the model has also demonstrated some predictive power concerning future default frequencies. However, the theoretical framework underlying the model does not, to date, provide a formal method for fully extracting such information.
This information retrieval problem represents an ideal application context for supervised machine learning algorithms, especially neural networks. A nonlinear relationship is reasonably assumed to exist between a set of features returned by the RR+ model and the future default frequencies of debtors, which are usually clustered based on their economic sector or other categorical variables. Furthermore, considering discrete-time processes, both classic deep neural networks and more advanced recurrent neural networks are suitable for handling this problem.
Machine learning and, more generally, artificial intelligence techniques have garnered increasing attention from the scientific community over the last few decades, and the range of possible applications continues to expand without signs of slowing. This research utilizes some of the most popular machine learning techniques currently applied in actuarial science, including deep neural networks, such as deep autoencoders, and long short-term memory networks. Without any claim to completeness, we recall some recent examples of the successful application of these models in addressing actuarial problems involving multivariate dependencies and probability forecasting. In Miyata and Matsuyama (2022), autoencoders are considered in combination with the Lee–Carter model to describe human life expectancy in a Bayesian framework. In Laporta et al. (2025), deep neural networks are applied to a pricing problem in health insurance where a nontrivial dependency structure is involved. Also, long short-term memory networks are extremely popular nowadays in the context of actuarial science due to their proven effectiveness in time-series forecasting. Some notable examples of recent results obtained through them are Lindholm and Palmborg (2022); Nigri et al. (2019, 2021); Perla et al. (2021), all of them concerning problems related to human life expectancy and mortality rate forecasting.
This work aims to investigate whether it is possible to effectively predict future default rates in Italy per economic sector by retrieving information embedded in the RR+ model’s outputs, relying on a selection of frequently utilized artificial intelligence techniques—specifically deep and recurrent neural networks. Although mortality risk and default risk are two quite different applicative fields, this work shares some relevant features with the aforementioned results: an actuarial model is considered in combination with one or more neural network models to address a problem related to forecasting the future rates of a specific absorbing event (i.e., death or default). Nonetheless, the joint application of a reduced-form model and neural-network-based techniques to forecast default rates is novel as default probability forecasting usually benefits from micro- or macroeconomic information that is explicitly excluded from the input feeding a reduced-form model.
The work is organized as follows. Section 2 summarizes the RR+ model specifications and describes the neural network compositions chosen to infer the relationship between the RR+ output and the future default frequencies. Section 3 presents our investigated case study, which considers historical time series concerning nonperforming loans publicly available from the Bank of Italy database. The numerical results are compared among the alternative neural network approaches that have been tested, showing that some of them lead to remarkably precise forecasts. Finally, Section 4 summarizes the results obtained in this work and discusses related open problems that are worth investigating in future research papers.

2. Models and Methods

As anticipated in Section 1, we consider the RR+ framework developed in (Giacomelli and Passalacqua 2024). In Section 2.1, the RR+ model is briefly summarized. The following Section 2.2 introduces a selection of indexes returned by the model and discusses the reasonable expectations concerning their predictive power. Finally, Section 2.3 presents the ML architectures chosen to infer the future default rates from the RR+ indexes.

2.1. The RecessionRisk+ Model

Let us consider a population of N defaultable entities, each belonging to one of H clusters. Without loss of generality, we can assume that each cluster represents an economic sector. Further, let us consider two time scales δ and Δ such that Δ / δ m N . For practical purposes, we choose δ to be one quarter and Δ to be one year. The model is defined in a discrete-time framework, where δ is the time unit. Thus, time is represented by a variable t δ Z . In the following, we simplify the notation expressing time in δ -units (i.e., δ 1 and Δ m ) so that t Z .
In this framework, default events are absorbing and thus represented by Bernoulli random variables I i ( i = 1 N ). Given the i-th entity, belonging to the h-th cluster, its Bernoulli distribution’s parameter is its default probability over the time interval ( t , t + δ ] , and it is assumed to have the following form:
p i ( t ) = Prob ( I i > 0 | γ t ) = 1 exp q h ω h 0 + k = 1 K ω h k γ k ( t ) .
Equation (1) implies that each entity belonging to the same h-th cluster has the same conditional default probability. The array γ t R + K is a latent variable representing the state of the market in t given the following specifications.
γ k ( t ) Gamma σ k 2 ξ k 2 m 1 , σ k 2 ξ k 2 m
ξ k : = 1 + 2 x = 1 m ϱ x k 1 x m 1 2 .
Further, γ k ( t ) , γ k ( t ) for k , k { 1 K } , k k are independent, while γ k ( t ) , γ k ( t ) for t , t Z are related to each other through a time-independent ACF function of the form
cov γ k ( t ) , γ k ( t + x ) = ϱ x k var γ k ( t ) , ϱ x k = ρ k | x | ,
where ρ k [ 0 , 1 ) . The latter assumption introduces a “system memory”, allowing for future market states to be dependent on the past market states as in a real economy. Further, so-called factor loadings ω h k define the dependency of each entity’s hazard rate on the market factors. Like in the classic CR+ model, those parameters obey the following constraint for each h , k { 1 H } × { 0 K } .
ω h k 0 , k = 0 K ω h k = 1 .
The constraint also implies each ω h 0 value. All that given, q h / δ is naturally interpreted as both the long-term average default intensity and the expected default intensity over γ t scenarios:
q h = lim T 1 T t 0 t 0 T ln 1 p i ( t ) d t = E 1 p i ( t ) R + .
In Giacomelli and Passalacqua (2024), it is proven that Equation (1) is consistent at both the time scales δ and Δ given the assumptions stated so far. Indeed, the conditional default probability of the i-th entity over the ( t , t + Δ ] interval can be written as
P i ( t ) = 1 exp Q h ω h 0 + k = 1 K ω h k Γ k ( t ) ,
where the i-th entity belongs to the h-th cluster and
Q h : = m q h ,
Γ k ( t ) : = x = 0 m 1 γ k ( t + x ) Gamma σ k 2 , σ k 2 .
Further results in (Giacomelli and Passalacqua 2024) provide a detailed calibration process for the parameter set { q h , σ k , ρ k , ω h k } for h = 1 H and k 1 K based on the historical time series of default rates per economic sector.
The RR+ model returns two distributions of log survival probabilities. Indeed, following the notation utilized in (Giacomelli and Passalacqua 2024), we introduce
Λ h ( t ) : = ln S h ( t , t + Δ ) ,
Λ h ( t , γ ¯ ) : = ln S h ( t , t + Δ ) | γ t 1 = γ ¯ ,
where S h ( t , t ) is the survival probability of an entity belonging to the h-th cluster evaluated on the interval ( t , t ] . Λ h ( t ) is the (negative) unconditional log survival probability. In contrast, Λ h ( t , γ ¯ ) is the same random variable, conditioned to the last inferred value of the market factor array. In economic terms, they can be thought of as the through-the-cycle and the point-in-time log probabilities, the latter being estimated depending on the last known state γ t 1 of the economic cycle.
In the RR+ framework, closed-form expressions are proven both for Λ h and Λ h given the small volatilies assumption σ k 1 ( k = 1 K ).
Λ h ( t ) = x = 0 m 1 λ h ( t + x ) ,
Λ h ( t , γ ¯ ) = x = 0 m 1 λ h 1 ( t + x , γ t + x 1 ) , γ t 1 = γ ¯ ,
where
λ h ( t ) = q h ω h 0 + k = 1 K ω h k γ k ( t ) ,
λ h x ( t , γ ¯ ) = q h ω h 0 + k = 1 K ω h k γ k ( t ) 1 1 ρ k 2 | x | + 1 + ρ k | x | γ ¯ k 1 .
The two log survival functions enable the computation of the corresponding through-the-cycle and point-in-time probabilities P h t and P h t .

2.2. The Model Output as Features of a Nonlinear Regression Problem

Although one could be tempted to consider P t as a suitable means for forecasting default probability by itself, it is worth keeping in mind that P t and P t are random variables aimed to compare and contrast the locally conditional default probability distribution with the long-term one.
In (Giacomelli and Passalacqua 2024), information concerning the future generalized increase in default rates across considered economic sectors is retrieved by comparing right-tail quantiles of P h t with the corresponding ones of P h t . Roughly speaking, the underlying idea is that the right tail of P h t distribution comprises recessive scenarios, P h t being unconditional and thus calibrated through one or more past economic cycles. On the other hand, P h t is conditioned to γ t . Thus, whether a chosen percentile of P h t comprises a long-term worst-case scenario or not depends on the market scenario observed in t 1 (i.e., the current phase of the economic cycle).
Given this rationale, two indexes are proposed (among others) in (Giacomelli and Passalacqua 2024) for each economic sector h.
R R h p ( t ) : = P ¯ h p ( t ) P ¯ h p ( t ) ,
R R ¯ h p ( t ) : = 1 1 p p 1 R R h p ( t ) d p ,
where P ¯ h p ( t ) Φ h 1 ( p ) , Φ h ( · ) is the cdf of P h t , p ( 0 , 1 ) is a given tolerance level, and analogous notation holds for P h t .
The RR+ model processes the information embedded in the multivariate time series of past default rates per economic sector and returns a set of indexes per sector, incorporating context information from the dynamics of other sectors. For the reasons stated above, it is reasonable to believe that the indexes contain information concerning future default rates, provided that the assumptions underlying the model are in good agreement with the reality of the specific application considered.
Indeed, in (Giacomelli and Passalacqua 2024), R R ¯ h , 0.75 ( t ) exhibits a reasonable degree of correlation with default rates ex-post observed in t + Δ , confirming the intuition. However, the functional relation that best describes the dependence of the ex-post measured default frequencies on the ex-ante set of RR+ indexes and to what extent RR+ can be utilized for forecasting purposes remain to be seen.
Thus, given an RR+ instance, calibrated with information available up to t, we consider the following set of indexes per observation date t and sector h:
D h t : = P ¯ h p ( t ) ; P ¯ h p ( t ) ; R R h p ( t ) ; R R ¯ h p ( t ) p p E [ P h t ] E [ P h t ] ; var [ P h t ] var [ P h t ] ,
where p is an arbitrary array of percentiles chosen to sample the indexes’ distributions. For our numerical investigation, we have chosen
p = 0.01 , 0.05 , 0.10 , 0.25 , 0.40 , 0.50 , 0.60 , 0.75 , 0.90 , 0.95 , 0.99 .
The overall available information up to t, considered in the following for forecasting purposes, is
D h t t t D h t .
The problem numerically investigated in the remainder of this work is to infer the set of functions G h ( · ) ( h = 1 H ) such that
G h D h t = f h ( t , t + Δ ) + ε h t ,
where f h ( t , t + Δ ) is the ex-post default frequency observed for the h-th sector over the time interval ( t , t + Δ ) and ε h t is the forecasting error term to be minimized.

2.3. Selected Machine Learning Techniques

The modern machine learning (“ML”) literature offers a wide range of techniques for inferring G h . The aim of this work is not to find the best possible strategy to solve the problem. We investigate whether one or more G h estimates are precise and robust enough to provide a reliable forecast of f h ( t , t + Δ ) , showing that a reduced-form portfolio model, such as RR+, can be applied to default rate forecasting.
We have considered five competing strategies, plus a min–max-scaled version of the aforementioned R R ¯ h , 0.75 ( t ) index—the latter being a baseline benchmark of the predictive power that RR+ can achieve before the application of the ML technique summarized in the following. All five considered strategies are outlined in Figure 1, where each of them is represented by a colored arrow connecting the D h t database returned from RR+ to the target variable f h ( t , t + Δ ) . The blue line connecting D h t to the target directly represents the estimation of G h as the scaled RR+ index mentioned above. The same six-color code is maintained to compare the forecast performance of the various strategies in the next section.
The five implemented ML strategies are characterized by a three-step structure: feature selection, dimensionality reduction, and forecasting.
The first step—feature selection—is the same for all the considered strategies. Two statistics τ and τ ¯ are considered jointly to decide whether each ex-ante variable x t < t D h t exhibits some hint of predictivity concerning the ex-post target variable f h t f h ( t , t + Δ ) . τ and τ ¯ are defined as follows
τ x : = argmax s ( 0 , Δ ] | ρ x t , f h , t s | ,
τ ¯ x : = 0 Δ | ρ x t , f h , t s | s d s 0 Δ | ρ x t , f h , t s | d s ,
Both τ x and τ ¯ x are defined in the interval [ 0 , Δ ] by construction. The first is defined as the backward time shift that maximizes the correlation between the feature and the target. If the optimal shift is zero, the feature is best correlated with the future default rate to be predicted. Conversely, if the optimal shift is Δ , the optimal correlation is achieved when considering past observations only. The second statistic τ ¯ x contains similar information but averages the tested shifts, weighting each of them with the corresponding measured correlation. The feature selection test is performed for each feature x in D h t separately, resulting in the selection of the feature among the list of the explanatory ones only if
τ x θ τ ¯ x θ ¯
In our numerical investigation, we chose ( θ , θ ¯ ) ( 0.50 Δ , 0.55 Δ ) .
The second step—dimensionality reduction—considers two alternative techniques: a Principal Component Analysis implementation (“PCA” in Figure 1) and a deep autoencoder (“DAE” in Figure 1). Essentially, the first is one of the most commonly used techniques for linearly compressing information in a time series of vectors, and the second is the corresponding nonlinear technique in the context of neural networks. Both our PCA and DAE return a reduced output x ˜ R 5 unless the former feature selection phase has previously chosen five features only or less. After comparing the explained variance of different DAE configurations over the considered dataset, we decided to implement two hidden encoding layers (7,5) and a decoding layer (7), where the silu activation function is used for each neuron. When considering this and any other implementation choice reported in this work, it is worth keeping in mind that optimal hyperparameter values and other technical settings are typically very sensitive to the dataset used.
The third step—forecasting—takes the reduced feature array x ˜ as input and considers two alternate techniques (like the former dimensionality reduction phase): a deep neural network (“DNN” in Figure 1) and a long short-term memory recurrent neural network (“LSTM” in Figure 1). For this specific application, the most relevant difference between the two models is that the DNN operates a cross-sectional approach, which infers the corresponding target f h t from a single observation x ˜ t . Thus, no memory effects further than the ones assumed in the RR+ model are introduced by the DNN. Conversely, the LSTM operates as any other recurrent neural network, considering a time-series tranche { x ˜ s : s ( t 0 , t ] } to forecast f h t . Nowadays, LSTM networks are often regarded as one of the most effective techniques for handling time-series forecasting problems. On the other hand, their training may require a large amount of data and a non-negligible computational cost to be adequately achieved. Our DNN implementation comprises two hidden layers (5,5). Like for the DAE implementation, the silu activation function is used for each neuron. Our LSTM implementation is composed of a single layer (20), which processes a ( t 3 Δ , t ] time series tranche at a time.
The methods described above are composed to build the ML strategies utilized to solve the problem stated in Equation (21). As stated above, the considered strategies have no claim to completeness or optimality. Table 1 summarizes those strategies. As anticipated, a graphical summary of the whole workflow is available in Figure 1.
The framework described so far comprises five calibratable/trainable models: PCA, DAE, DNN, LSTM, and RR+. Each of them is recalibrated for each t, adding the new observation to the training set and considering the result of the former calibration as the initial value of the parameters, if applicable.
A time t c model is chosen for each model such that the first calibration performed includes all the information available up to t c model . Due to their easily convergent calibration—at least compared with the neural network techniques considered in this work, R R + and PCA have the same minimum t c RR , while DAE, DNN, and LSTM share a longer t c NN threshold.

3. Numerical Application

In the following, a real case study is investigated to demonstrate that the default rate forecast per economic sector is attainable by combining a reduced-form model and standard ML techniques. The presented numerical application utilizes the models and methods discussed in Section 2. Section 3.1 describes the considered historical dataset. The following Section 3.2 summarizes the obtained results. Finally, Section 3.3 suggests some practical applicative contexts where the tool proposed in this work could be relevant.

3.1. The Italian Default Rate Time Series

So far, we have outlined a method to forecast default rates based on a historical time series set of past default rates per economic sector, or by any other categorical partition of a population of defaultable entities into internally homogenous clusters.
To test the method, we consider the historical default rates of the Italian enterprises per economic sector. This dataset is publicly available, enabling the reproducibility of the presented results, and has some characteristics that make it an ideal workbench for testing the idea investigated in this work.
First, the considered time series is considerably deep. Indeed, quarterly observations have been recorded for approximately the last 30 years without any missing observations or other data quality issues to be addressed as the data source is the Italian supervisory authority for the banking and financial sector, which aggregates and discloses the information collected directly from the subjects being monitored. Furthermore, data are provided with fine-grained clustering. Even avoiding the most granular representation available, we have utilized 32 sectors. For a description of each sector considered, please refer to Appendix A.
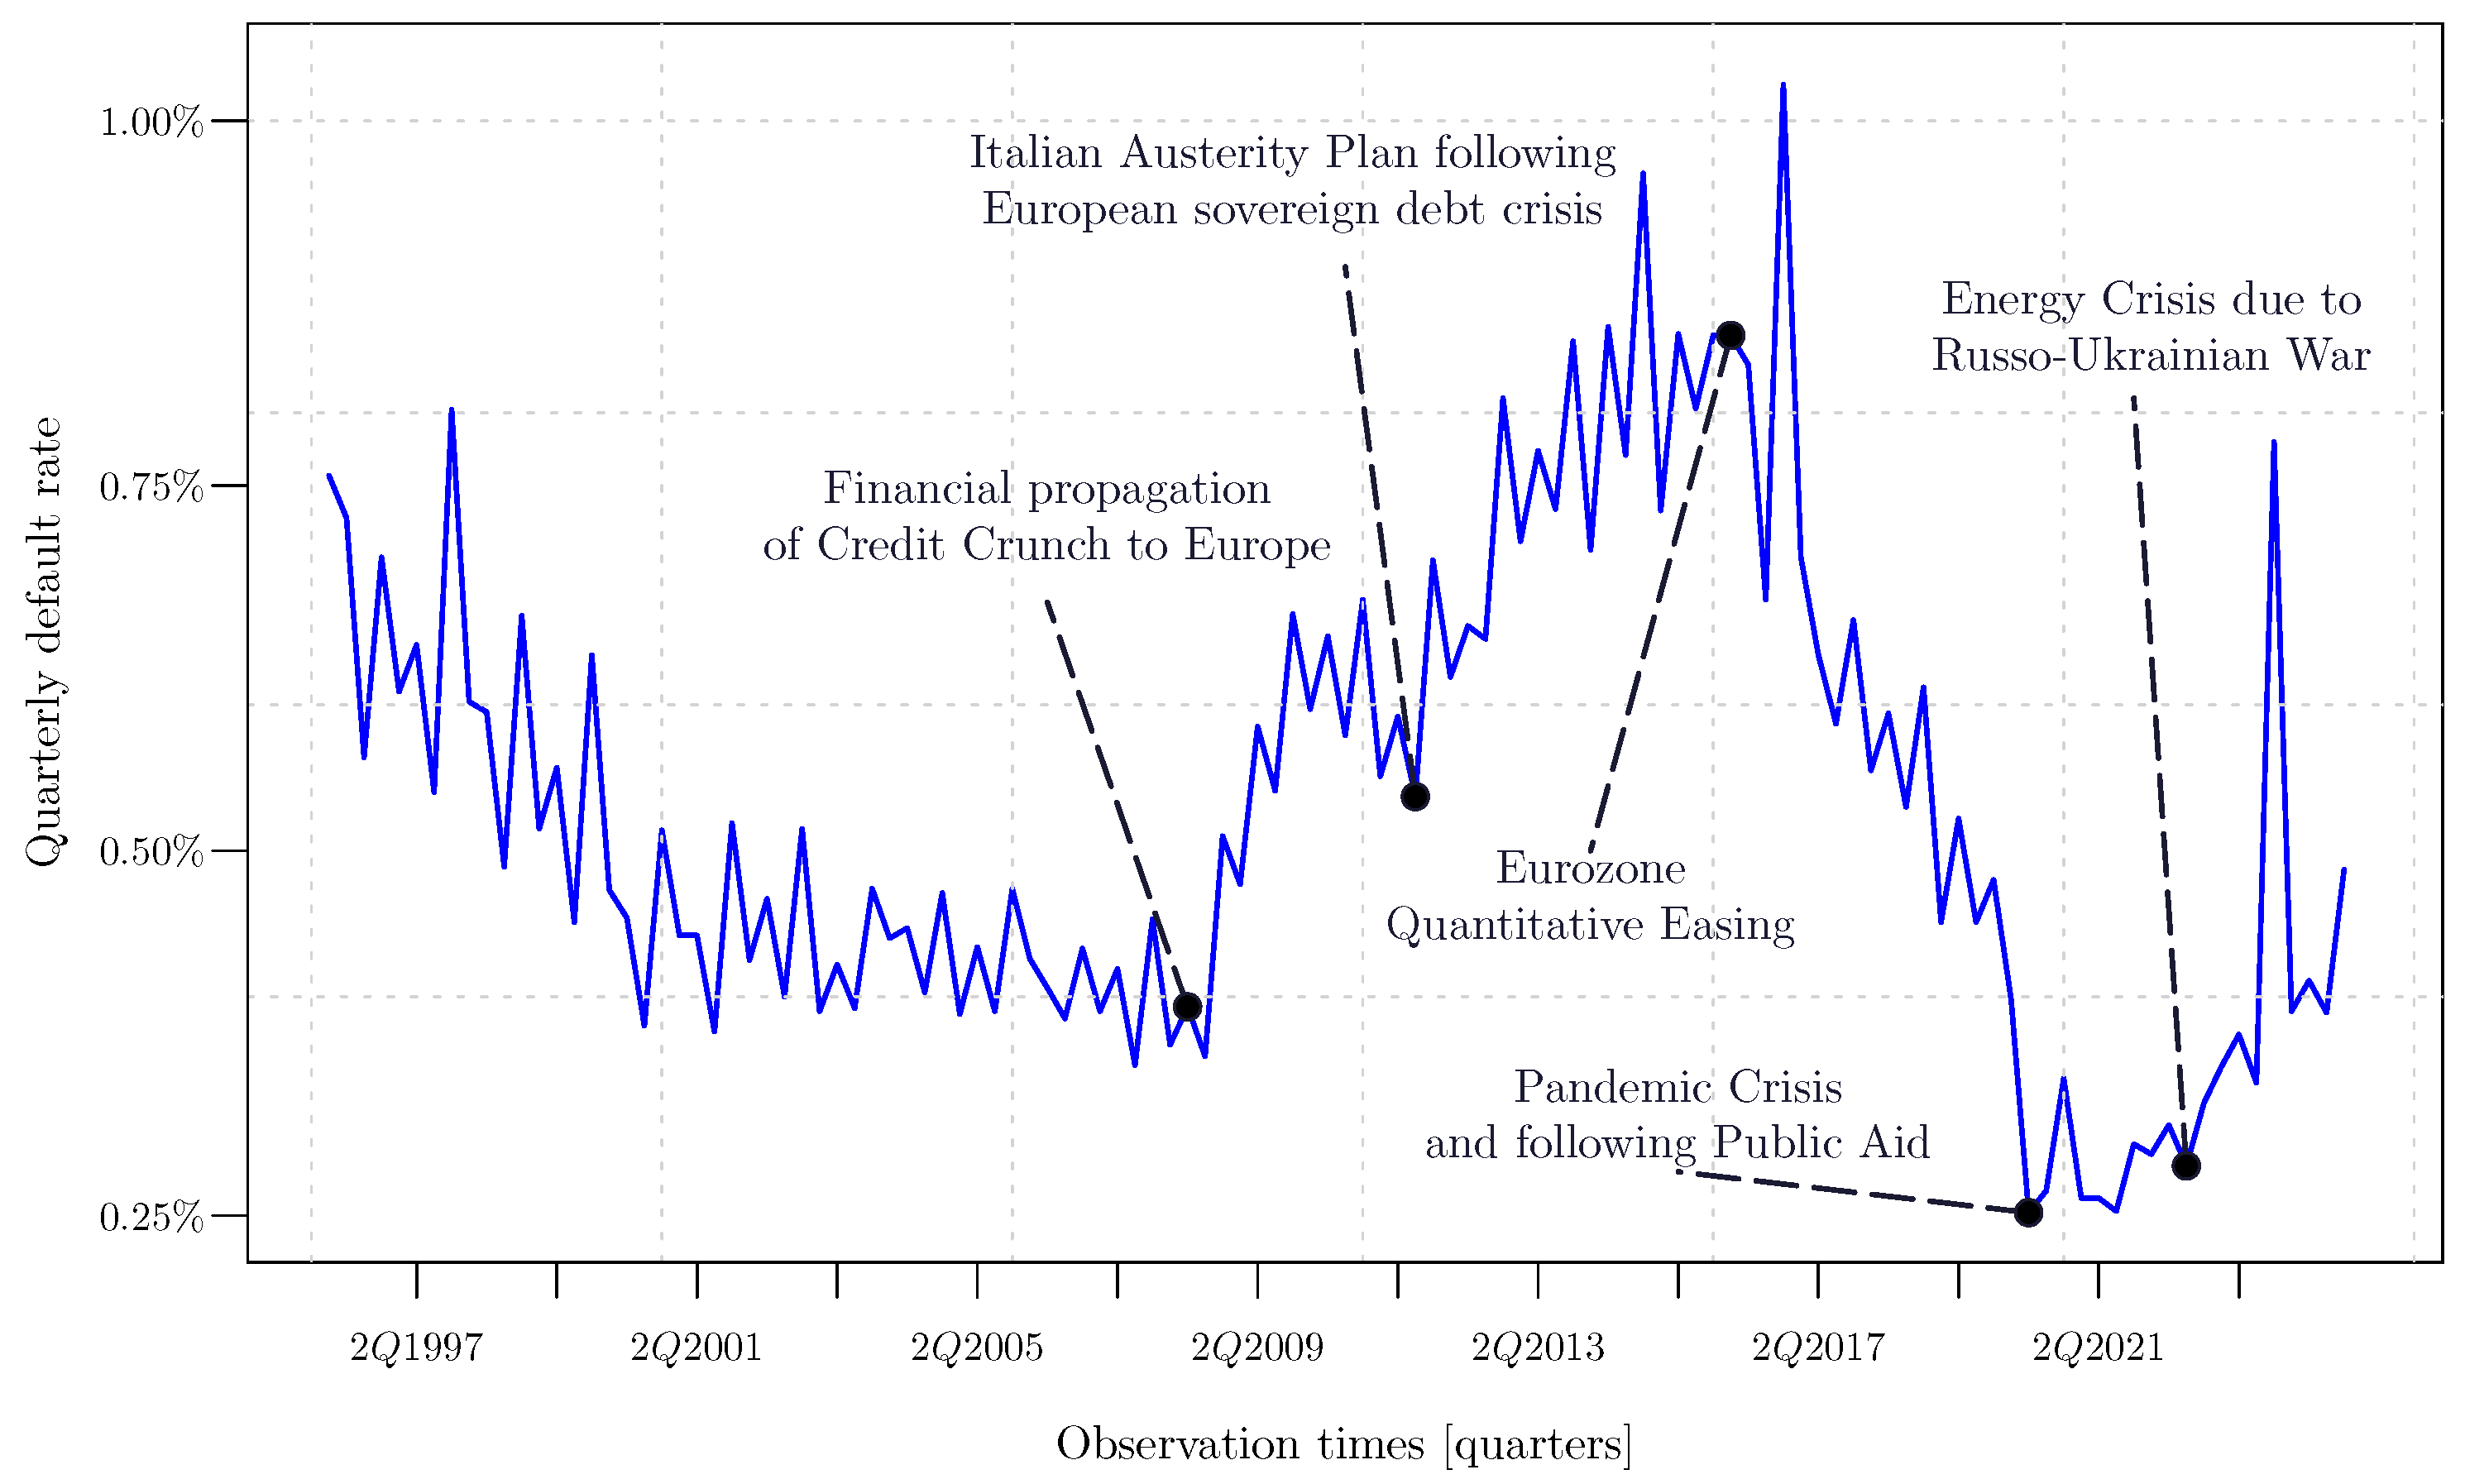
Finally, these time series are empirically driven by exogenous events over time. Some of the most relevant economic and political events that have affected Italy in recent decades are displayed in Figure 2, together with their effects on the observed default rates across all the economic sectors. Each sector has reacted differently to each of those events. Nonetheless, by examining Figure 2, it is easily verified that these events have a dramatic effect in general, including trend inversion phenomena.
This characteristic of the dataset is a remarkable challenge to the proposed approach as choosing a reduced-form model excludes the explicit consideration of any macroeconomic indicator that may help the model to understand the context. Thus, if the proposed method proves to be actually predictive, it means that the interdependency among economic sectors and the latent early reactions of each industry to exogenous events are sufficient to forecast changes—even inversions—in trends recorded in the ex-post measured default rates. This empirical result is relevant in its own right, beyond the technical specifications of the method used to achieve the forecast.
As stated above, the chosen time series are sampled quarterly. The target variable f h t is the 1-year default frequency per economic sector. Thus, it holds δ = 0.25 , Δ = 1 , and  m = 4 .

3.2. Comparison Among the Forecasts

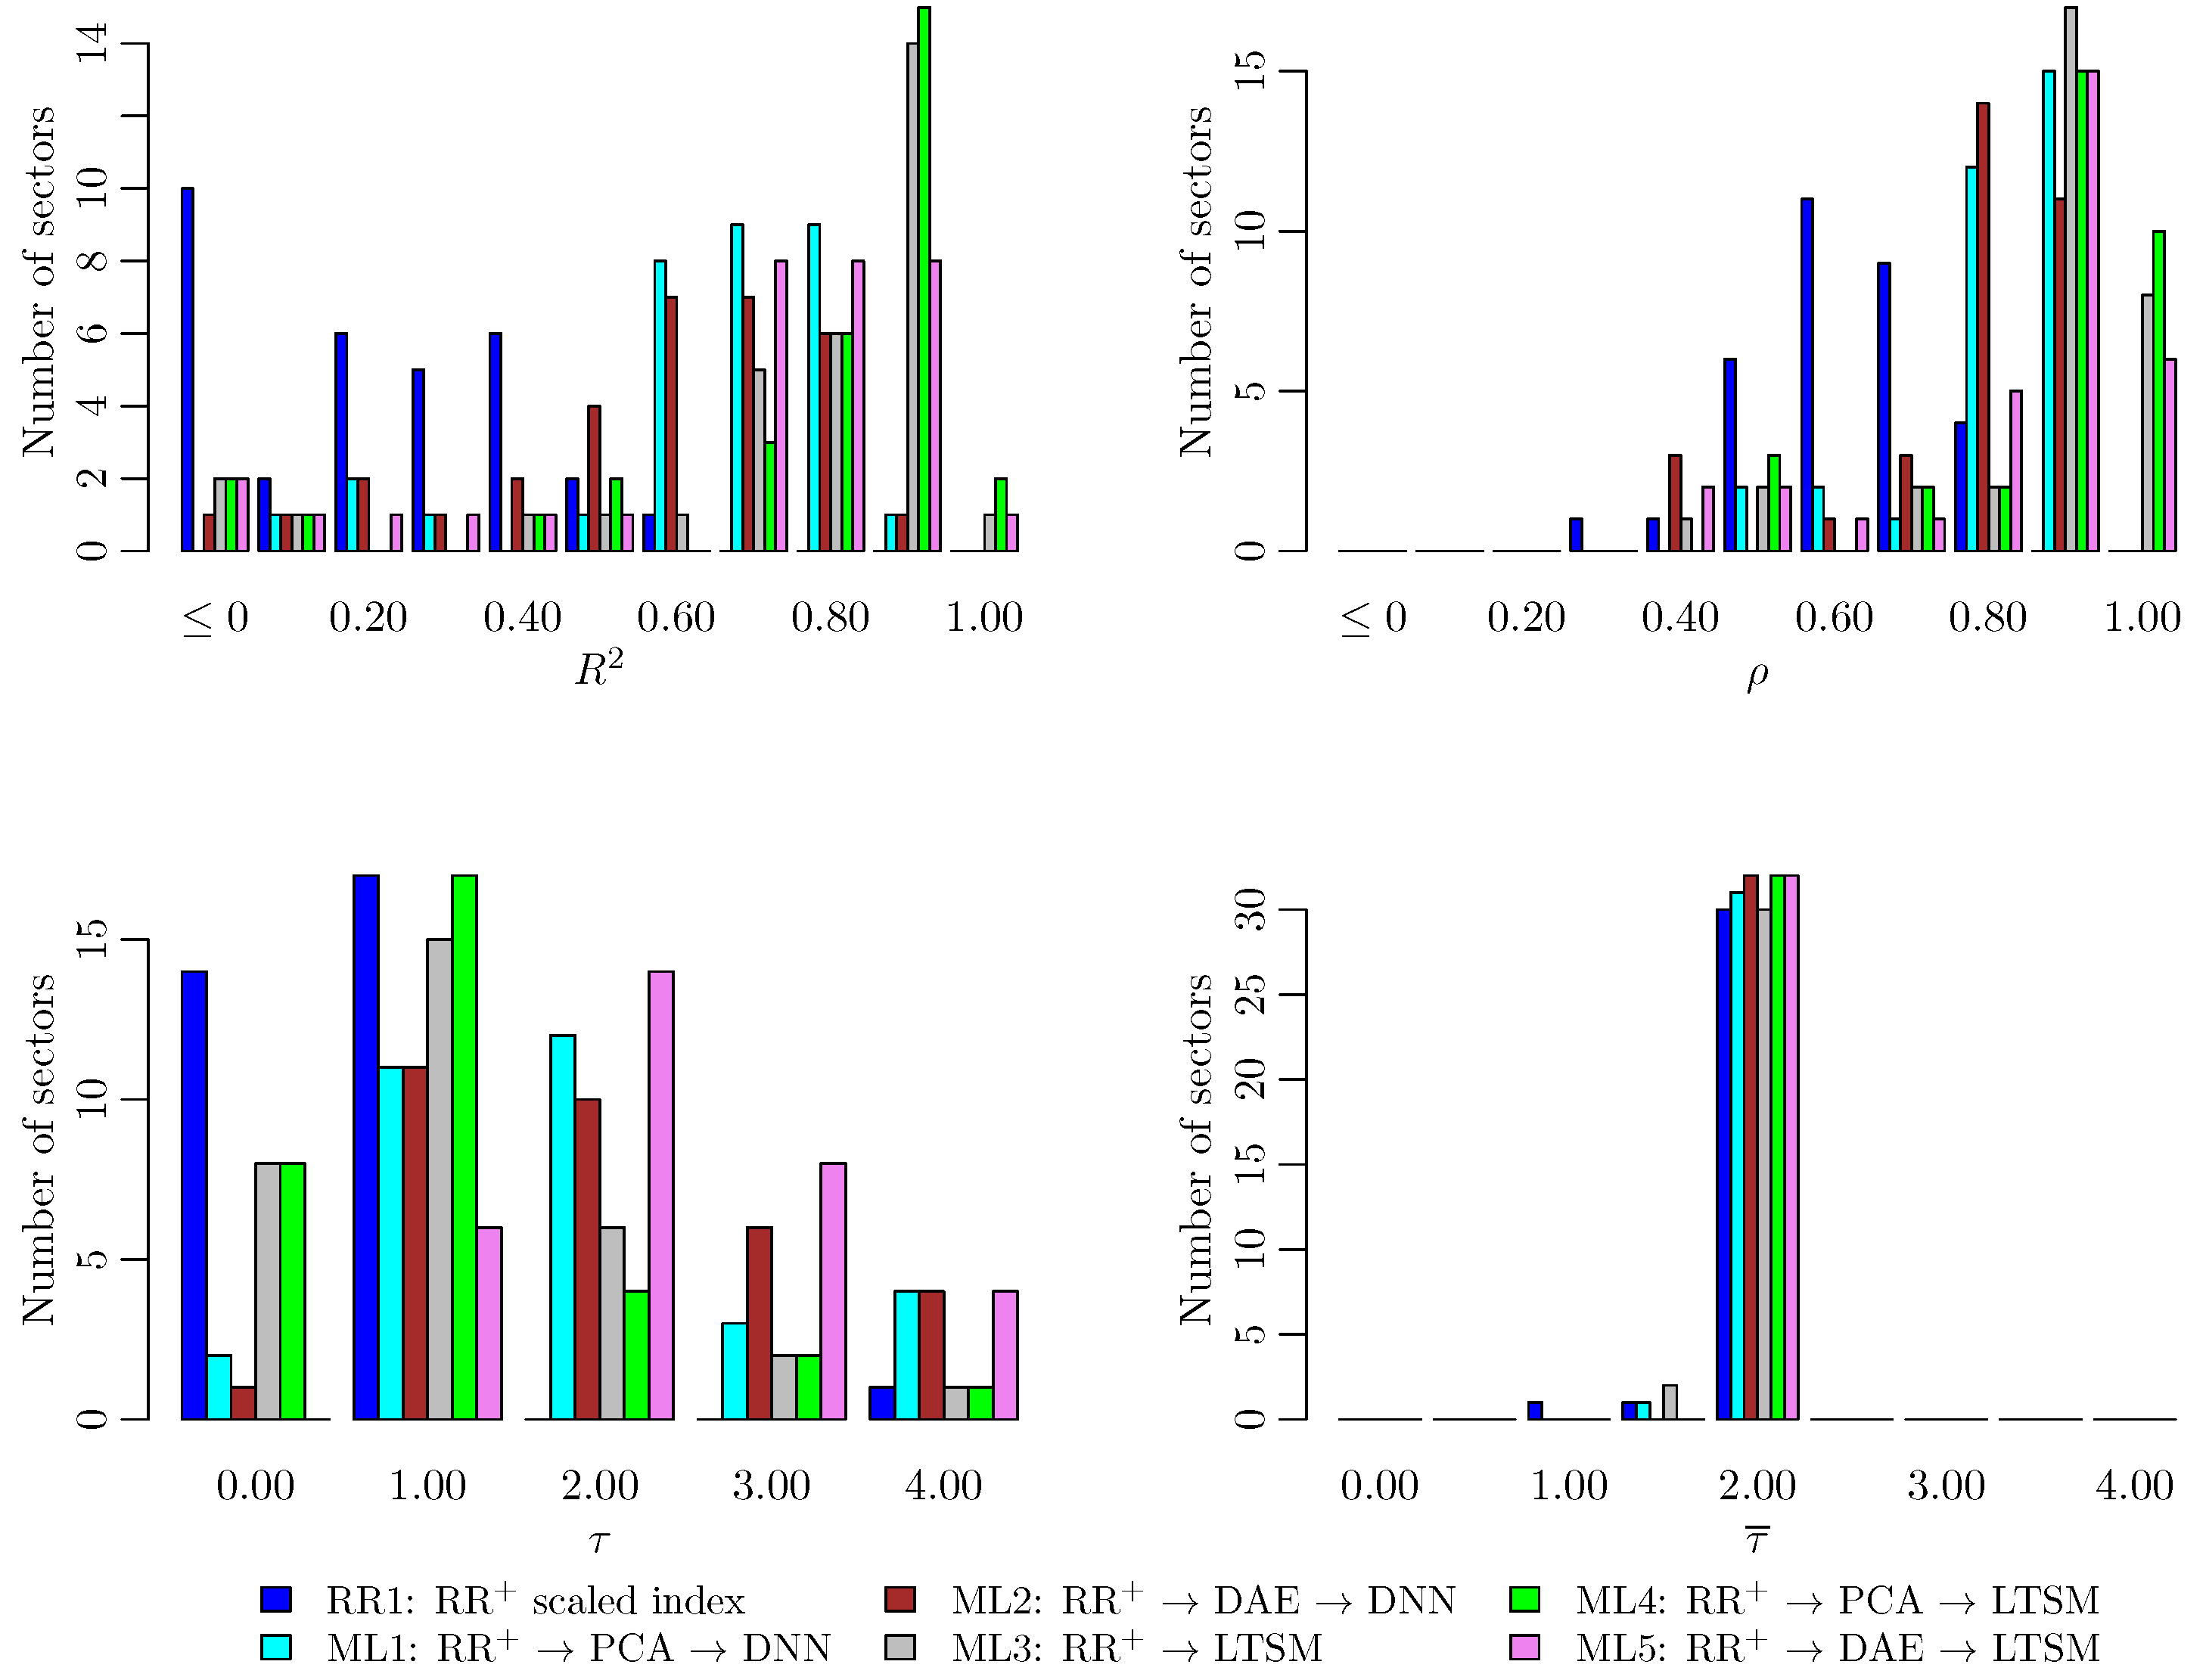
The six forecasting strategies outlined in Table 1 are compared to each other based on their fitness to each of the 32 considered (future) default rate time series introduced in Section 3.1 and Appendix A. Four quality-of-fitness indicators are utilized in the analysis: the coefficient of determination R 2 , the Pearson correlation coefficient ρ , and the backward-shift indicators τ and τ ¯ introduced in Equations (22) and (23). Each of them is used to compare the forecast f ^ h t := G h ( D h t ) and the actual target value f h t . The resulting quality distributions across all the economic sectors are displayed in Figure 3. The ideal model (i.e., f ^ h t f h t ) should achieve ( R 2 , ρ , τ , τ ¯ ) ( 1 , 1 , 0 , 0 ) .
Figure 3 provides a clear picture of how well each strategy performs over the Italian default rate dataset compared with the others. As expected, RR1 exhibits the worst R 2 and ρ distributions, consistent with the fact that no ML technique is involved in enhancing the quality of fit. In general, LSTM-based architectures (i.e., ML3, ML4, and ML5) perform better than DNN-based architectures (i.e., ML1 and ML2), in good agreement with the intuition that a more flexible neural network, with a memory function explicitly designed for time-series forecasting applications, in a suitable applicative context should achieve better results than a general-purpose neural network. Conversely, PCA-based architectures (i.e., ML1 and ML4) perform generally better than DAE-based architectures (i.e., ML2 and ML5). In cases where a linear compression of the information explains almost all the variance in data (5-factor PCA always achieved a fraction of explained variance greater than 99%), the training of a DAE may be a hard problem, with occasionally poor convergence, without a real benefit in terms of greater explained variance. All the considerations above are generally valid for the considered case study. Nonetheless, occasional exceptions may be possible depending on the specific sector.
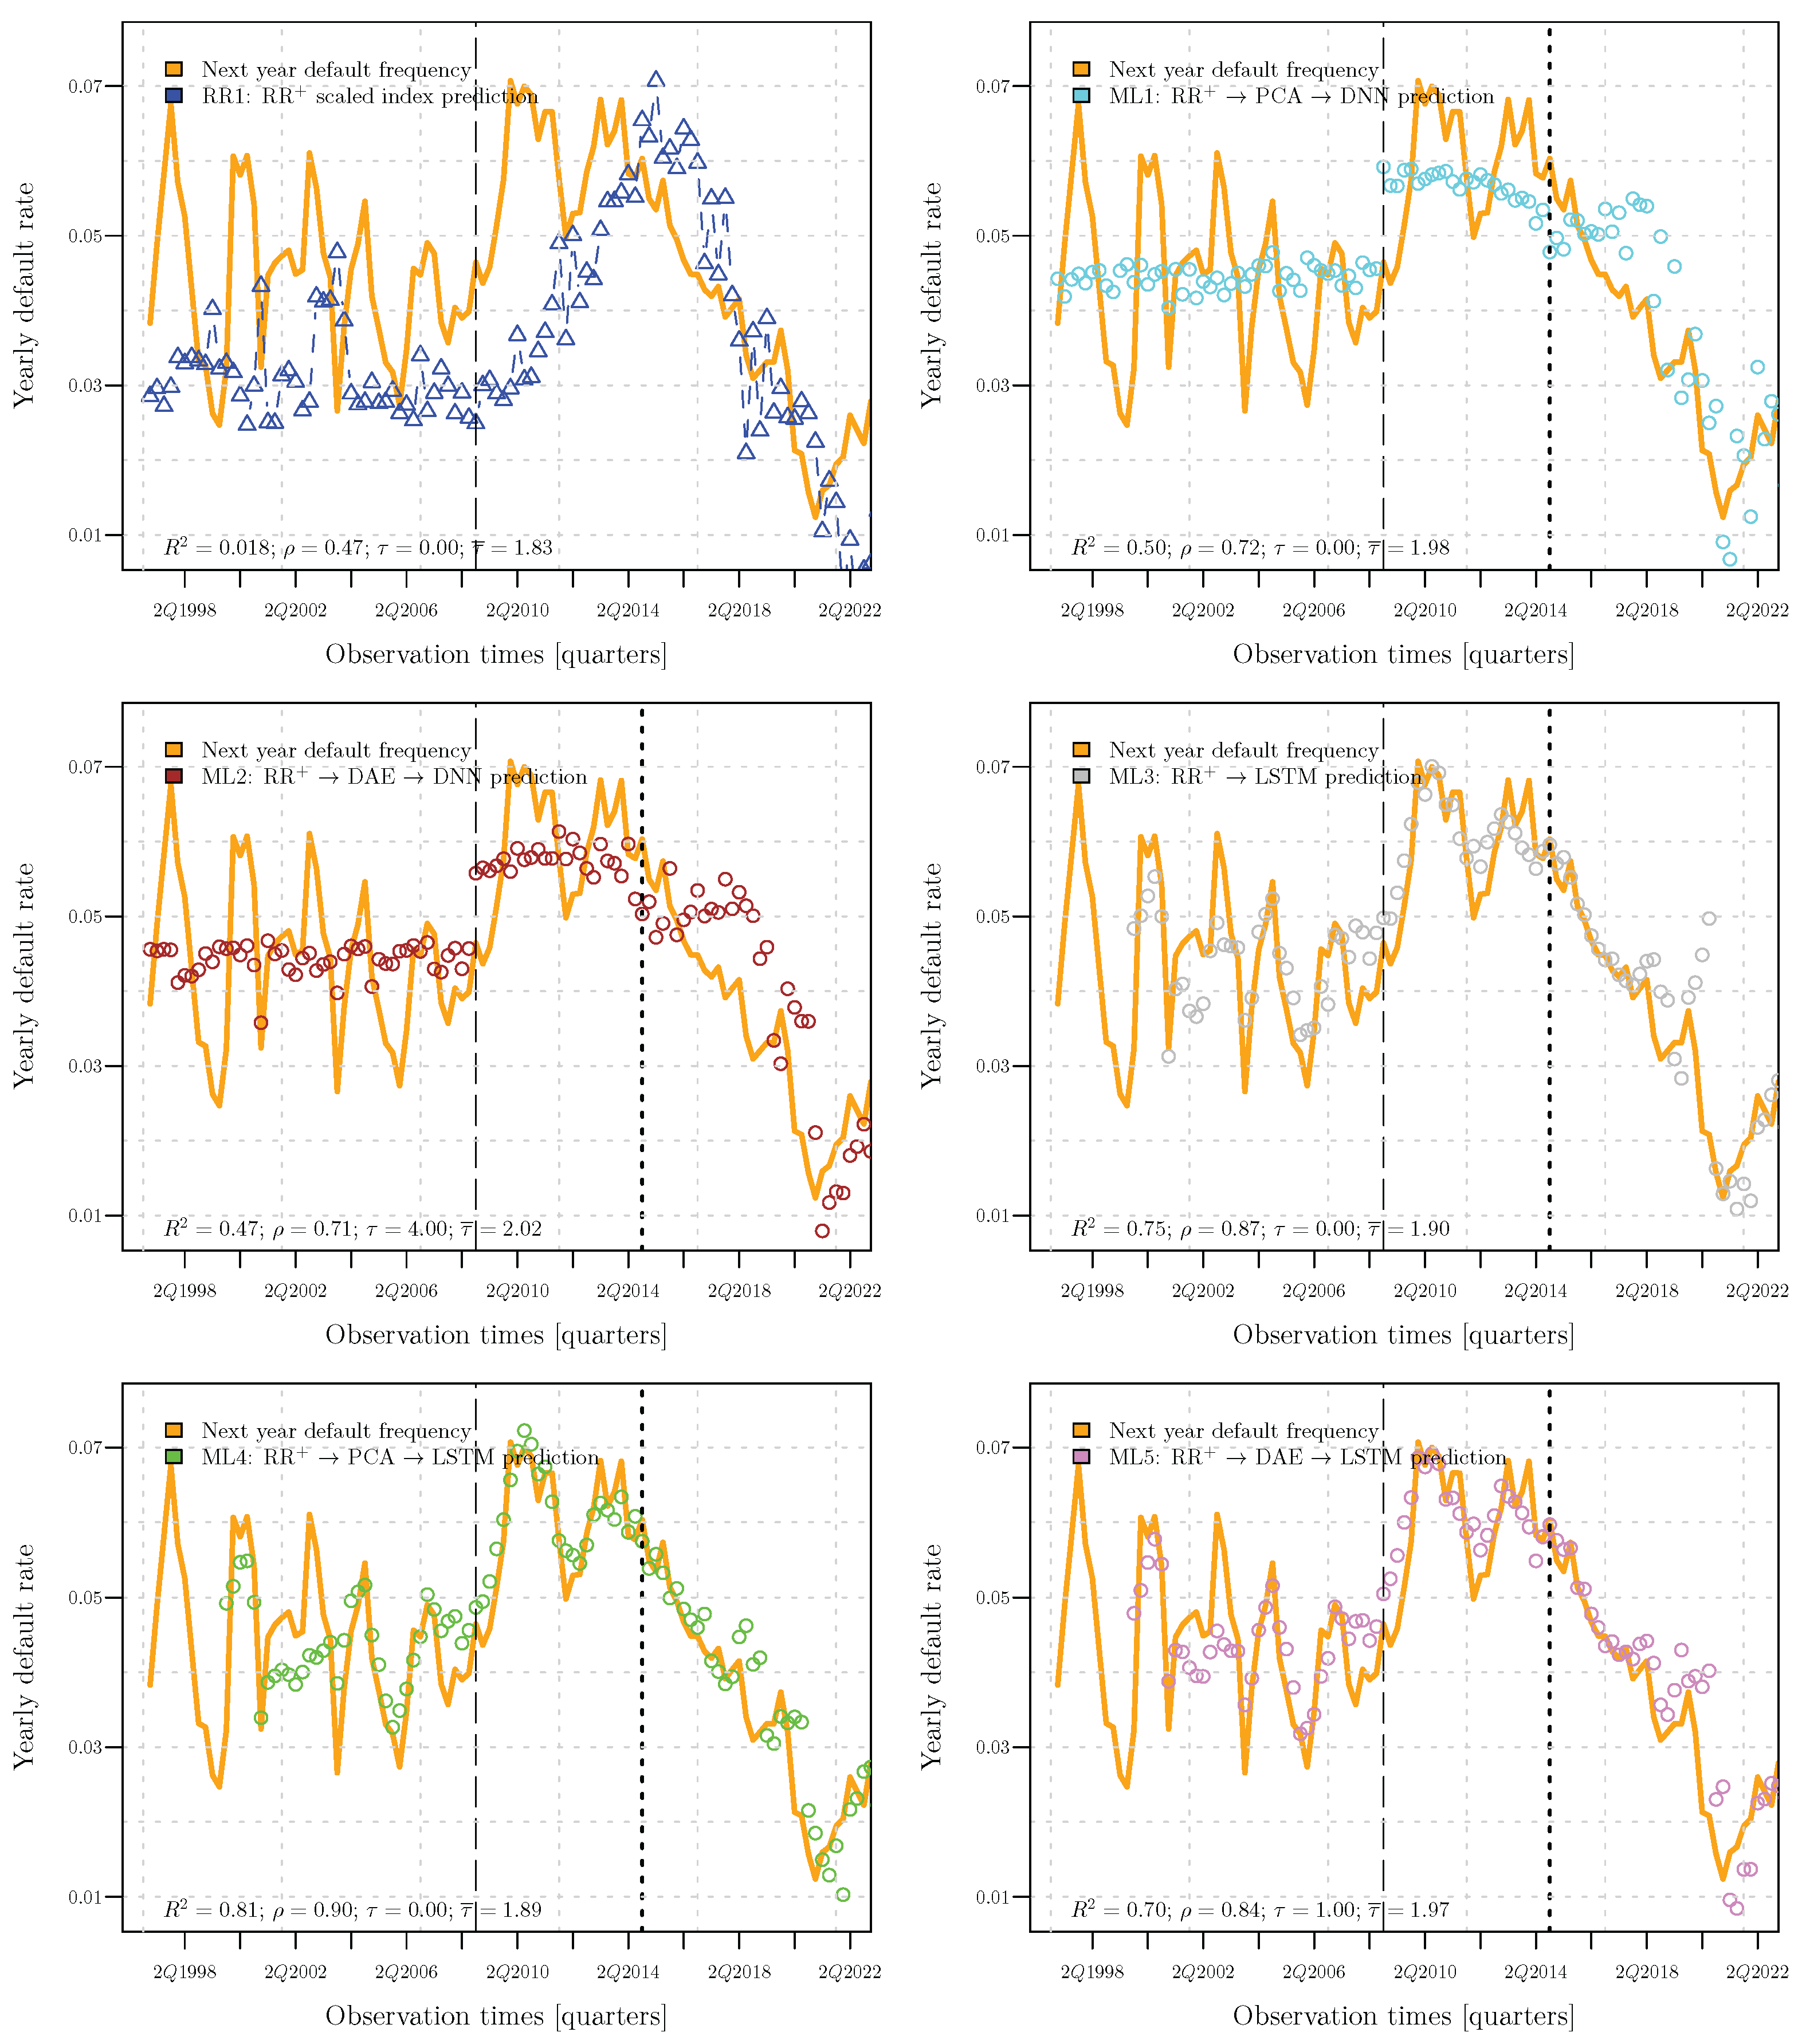
Figure 4 displays an example of the prediction performed by the six methods. In this case, ML4 outperforms the other methods. In particular, it is worth noting the high-quality forecast of the trend inversion that occurred in 2022, which can be explained as an indirect consequence of the macroeconomic effects following the Russo-Ukrainian war that started the same year. The four performance indicators are reported on each plot and result in good agreement with the graphical analysis.
Table 2 associates each examined sector with its most predictive model. In the vast majority of cases, the best architecture is ML4, coping with the results displayed in Figure 3, where the best performances are mainly associated with PCA-based and LSTM-based architectures. Nonetheless, each architecture results in being the best for at least one sector. Further, it is worth recalling the ambiguity between ML4 and ML3. Indeed, if  x ˜ returned after the feature selection phase has five or fewer components, 5-factor PCA is ineffective, and ML4 is equal to ML3. In Table 2, those cases have conventionally been attributed to ML4.
As stated above, finding the best architecture to solve the problem stated in Equation (21) is far beyond the aim of this work. We are especially interested in achieving adequate forecast quality for the majority of the considered economic sectors, thereby empirically demonstrating the feasibility of forecasting default rates just based on a reduced-form model and the information that the model utilizes. Table 2 serves this purpose, presenting the best model for each sector, along with its corresponding metrics. Most of the sectors display remarkable performance associated with the corresponding best method, demonstrating the practical feasibility of predicting default rates through a reduced-form model. The few industries where all the ML models exhibit poor predictive performance are characterized by peculiar behaviors that justify the obtained results. Sector 19 (“Manufacture of coke and refined petroleum products”) is weakly affected by exogenous events and almost uncorrelated with the other sectors. Furthermore, its default rate dynamics are highly volatile. The ML prediction tracks the moving-average trend well, but the strong local fluctuations in the industry default rates penalize the performance metrics. Further, Sector 26 (“Manufacture of computer, electronic, and optical products”) is scarcely sensitive to all the exogenous events preceding the quantitative easing, the latter provoking an abrupt and surprising decrease in default rates, far deeper than the average observed among the other sectors. Thus, the ML algorithms could not anticipate such unprecedented sensitivity. Finally, Sector B (“Mining and quarrying”) has the opposite behavior compared with Sector 19. Indeed, it is highly susceptible to all the events preceding the Russo-Ukrainian war, and then almost entirely insensitive to the last energetic crisis, whereas ML algorithms would expect an increase in default rates of this industry similar to those observed across other sectors given the formerly observed sensitivity.

3.3. Industrial Applications

The ability to accurately predict default rates within homogeneous clusters is relevant for many applications in finance and insurance. As the default rate is an estimator of the default probability, each context where a forward-looking estimate of default probability is needed, for practical or regulatory purposes, can significantly benefit from the proposed method.
A first example of an applicative context is credit scoring systems, commonly adopted by banks and other financial institutions. Although a credit scoring model aims to evaluate the specific creditworthiness of a given defaultable entity, the model typically embeds a probability-of-default curve (also “PD curve”) that needs to be calibrated, i.e., adjusted considering the average default probability level of the target population to be evaluated. The problem of calibrating the PD curve is thoroughly discussed in the literature (see, e.g., Tasche (2013) and Nehrebecka (2016)). Nonetheless, a universally accepted solution is currently lacking as the literature offers various approaches to PD curve calibration without a clear preference among them in terms of theoretical correctness. Given a target population, regardless of the specific method chosen to calibrate the PD curve, a reliable estimate of the considered population’s default probability is needed for the vast majority of techniques offered in the literature, implying the relevance of the method proposed in this work for the credit scoring context.
Furthermore, each industry where counterparties’ default probabilities play a non-negligible role in their financial statement can benefit from reliable forecasting of default rates occurring in the next financial year. The accounting standards IFRS 9 and IFRS 17 require the forward-looking estimation of default probabilities (IFRS 2025).
Without claiming completeness, we briefly discuss a toy pricing problem as a second relevant example of an applicative context where default probability forecasting is valuable. Let us consider a credit and suretyship insurance company selling protection against future insolvency events of defaultable small enterprises. Let C be the company’s sub-portfolio of entities belonging to the manufacturing sector (also “Sector C”—see the industry classification reported in Table A1). The following simplifications and assumptions are introduced. Each i-th entity in C underlies a distinct policy that is renewed yearly on 1 January, conditioned on the entity being solvent at the renewal date, and expires on 31 December. In case of an insolvency event, the i-th entity’s loss given default is 100 % of its notional exposure N i . Further, the same one-year default probability p C is associated with each entity belonging to C . The company prices each annuity according to the simplified approach displayed below and used inter alia in Giacomelli and Passalacqua (2021c) and Giacomelli (2023).
π i = p ^ C N i 1 c r
where c and r stand for the cost ratio and the target return, respectively, and  p ^ C ( t ) is an estimator of p C over the annuity interval ( t , t + 1 ] . Equation (25) implies that the total amount of yearly written premiums is
Π : = i C π i = p ^ C N 1 c r
where N : = i C N i is the overall C notional exposure.
In this example, we compare the effects of utilizing three distinct estimators of p C ( t ) : f ( t ) , the default rate observed for Sector C during the last year ( t 1 , t ] ; f ^ ( t ) , the default rate estimated over the next year ( t , t + 1 ] through the proposed model G C D C t ; and f + ( t ) , the ideal forecast, unfortunately not available for the company, which is equal to the actual default rate measured in t t + 1 over the interval ( t , t + 1 ] . The backward-looking price π i ( t ) , the forward-looking price π ^ i ( t ) , and the ideal price π i + ( t ) are obtained considering p ^ i f , f ^ , f + , respectively. Analogous notation Π ( t ) , Π ^ ( t ) , Π + ( t ) is introduced for the written premium amount.
Table 3 reports the results obtained per year by using the ML4 (see Table 2) forecast of “Sector C” default rate per year. Returns across the considered years are higher on average and less volatile when pricing is based on the forecasted default rate f ^ instead of the default rate observed from the previous year, f . In particular, the ML4 model is able to anticipate the default rate increase that is measured in 2022 and 2023, implying a loss reduction over those two years due to a higher pricing level.
Further, the measured variance of ( L + X ) / Π ^ is less than that of ( L + X ) / Π , implying a benefit in terms of lesser capital requirement for a company authorized to use the Undertaking Specific Parameters under the Solvency 2 regulatory framework (see, e.g., De Felice and Moriconi 2015).

4. Conclusions

This work investigated the feasibility and effectiveness of forecasting future default rates for a given population based on past time series of the same default rates per economic sector (or another categorical variable). Before applying any ML technique, the historical default rates are processed through a reduced-form model, thereby excluding any additional information concerning the market context. The recently developed RR+ model has been chosen as a suitable candidate for this purpose as the two distributions returned by the model per sector are obtained by jointly processing the multivariate dynamics of all the considered sectors and contain information concerning the future value of each sector’s default rate. Nonetheless, the model does not provide a clear framework for extracting such information, and the original work developed a heuristic approach solely to verify that the model exhibits some predictive capabilities.
In this work, the problem of efficient information retrieval regarding future default rate values has been addressed through a neural network approach. Thus, there is no need to explicitly extend the theoretical framework developed to date as the supervised machine learning algorithm looks for the implicit relation (if any) existing among the RR+ distributions and the future default rate values. The obtained results demonstrate that predicting default rates per sector through the RR+ model is feasible and effective.
As expected, the investigated methods have different predictive power depending on the industry considered. This result aligns with our intuition as the explanatory features are derived from a reduced-form model that considers past default rates only, while macroeconomic events—external to the considered system—can affect the dynamics of future default rates. Given that, the model can only infer the future default rates of a given sector by capturing the early signals hidden in the past default rate dynamics of that sector and the other considered sectors. Thus, the model cannot foresee the case of an instantaneous reaction of a sector to the evolution of the external macroeconomic context. On the other hand, possible early signals anticipating a trend change can be captured by the model and interpreted by the neural network, leading to predictive extrapolation that also considers the dependency structure among sectors, inferred by RR+.
To summarize, in this work, neural networks have been successfully applied as a “translator” of RR+ outputs, demonstrating that they embed information sufficient to forecast the future default rates of the majority of the economic sectors that constitute a given borrower population remarkably well.
The selection of the machine learning techniques considered in this work does not claim completeness, nor are the obtained predictions necessarily the best possible, even for the investigated dataset. Nonetheless, we have demonstrated the feasibility of predicting multivariate default rates through the combination of a portfolio reduced-form model and a set of neural network approaches. To the best of our knowledge, this approach is novel.
Indeed, our results show that, when exogenous shocks affect a national economy (e.g., regulatory changes, government actions, or macroeconomic consequences of external conflicts), their impact on the considered economy can be foreseen based on internal industry dynamics only, without explicitly modeling any macroeconomic dynamics. This is empirically proved to be possible by efficiently processing the information embedded in the local multivariate dynamics of industry default rates. In particular, the comparison between the current trend and volatility of default rates and the long-term through-the-cycle trend and volatility for each sector’s default rate provides information regarding the current “distance” of the contingent sector dynamics from historically observed recessionary crises or, conversely, expansionary phases. Furthermore, the dependency structure that governs the multivariate dynamics of all the industries within the same economy enables the transmission of phenomena first observed in a specific industry to others. In the proposed framework, the reduced-form model retrieves these two relevant pieces of information (i.e., current versus long-term dynamics and interdependency among industries), and the following machine learning model enables their complete interpretation in terms of future default rate forecasting.
The proposed framework opens up further investigations under different perspectives. First, it is worth investigating the selection of machine learning approaches to consider further in order to better understand which technique is most efficient in retrieving the information latent in the reduced-form model output and to what extent forecast precision can be improved. Furthermore, the same framework presented in this work can be applied to different default rate databases (e.g., investigating the economies of other countries or regions). Finally, as proposed in the conclusion of the paper presenting RR+, this framework could be applied to different contexts involving multivariate dynamics of absorbing events, such as epidemiology or herd dynamics.
The effectiveness of the proposed method was demonstrated by the quality of the numerical results presented in this work, which were obtained by applying the model to publicly available Italian default rates. The accuracy of the resulting industry-wise forecasts makes them of practical interest in their own right.   

Funding

This research received no external funding.

Conflicts of Interest

The author declares no conflicts of interest.

Appendix A. Further Specifications on the Dataset

The dataset considered in this work is publicly available in the Infostat database of the Bank of Italy. The considered data cube is labeled as TRI30529_35120163. The data cube comprises data from all the Italian enterprises that are borrowers from the Italian banking sector. Although no distinction is made with respect to enterprise size or credit line amount, the sample is mainly composed of SMEs. The observed default rates are computed by partitioning the borrowers’ population observed at the beginning of each quarter among the economic sectors listed in Table A1. Then, the ratio between the number of debtors that become insolvent during the quarter and the initial number of solvent debtors is computed quarterly and by sector. Further details concerning the definition of default utilized in computing the considered default rate time series are available in (Bank of Italy 2017).
Table A1. Economic sectors provided jointly to the RR+ model in the multivariate analysis of the Italian default rate time series.
Sector IDDescription
1000055Chemical products and pharmaceuticals
1000060Motor vehicles and other transport equipment
1000061Food, beverages, and tobacco products
1000062Textiles, clothing, and leather products
1000063Paper, paper products, and printing
1000065Other products of manufacturing (divisions 16, 32, and 33)
1000074All remaining activities (sections O P Q R S T)
1004999Total NACE except sector U
19Manufacture of coke and refined petroleum products
22Manufacture of rubber and plastic products
23Manufacture of other non-metallic mineral products
24Manufacture of basic metals
25Manufacture of fabricated metal products, except machinery and equipment
26Manufacture of computer, electronic, and optical products
27Manufacture of electrical equipment
28Manufacture of machinery and equipment n.e.c.
31Manufacture of furniture
61Telecommunications
AAgriculture, forestry, and fishing
BMining and quarrying
CManufacturing
DElectricity, gas, steam, and air conditioning supply
EWater supply, sewerage, waste management, and remediation activities
FConstruction
GWholesale and retail trade; repair of motor vehicles and motorcycles
HTransportation and storage
IAccommodation and food service activities
JInformation and communication
KFinancial and insurance activities
LReal estate activities
MProfessional, scientific, and technical activities
NAdministrative and support service activities

Appendix B. Further Specifications on the Model Calibration

In this section, the specifics of the model calibration are discussed regarding both the reduced-form model and the ML parts. All the estimators for the RR+ parameters not explicitly described in the following are available in Section 2.3 of (Giacomelli and Passalacqua 2024).
As mentioned in Section 2.3, calibrating this framework is an iterative process. Starting from t c RR , the RR+ model is recalibrated for each new quarterly observation of default rates
f ¯ t [ f 1 ( t δ , t ) , , f H ( t δ , t ) ]
utilizing all the observations available up to the reference date t t c RR .
It is worth highlighting that the RR+ iterative calibration does not restrict the available data with a moving window, nor are the data split into training and validation sets. Indeed, the reduced-form model’s parameters are calibrated only through closed-form estimators or by numerically solving convex optimization problems where the solution is uniquely determined, as fully disclosed in the paper where RR+ is proposed. Thus, there is no need to split the dataset as this would reduce the information available for parameter estimation. Further, an incremental dataset is chosen for subsequent calibrations instead of a moving window as the model is designed to generate point-in-time and through-the-cycle probability distributions. Indeed, there is no reason to discard valuable historical information that enables a more accurate calibration of the through-the-cycle distribution.
At each step, the calibration procedure automatically chooses K, potentially altering the dimension of the latent factor space every quarter. This option is chosen considering the pseudo-covariance matrix A R H × H , whose elements are defined as follows:
A h h : = 1 Q h Q h m cov λ h , λ h + 2 x = 1 m 1 ( m x ) cov λ h , λ h x ,
where λ h x ( t ) : = λ h ( t + x δ ) . The matrix A was first introduced in Giacomelli and Passalacqua (2021a) and then applied in Giacomelli and Passalacqua (2024) as well to retrieve the factor loading matrix Ω [ 0 , 1 ] H × K ( [ Ω ] h k ω h k for h = 1 H and k = 1 K ) and the variance matrix Σ : = diag ( σ 1 2 , , σ K 2 ) as the solution of a symmetric non-negative matrix factorization (SNMF) problem. K is chosen to approximately guarantee that the fraction of variance explained by the calibrated model is at least 99 % .
K = argmin k k = 1 k eig [ A ] 0.99 k = 1 H eig [ A ] ,
where the operator eig [ · ] returns the eigenvalues of a given matrix in descending order. In the specific setting presented in this work, we have 18 K 22 , implying a dimensionality reduction by 10 to 14 dimensions depending on the calibration reference date t. It is worth noting that different dimensions of the latent factor space across time do not alter the dimension of the model’s cross-sectional output D h t , whose components are all defined in the default probability space.
The RR+ calibration procedure converges to adequate estimates of the model parameters even through a small number of available observations. Empirically, 3 years of quarterly observations are enough to calibrate the model for practical purposes. Nonetheless, we aim to have equally negligible estimation errors across all calibrated RR+ instances in order to achieve homogeneous quality in the cumulative datasets D h t used by the subsequent ML models. Giacomelli and Passalacqua (2021a) (see proof of Theorem 3) show that the standard error of each estimated A h k element scales approximately as A h k / ( m · n 1 ) , where n is the number of observed years. Based on this result, and considering the large historical dataset available for the presented application, we chose t c RR such that RR+ is calibrated using at least 12 years of quarterly observed default rates.
Different considerations apply to the ML models considered in this work. Indeed, the dataset D h t available in t for calibrating ML1-5 models is actually partitioned into training and validation sets, with a proportion of 80% to 20% of the available observations. For DAE and DNN modules, which are cross-sectional, data is shuffled before being partitioned. On the other hand, shuffling is not considered for LSTM calibration as each observation belonging to either the training or validation set is defined by applying a 3-year moving window to D h t . Given the slower convergence of training for these models, we have chosen t c NN 6 years longer than t c RR . Like the RR+ calibration, the ML model calibration is also repeated each quarter t, considering the results of the last calibration as the initial conditions of the optimization algorithm.
For each h-th industry, the resulting “ RR + + ML ” calibrated framework is then utilized for the out-of-sample forecast of f ^ h t before adding the t + δ cross-section of observed default rates and repeating the calibration process.
The overall RR+ calibration process is outlined in the pseudocode reported below.
Algorithm A1 RR+ calibration with information filtered in t
  • Require:  f ¯ h t for each ( h , t ) { 1 , , H } × { 0 , , t } given t t c RR .
  • Ensure: Estimates of
    • the parameter set { Q , Σ , Ω , ρ } [ 0 , 1 ] H × D K × [ 0 , 1 ] H K × [ 0 , 1 ] K ;
    • the latent factor array γ ¯ R + K , inferred in t δ .
1:
for  h { 1 H }  do
2:
     λ h [ ln ( 1 f ¯ h 0 ) , , ln ( 1 f ¯ h t ) ]
3:
     Q h m · λ h t
4:
end for
5:
Compute A ^                         ▹ See Equation (A1)
6:
Choose K                         ▹ See Equation (A2)
7:
if  t t c RR  then
8:
    Initialize SNMF with Ω t 1 , Σ t 1
9:
else
10:
    Initialize SNMF randomly
11:
end if
12:
Ω t , Σ t SNMF ( A ^ )
13:
ρ argmin r [ 0 , 1 ] K diag Ω t T Σ t diag [ ξ 2 ( r ) ] Ω t 1 m var λ    ▹ See Equations (2) and (4)
14:
     ▹Notation depending on context: diag : R N D N and diag : D N R N
15:
γ ¯ argmin g R + K Q h m ω h 0 + k = 1 K ω h k g k λ h ( t δ )
16:
Component-wise notation: ω h k Ω t h k , and ω 0 k is computed according to Equation (5)
After generating D h t through the calibrated RR+ model, PCA is calibrated, DAE, DNN, and LSTM are trained, and the ML1-5 models are built.

References

  1. Bank of Italy. 2017. Non-Performing Loans (NPLs) in Italy’s Banking System. Available online: https://www.bancaditalia.it/media/approfondimenti/2017/npl/ (accessed on 27 June 2025).
  2. Bhatore, Siddharth, Lalit Mohan, and Y. Raghu Reddy. 2020. Machine learning techniques for credit risk evaluation: A systematic literature review. Journal of Banking and Financial Technology 4: 111–38. [Google Scholar] [CrossRef]
  3. Credit Suisse First Boston. 1998. CreditRisk+, A Credit Risk Management Framework. London: Credit Suisse First Boston. [Google Scholar]
  4. Crouhy, Michel, Dan Galai, and Robert Mark. 2000. A comparative analysis of current credit risk models. Journal of Banking & Finance 24: 59–117. [Google Scholar] [CrossRef]
  5. De Felice, Massimo, and Franco Moriconi. 2015. Sulla stima degli Undertaking Specific Parameters e la verifica delle ipotesi—Versione aggiornata. Working papers of the Department of Economics University of Perugia. Working paper No. 16, November 2015. ISSN 2385-2275. Available online: https://econ.unipg.it/files/generale/wp_2015/WP_16_2015_DeFelice_Moriconi_Versioneagg.pdf (accessed on 16 July 2025).
  6. Farazi, Zahidur Rahman. 2024. Evaluating the impact of AI and blockchain on credit risk mitigation: A predictive analytic approach using machine learning. International Journal of Science and Research Archive 13: 575–82. [Google Scholar] [CrossRef]
  7. Giacomelli, Jacopo. 2023. The Rating Scale Paradox: An Application to the Solvency 2 Framework. Standards 3: 356–72. [Google Scholar] [CrossRef]
  8. Giacomelli, Jacopo, and Luca Passalacqua. 2021a. Calibrating Credit. Model Differ. Time Scales Presence Temporal Autocorrelation. Mathematics 9: 1679. [Google Scholar] [CrossRef]
  9. Giacomelli, Jacopo, and Luca Passalacqua. 2021b. Improved precision in calibrating CreditRisk+ model for Credit Insurance applications. In Mathematical and Statistical Methods for Actuarial Sciences and Finance—eMAF 2020. Berlin/Heidelberg: Springer International Publishing. [Google Scholar] [CrossRef]
  10. Giacomelli, Jacopo, and Luca Passalacqua. 2021c. Unsustainability Risk of Bid Bonds in Public Tenders. Mathematics 9: 2385. [Google Scholar] [CrossRef]
  11. Giacomelli, Jacopo, and Luca Passalacqua. 2024. RecessionRisk+: A Novel Recession Risk Model with Applications to the Solvency II Framework and Recession Crises Forecasting. Mathematics 12: 3747. [Google Scholar] [CrossRef]
  12. Glasserman, Paul, and Jingyi Li. 2005. Importance sampling for Portfolio credit risk. Management Science 51: 1643–56. [Google Scholar] [CrossRef]
  13. Gundlach, Matthias, and Frank Lehrbass, eds. 2004. CreditRisk+ in the Banking Industry. Berlin/Heidelberg: Springer. [Google Scholar]
  14. Huang, Zhenzhen, and Yue Kuen Kwok. 2021. Efficient Risk Measures Calculations for Generalized CreditRisk+ models. International Journal of Theoretical and Applied Finance 24: 2150012. [Google Scholar] [CrossRef]
  15. IFRS Accounting Standards Navigator. 2025. Available online: https://www.ifrs.org/issued-standards/list-of-standards/ (accessed on 16 July 2025).
  16. Jakob, Kevin. 2022. Estimating correlation parameters in credit portfolio models under time-varying and nonhomogeneous default probabilities. Journal of Credit Risk 18: 29–63. [Google Scholar] [CrossRef]
  17. Joe, Harry. 1997. Multivariate Models and Dependence Concepts. Boca Raton: Chapman and Hall/CRC. [Google Scholar]
  18. J.P. Morgan & Co., Inc. 1997. Introduction to CreditMetricsTM. New York: J.P. Morgan & Co., Inc. [Google Scholar]
  19. Klugman, Stuart A., Harry H. Panjer, and Gordon E. Willmot. 2012. Loss Models: From Data to Decisions. Hoboken: Wiley. [Google Scholar]
  20. Laporta, Alessandro G., Susanna Levantesi, and Lea Petrella. 2025. A neural network approach for pricing correlated health risks. Risks 13: 82. [Google Scholar] [CrossRef]
  21. Li, David X. 2000. On Default Correlation: A Copula Function Approach. Journal of Fixed Income 9: 43–54. [Google Scholar] [CrossRef]
  22. Lindholm, Mathias, and Lina Palmborg. 2022. Efficient use of data for LSTM mortality forecasting. European Actuarial Journal 12: 749–78. [Google Scholar] [CrossRef]
  23. Liu, Zhonghua, Shuang Zhang, and Chaohui Xie. 2024. Research on Measuring Default Risk of Internet Microloans Based on the CreditRisk+ Model. Paper presented at ICCSMT ’24—2024 5th International Conference on Computer Science and Management Technology, Xiamen, China, October 18–20; pp. 668–673. [Google Scholar] [CrossRef]
  24. Mai, Jan-Frederik, and Matthias Scherer. 2017. Simulating Copulas: Stochastic Models, Sampling Algorithms, and Applications, 2nd ed. Singapore: World Scientific Publishing Company. [Google Scholar]
  25. McNeil, Alexander, Rüdiger Frey, and Paul Embrechts. 2015. Quantitative Risk Management. Princeton: Princeton University Press. [Google Scholar]
  26. Miyata, Akihiro, and Naoki Matsuyama. 2022. Extending the Lee–Carter Model with Variational Autoencoder: A Fusion of Neural Network and Bayesian Approach. ASTIN Bulletin 52: 789–812. [Google Scholar] [CrossRef]
  27. Nehrebecka, Natalia. 2016. Probability-of-default curve calibration and validation of the internal rating systems. Paper presented at IFC Biennial Basel Conference, Basel, Switzerland, September 8–9; Available online: https://www.bis.org/ifc/events/ifc_8thconf/ifc_8thconf_4c4pap.pdf (accessed on 16 July 2025).
  28. Nelsen, Roger B. 1999. Introduction to Copulas, 1st ed. Berlin/Heidelberg: Springer. [Google Scholar]
  29. Nigri, Andrea, Susanna Levantesi, and Mario Marino. 2021. Life expectancy and lifespan disparity forecasting: A long short-term memory approach. Scandinavian Actuarial Journal 2: 110–33. [Google Scholar] [CrossRef]
  30. Nigri, Andrea, Susanna Levantesi, Mario Marino, Salvatore Scognamiglio, and Francesca Perla. 2019. A Deep Learning Integrated Lee–Carter Model. Risks 7: 33. [Google Scholar] [CrossRef]
  31. Panjer, Harry H. 1988. Recursive Evaluation of a Family of Compound Distributions. ASTIN Bulletin 12: 22–26. [Google Scholar] [CrossRef]
  32. Perla, Francesca, Ronald Richman, Salvatore Scognamiglio, and Mario V. Wüthrich. 2021. Time-series forecasting of mortality rates using deep learning. Scandinavian Actuarial Journal 7: 572–98. [Google Scholar] [CrossRef]
  33. RiskMetrics Group, Inc. 2007. CreditMetricsTM—Technical Document. New York: RiskMetrics Group. [Google Scholar]
  34. Shi, Si, Rita Tse, Wuman Luo, Stefano D’Addona, and Giovanni Pau. 2022. Machine learning-driven credit risk: A systemic review. Neural Computing and Applications 34: 14327–39. [Google Scholar] [CrossRef]
  35. Sklar, Abe. 1951. Fonctions de Répartition à n Dimensions et Leurs Marges. Paris: Institut Statistique de l’Université de Paris, vol. 8, pp. 229–31. [Google Scholar]
  36. Tasche, Dirk. 2013. The art of probability-of-default curve calibration. Journal of Credit Risk 9: 63–103. [Google Scholar] [CrossRef]
  37. Vandendorpe, Antoine, Ngoc-Diep Ho, Steven Vanduffel, and Paul Van Dooren. 2008. On the parameterization of the CreditRisk+ model for estimating credit portfolio risk. Insurance: Mathematics and Economics 42: 736–45. [Google Scholar] [CrossRef]
  38. Vasicek, Oldrich A. 1987. Probability of Loss on Loan Portfolio. Document Number 999-0000-056. New York: KMV Corporation, (Since 2011, the document has been disclosed among the Moody’s Analytics white papers). [Google Scholar]
  39. Vasicek, Oldrich A. 1991. Limiting Loan Loss Probability Distribution. Document Number 999-0000-046. New York: KMV Corporation, (Since 2011, the document has been disclosed among the Moody’s Analytics white papers). [Google Scholar]
  40. Vasicek, Oldrich A. 2002. The distribution of Loan Portfolio value. Risk 15: 160–62. [Google Scholar]
  41. Wilde, Tom. 2010. CreditRisk+. In Encyclopedia of Quantitative Finance. Hoboken: John Wiley & Sons. [Google Scholar]
  42. Wilson, Thomas C. 1997a. Portf. Credit Risk, I. Risk 10: 111–17. [Google Scholar]
  43. Wilson, Thomas C. 1997b. Portf. Credit Risk, II. Risk 10: 56–61. [Google Scholar]
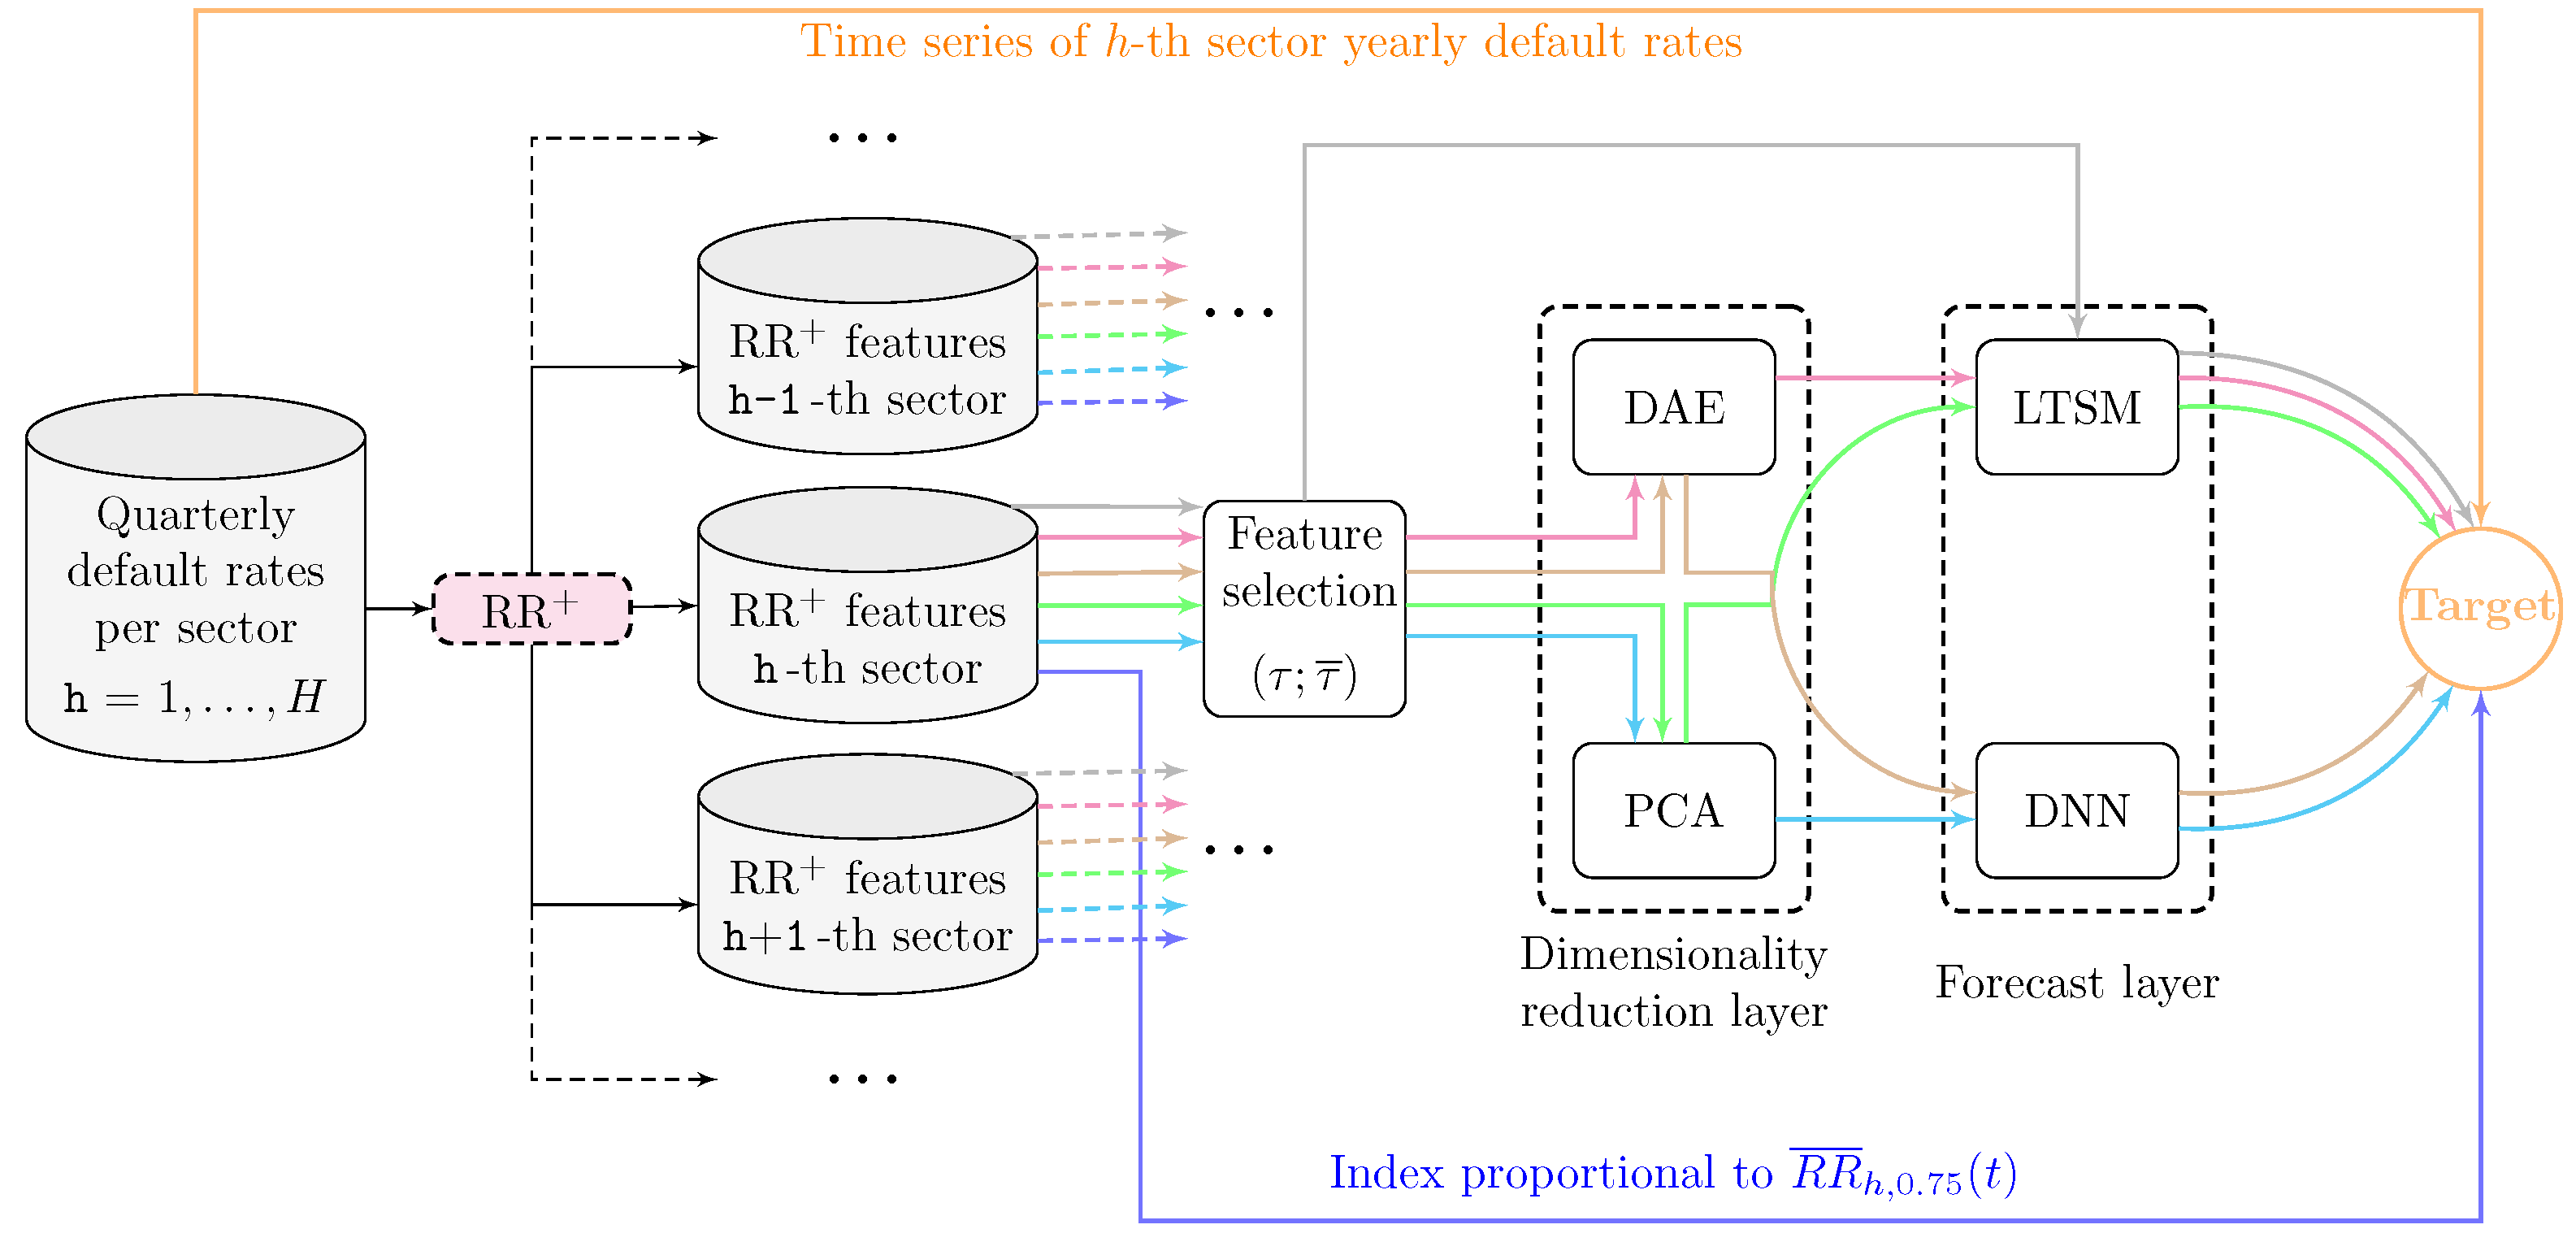
Figure 1. Schematics of the integration between RecessionRisk+ model and the tested machine learning techniques.
Risks 13 00151 g001
Figure 2. Italian quarterly default frequency time series observed over 28 years from 1996 to 2024. The series comprises Italian SMEs from all economic sectors.
Risks 13 00151 g002
Figure 3. Comparison among the performances obtained through the six alternative techniques investigated in this work.
Risks 13 00151 g003
Figure 4. Examples of the predictions obtained by applying each of the alternative techniques considered. The vertical dashed line marks the end t c RR of the period utilized for the first calibration of R R + . The vertical dotted line marks the end t c NN of the period considered for the first calibration of each ML technique investigated in this work. Each model application beyond these lines is preceded by fine-tuning of the calibration based on the incremental dataset up to the quarter before the prediction. The specific sector displayed in the graphics is “Telecommunications”.
Risks 13 00151 g004
Table 1. Summary of the considered ML strategies to handle the problem in Equation (21).
StrategyFeature SelectionDimensionality ReductionForecast
RR1 R R ¯ h , 0.75 ( t ) only feature selected.None G h ( D h t ) = α R R ¯ h , 0.75 ( t ) + β
ML1Applied Equation (24)PCADNN
ML2Applied Equation (24)DAEDNN
ML3Applied Equation (24)NoneLSTM
ML4Applied Equation (24)PCALSTM
ML5Applied Equation (24)DAELSTM
Table 2. Best forecasting model per economic sector and its performance indicators.
Sector IDBest ML R 2 ρ τ τ ¯
1000055ML40.8020.89811.954
1000060ML40.8220.91101.954
1000061ML20.7000.84422.017
1000062ML50.6880.83632.037
1000063ML40.9000.94911.964
1000065ML40.9250.96301.945
1000074ML40.8240.91601.923
1004999ML10.8070.90122.004
19ML10.2830.56601.673
22ML40.7140.84921.991
23ML40.9470.97501.975
24ML50.8630.93011.951
25ML40.8880.94211.978
26ML40.1010.46642.093
27ML40.7210.85411.988
28ML40.8560.92711.959
31ML40.9520.97601.959
61ML40.8060.90001.893
AML40.8620.93511.937
BML40.4000.67932.030
CML40.9230.96411.950
DML20.1980.44722.059
EML40.7470.87321.990
FML10.8630.93011.994
GML10.7660.87922.008
HML40.9260.96311.969
IML40.9260.96311.969
JML30.8040.90321.999
KML40.8650.93511.956
LML40.9750.98811.976
MML40.8820.94111.965
NML40.9450.97311.964
Table 3. Comparison between C returns per year (2020–2024) and backward- and forward-looking pricing. It is assumed that c = 30 % , r = 10 % , and N = 100 .
VariableDescription20202021202220232024
f Backward-looking estimator of one-year default probability0.0180.0120.0100.0120.018
f ^ Forward-looking estimator of one-year default probability0.0160.0160.0120.0140.019
f + Ideal estimator of one-year default probability0.0120.0100.0120.0180.017
L : = f + N Total cash-out due to claims received during the year1.2291.0211.2091.7731.668
X : = c Π + Total expenses paid during the year0.6150.5110.6040.8860.834
Π L X Profit/loss obtained with backward-looking pricing1.1820.516−0.111−0.6440.453
Π ^ L X Profit/loss obtained with forward-looking pricing0.8301.2000.138−0.3150.630
Disclaimer/Publisher’s Note: The statements, opinions and data contained in all publications are solely those of the individual author(s) and contributor(s) and not of MDPI and/or the editor(s). MDPI and/or the editor(s) disclaim responsibility for any injury to people or property resulting from any ideas, methods, instructions or products referred to in the content.