AI-Powered Reduced-Form Model for Default Rate Forecasting
Abstract
1. Introduction
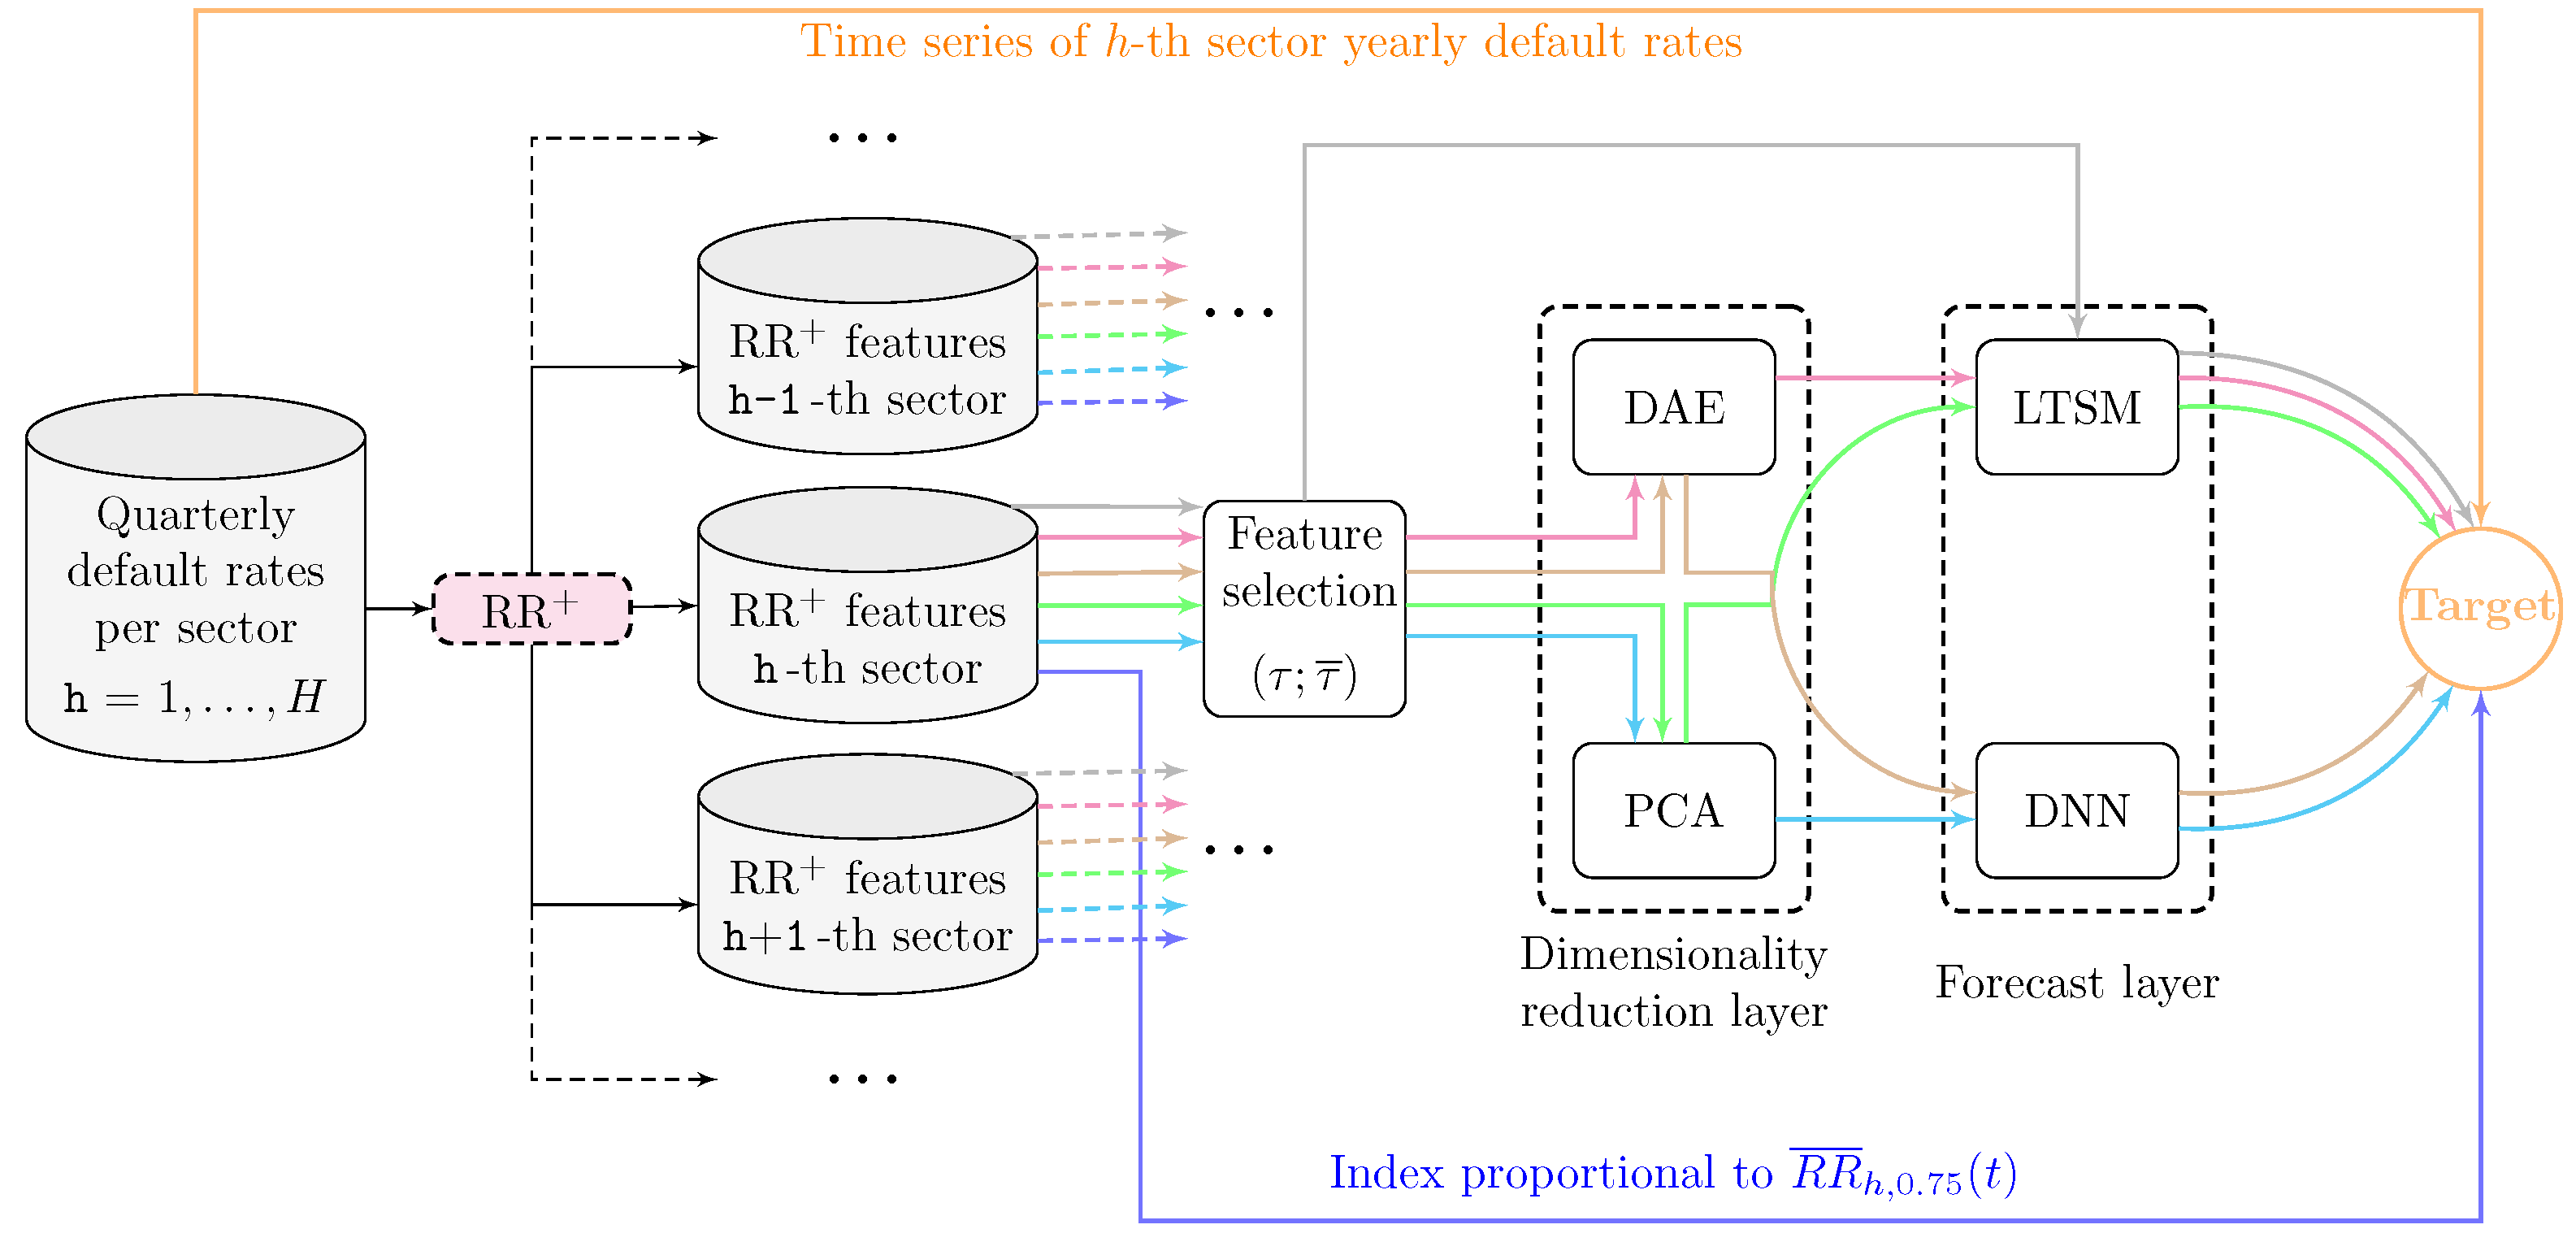
2. Models and Methods
2.1. The RecessionRisk+ Model
2.2. The Model Output as Features of a Nonlinear Regression Problem
2.3. Selected Machine Learning Techniques
3. Numerical Application
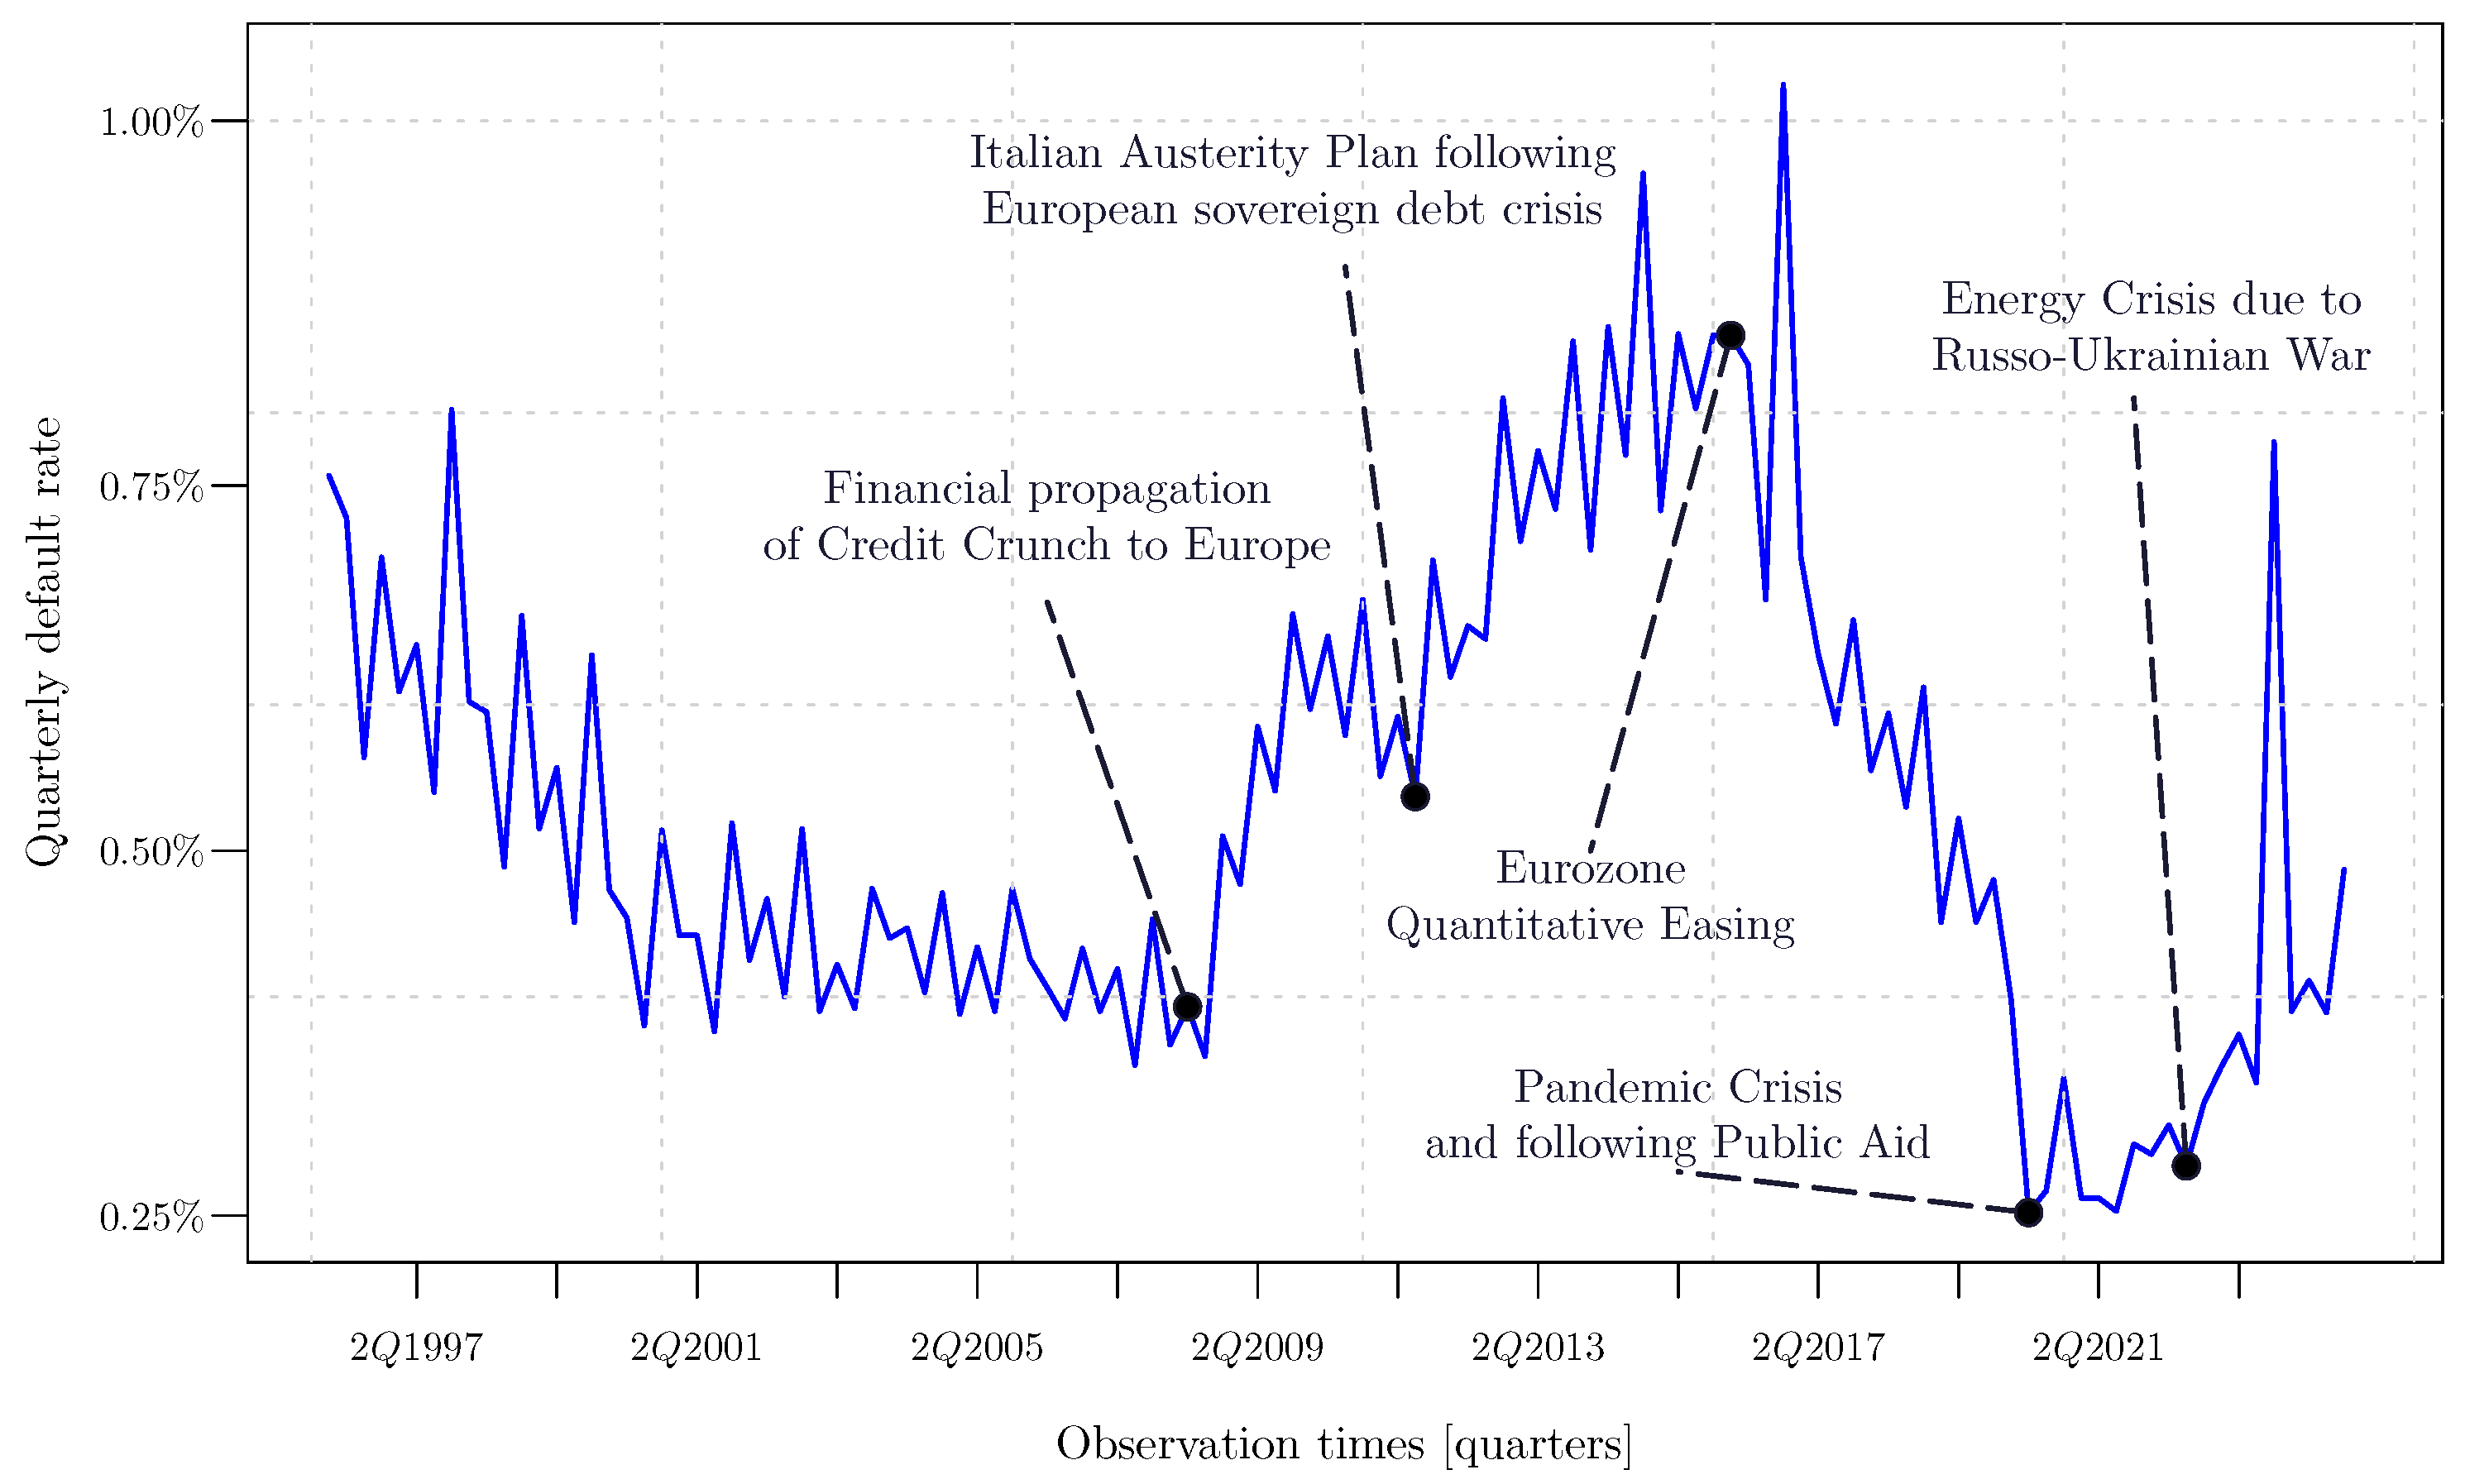
3.1. The Italian Default Rate Time Series
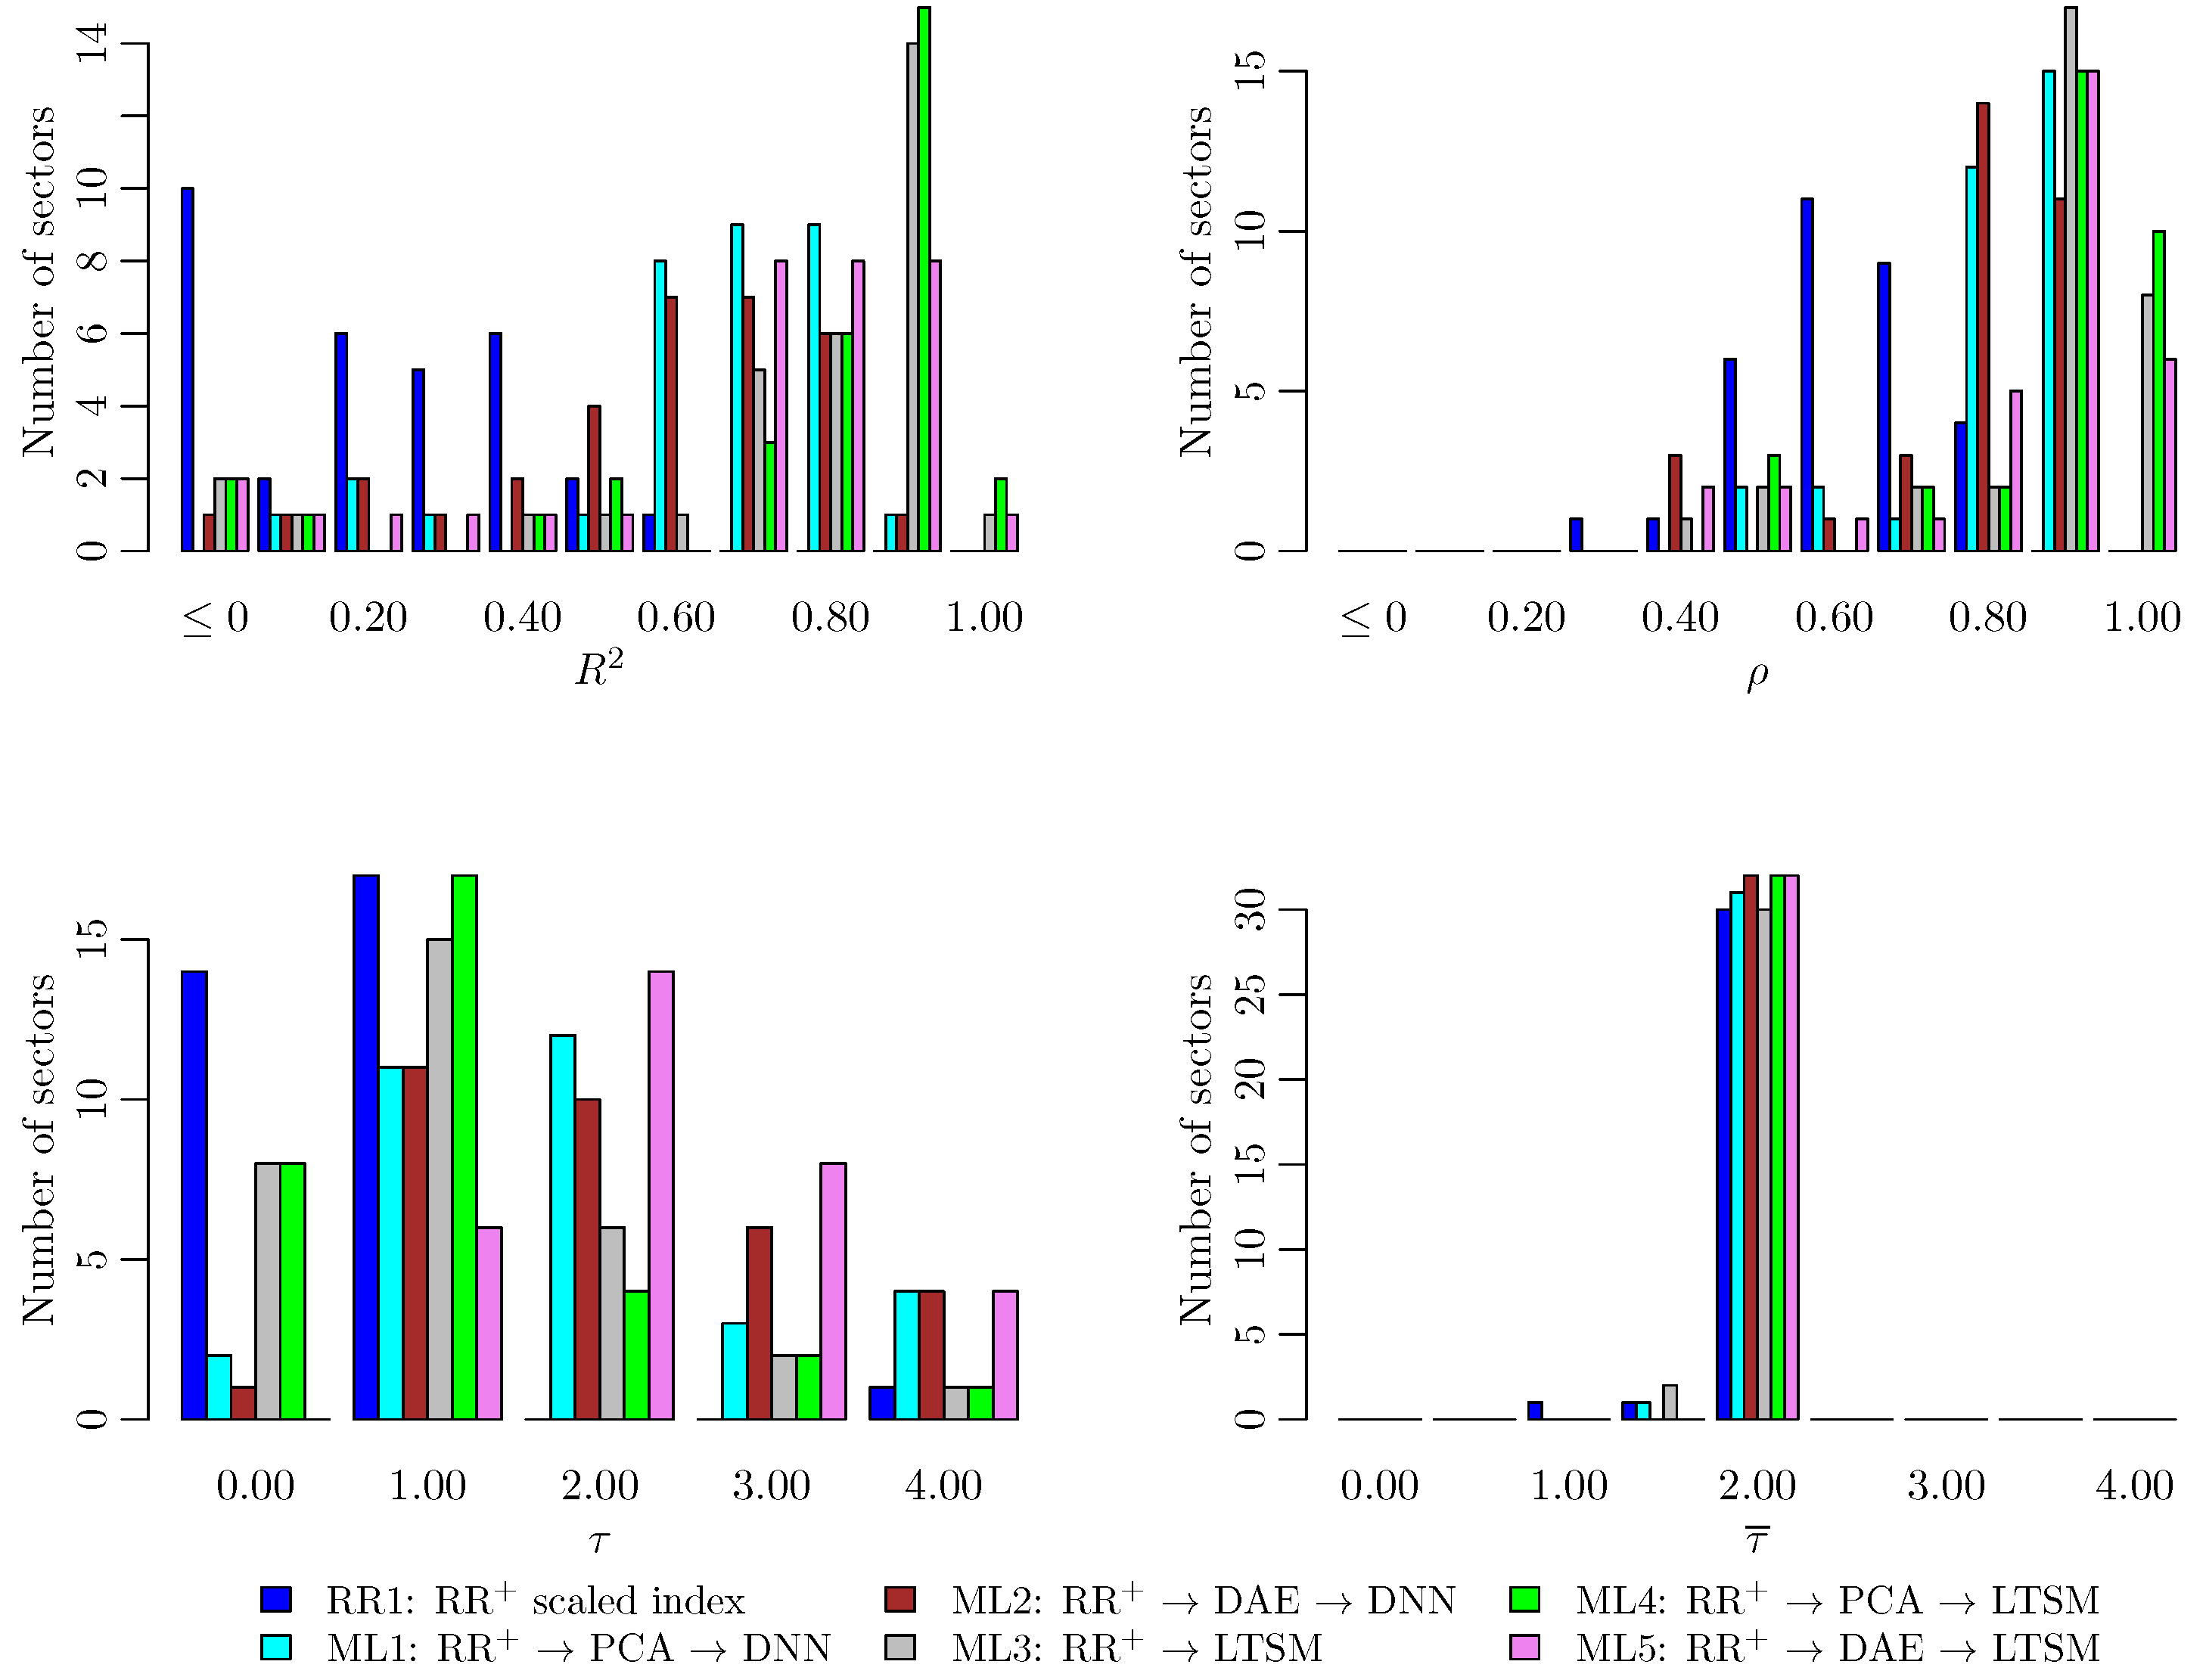
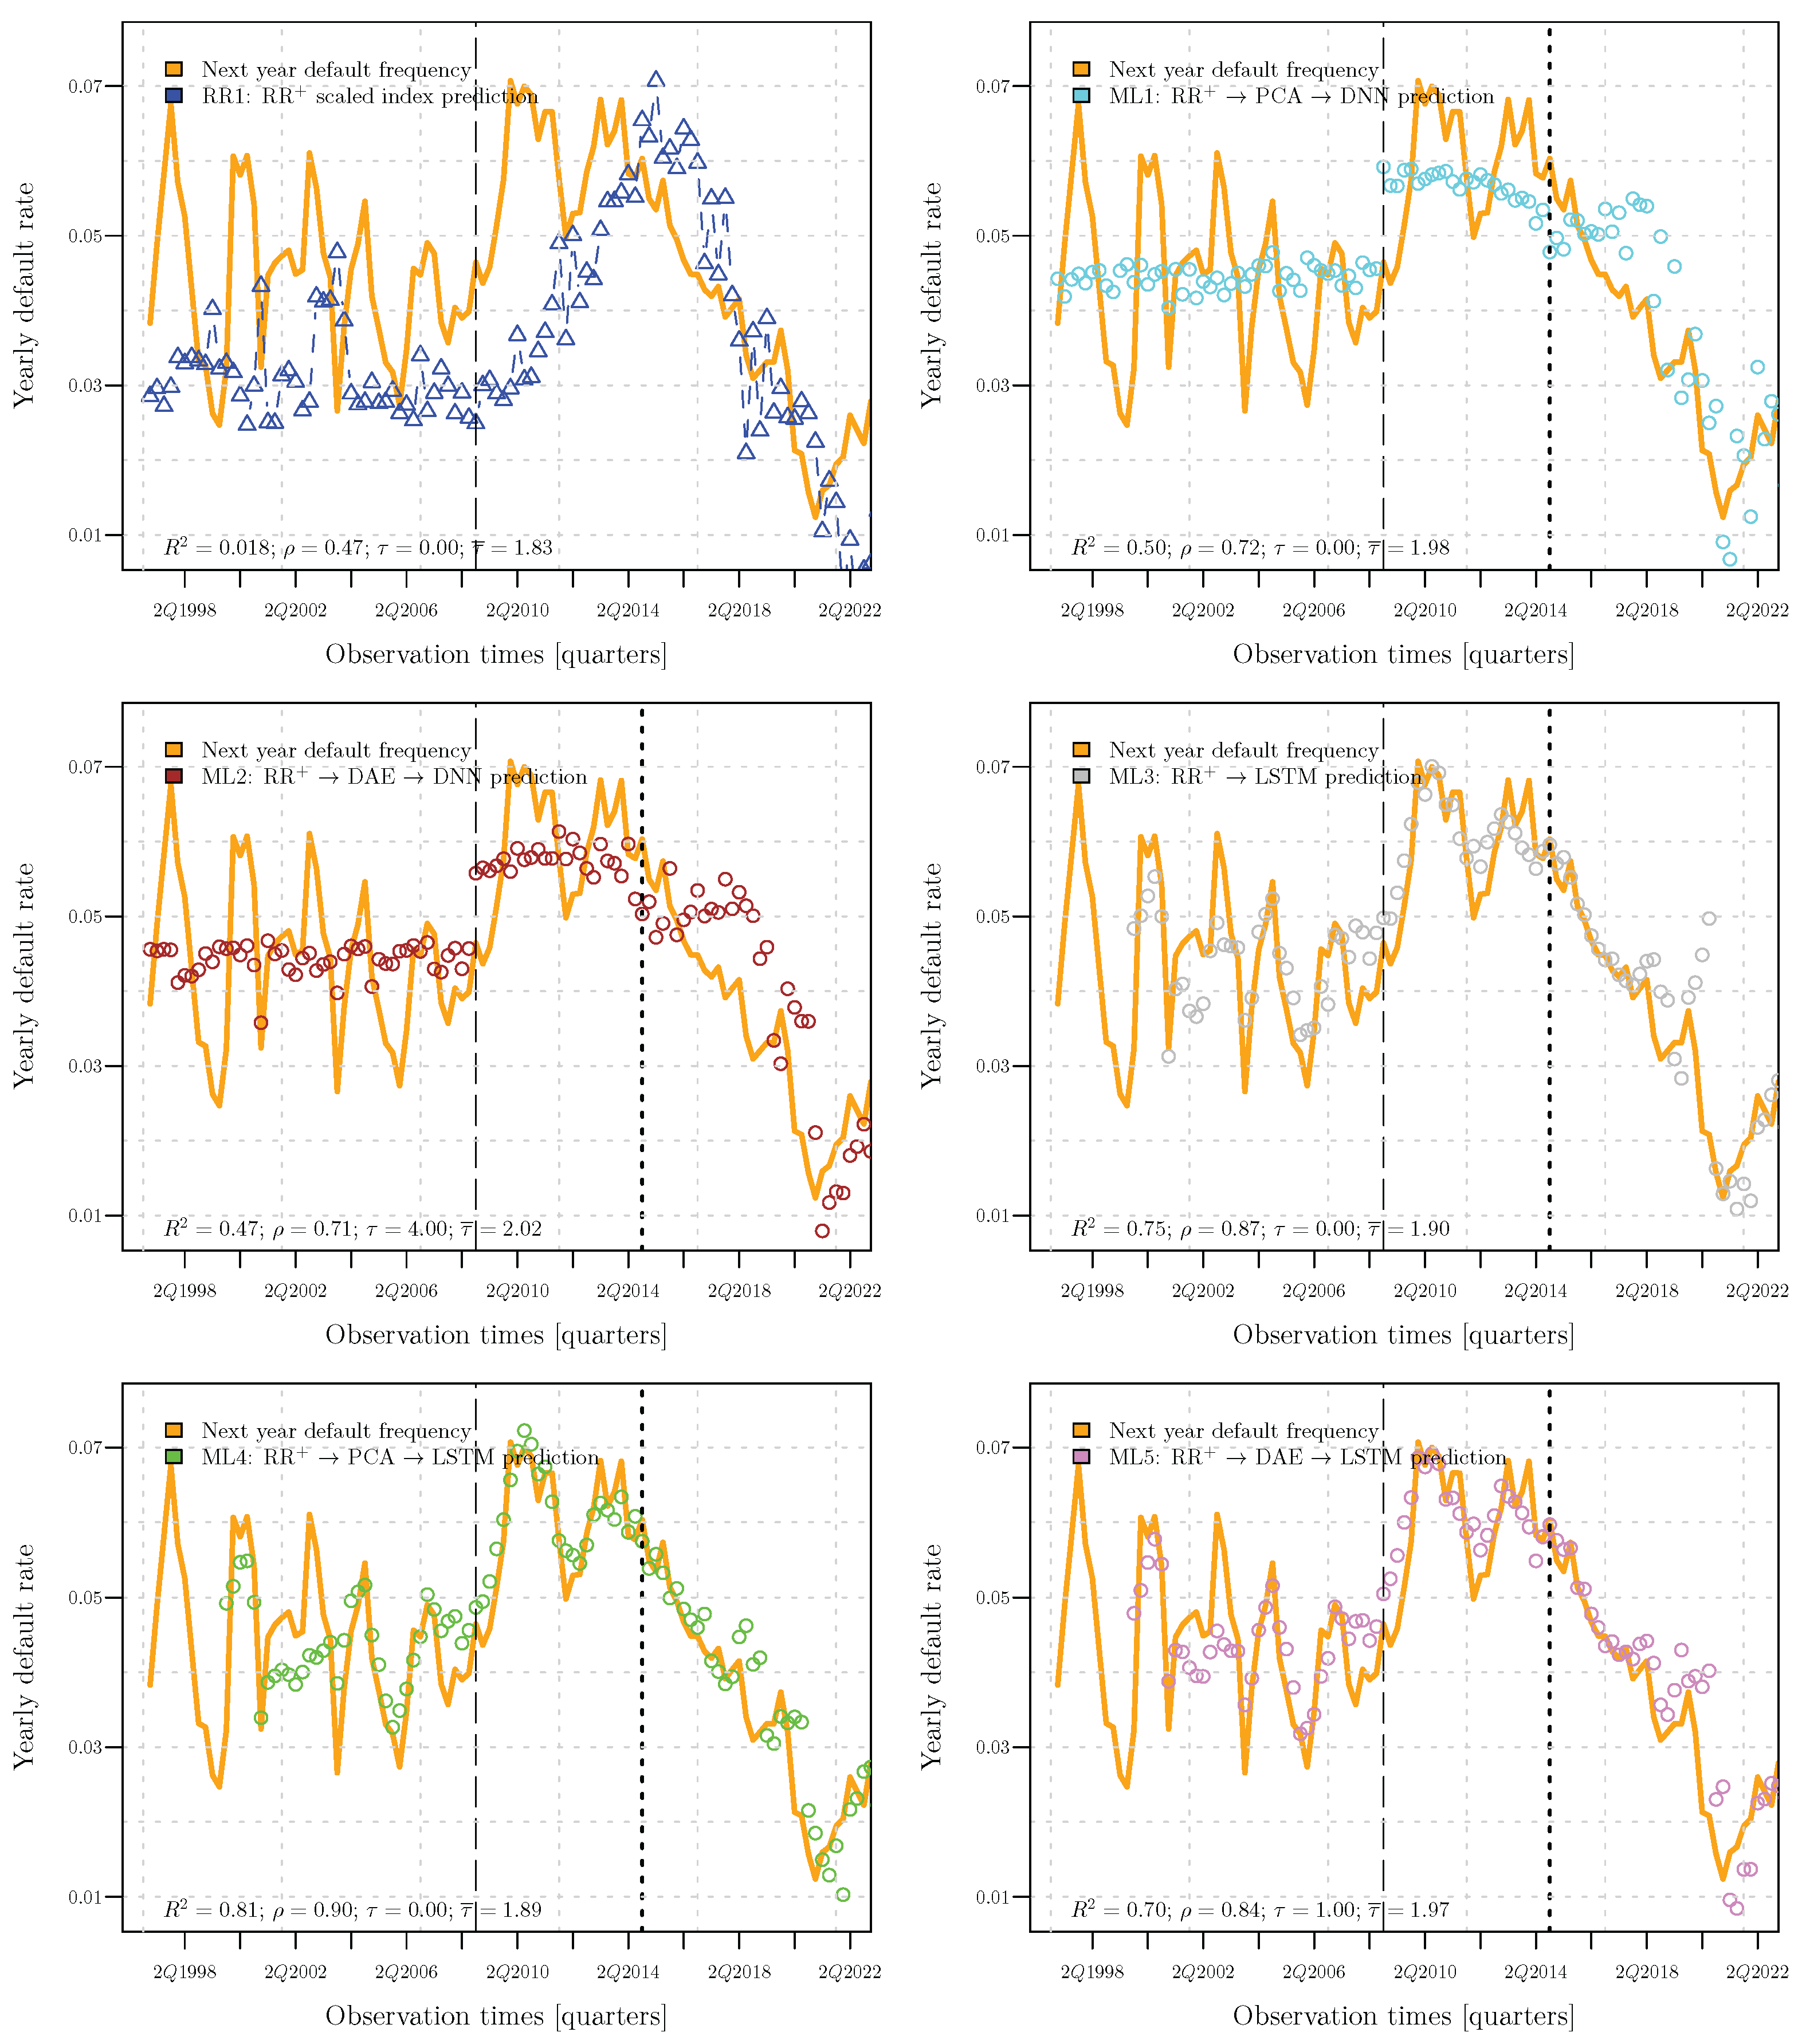
3.2. Comparison Among the Forecasts
3.3. Industrial Applications
4. Conclusions
Funding
Data Availability Statement
Conflicts of Interest
Correction Statement
Appendix A. Further Specifications on the Dataset
| Sector ID | Description |
|---|---|
| 1000055 | Chemical products and pharmaceuticals |
| 1000060 | Motor vehicles and other transport equipment |
| 1000061 | Food, beverages, and tobacco products |
| 1000062 | Textiles, clothing, and leather products |
| 1000063 | Paper, paper products, and printing |
| 1000065 | Other products of manufacturing (divisions 16, 32, and 33) |
| 1000074 | All remaining activities (sections O P Q R S T) |
| 1004999 | Total NACE except sector U |
| 19 | Manufacture of coke and refined petroleum products |
| 22 | Manufacture of rubber and plastic products |
| 23 | Manufacture of other non-metallic mineral products |
| 24 | Manufacture of basic metals |
| 25 | Manufacture of fabricated metal products, except machinery and equipment |
| 26 | Manufacture of computer, electronic, and optical products |
| 27 | Manufacture of electrical equipment |
| 28 | Manufacture of machinery and equipment n.e.c. |
| 31 | Manufacture of furniture |
| 61 | Telecommunications |
| A | Agriculture, forestry, and fishing |
| B | Mining and quarrying |
| C | Manufacturing |
| D | Electricity, gas, steam, and air conditioning supply |
| E | Water supply, sewerage, waste management, and remediation activities |
| F | Construction |
| G | Wholesale and retail trade; repair of motor vehicles and motorcycles |
| H | Transportation and storage |
| I | Accommodation and food service activities |
| J | Information and communication |
| K | Financial and insurance activities |
| L | Real estate activities |
| M | Professional, scientific, and technical activities |
| N | Administrative and support service activities |
Appendix B. Further Specifications on the Model Calibration
| Algorithm A1 RR+ calibration with information filtered in t |
|
References
- Bank of Italy. 2017. Non-Performing Loans (NPLs) in Italy’s Banking System. Available online: https://www.bancaditalia.it/media/approfondimenti/2017/npl/ (accessed on 27 June 2025).
- Bhatore, Siddharth, Lalit Mohan, and Y. Raghu Reddy. 2020. Machine learning techniques for credit risk evaluation: A systematic literature review. Journal of Banking and Financial Technology 4: 111–38. [Google Scholar] [CrossRef]
- Credit Suisse First Boston. 1998. CreditRisk+, A Credit Risk Management Framework. London: Credit Suisse First Boston. [Google Scholar]
- Crouhy, Michel, Dan Galai, and Robert Mark. 2000. A comparative analysis of current credit risk models. Journal of Banking & Finance 24: 59–117. [Google Scholar] [CrossRef]
- De Felice, Massimo, and Franco Moriconi. 2015. Sulla stima degli Undertaking Specific Parameters e la verifica delle ipotesi—Versione aggiornata. Working papers of the Department of Economics University of Perugia. Working paper No. 16, November 2015. ISSN 2385-2275. Available online: https://econ.unipg.it/files/generale/wp_2015/WP_16_2015_DeFelice_Moriconi_Versioneagg.pdf (accessed on 16 July 2025).
- Farazi, Zahidur Rahman. 2024. Evaluating the impact of AI and blockchain on credit risk mitigation: A predictive analytic approach using machine learning. International Journal of Science and Research Archive 13: 575–82. [Google Scholar] [CrossRef]
- Giacomelli, Jacopo. 2023. The Rating Scale Paradox: An Application to the Solvency 2 Framework. Standards 3: 356–72. [Google Scholar] [CrossRef]
- Giacomelli, Jacopo, and Luca Passalacqua. 2021a. Calibrating Credit. Model Differ. Time Scales Presence Temporal Autocorrelation. Mathematics 9: 1679. [Google Scholar] [CrossRef]
- Giacomelli, Jacopo, and Luca Passalacqua. 2021b. Improved precision in calibrating CreditRisk+ model for Credit Insurance applications. In Mathematical and Statistical Methods for Actuarial Sciences and Finance—eMAF 2020. Berlin/Heidelberg: Springer International Publishing. [Google Scholar] [CrossRef]
- Giacomelli, Jacopo, and Luca Passalacqua. 2021c. Unsustainability Risk of Bid Bonds in Public Tenders. Mathematics 9: 2385. [Google Scholar] [CrossRef]
- Giacomelli, Jacopo, and Luca Passalacqua. 2024. RecessionRisk+: A Novel Recession Risk Model with Applications to the Solvency II Framework and Recession Crises Forecasting. Mathematics 12: 3747. [Google Scholar] [CrossRef]
- Glasserman, Paul, and Jingyi Li. 2005. Importance sampling for Portfolio credit risk. Management Science 51: 1643–56. [Google Scholar] [CrossRef]
- Gundlach, Matthias, and Frank Lehrbass, eds. 2004. CreditRisk+ in the Banking Industry. Berlin/Heidelberg: Springer. [Google Scholar]
- Huang, Zhenzhen, and Yue Kuen Kwok. 2021. Efficient Risk Measures Calculations for Generalized CreditRisk+ models. International Journal of Theoretical and Applied Finance 24: 2150012. [Google Scholar] [CrossRef]
- IFRS Accounting Standards Navigator. 2025. Available online: https://www.ifrs.org/issued-standards/list-of-standards/ (accessed on 16 July 2025).
- Jakob, Kevin. 2022. Estimating correlation parameters in credit portfolio models under time-varying and nonhomogeneous default probabilities. Journal of Credit Risk 18: 29–63. [Google Scholar] [CrossRef]
- Joe, Harry. 1997. Multivariate Models and Dependence Concepts. Boca Raton: Chapman and Hall/CRC. [Google Scholar]
- J.P. Morgan & Co., Inc. 1997. Introduction to CreditMetricsTM. New York: J.P. Morgan & Co., Inc. [Google Scholar]
- Klugman, Stuart A., Harry H. Panjer, and Gordon E. Willmot. 2012. Loss Models: From Data to Decisions. Hoboken: Wiley. [Google Scholar]
- Laporta, Alessandro G., Susanna Levantesi, and Lea Petrella. 2025. A neural network approach for pricing correlated health risks. Risks 13: 82. [Google Scholar] [CrossRef]
- Li, David X. 2000. On Default Correlation: A Copula Function Approach. Journal of Fixed Income 9: 43–54. [Google Scholar] [CrossRef]
- Lindholm, Mathias, and Lina Palmborg. 2022. Efficient use of data for LSTM mortality forecasting. European Actuarial Journal 12: 749–78. [Google Scholar] [CrossRef]
- Liu, Zhonghua, Shuang Zhang, and Chaohui Xie. 2024. Research on Measuring Default Risk of Internet Microloans Based on the CreditRisk+ Model. Paper presented at ICCSMT ’24—2024 5th International Conference on Computer Science and Management Technology, Xiamen, China, October 18–20; pp. 668–673. [Google Scholar] [CrossRef]
- Mai, Jan-Frederik, and Matthias Scherer. 2017. Simulating Copulas: Stochastic Models, Sampling Algorithms, and Applications, 2nd ed. Singapore: World Scientific Publishing Company. [Google Scholar]
- McNeil, Alexander, Rüdiger Frey, and Paul Embrechts. 2015. Quantitative Risk Management. Princeton: Princeton University Press. [Google Scholar]
- Miyata, Akihiro, and Naoki Matsuyama. 2022. Extending the Lee–Carter Model with Variational Autoencoder: A Fusion of Neural Network and Bayesian Approach. ASTIN Bulletin 52: 789–812. [Google Scholar] [CrossRef]
- Nehrebecka, Natalia. 2016. Probability-of-default curve calibration and validation of the internal rating systems. Paper presented at IFC Biennial Basel Conference, Basel, Switzerland, September 8–9; Available online: https://www.bis.org/ifc/events/ifc_8thconf/ifc_8thconf_4c4pap.pdf (accessed on 16 July 2025).
- Nelsen, Roger B. 1999. Introduction to Copulas, 1st ed. Berlin/Heidelberg: Springer. [Google Scholar]
- Nigri, Andrea, Susanna Levantesi, and Mario Marino. 2021. Life expectancy and lifespan disparity forecasting: A long short-term memory approach. Scandinavian Actuarial Journal 2: 110–33. [Google Scholar] [CrossRef]
- Nigri, Andrea, Susanna Levantesi, Mario Marino, Salvatore Scognamiglio, and Francesca Perla. 2019. A Deep Learning Integrated Lee–Carter Model. Risks 7: 33. [Google Scholar] [CrossRef]
- Panjer, Harry H. 1988. Recursive Evaluation of a Family of Compound Distributions. ASTIN Bulletin 12: 22–26. [Google Scholar] [CrossRef]
- Perla, Francesca, Ronald Richman, Salvatore Scognamiglio, and Mario V. Wüthrich. 2021. Time-series forecasting of mortality rates using deep learning. Scandinavian Actuarial Journal 7: 572–98. [Google Scholar] [CrossRef]
- RiskMetrics Group, Inc. 2007. CreditMetricsTM—Technical Document. New York: RiskMetrics Group. [Google Scholar]
- Shi, Si, Rita Tse, Wuman Luo, Stefano D’Addona, and Giovanni Pau. 2022. Machine learning-driven credit risk: A systemic review. Neural Computing and Applications 34: 14327–39. [Google Scholar] [CrossRef]
- Sklar, Abe. 1951. Fonctions de Répartition à n Dimensions et Leurs Marges. Paris: Institut Statistique de l’Université de Paris, vol. 8, pp. 229–31. [Google Scholar]
- Tasche, Dirk. 2013. The art of probability-of-default curve calibration. Journal of Credit Risk 9: 63–103. [Google Scholar] [CrossRef]
- Vandendorpe, Antoine, Ngoc-Diep Ho, Steven Vanduffel, and Paul Van Dooren. 2008. On the parameterization of the CreditRisk+ model for estimating credit portfolio risk. Insurance: Mathematics and Economics 42: 736–45. [Google Scholar] [CrossRef]
- Vasicek, Oldrich A. 1987. Probability of Loss on Loan Portfolio. Document Number 999-0000-056. New York: KMV Corporation, (Since 2011, the document has been disclosed among the Moody’s Analytics white papers). [Google Scholar]
- Vasicek, Oldrich A. 1991. Limiting Loan Loss Probability Distribution. Document Number 999-0000-046. New York: KMV Corporation, (Since 2011, the document has been disclosed among the Moody’s Analytics white papers). [Google Scholar]
- Vasicek, Oldrich A. 2002. The distribution of Loan Portfolio value. Risk 15: 160–62. [Google Scholar]
- Wilde, Tom. 2010. CreditRisk+. In Encyclopedia of Quantitative Finance. Hoboken: John Wiley & Sons. [Google Scholar]
- Wilson, Thomas C. 1997a. Portf. Credit Risk, I. Risk 10: 111–17. [Google Scholar]
- Wilson, Thomas C. 1997b. Portf. Credit Risk, II. Risk 10: 56–61. [Google Scholar]


| Strategy | Feature Selection | Dimensionality Reduction | Forecast |
|---|---|---|---|
| RR1 | only feature selected. | None | |
| ML1 | Applied Equation (24) | PCA | DNN |
| ML2 | Applied Equation (24) | DAE | DNN |
| ML3 | Applied Equation (24) | None | LSTM |
| ML4 | Applied Equation (24) | PCA | LSTM |
| ML5 | Applied Equation (24) | DAE | LSTM |
| Sector ID | Best ML | ||||
|---|---|---|---|---|---|
| 1000055 | ML4 | 0.802 | 0.898 | 1 | 1.954 |
| 1000060 | ML4 | 0.822 | 0.911 | 0 | 1.954 |
| 1000061 | ML2 | 0.700 | 0.844 | 2 | 2.017 |
| 1000062 | ML5 | 0.688 | 0.836 | 3 | 2.037 |
| 1000063 | ML4 | 0.900 | 0.949 | 1 | 1.964 |
| 1000065 | ML4 | 0.925 | 0.963 | 0 | 1.945 |
| 1000074 | ML4 | 0.824 | 0.916 | 0 | 1.923 |
| 1004999 | ML1 | 0.807 | 0.901 | 2 | 2.004 |
| 19 | ML1 | 0.283 | 0.566 | 0 | 1.673 |
| 22 | ML4 | 0.714 | 0.849 | 2 | 1.991 |
| 23 | ML4 | 0.947 | 0.975 | 0 | 1.975 |
| 24 | ML5 | 0.863 | 0.930 | 1 | 1.951 |
| 25 | ML4 | 0.888 | 0.942 | 1 | 1.978 |
| 26 | ML4 | 0.101 | 0.466 | 4 | 2.093 |
| 27 | ML4 | 0.721 | 0.854 | 1 | 1.988 |
| 28 | ML4 | 0.856 | 0.927 | 1 | 1.959 |
| 31 | ML4 | 0.952 | 0.976 | 0 | 1.959 |
| 61 | ML4 | 0.806 | 0.900 | 0 | 1.893 |
| A | ML4 | 0.862 | 0.935 | 1 | 1.937 |
| B | ML4 | 0.400 | 0.679 | 3 | 2.030 |
| C | ML4 | 0.923 | 0.964 | 1 | 1.950 |
| D | ML2 | 0.198 | 0.447 | 2 | 2.059 |
| E | ML4 | 0.747 | 0.873 | 2 | 1.990 |
| F | ML1 | 0.863 | 0.930 | 1 | 1.994 |
| G | ML1 | 0.766 | 0.879 | 2 | 2.008 |
| H | ML4 | 0.926 | 0.963 | 1 | 1.969 |
| I | ML4 | 0.926 | 0.963 | 1 | 1.969 |
| J | ML3 | 0.804 | 0.903 | 2 | 1.999 |
| K | ML4 | 0.865 | 0.935 | 1 | 1.956 |
| L | ML4 | 0.975 | 0.988 | 1 | 1.976 |
| M | ML4 | 0.882 | 0.941 | 1 | 1.965 |
| N | ML4 | 0.945 | 0.973 | 1 | 1.964 |
| Variable | Description | 2020 | 2021 | 2022 | 2023 | 2024 |
|---|---|---|---|---|---|---|
| Backward-looking estimator of one-year default probability | 0.018 | 0.012 | 0.010 | 0.012 | 0.018 | |
| Forward-looking estimator of one-year default probability | 0.016 | 0.016 | 0.012 | 0.014 | 0.019 | |
| Ideal estimator of one-year default probability | 0.012 | 0.010 | 0.012 | 0.018 | 0.017 | |
| Total cash-out due to claims received during the year | 1.229 | 1.021 | 1.209 | 1.773 | 1.668 | |
| Total expenses paid during the year | 0.615 | 0.511 | 0.604 | 0.886 | 0.834 | |
| Profit/loss obtained with backward-looking pricing | 1.182 | 0.516 | −0.111 | −0.644 | 0.453 | |
| Profit/loss obtained with forward-looking pricing | 0.830 | 1.200 | 0.138 | −0.315 | 0.630 |
Disclaimer/Publisher’s Note: The statements, opinions and data contained in all publications are solely those of the individual author(s) and contributor(s) and not of MDPI and/or the editor(s). MDPI and/or the editor(s) disclaim responsibility for any injury to people or property resulting from any ideas, methods, instructions or products referred to in the content. |
© 2025 by the author. Licensee MDPI, Basel, Switzerland. This article is an open access article distributed under the terms and conditions of the Creative Commons Attribution (CC BY) license (https://creativecommons.org/licenses/by/4.0/).
Share and Cite
Giacomelli, J. AI-Powered Reduced-Form Model for Default Rate Forecasting. Risks 2025, 13, 151. https://doi.org/10.3390/risks13080151
Giacomelli J. AI-Powered Reduced-Form Model for Default Rate Forecasting. Risks. 2025; 13(8):151. https://doi.org/10.3390/risks13080151
Chicago/Turabian StyleGiacomelli, Jacopo. 2025. "AI-Powered Reduced-Form Model for Default Rate Forecasting" Risks 13, no. 8: 151. https://doi.org/10.3390/risks13080151
APA StyleGiacomelli, J. (2025). AI-Powered Reduced-Form Model for Default Rate Forecasting. Risks, 13(8), 151. https://doi.org/10.3390/risks13080151


