Article

Navigating Risk in Crypto Markets: Connectedness and Strategic Allocation

by
Nader Naifar
Department of Finance, College of Business, Imam Mohammad Ibn Saud Islamic University (IMSIU), Riyadh 11564, Saudi Arabia
Risks 2025, 13(8), 141; https://doi.org/10.3390/risks13080141
Submission received: 23 May 2025 / Revised: 18 July 2025 / Accepted: 18 July 2025 / Published: 23 July 2025
(This article belongs to the Special Issue Cryptocurrency Pricing and Trading)

Abstract

This study examined the dynamic interconnectedness and portfolio implications within the cryptocurrency ecosystem, focusing on five representative digital assets across the core functional categories: Layer 1 cryptocurrencies (Bitcoin (BTC) and Ethereum (ETH)), decentralized finance (Uniswap (UNI)), stablecoins (Dai), and crypto infrastructure tokens (Maker (MKR)). Using the Extended Joint Connectedness Approach within a Time-Varying Parameter VAR framework, the analysis captured time-varying spillovers of return shocks and revealed a heterogeneous structure of systemic roles. Stablecoins consistently acted as net absorbers of shocks, reinforcing their defensive profile, while governance tokens, such as MKR, emerged as persistent net transmitters of systemic risk. Foundational assets like BTC and ETH predominantly absorbed shocks, contrary to their perceived dominance. These systemic roles were further translated into portfolio design, where connectedness-aware strategies, particularly the Minimum Connectedness Portfolio, demonstrated superior performance relative to traditional variance-based allocations, delivering enhanced risk-adjusted returns and resilience during stress periods. By linking return-based systemic interdependencies with practical asset allocation, the study offers a unified framework for understanding and managing crypto network risk. The findings carry practical relevance for portfolio managers, algorithmic strategy developers, and policymakers concerned with financial stability in digital asset markets.

1. Introduction

The rapid evolution of the cryptocurrency market has transformed global finance, challenging conventional risk frameworks and prompting new questions around portfolio construction and systemic stability. As digital assets mature into a distinct and investable asset class, institutional and retail investors are increasingly drawn to their potential for high returns, diversification, and technological disruption. However, the structural diversity of the crypto ecosystem, spanning foundational Layer 1 blockchains (e.g., BTC, ETH), decentralized finance (DeFi) tokens (e.g., UNI), algorithmic stablecoins (e.g., Dai), and governance infrastructure tokens (e.g., MKR), complicates risk assessment and asset allocation decisions. This study sought to bridge these two challenges by examining how return-based systemic interdependencies influence both risk propagation and optimal portfolio strategies.
This study was motivated by the growing institutionalization of digital assets and the need to understand how systemic risk propagates within the cryptocurrency ecosystem. Recent crises such as the collapses of Terra-LUNA (Lee et al. 2023; Santiago et al. 2025; Briola et al. 2023) and FTX (Bouri et al. 2023; Khan et al. 2025; Esparcia et al. 2024) exposed latent fragilities in crypto markets and sparked significant liquidity stress, volatility, and contagion effects. These events undermined investor confidence and highlighted the limitations of traditional risk measures in capturing crypto-specific dynamics (Barkai et al. 2024). Notably, the idiosyncratic reactions of different asset types, e.g., stablecoins acting as temporary safe havens (Łęt et al. 2023; Hoang et al. 2024) or Ethereum’s growing role in DeFi and non-fungible tokens (NFTs) post-COVID-19 (Katsiampa et al. 2022), emphasize the need for asset-specific and dynamic analysis.
Despite growing research on crypto volatility and spillovers (Ugolini et al. 2023; Kumar et al. 2022; Yousaf and Yarovaya 2022), a lack of empirical consensus persists on how various crypto segments behave under stress and contribute to systemic risk. Stablecoins, for instance, exhibit asymmetric spillover behaviors, receiving shocks from Layer 1 assets such as BTC and ETH, but not vice versa (Thanh et al. 2023). Moreover, the tail-risk interdependence among cryptoassets has been shown to intensify during crisis episodes, yet the network structure of these interdependencies remains underexplored (Xu et al. 2021; Liao et al. 2024). To address this gap, this study employed the Extended Joint Connectedness Approach (Balcilar et al. 2021), embedded in a Time-Varying Parameter Vector Autoregression (TVP-VAR) model, to evaluate the systemic structure of interconnectedness (measured through return-based shock transmission) across five representative cryptocurrency assets. These included BTC and ETH (Layer 1 base protocols), UNI (a DeFi token), Dai (a stablecoin), and MKR (a governance and infrastructure token). This selection reflects both horizontal (intra-layer) and vertical (inter-layer) systemic linkages, capturing the foundational architecture of the crypto-financial ecosystem. To guide the analysis, we posed the following testable hypothesis: “Stablecoins such as DAI act as net absorbers of systemic return shocks, while governance and DeFi tokens, particularly MKR and UNI, serve as net transmitters of return-based risk, especially during periods of market stress.” This hypothesis offers a conceptual framework for interpreting the dynamic roles of different asset classes within the cryptocurrency network. The analysis focused on three central research questions: (i) How do connectedness patterns change over time across different segments of the cryptocurrency ecosystem? (ii) Which digital assets act as net transmitters or absorbers of systemic risk, particularly during stress periods? (iii) How can dynamic connectedness measures inform optimal portfolio allocation in crypto markets?
This study makes several important contributions to the literature. First, it is one of the few studies to jointly model the transmission of returns across a diverse set of functional crypto assets using the TVP-VAR-based Extended Joint Connectedness Approach. Second, it evaluated how these dynamic connectedness patterns can inform evidence-based portfolio allocation, using multivariate strategies including Minimum Connectedness Portfolios. Third, by contextualizing the empirical findings to major crypto-specific disruptions and macro-financial shocks, the study offers practical insights for crypto-native funds, institutional allocators, and risk managers. Finally, including stablecoins and governance tokens expands the scope of systemic risk analysis beyond high-cap Layer 1 assets, offering a more holistic view of the crypto-financial system.
The empirical findings indicated that while Maker and Uniswap act as dominant transmitters of systemic risk, Bitcoin and Ethereum consistently emerged as net receivers, absorbing shocks from the broader crypto network. Dai reinforced its role as a persistent volatility absorber, which is consistent with its stablecoin design and defensive characteristics. The Total Connectedness Index (TCI) exhibited substantial time variation, peaking during significant events such as the FTX collapse and recovering thereafter, signaling renewed structural reintegration. Pairwise and net directional connectedness metrics revealed dynamic systemic hierarchies, with governance and DeFi tokens exerting increasing influence, particularly under stress. Regarding portfolio construction, the Minimum Variance strategies heavily favored Dai, while the Minimum Correlation and Minimum Connectedness strategies promoted more balanced allocations, favoring UNI, MKR, and BTC. Connectedness-based portfolios delivered superior cumulative returns and better crisis resilience than traditional variance-minimizing approaches.
The remainder of the paper is organized as follows. Section 2 presents the literature review. Section 3 describes the data and methodology. Section 4 discusses the empirical results, including dynamic connectedness analysis and portfolio optimization. Section 5 concludes with the key takeaways and implications for market participants and regulators.

2. Literature Review

2.1. Interconnectedness and Risk Transmission in Crypto Markets

A growing body of literature has examined the interconnectedness, contagion mechanisms, and systemic spillovers within the cryptocurrency ecosystem. Several studies have converged on the notion that connectedness intensifies during periods of macro-financial stress, such as the COVID-19 pandemic and crypto-specific crises. Kumar et al. (2022) and Katsiampa et al. (2022) found that time- and frequency-domain spillovers increased sharply during the COVID-19 pandemic, with Ethereum gaining influence due to its evolving role in DeFi and NFTs. Both studies support the view that connectedness is highly regime-dependent, with short-term horizons exhibiting greater volatility transmission.
However, other research shifted the focus toward the asymmetric nature of systemic roles. Xu et al. (2021) and Ahelegbey et al. (2021) present diverging results on Bitcoin’s role, with either systemic absorber or tail contagion giver characteristics, depending on the stress levels. Barkai et al. (2024) propose a tail-risk modeling framework that outperformed traditional volatility metrics, emphasizing the importance of modeling downside exposures in highly non-normal return environments. The FTX collapse marked a critical event in the literature, drawing attention to the firm-level triggers of systemic risk. Bouri et al. (2023), Khan et al. (2025), and Galati et al. (2024) revealed sharp contagion from FTT to altcoins and DeFi tokens, with valuation networks expanding rapidly. Akyildirim et al. (2023) documented abrupt shifts in market correlations tied to FTX news, suggesting that institutional failures can rewire crypto risk architectures almost instantaneously.
Although most studies confirmed elevated within-crypto spillovers, there is limited consensus on cross-asset hierarchies. Ugolini et al. (2023) and Liao et al. (2024) confirmed that crypto assets are more interconnected among themselves than with traditional markets. Kristoufek (2021) and Conlon et al. (2023) emphasized that spillovers often remain endogenous to the cryptocurrency system, even during large-scale shocks, although perceptions of systemic vulnerability still influence regulatory discourse. In parallel with crypto-focused approaches, Ahelegbey and Giudici (2022) introduced a multivariate connectedness framework (NetVIX) that integrates both market volatilities and inter-market spillovers to construct a network-based global risk index. Their methodology, based on a Bayesian graphical VAR, decomposes volatility into a pure market risk component and a contagion amplification factor, offering insights into how dense financial networks can magnify systemic turbulence. While their application targets global equity markets, the framework indicates the importance of multivariate, network-oriented approaches to capturing joint systemic risk, particularly during crises. This perspective complements recent crypto applications that seek to go beyond pairwise connectedness toward more comprehensive system-level modeling.
In summary, while the literature has identified key drivers and mechanisms of crypto contagion, it lacks unified insights into the segment-specific roles of assets (e.g., stablecoins vs. Layer 1s vs. governance tokens). This study addressed this gap by modeling the functional heterogeneity of systemic roles using a joint connectedness approach (that is, the simultaneous transmission of return shocks across multiple crypto assets within an interconnected system), which enabled a more detailed analysis of how different crypto segments propagate or absorb risk.

2.2. Stablecoins, DeFi, and Infrastructure: Segmental Spillovers and Safe Haven Dynamics

Stablecoins occupy a unique structural position in the cryptocurrency ecosystem, often viewed as quasi-safe havens during periods of volatility. Łęt et al. (2023) and Hoang et al. (2024) demonstrated that traders tend to migrate toward stablecoins during periods of stress, resulting in increased transactional volumes, particularly for Tether and USDC. However, Thanh et al. (2023) revealed segmentation within the stablecoin category, with fiat-backed tokens, such as USDC, dominating spillovers, while algorithmic stablecoins, like DAI, remaining more isolated. However, even algorithmic stablecoins such as DAI exhibit consistent risk-absorbing behavior under certain conditions, reinforcing their potential as buffers within crypto portfolios. Kristoufek (2021) and Bas et al. (2024) further distinguished stablecoins from CBDCs, arguing that while the former are integrated into crypto market dynamics, the latter impact broader macro-financial risk measures without a deep entanglement in the crypto market.
Within the DeFi ecosystem, Ethereum plays a central role as a protocol, yet the nature of its systemic influence varies. Katsiampa et al. (2022) attributed Ethereum’s growing systemic importance to the rise of NFTs and decentralized applications. However, the nature of its influence is often reactive rather than proactive. Ugolini et al. (2023) and Yousaf and Yarovaya (2022) noted that while DeFi tokens act as transmitters of tail risk within the crypto ecosystem, their spillover into traditional finance remains weak.
The Terra/Luna collapse offers a case of endogenous systemic failure. Studies by Lee et al. (2023), Santiago et al. (2025), and Briola et al. (2023) demonstrated how flawed tokenomics, amplified by algorithmic instability and investor sentiment loops, led to rapid unwinding across multiple protocols. Such events underscore the governance-driven vulnerabilities of algorithmic systems and their potential to alter the connectedness structure abruptly.
Considering these findings, the current study fills an important gap by integrating multiple crypto asset classes (Layer 1s, DeFi tokens, stablecoins, and governance infrastructure) into a unified systemic risk model. While prior research often isolated segments or focused on bivariate relationships, this study leveraged the Extended Joint Connectedness framework to evaluate both inter-segment and intra-segment dynamics, particularly under stress regimes. This enabled a more comprehensive understanding of crypto-specific systemic risk and its implications for portfolio management.

3. Data and Methodology

3.1. Data

This study examined the dynamic connectedness and portfolio implications across five representative cryptocurrencies that reflect the core functional segments of the digital asset ecosystem. The selected assets included Bitcoin (BTC) and Ethereum (ETH) as foundational Layer 1 blockchain protocols; Uniswap (UNI) as a leading Decentralized Finance (DeFi) token; Dai (DAI) as an algorithmic stablecoin; and Maker (MKR) as a governance and infrastructure token supporting the issuance and stability of DAI. These five assets were chosen for their economic roles, liquidity, and representativeness within their respective categories. Bitcoin and Ethereum, as the two largest cryptocurrencies by market capitalization, provide the foundational infrastructure for the crypto economy. Uniswap, a decentralized exchange token, reflects DeFi sector innovation and protocol-based liquidity provision. DAI serves as a proxy for the algorithmic stablecoin segment, representing demand for on-chain monetary stability, while Maker is critical as the governance mechanism for DAI issuance, bridging DeFi infrastructure and risk management.
Daily closing price data for these assets were collected from Investing.com and MarketCoin platforms, covering the period from 1 October 2021 to 31 March 2025. This timeframe captures several key structural shocks and systemic events in crypto markets. To ensure stationarity and enable meaningful statistical modeling, the price series were transformed into continuously compounded log returns using the following formula:
r t = l n ( P t ) l n ( P t 1 )
where P t denotes the closing price at time t. This transformation allows for a more accurate estimation of volatility, spillovers, and risk dynamics across the assets. The selected cryptocurrencies span the blockchain ecosystem’s key structural and functional pillars, enabling the analysis to capture both horizontal spillovers (e.g., BTC ↔ ETH) and vertical dependencies (e.g., DAI ↔ MKR). This selection also reflects prior findings on cross-segment contagion, such as the safe-haven behavior of stablecoins (Łęt et al. 2023), DeFi’s systemic integration (Ugolini et al. 2023), and the risk propagation roles of governance tokens during crises (Bouri et al. 2023). Table 1 presents the descriptive statistics.
Table 1 indicates that BTC and ETH displayed moderate volatility and slightly negative skewness, suggesting mild downside asymmetry. UNI and MKR were highly volatile and positively skewed, implying right-tail risk. In contrast, DAI was near-zero in mean and volatility but extremely left-skewed with excessive kurtosis, highlighting its role as a stablecoin. All return series significantly deviated from normality (JB test), while Q2(20) indicated substantial evidence of volatility clustering in BTC, ETH, DAI, and MKR. The ERS test values support stationarity. The pronounced skewness and kurtosis imply heavy tails and asymmetry, which violate Gaussian assumptions of standard VAR models and suggest the presence of tail risk and nonlinear dependencies. In the context of portfolio construction, these distributional features amplify the importance of robust risk management, as assets like DAI and UNI may exhibit sudden jumps or disproportionate downside exposure under stress conditions. These characteristics confirm the need for advanced dynamic modeling to capture nonlinear and heteroskedastic features in crypto returns.

3.2. Methodology

This study employed the Extended Joint Connectedness Approach introduced by Balcilar et al. (2021) to analyze the dynamic interconnections and risk transmissions across major segments of the cryptocurrency ecosystem. This methodology expands on the seminal connectedness framework by Diebold and Yilmaz (2012), addressing the constraint of fixed-size rolling windows and enhancing flexibility in modeling evolving interdependencies across assets. The extended framework integrates into a Time-Varying Parameter Vector Autoregression (TVP-VAR) model, which effectively captures shifts in network structures triggered by market dislocations. It enables the estimation of time-varying connectedness metrics without imposing arbitrary window lengths, thus offering a more precise reflection of systemic risk in high-volatility environments like crypto markets. Compared to alternative approaches such as the DCC-GARCH model (Engle 2002) or copula-based methods, the TVP-VAR framework offers distinct advantages in this context. DCC-GARCH models are limited to second-moment dynamics and may struggle with high-dimensional systems or structural breaks. Copula-based models can capture tail dependencies but lack the temporal resolution necessary for monitoring systemic risk. In contrast, TVP-VAR models allow for a fully dynamic specification of both variance and mean transmission mechanisms, making them especially suited for capturing growing spillover channels and endogenous shifts in network topology. The joint total directional connectedness from all other assets to a given asset i at time t is given by
S i , t j n t , f r o m = E ϑ i , t 2 H E [ ϑ i , t H   E ϑ i , t ( H ) ) |         i ,   t   +   1 ,   ,         i ,   t   +   H ] 2 E ϑ i , t 2 H
= h = o H 1 e i A h t t M i ( M t Σ t M t ) 1 M t t A h t e i       h = 0 H 1 e i A h t t A h t e i
This formulation evaluates the share of the H-step-ahead forecast error variance for asset i that is attributable to joint innovations originating from all other assets. Here, Mi denotes a K × ( K 1 ) matrix that is conditioned by shocks from all variables except i   . The Joint Total Connectedness Index j S O I t   across K assets is computed as the average of the directional spillovers:
j S O I t   = 1 K i = 1 K S i , t j n t , f r o m
Directional connectedness measures are internally consistent and satisfy the following relationships:
S i , t j n t , t o = j = 1 , i j K j S O T j i , t
S j , t j n t , n e t = S i , t j n t , t o S i , t j n t , f r o m
S i j , t j n t , n e t = j S O T j i , t j n t , t o j S O T i j , t j n t , f r o m
These components fully decompose total, net, and pairwise spillovers, facilitating granular insight into the evolution of influence and vulnerability across crypto assets.
To translate portfolio strategies into practical asset allocation guidance, we calculated optimal portfolio weights following the method of Kroner and Ng (1998):
ω i j , t = Σ i i , t Σ i j , t Σ i i , t 2 Σ i j , t + Σ j j , t
where Σ i j , t represents the conditional covariance between assets i   and j at time t . Based on this, we constructed portfolios according to three strategic allocation criteria:
Minimum Variance Portfolio (MVP) weights:
ω Σ t =   t 1 I I t 1 I
Minimum Correlation Portfolio (MCP) weights:
ω R t =   R t 1   I I R t 1   I
Minimum Connectedness Portfolio (MCoP) weights:
ω C t = P C I t 1 I I P C I t 1 I
In these equations, R t denotes the correlation matrix, while P C I t is the pairwise connectedness matrix derived from the joint connectedness framework. To quantify hedging quality, we use the Hedging Effectiveness (HE) metric proposed by Antonakakis et al. (2020):
H E i = 1 v a r ( r p ) v a r ( r i )
where v a r ( r p ) is the variance of the hedged portfolio and v a r ( r i ) is the variance of the unhedged asset. A higher HE implies superior risk reduction. These strategies have proven effective in managing systemic risk in volatile and interconnected asset environments, offering critical insights for crypto portfolio optimization under uncertainty.

4. Empirical Findings

4.1. Average Connectedness

Table 2 illustrates the static average connectedness among the five cryptocurrency assets.
Table 2 indicates a moderately interconnected cryptocurrency system, with a Total Connectedness Index (TCI) of 52.43, indicating that more than half of each asset’s forecast error variance could be explained by shocks from the other assets on average. Ethereum (ETH) emerged as the most influential transmitter (TO = 77.39), followed closely by Bitcoin (BTC = 68.13). However, BTC and ETH were net receivers (NET = −3.63 and −1.82, respectively), suggesting that while they significantly impacted the others, they were still largely shaped by broader system dynamics, consistent with their foundational roles.
Uniswap (UNI) was the leading net transmitter (NET = 5.15), highlighting its systemic impact, particularly on DeFi-related flows. Maker (MKR) also played a net transmitter role (NET = 4.66), consistent with its governance-based influence in the DAI ecosystem. In contrast, Dai (DAI) acted as a net receiver (NET = −4.36), with low TO and FROM values, reinforcing its defensive role as a stablecoin.
The NPDC scores supported these roles: UNI (3.00) and MKR (4.00) led in pairwise influence, while DAI (0.00) remained passive. These findings validate the heterogeneity of systemic roles across asset types, with infrastructure and DeFi tokens acting as amplifiers of volatility. At the same time, stablecoins offered dampening effects, consistent with the recent findings by Łęt et al. (2023) and Thanh et al. (2023) regarding the safe haven behavior of stablecoins.

4.2. Dynamic Connectedness Analysis

Figure 1 illustrates the evolution of the Total Connectedness Index (TCI) among the five key crypto assets Bitcoin (BTC), Ethereum (ETH), Uniswap (UNI), Dai (DAI), and Maker (MKR) over the period from October 2021 to March 2025. The TCI quantifies the extent to which forecast error variance in each asset is attributable to shocks from other assets in the network, thereby serving as a proxy for systemic risk and market integration.
Figure 1 indicates pronounced time variation in systemic connectedness among the five selected cryptocurrencies. The TCI initially peaked in late 2021 and early 2022, reflecting elevated systemic interdependence during high market enthusiasm, institutional inflows, and synchronized macroeconomic developments. A steady decline followed, reaching its lowest levels in early 2024, coinciding with the aftermath of the FTX collapse and broader market disruptions linked to liquidity crises and stablecoin instability. This fragmentation of crypto linkages is consistent with findings by Bouri et al. (2023) and Galati et al. (2024), who showed that tail risk and contagion surged around the FTX event, particularly affecting altcoins and DeFi tokens. The subsequent rebound in connectedness in late 2023 reflects renewed structural integration, possibly driven by regulatory developments, the recovery of DeFi protocols, and improving investor sentiment. This aligns with the findings of Esparcia et al. (2024) and Khan et al. (2025), who documented dynamic spillover reversals as market participants reassessed risks and returns in the wake of major disruptions. The observed resurgence in TCI suggests that, while fragile in the face of systemic shocks, crypto markets exhibit an underlying tendency toward re-integration as structural uncertainty is resolved.

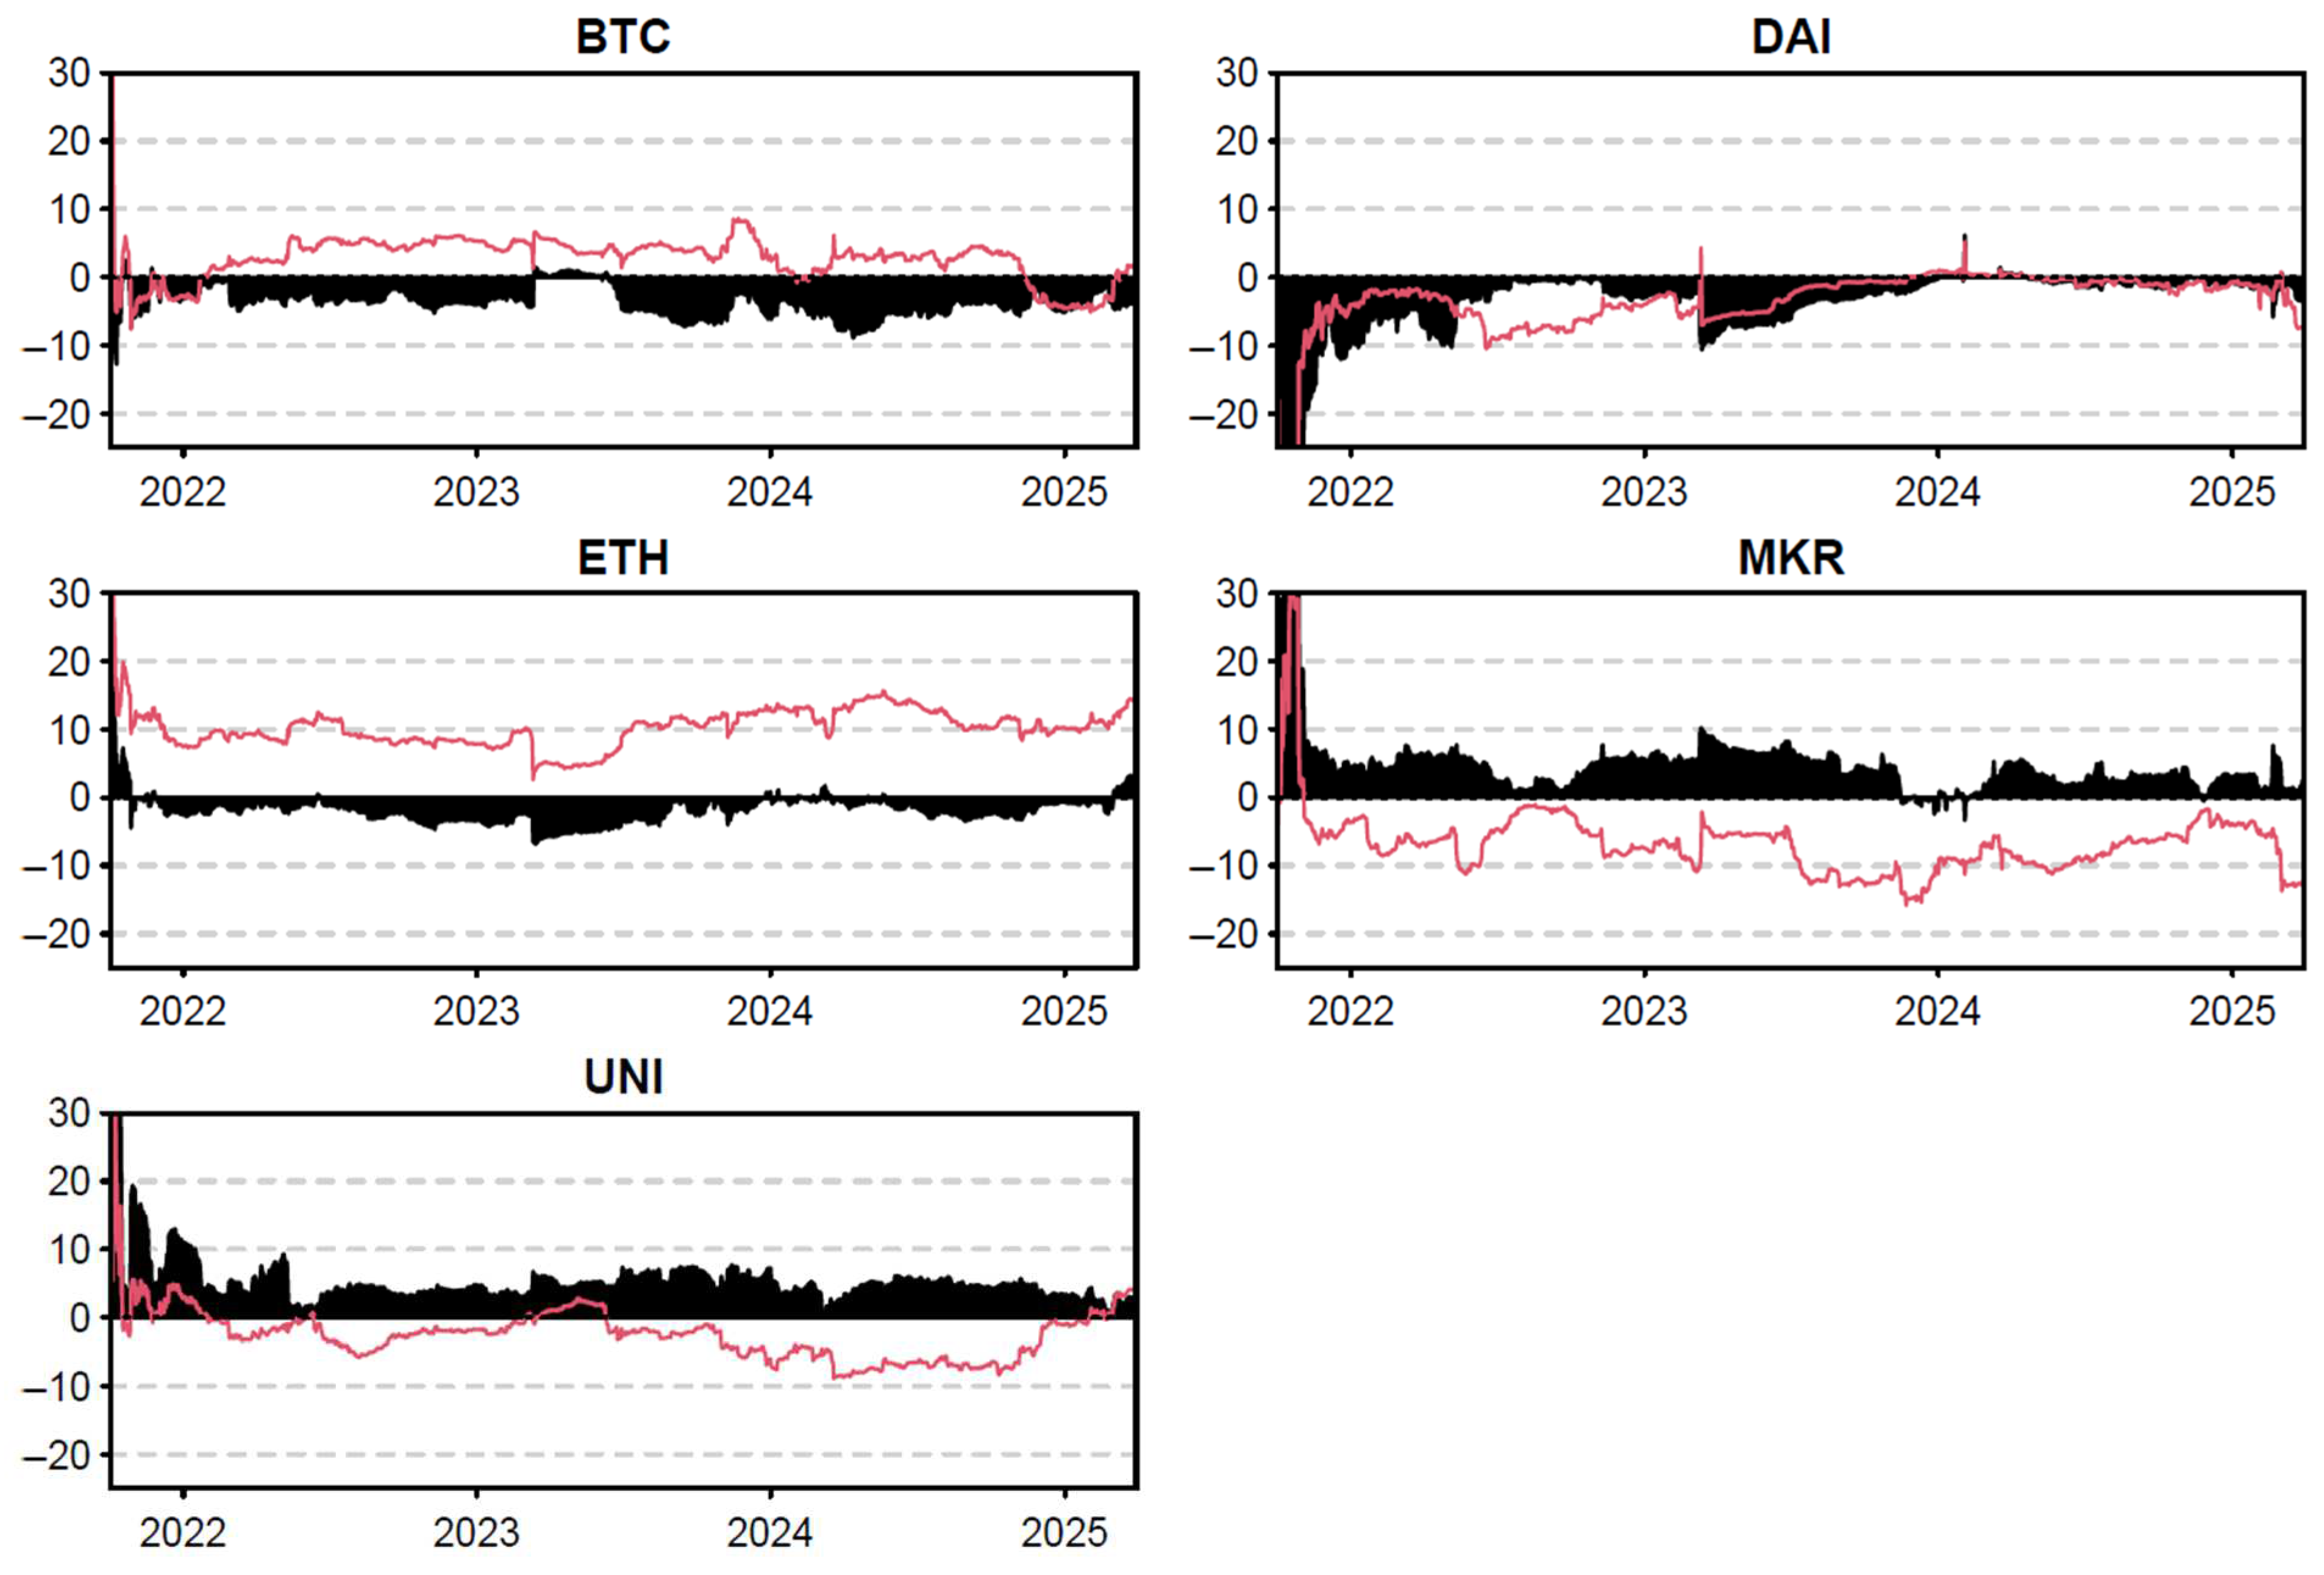
4.3. Variation in Net Total Directional Connectedness over Time

Figure 2 illustrates the variation in the net total directional connectedness (NTDC) of the five key crypto assets over time, capturing their roles as systemic shock transmitters or receivers across different market conditions.
Across most of the sample, Ethereum (ETH) and Bitcoin (BTC) acted as net receivers of systemic shocks, as reflected by persistently negative, black-shaded values. ETH, in particular, exhibited a prolonged absorber role, suggesting that it is more responsive to shocks originating from other crypto assets rather than transmitting them, despite its critical position in the DeFi and smart contract ecosystem. BTC showed a similar absorptive pattern, especially post-2022, likely due to its anchoring role as a macro crypto asset that reacts to ecosystem-wide shifts rather than initiating them. This pattern is consistent with the findings from Xu et al. (2021), who identified Bitcoin as a net systemic risk receiver and Ethereum as a more active emitter. However, their roles may vary under different market regimes. Ahelegbey et al. (2021) further classified BTC as a “giver” of tail contagion under extreme stress but a general stabilizer in standard periods, supporting our interpretation of its post-2022 behavior.
Uniswap (UNI) presented a mixed profile. While it began the sample period as a notable net shock transmitter, especially during the initial DeFi volatility surge, it transitioned into a largely neutral role post-2023. This suggests that UNI’s influence on systemic risk diminished, potentially due to market maturation or declining speculative interest in DeFi tokens during later periods. Ugolini et al. (2023) found strong within-market spillovers in DeFi but suggested that their cross-asset transmission declines as market structures mature, supporting UNI’s shift toward neutrality. Similarly, Yousaf and Yarovaya (2022) reported that while DeFi assets initially exhibit volatility spillovers and their integration with traditional markets remains weak, allowing for decoupling over time.
Maker (MKR), functioning at the intersection of governance and infrastructure for the DAI stablecoin, displayed prolonged transmitter behavior throughout the sample. The black-shaded region remained consistently positive, indicating MKR’s systemic influence. This likely stemmed from its central role in decentralized collateralized lending and its governance of the DAI peg mechanism. MKR’s positive NTDC values intensified during periods of elevated volatility, such as during stablecoin stress or broader DeFi adjustments. This is in line with the findings of Kristoufek (2021), who emphasized the endogenous demand linkages between stablecoins and collateral tokens like MKR, and those of Thanh et al. (2023), who showed that shocks to infrastructure-related tokens (like USDC governance frameworks) propagate strongly across stablecoins.
Dai (DAI) exhibited a consistently negative Net Total Directional Connectedness (NTDC) profile, confirming its role as a systemic shock absorber throughout the sample period. As shown in Figure 2, the black-shaded area remained predominantly below zero, frequently ranging between −5% and −10%, including during major stress episodes such as the FTX collapse in late 2022. This persistent negative positioning demonstrates DAI’s defensive characteristics and its relative insulation from propagating systemic shocks, reinforcing its utility as a stabilizing asset within crypto portfolios. Łęt et al. (2023) support this finding, showing that stablecoins are often safe havens during BTC and ETH volatility shocks. Hoang et al. (2024) also provided evidence of strong price-volume correlation between stablecoins and Bitcoin, but demonstrated that DAI, while algorithmic, reacted more passively than its USD-backed peers, corroborating its risk-absorbing behavior.
The patterns of Figure 2 indicate the heterogeneity of systemic roles within the crypto asset ecosystem. Governance tokens like MKR appeared to act as structural influencers, while foundational assets like ETH and BTC absorbed more than they transmit. Stablecoins, notably DAI, reinforced their reputation as volatility absorbers, while DeFi tokens like UNI evolved toward neutrality as the sector matured. These conclusions are also echoed in Barkai et al. (2024), who emphasized the importance of differentiating systemic roles when designing portfolio hedging strategies in crypto markets.

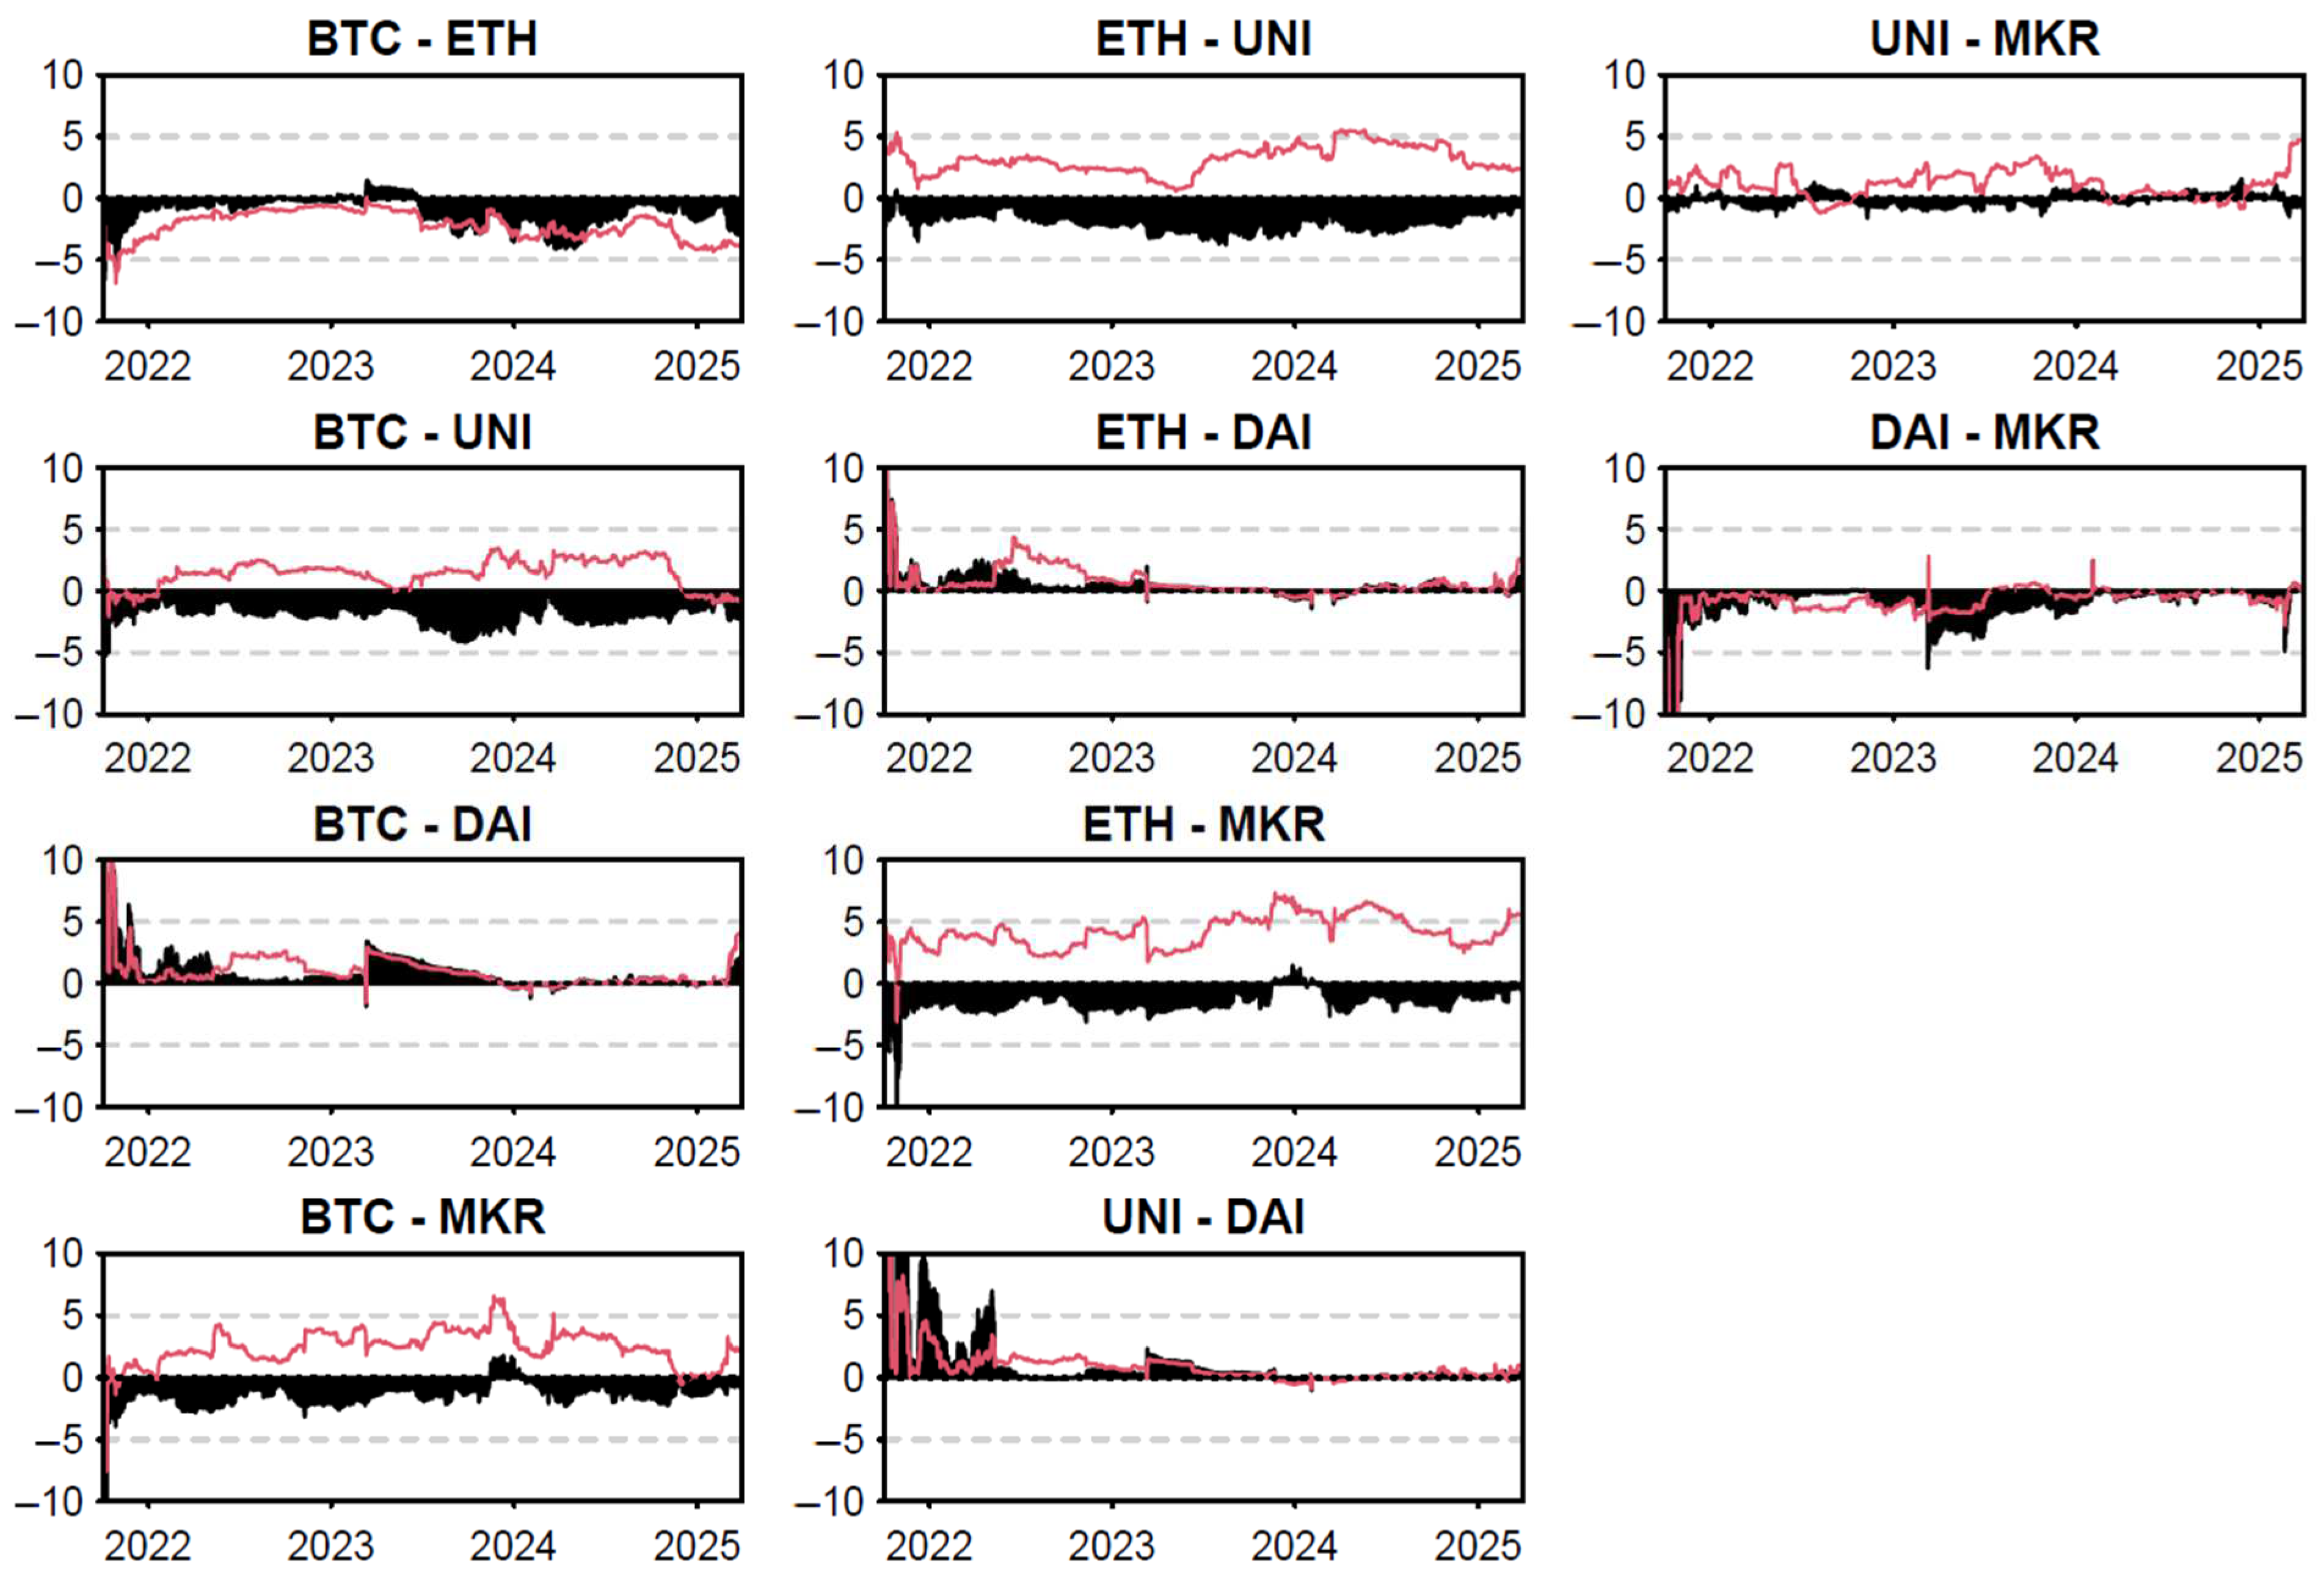
4.4. Variation in Net Pairwise Directional Connectedness over Time

Figure 3 illustrates the temporal evolution of bilateral net spillovers across the key cryptocurrencies.
Figure 3 indicates that Ethereum (ETH) was a net receiver of shocks from UNI and MKR, contrary to expectations about its dominance. This suggests that, despite its foundational role in the DeFi ecosystem, ETH often absorbs return spillovers from application-layer tokens, particularly during periods of innovation or governance stress. This finding echoes the decentralized propagation structure observed in Ugolini et al. (2023). Likewise, Bitcoin (BTC) consistently acted as a net receiver across nearly all pairs (BTC–ETH, BTC–UNI, BTC–MKR, and BTC–DAI), underscoring its function as a macro crypto asset that responds to systemic trends rather than initiating them. This absorptive behavior aligns with the findings of Barkai et al. (2024), who documented BTC’s tendency to reflect broader ecosystem shocks, especially under tail-risk conditions.
In contrast, Maker (MKR) emerged as a dominant transmitter of systemic shocks, particularly in the ETH–MKR and UNI–MKR relationships. This reflects MKR’s role in governing the DAI ecosystem and managing collateralized debt positions, reinforcing its top-down influence within the crypto-financial architecture. The ETH–MKR link further supports insights from Hoang et al. (2024), who highlighted ETH’s dependence on MKR’s governance mechanisms during periods of stablecoin stress. The UNI–MKR panel showed that Maker (MKR) consistently transmitted shocks to Uniswap (UNI), particularly in the Extended Joint Connectedness framework (black-shaded area), with MKR emerging as a persistent net risk source across most of the sample. This pattern moderately intensified toward the end of the sample, highlighting MKR’s governance-linked influence, especially during protocol-level uncertainty. While the red line (standard DY12) suggested some periods of net transmission from UNI to MKR, the joint connectedness measure indicated that MKR dominated the directional relationship. The DAI–MKR panel indicated that DAI consistently absorbed shocks from MKR, as evidenced by the persistently negative values shaded in black. This systemic pattern reflects the design structure of the MakerDAO ecosystem1, where DAI’s stability is contingent on the collateral governance managed by MKR holders. During major stress episodes, such as early 2022 (following Terra) and late 2024 (likely tied to liquidity or governance turbulence), the transmission from MKR to DAI intensified, with DAI bearing the downstream return spillovers. This directional relationship highlights a governance-induced systemic hierarchy in which Maker acts as a transmitter of risk to both infrastructure tokens (e.g., UNI) and stablecoins (e.g., DAI).
DAI, as expected, functioned predominantly as a net receiver, especially in pairs like BTC–DAI and UNI–DAI. Its persistent negative net pairwise connectedness confirmed its reputation as a return spillovers buffer, consistent with the stabilizing role of stablecoins documented in Łęt et al. (2023) and Thanh et al. (2023).
Overall, the results emphasize that shock propagation in crypto markets is highly directional and role-dependent. Governance tokens like MKR drive systemic spillovers, while base-layer assets such as ETH and BTC frequently absorb them. Stablecoins like DAI retain their defensive posture, and DeFi tokens like UNI exhibit transient transmitter roles that fade as the sector matures. These findings reinforce the growing complexity of systemic interlinkages in the digital asset ecosystem.

4.5. Multivariate Portfolio Weights

Table 3 presents the distribution of optimal portfolio weights across the five selected crypto assets (BTC, ETH, UNI, DAI, and MKR) under three distinct allocation strategies: a Minimum Variance Portfolio (MVP), Minimum Correlation Portfolio (MCP), and Minimum Connectedness Portfolio (MCoP). Each strategy was evaluated in terms of the average portfolio weight (mean), standard deviation (σ), 5% and 95% quantiles (confidence bounds), hedging effectiveness (HE), and statistical significance (p-value).
The MVP strategy assigned nearly the entire portfolio weight to DAI (99%), reflecting its minimal return spillovers and strong shock-absorbing properties. While BTC, ETH, UNI, and MKR receive negligible or zero weights under MVP, their HE scores remained perfect (1.00), implying no variance reduction need due to zero allocation. DAI, despite being the dominant holding, yielded a slightly negative HE (−0.11), suggesting limited diversification benefit under this scheme.
In contrast, the MCP strategy offered more balanced diversification. DAI still received the highest average weight (42%), but BTC, UNI, MKR, and ETH also received non-trivial allocations. UNI stood out with the highest HE (0.84), followed by MKR (0.80) and ETH (0.68), suggesting that these assets contribute significantly to correlation-based diversification. DAI, however, had a highly negative HE (−265.34), potentially due to its inverse correlation effects outweighing the diversification gains. DAI, however, had a highly negative HE (−265.34), indicating that its inclusion under correlation-based optimization not only failed to reduce portfolio risk but may have inadvertently magnified it. This counterintuitive result is supported by Table 1, which shows that DAI exhibited an exceptionally low standard deviation (0.016), extreme kurtosis (319.53), and skewness (−5.497), along with statistically significant Q(20) and Q2(20) values. These characteristics suggest that while DAI is stable during normal periods, it may exhibit sharp, infrequent deviations during market stress, thereby providing limited hedging value against assets with higher variance or asymmetric tail behavior. In practical terms, DAI’s apparent “stability” masks its nonlinear jump behavior and weak co-movement with other assets, which undermines its utility in correlation-sensitive strategies. Although it received a sizable portfolio weight under the MCP and MCoP due to its low return spillovers, the resulting HE values suggest that it failed to meaningfully reduce portfolio variance when systemic or correlated risks dominated.
The MCoP strategy also promoted diversification but emphasized minimizing systemic spillovers by allocating weights based on the joint connectedness matrix. DAI maintained a substantial weight (39%), followed by MKR (21%), UNI (20%), and BTC (19%), while ETH received only a marginal allocation (2%). Similar to the MCP strategy, UNI and MKR exhibited strong hedging effectiveness (HE = 0.81 and 0.77, respectively), affirming their value in mitigating network-driven risk. DAI again recorded the lowest HE (−308.34), reinforcing that despite its role as a systemic shock absorber, its contribution to hedging performance becomes counterproductive in connectedness-optimized portfolios. This reflects a paradox: while DAI’s low return spillovers justifies a significant weight under traditional variance-based schemes (MVP), its limited responsiveness to dynamic contagion reduces its effectiveness when the goal is to mitigate spillovers from other crypto assets. In essence, DAI’s defensive stability during normal conditions may impair the portfolio’s adaptability during crisis episodes, especially in a highly interconnected system where rapid information diffusion and co-movement dominate. Thus, its high weight does not translate into meaningful risk reduction under joint connectedness frameworks, as reflected by the negative HE.
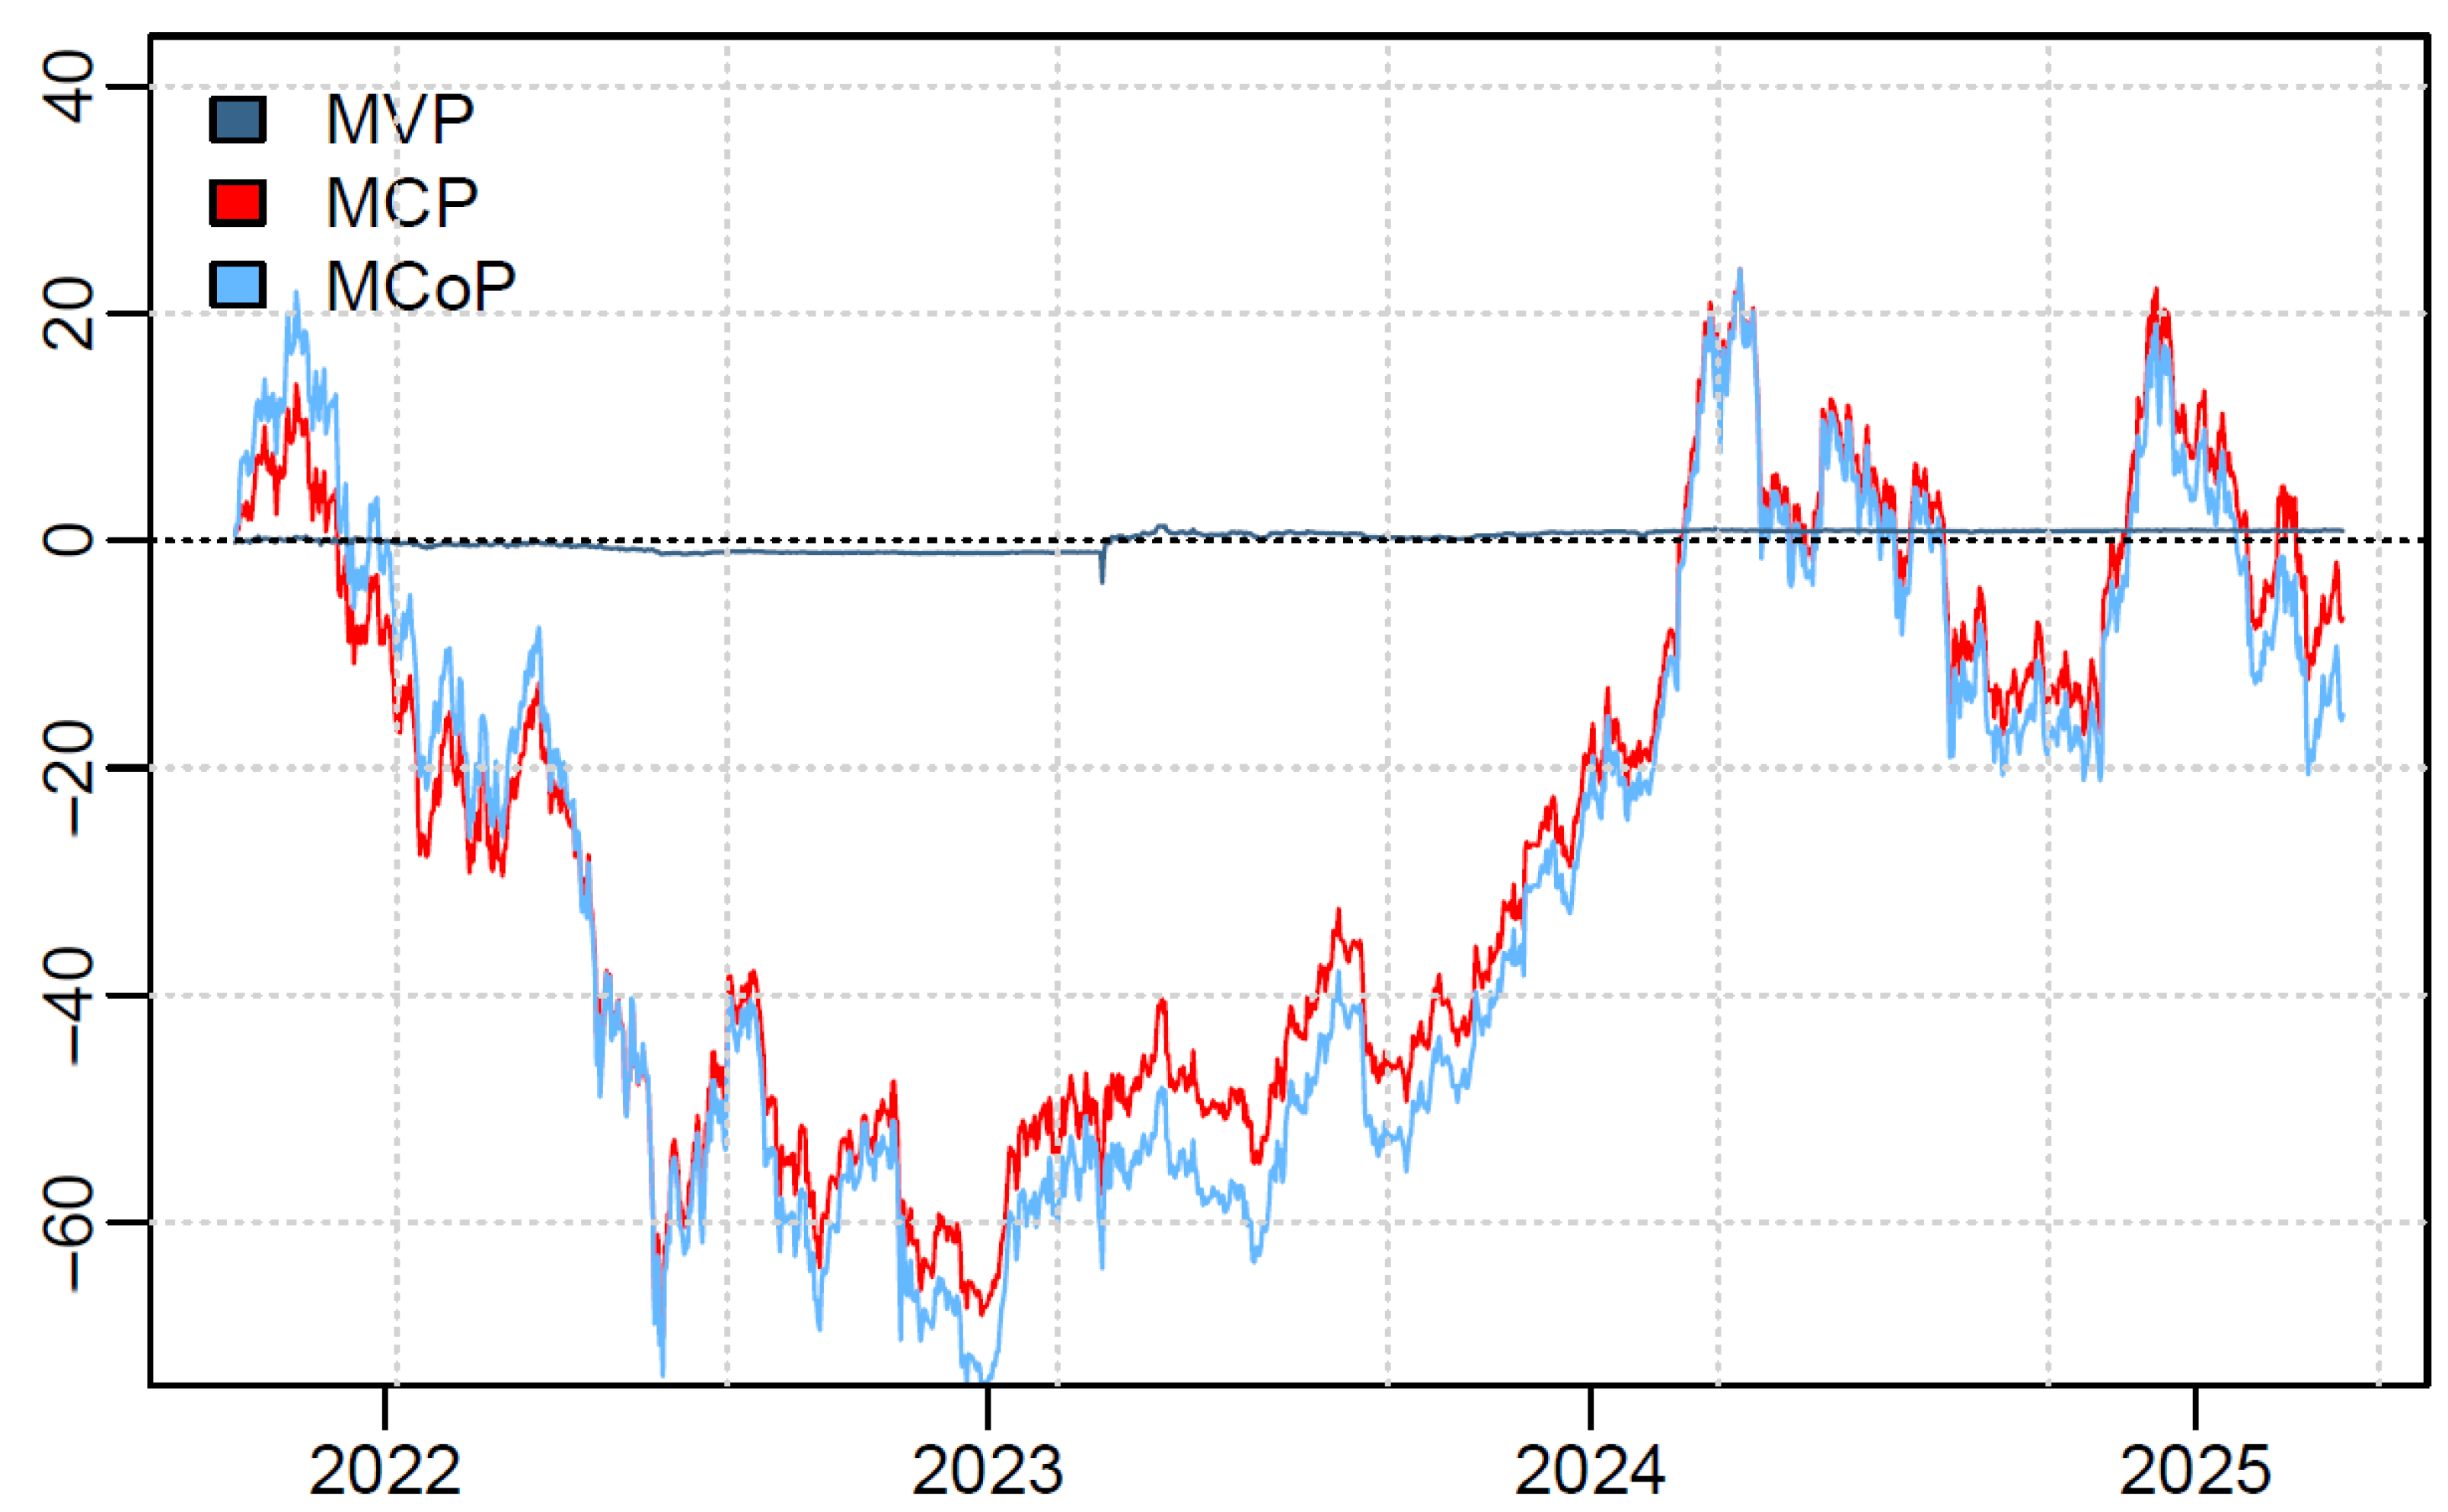
Figure 4 illustrates the evolution of the cumulative returns for the three portfolio strategies. The Minimum Variance Portfolio (MVP) is represented in dark blue, the Minimum Correlation Portfolio (MCP) in red, and the Minimum Connectedness Portfolio (MCoP) in light blue.
Figure 4 highlights the superior performance of the MCoP and MCP strategies compared to the traditional MVP approach. Connectedness-based portfolios (especially MCP) experienced steeper recoveries during market rebounds in 2023–2024 and demonstrated stronger resilience during major downturns like the FTX collapse (late 2022) and crypto deleveraging phases. In contrast, while less volatile, the MVP strategy lagged significantly in capturing upward momentum, particularly after early 2023. This result reinforces the relevance of network-based diversification in crypto portfolios. The MCoP strategy explicitly minimized systemic spillovers and consistently delivered more robust risk-adjusted returns by mitigating contagion during crisis episodes and capitalizing on structural shifts. These findings echo those of Antonakakis et al. (2020) and Balcilar et al. (2021), who demonstrated the hedging advantages of incorporating connectedness into portfolio construction under high volatility regimes.

4.6. Robustness Check

To ensure the reliability of our empirical findings, we conducted robustness checks focusing on model specification sensitivity. First, we assessed lag sensitivity by re-estimating the Extended Joint Connectedness model using alternative lag orders (nlag = 2 and nlag = 3) instead of the baseline specification (nlag = 1). The resulting directional and net connectedness patterns remained broadly consistent across these specifications, suggesting that the choice of lag length did not drive our conclusions regarding dynamic spillover channels. Second, we evaluated the effect of varying the forgetting factors in the TVP-VAR framework. Specifically, we tested values of kappa1 and kappa2 of 0.96 and 0.995, respectively, in place of the default 0.99. The total connectedness index (TCI) and net pairwise directional connectedness (NPDC) exhibited stable trajectories across these parameter settings, indicating that our model is not unduly sensitive to the choice of prior decay rates. Overall, these robustness checks confirmed that the study’s core findings are structurally sound and not artifacts of specific modeling assumptions. The full results are available upon request due to space constraints.

5. Conclusions

This study assessed the dynamic interdependencies and portfolio implications in the cryptocurrency ecosystem by analyzing five key assets: BTC, ETH, UNI, DAI, and MKR. Using the Extended Joint Connectedness Approach within a TVP-VAR framework, significant heterogeneity in systemic behavior was found across the asset classes. MKR and UNI emerged as consistent net transmitters of shocks, underlining their role in governance and DeFi infrastructure as key channels of systemic risk. In contrast, BTC and ETH, despite their foundational importance, essentially functioned as net receivers, reflecting their macro nature and responsiveness to system-wide dynamics. Stablecoins such as DAI acted as persistent absorbers of shocks, reinforcing their role as safe havens during periods of heightened market stress.
From a portfolio strategy standpoint, incorporating systemic information through correlation and connectedness-based allocation methods (MCP and MCoP) yielded superior performance compared to traditional variance-minimization techniques. While DAI was favored in the Minimum Variance Portfolio for its low volatility, its hedging effectiveness was significantly diminished in strategies prioritizing interdependence. Instead, assets such as UNI and MKR demonstrated substantial diversification value under connectedness-aware frameworks, suggesting that they can serve as effective components for risk mitigation in structurally complex crypto portfolios.
These findings carry important implications for investors, regulators, and DeFi protocol designers. For crypto asset managers and institutional investors, portfolio construction should go beyond conventional risk-return tradeoffs and account for the growing systemic roles of digital assets. Incorporating dynamic connectedness measures allows for greater resilience during episodes of contagion, offering a framework that is better suited to the non-linear and event-driven nature of crypto markets. For policymakers, the results highlight the necessity of differentiated regulatory oversight that reflects each asset’s function within the financial architecture. Assets like MKR, which exert outsized influence through governance channels, warrant particular attention. Similarly, the defensive role of stablecoins demonstrates the importance of transparent reserve mechanisms and robust algorithmic design to preserve market confidence. Finally, for developers and DeFi protocol architects, the systemic behavior of governance tokens and their impact on network stability calls for continued innovation in collateral management, risk control, and cross-protocol coordination.
While this study provides valuable insights into the systemic connectedness and strategic allocation in crypto markets, it is subject to certain limitations. The analysis focused on a selected set of five representative cryptocurrencies, which, although diverse in function, may not capture the full complexity of the broader digital asset ecosystem, including emerging sectors such as NFTs, liquid staking tokens, or real-world asset (RWA)-linked protocols. Additionally, the TVP-VAR model assumes linear interdependencies, which may not fully reflect the non-linear or regime-switching dynamics often observed during extreme market conditions. Future research could expand the asset universe, incorporate macro-financial linkages, or apply machine learning and non-parametric models to capture tail-risk dynamics more effectively. Examining the impact of regulatory announcements, cross-border capital flows, or blockchain-specific developments on connectedness patterns could be promising avenues for further exploration.

Funding

This work was supported and funded by the Deanship of Scientific Research at Imam Mohammad Ibn Saud Islamic University (IMSIU) (grant number IMSIU-DDRSP2504).

Data Availability Statement

Data available in a publicly accessible repository, www.investing.com (accessed on 17 July 2025).

Conflicts of Interest

The author declares no conflict of interest.

Note

1
The MakerDAO ecosystem refers to the decentralized autonomous organization (DAO) and infrastructure that governs the Maker Protocol, one of the foundational DeFi systems on the Ethereum blockchain. It is primarily known for issuing the DAI stablecoin, a decentralized, overcollateralized cryptocurrency that aims to maintain a soft peg to the U.S. dollar (Gemini 2025).

References

  1. Ahelegbey, Daniel Felix, and Paolo Giudici. 2022. NetVIX—A network volatility index of financial markets. Physica A: Statistical Mechanics and Its Applications 594: 127017. [Google Scholar] [CrossRef]
  2. Ahelegbey, Daniel Felix, Paolo Giudici, and Fatemeh Mojtahedi. 2021. Tail risk measurement in crypto-asset markets. International Review of Financial Analysis 73: 101604. [Google Scholar] [CrossRef]
  3. Akyildirim, Erdinc, Thomas Conlon, Shaen Corbet, and John W. Goodell. 2023. Understanding the FTX exchange collapse: A dynamic connectedness approach. Finance Research Letters 53: 103643. [Google Scholar] [CrossRef]
  4. Antonakakis, Nikolaos, Ioannis Chatziantoniou, and David Gabauer. 2020. Refined measures of dynamic connectedness based on time-varying parameter vector autoregressions. Journal of Risk and Financial Management 13: 84. [Google Scholar] [CrossRef]
  5. Balcilar, Mehmet, David Gabauer, and Zaghum Umar. 2021. Crude Oil futures contracts and commodity markets: New evidence from a TVP-VAR extended joint connectedness approach. Resources Policy 73: 102219. [Google Scholar] [CrossRef]
  6. Barkai, Itai, Elroi Hadad, Tomer Shushi, and Rami Yosef. 2024. Capturing tail risks in cryptomarkets: A new systemic risk approach. Journal of Risk and Financial Management 17: 397. [Google Scholar] [CrossRef]
  7. Bas, Tugba, Issam Malki, and Sheeja Sivaprasad. 2024. Connectedness between central bank digital currency index, financial stability and digital assets. Journal of International Financial Markets, Institutions and Money 92: 101981. [Google Scholar] [CrossRef]
  8. Bouri, Elie, Elham Kamal, and Harald Kinateder. 2023. FTX collapse and systemic risk spillovers from FTX token to major cryptocurrencies. Finance Research Letters 56: 104099. [Google Scholar] [CrossRef]
  9. Briola, Antonio, David Vidal-Tomás, Yuanrong Wang, and Tomaso Aste. 2023. Anatomy of a Stablecoin’s failure: The Terra-Luna case. Finance Research Letters 51: 103358. [Google Scholar] [CrossRef]
  10. Conlon, Thomas, Shaen Corbet, and Yang Hu. 2023. The collapse of the FTX exchange: The end of cryptocurrency’s age of innocence. The British Accounting Review 2023: 101277. [Google Scholar] [CrossRef]
  11. Diebold, Francis X., and Kamil Yilmaz. 2012. Better to give than to receive: Predictive directional measurement of volatility spillovers. International Journal of Forecasting 28: 57–66. [Google Scholar] [CrossRef]
  12. Engle, Robert. 2002. Dynamic conditional correlation: A simple class of multivariate generalized autoregressive conditional heteroskedasticity models. Journal of Business & Economic Statistics 20: 339–50. [Google Scholar]
  13. Esparcia, Carlos, Ana Escribano, and Francisco Jareño. 2024. Assessing the crypto market stability after the FTX collapse: A study of high frequency volatility and connectedness. International Review of Financial Analysis 94: 103287. [Google Scholar] [CrossRef]
  14. Galati, Luca, Alexander Webb, and Robert I. Webb. 2024. Financial contagion in cryptocurrency exchanges: Evidence from the FTT collapse. Finance Research Letters 67: 105747. [Google Scholar] [CrossRef]
  15. Gemini. 2025. What is MakerDAO? Gemini Cryptopedia. Available online: https://www.gemini.com/cryptopedia/makerdao-dai-decentralized-autonomous-organization (accessed on 27 June 2025).
  16. Hoang, Lai T., and Dirk G. Baur. 2024. How stable are stablecoins? The European Journal of Finance 30: 1984–2000. [Google Scholar] [CrossRef]
  17. Katsiampa, Paraskevi, Larisa Yarovaya, and Damian Zięba. 2022. High-frequency connectedness between Bitcoin and other top-traded crypto assets during the COVID-19 crisis. Journal of International Financial Markets, Institutions and Money 79: 101578. [Google Scholar] [CrossRef]
  18. Khan, Khalid, Adnan Khurshid, and Javier Cifuentes-Faura. 2025. Causal estimation of FTX collapse on cryptocurrency: A counterfactual prediction analysis. Financial Innovation 11: 16. [Google Scholar] [CrossRef]
  19. Kristoufek, Ladislav. 2021. Tethered, or Untethered? On the interplay between stablecoins and major cryptoassets. Finance Research Letters 43: 101991. [Google Scholar] [CrossRef]
  20. Kroner, Kenneth F., and Victor K. Ng. 1988. Modeling asymmetric comovements of asset returns. The Review of Financial Studies 11: 817–44. [Google Scholar] [CrossRef]
  21. Kumar, Ashish, Najaf Iqbal, Subrata Kumar Mitra, Ladislav Kristoufek, and Elie Bouri. 2022. Connectedness among major cryptocurrencies in standard times and during the COVID-19 outbreak. Journal of International Financial Markets, Institutions and Money 77: 101523. [Google Scholar] [CrossRef]
  22. Lee, Seungju, Jaewook Lee, and Yunyoung Lee. 2023. Dissecting the Terra-LUNA crash: Evidence from the spillover effect and information flow. Finance Research Letters 53: 103590. [Google Scholar] [CrossRef]
  23. Łęt, Blanka, Konrad Sobański, Wojciech Świder, and Katarzyna Włosik. 2023. What drives the popularity of stablecoins? Measuring the frequency dynamics of connectedness between volatile and stable cryptocurrencies. Technological Forecasting and Social Change 189: 122318. [Google Scholar] [CrossRef]
  24. Liao, Xin, Qin Li, Stephen Chan, Jeffrey Chu, and Yuanyuan Zhang. 2024. Interconnections and contagion among cryptocurrencies, DeFi, NFT and traditional financial assets: Some new evidence from tail risk driven network. Physica A: Statistical Mechanics and Its Applications 647: 129892. [Google Scholar] [CrossRef]
  25. Santiago, Viktor, Michel Charifzadeh, and Tim Alexander Herberger. 2025. Risks of decentralized finance and their potential negative effects on capital markets: The Terra-Luna case. Studies in Economics and Finance 42: 427–48. [Google Scholar] [CrossRef]
  26. Thanh, Binh Nguyen, Thai Nguyen Vu Hong, Huy Pham, Thanh Nguyen Cong, and Thu Pham Thi Anh. 2023. Are the stabilities of stablecoins connected? Journal of Industrial and Business Economics 50: 515–25. [Google Scholar] [CrossRef]
  27. Ugolini, Andrea, Juan C. Reboredo, and Walid Mensi. 2023. Connectedness between DeFi, cryptocurrency, stock, and safe-haven assets. Finance Research Letters 53: 103692. [Google Scholar] [CrossRef]
  28. Xu, Qiuhua, Yixuan Zhang, and Ziyang Zhang. 2021. Tail-risk spillovers in cryptocurrency markets. Finance Research Letters 38: 101453. [Google Scholar] [CrossRef]
  29. Yousaf, Imran, and Larisa Yarovaya. 2022. Static and dynamic connectedness between NFTs, Defi and other assets: Portfolio implication. Global Finance Journal 53: 100719. [Google Scholar] [CrossRef]
Figure 1. Total Connectedness Index (TCI) among selected crypto assets (October 2021–March 2025). Note: This figure plots the variation in the Total Connectedness Index (TCI) over time, estimated using the Extended Joint Connectedness Approach within a TVP-VAR framework. The TCI reflects the average proportion of forecast error variance in each cryptocurrency due to shocks from other assets, thus capturing the overall degree of systemic integration in the crypto asset network. The red line corresponds to the standard Diebold and Yilmaz (2012) connectedness measure, implemented within a TVP-VAR framework using pairwise forecast error variance decompositions. In contrast, the black-shaded area reflects the Extended Joint Connectedness Approach (Balcilar et al. 2021), which captures network-wide spillovers in a system-wide fashion. Periods of elevated TCI, such as late 2021 and early 2023, reflect heightened systemic spillovers across crypto assets, while the dips in 2024 signal temporary risk decoupling or reduced interdependence. These dynamics demonstrate the time-varying nature of risk transmission in digital asset markets.
Risks 13 00141 g001
Figure 2. Variation of net total directional connectedness of selected crypto assets over time. Note: This figure plots the net total directional connectedness (NTDC) for five cryptocurrencies, Bitcoin (BTC), Ethereum (ETH), Uniswap (UNI), Dai (DAI), and Maker (MKR), from October 2021 to March 2025. Positive values (above zero) indicate periods during which the asset was a net transmitter of shocks to the rest of the system; negative values suggest that the asset was a net absorber of shocks. The black-shaded region represents the joint connectedness estimated using the Extended Joint Connectedness approach of Balcilar et al. (2021), while the red line corresponds to the standard connectedness measure proposed by Diebold and Yilmaz (2012). Positive values indicate that the asset was a net transmitter of shocks to the system, while negative values imply a net receiver (shock absorber) role.
Risks 13 00141 g002
Figure 3. Variation in net pairwise directional connectedness among crypto assets over time. Note: The black-shaded area represents the joint pairwise net directional connectedness between each asset pair, estimated via the Extended Joint Connectedness Approach (Balcilar et al. 2021). The red line corresponds to the standard pairwise measure of Diebold and Yilmaz (2012). Positive values indicate that the asset on the left of the pair transmitted shocks to the asset on the right; negative values imply the opposite.
Risks 13 00141 g003
Figure 4. Cumulative portfolio returns under MVP, MCP, and MCoP strategies. Note: This figure presents the cumulative portfolio returns of three dynamic allocation strategies, a Minimum Variance Portfolio (MVP), Minimum Correlation Portfolio (MCP), and Minimum Connectedness Portfolio (MCoP), over the sample period from October 2021 to March 2025. The strategies are derived from time-varying estimates using conditional variance, correlation, and pairwise connectedness matrices, respectively.
Risks 13 00141 g004
Table 1. Descriptive statistics.
BTCETHUNIDAIMKR
Mean0.042−0.047−0.1140.000−0.050
Std. Dev8.24713.12525.8380.01621.468
Skewness−0.200 ***−0.224 ***0.581 ***−5.497 ***0.611 ***
Kurtosis3.765 ***3.749 ***6.250 ***319.533 ***3.082 ***
JB762.575 ***758.680 ***2150.268 ***5439086.438 ***584.806 ***
ERS−11.985−8.365−11.669−2.479−12.415
Q(20)12.01417.961 **10.820204.594 ***5.232
Q 2 ( 20 ) 49.676 ***108.417 ***10.672264.896 ***83.516 ***
Note: This table reports the descriptive statistics for the daily log returns of five cryptocurrency assets—Bitcoin (BTC), Ethereum (ETH), Uniswap (UNI), Dai (DAI), and Maker (MKR)—over the sample period from 1 October 2021 to 31 March 2025. The mean and standard deviation measure the average return and volatility, respectively. The skewness and kurtosis assess the distributional asymmetries and tail behavior. The Jarque-Bera (JB) test evaluates normality, ERS tests for unit roots, while Q(20) and Q2(20) are the Ljung–Box statistics for serial correlation in returns and squared returns. Statistical significance at the 1%, and 5% levels is denoted by ***, and **.
Table 2. Average connectedness.
BTCETHUNIDAIMKRFROM
BTC28.2334.9220.260.7415.8571.77
ETC33.7420.7925.090.4619.9279.21
UNI18.2923.0944.220.4813.9255.78
DAI1.661.011.7992.602.947.40
MKR14.4418.3813.801.3652.0347.97
TO68.1377.3960.933.0452.63262.13
NET−3.63−1.825.15−4.364.66TCI
NPDC1.002.003.000.004.0052.43
Note: This table presents the average connectedness measures among the five cryptocurrency assets, Bitcoin (BTC), Ethereum (ETH), Uniswap (UNI), Dai (DAI), and Maker (MKR), based on the Extended Joint Connectedness framework over the period from 1 October 2021 to 31 March 2025.
Table 3. Multivariate portfolio weights.
Minimum Variance Portfolio (MVP)
Mean σ 5%95%HEp-value
BTC0.000.000.000.001.000.00
ETH0.010.020.000.051.000.00
UNI0.000.000.000.001.000.00
DAI0.990.020.951.00−0.110.05
MKR0.000.000.000.001.000.00
Minimum Correlation Portfolio (MCP)
Mean σ 5%95%HEp-value
BTC0.160.070.010.270.490.00
ETH0.080.100.000.320.680.00
UNI0.180.050.070.250.840.00
DAI0.420.040.350.46−265.340.00
MKR0.170.050.080.230.800.00
Minimum Connectedness Portfolio (MCoP)
Mean σ 5%95%HEp-value
BTC0.190.050.110.250.400.00
ETH0.020.060.000.190.620.00
UNI0.200.030.140.230.810.00
DAI0.390.050.300.45−308.340.00
MKR0.210.050.080.260.770.00
Note: Table 3 presents the average portfolio weights, standard deviation (σ), confidence intervals (5%, 95%), hedging effectiveness (HE), and p-values for each crypto asset under three portfolio optimization strategies: a Minimum Variance Portfolio (MVP), Minimum Correlation Portfolio (MCP), and Minimum Connectedness Portfolio (MCoP). The HE metric measures the variance reduction each strategy achieves relative to holding a single asset.
Disclaimer/Publisher’s Note: The statements, opinions and data contained in all publications are solely those of the individual author(s) and contributor(s) and not of MDPI and/or the editor(s). MDPI and/or the editor(s) disclaim responsibility for any injury to people or property resulting from any ideas, methods, instructions or products referred to in the content.

