Abstract
Globalization and the spread of technological innovations have made world markets and economies increasingly unified and conditioned by international trade, not only for sales markets but above all for the supply of raw materials necessary for the functioning of the production complex of each country. Alongside oil and gold, the main commodities traded include industrial metals, such as aluminum and copper, mineral products such as gas, electrical and electronic components, agricultural products, and precious metals. The conflict between Russia and Ukraine tested the unification of markets, given that these are countries with notable raw materials and are strongly dedicated to exports. This suggests that commodity prices were able to influence the stock markets, especially in the countries most closely linked to the two belligerents in terms of import-export. Given the importance of industrial metals in this period of energy transition, the aim of our study is to analyze whether Industrial Metals volatility affects G7 stock markets. To this end, the BEKK-GARCH model is used. The sample period spans from 3 January 2018 to 17 September 2024. The results show that lagged shocks and volatility significantly and positively influence the current conditional volatility of commodity and stock returns during all periods. In fact, past shocks inversely influence the current volatility of stock indices in periods when external events disrupt financial markets. The results show a non-linear and positive impact of commodity volatility on the implied volatility of the stock markets. The findings suggest that the war significantly affected stock prices and exacerbated volatility, so investors should diversify their portfolios to maximize returns and reduce risk differently in times of crisis, and a lack of diversification of raw materials is a risky factor for investors.
1. Introduction
The war in Ukraine—which, like all wars, has not only military but also humanitarian and economic consequences—has put the world economy to the test. Developing countries are those that have seen a particularly dramatic impact. In fact, the two countries are among the granaries of the world, and together they supply around 30 percent of the wheat and barley, respectively, a fifth of the corn, and almost 70 percent of the sunflower oil1. In addition to this, the Russian Federation and Ukraine are among the main exporters of natural gas, oil, cast iron, enriched uranium, palladium, and nickel. Furthermore, Russia has a significant share in the exports of coal, platinum, and refined aluminum. Regarding Ukraine, among other commodities, it is the world’s largest exporter of sunflower oil and neon gas, which is a key input used to produce electronic chips. Finally, these two countries, together with Belarus, are important suppliers of fertilizers, including nitrogen and potassium.
As demonstrated by the data analyzed by OEC2, in 2022, Russia exported mineral fuels, oils, and products of its distillation for approximately USD 313B, metals for USD 37B, and precious stones for USD 30B. Instead, Ukraine exported cereals and vegetable oil for approximately USD 20B, metals and mineral products for USD 13B, and electrical machinery for USD 5B. If we compare the values with those of the year before the war, Russia notes an increase of 22.3 percent in mineral fuel exports, of 3.8 percent in aluminum, and of almost 7 percent in copper. Exports of iron and steel decreased by 32.5 percent, precious stones by 25.6 percent, and cereals by 41 percent. Ukraine is more affected by the consequences of the war. In fact, compared to a growth of 24.7 percent in exports of mineral fuels and 72.7 percent of oils, seeds, and grains, the exports of cereals decreased by 24.7 percent, by 67.3 percent of iron and steel, by 41.7 percent of mechanical appliances, by 55.2 percent of ores, slag, and ash, and by 17.8 percent of electrical machinery.
The two countries are among the world’s leading exporters of raw materials: not only in terms of quantities or destination countries, but above all in terms of economic importance. The principal destinations of mineral products and metals are Europe and Asia, which together reach more than 70 percent of exports. Europe holds a high percentage of mineral products and Asia for metals. In Asia, the main importing country is China. In fact, metals are necessary to supply industrial sectors in China. Instead, the main importers of cereals are Asia and Africa. About 80 percent of cereals are exported to these countries. The former requires agricultural products to provide the necessary nourishment to a very large population. For the latter, it is difficult to produce cereals as the climate makes the land difficult to cultivate. In this case, the comparison with the period before the war is very important because it shows the impact of the conflict on trade with individual countries.
If we consider Russia, it has increased trade with India by 430 percent, with China by 41 percent, and with Turkey by 26 percent. More difficult to interpret is the increase in exports with some European countries. There were increases in exports with Hungary of 116 percent, and between 20 and 80 percent with Italy, Germany, France, and Greece. Instead, trade recorded a negative sign with the United Kingdom of 74.2 percent and between 40 and 50 percent with the Netherlands, the United States, and Finland. The increase in trade with the EU countries can probably be explained by the fact that in 2022, the sanctions were just imposed and therefore had not yet limited trade. Furthermore, it should not be overlooked that European economies are very dependent on Russia for minerals and fuels for the functioning of their industrial apparatus, and in the short term, it is not possible to replace them unless production is interrupted.
If we consider Ukraine, we can see how, during the war, exports decreased to a greater extent than in Russia. This is probably because both land and sea communication routes have seen their functioning limited due to the war. In fact, if we exclude some countries territorially close to Ukraine—such as Poland, Romania, Hungary, and Slovakia—which recorded an increase in imports of around 50 percent, all other countries, even European ones, show decreases between 10 and 50 percent, China and India around 70 percent as well as African and Central American countries, which mainly import cereals. From this brief examination, it can be seen that Russia and Ukraine are among the main exporters of both agricultural and mineral commodities, and this is the reason behind our analysis. Given the importance of these two countries for world exports, we investigate whether the conflict altered market rules and prices and whether and how prices had effects on the stock markets of the G7 countries.
In Europe, international trade and in particular the raw materials market were devastated by the effects of the war. For this reason, prices have increased significantly for all energy raw materials and for some food. The impact of the war in Ukraine on commodity markets occurs through two main channels: the physical impact of blockades and the destruction of production capacity, and the impact on trade production because of sanctions. The consequences of the conflict in terms of increased prices of commodities and energy sources are tangible (Estrada and Koutronas 2022; Obi et al. 2023; Manelli et al. 2024). Conversely, the link between these aspects and the dynamics of financial markets may appear less linear and more complex.
From these emerges the need, little explored in the literature, to analyze the effects that the war produced on the transmission of price between commodities and G7 stock indices, and whether there are differences or similarities with previous financial and non-financial crises. Then, the aim of this paper is to study conditional volatility spillover effects and correlations between pairs of Industrial Metals and G7 stock indices. The analysis is all the more complete as it considers the American continent—the US and Canada—Asia, with Japan and Europe which is more attentive to the consequences of the conflict due to the proximity and intensity of trade. Unlike previous research that focuses on the correlation between financial and energy markets (Paientko and Amakude 2024; Mhadhbi and Guelbi 2024; Jude et al. 2023) or commodities (Zapata et al. 2023), this paper compares and contrasts the interactions between a group of metals that extend their use both in electronic and energy fields related to the new technologies as well as in the traditional industrial and mechanical sectors. Therefore, knowing which commodities show a greater connection with stock markets in periods of break will help policymakers, investors, and portfolio managers in their decisions. Decisions not only regarding economic policies that consider possible contagion effects between markets but, also, portfolio investments and hedging strategies.
2. Literature Review
2.1. Commodities and Financial Markets
The economic link between commodities and financial markets has been analyzed by numerous authors. Jebabli et al. (2014) analyze the transmission of shocks between food, energy, and financial markets during the 2008 crisis and show how volatility spillovers increase considerably after that date. Creti et al. (2013) investigate the links between commodity price returns and stock markets and show that correlations between markets change over time, and after the financial crisis are highly volatile. Mensi et al. (2013) indicate a significant correlation and transmission of volatility between commodity price indices and S&P 500 index. Ahmed and Huo (2021), Boubaker and Syed (2017) and Malik and Hammoudeh (2007) analyze the relationship between stock markets and oil. The former considers the Chinese stock market, commodity markets, and oil price indicating a significant one-way spillover effect from the oil market to the stock market and that the Chinese stock market is exposed to the oil market. Boubaker and Syed (2017) consider BRICS stock markets highlighting a time-varying volatility in all markets and that stock indices and oil prices are directly influenced by news and their volatility, and indirectly by the volatility of other prices. Finally, Malik and Hammoudeh (2007) examine the volatility and transmission mechanism of oil shocks with gulf stock markets showing how these markets receive volatility from the oil market, but only for Saudi Arabia is there propagation of volatility from the stock market to the oil market. Boldanov et al. (2016) analyze the correlation between the price of oil and the volatility of the stock market, which in turn is distinguished between oil-importing and oil-exporting countries. They indicate that the correlation between the two markets changes over time and is different, depending on whether there is an importing or exporting country. Furthermore, the analyses indicate that the correlations change when considerable economic and geopolitical events occur. Hanif et al. (2024) explore the connection between the stock markets of main producing and consuming countries and different commodity shocks and show variations in how these stock markets respond to oil shocks and that when extreme conditions occur, the interconnectedness of markets increases. Biswas et al. (2024) study how geopolitical tensions caused by war make crude oil a net receiver of shocks, from a transmitter of shocks before the war. It is the shocks transmitted by oil importers that transform it into a net receiver. However, when they consider platinum and wheat, they note that both exporters and importers have suffered volatility shocks. Similarly, Malik and Ewing (2009) estimate the variance between some US sector indices and oil prices and indicate the presence of a significant transmission of shocks and volatility between oil price and some of the market sectors examined. Ewing and Malik (2016) examine the volatility of oil prices and US stock market prices by incorporating structural breaks and find that there is strong volatility propagation between the two markets. Numerous contributions extend the analysis and consider the relationship between stock markets and other commodities. For example, Bouri et al. (2017), note that gold and oil are the main products imported from India and that therefore expectations on the volatility of these prices could modify the volatility of the Indian stock market. The results indicate not only the presence of cointegration and a positive impact of gold and oil volatilities on that of the stock market but also a bidirectional reverse causality between the implied volatility of gold and oil prices. Al-Yahyaee et al. (2019) analyze returns and risk spillovers between commodity futures and Gulf Cooperation Council stock markets and show the existence of significant return and risk spillovers between commodity and stock markets, particularly during the onset of the global financial crisis.
2.2. Russia–Ukraine Conflict and Commodity Prices
The impact of the Russia–Ukraine conflict has been the subject of study. In fact, the geopolitical crisis that emerged with the increase in commodity prices—first and foremost gas, oil, and wheat—has amplified the negative effects of the pandemic on the various economies, both importers and exporters of raw materials. This occurred more significantly after many countries, including European ones, imposed economic sanctions on Russia. Burns and Prager (2024) indicate that stock market volatility following the pandemic affected the positions of agricultural swap traders. As volatility in the financial market intensified, index traders limited their net long positions while commercial swap traders assimilated some of this by reducing their short positions. Izzeldin et al. (2023) compare the reaction of international financial markets and some commodity prices to the outbreak of the war in Ukraine with those recorded during the 2008 financial crisis and the COVID-19 pandemic and show an immediate reaction of global stock markets to the Russia–Ukraine war while, during the other two crises, the response of the financial markets was recorded with a certain delay. Karamti and Jeribi (2023) explore the impact of the Russia-Ukrainian war and the pandemic on stock markets, suggesting that G7 financial markets are more sensitive than others to changes in commodity prices during periods of market stress. Specifically, the conflict, throughout the prices of raw materials—gas and wheat—had a greater influence on those markets. Also, Lo et al. (2022) highlight a significant drop in yields and increase in volatility during the conflict. They attribute this to the strong dependence on Russian raw materials, a dependence perceived as a risk factor in financial markets. Given that the conflict has raised concerns about the stability of energy supplies from Russia, there is a large literature that analyzes the conflict and the dynamics of energy prices. Inacio et al. (2023) evaluate the impact of conflict on crude oil and refined product prices globally. The results indicate a significant difference between the pre- and war periods with a greater impact of the conflict on European diesel prices. Wang et al. (2023) analyze the performance of the Shanghai and S&P indices and the price of oil and gold during the conflict. The conclusions indicate a relative stability only for the Chinese index while other assets show an upward trend before the conflict and a downward trend afterward. Adekoya et al. (2023), examine multifractal and cross-correlation between oil prices and major stock markets and find multifractal behavior in oil and stock markets with a greater effect on oil persistence and European stock markets. Analyzing cross-correlations, they find evidence to support a greater effect of oil on the persistence of all stock markets during the war period. Furthermore, during the conflict the markets decreased their efficiency, and the impact of oil prices is greater for the US, Japan, and China whose stock markets are conditioned more indirectly by the Russia–Ukraine war and they are conditioned through the oil market. Regarding the volatility dynamics of the natural gas market, Chen et al. (2023) show the persistence of energy volatility that does not decrease after the crisis period of the Russia–Ukraine war.
2.3. Geopolitical Risk and Conflicts
There are also studies that have analyzed the conflict through the exploration of the economic consequences of geopolitical risk, showing how this has significant impacts on business and financial markets with particular emphasis on stock returns and volatility (Rigobon and Sack 2005; Choi 2022; Micallef et al. 2023). Russia–Ukraine conflict in 2022 has significantly increased geopolitical threats. The Russia–Ukraine conflict has been investigated from numerous aspects such as connections of financial markets, efficiency and risk (Boubaker et al. 2022; Umar et al. 2022; Qureshi et al. 2022) and the effect on stock returns (Boungou and Yatie 2022; Rossi et al. 2025). More attention was given to the analysis of the global market reaction after the conflict (Sun and Zhang 2022; Khalfaoui et al. 2023; Chortane and Pandey 2022; Yousaf et al. 2022). Ahmed et al. (2023) show that European stock markets reacted negatively to this crisis and experienced a significant abnormal return even in the period following the event. Focusing attention on NATO countries, Wu et al. (2023) study the impact of the conflict on stock volatility and show how it increases after Russia–Ukraine conflict. Furthermore, they highlight how NATO countries have constantly played the role of risk transmitter, and these regions are more sensitive to changes in the war situation unlike other countries that are more worried about the potential derivative effects of the conflict.
The literature reviewed highlights the importance of the correlation between financial and commodity markets in particular during periods of geopolitical risk. However, it is largely divided and is mainly limited to the analysis of spillovers among stock and energy markets. Our results deepen the growing literature examining the connection between geopolitical risk and stock and commodity markets, broadening the analysis of the relationship between stock prices and the Russia-Ukraine conflict. In fact, the role played by industrial metals exported by the two countries in the correlation with the stock market indices of the G7 group, indicates how to explain the notable heterogeneity of the effects of the war on the markets. One must not consider exclusively and predominantly the geographical proximity to the two belligerents but above all the extent of the commercial and economic ties that they maintain with the other countries.
3. Materials and Methods
To examine the effects of volatility transmission between financial indices and major commodities, we use the conditional covariance matrix. For the conditional mean equation, we exclude potential exogenous variables that might have an effect on the volatility of the considered returns. The equation is
where is the vector of price returns, is the vector of parameters of the mean of the returns, and is the vector of residuals. In this paper, we employ diagonal BEKK-GARCH model proposed by Engle and Kroner (1995), to estimate the conditional variance-covariance matrix. The BEKK model offers a good fit of the dynamics of the variance; it is invariant to linear combinations and the structure of the model automatically guarantees the positive determinacy of the . The underlying stochastic process of the diagonal BEKK model allows the QMLE of the parameters to be established as consistent and asymptotically normal, so that the standard statistical inference for hypothesis testing is valid (Hsu et al. 2021; Katsiampa et al. 2022; McAleer 2019). The diagonal BEKK(1,1) model, when is thus specified below: is thus specified below:
where is a constant vector, and is a residual vector with a normal distribution and a mean of zero. is the matrix of conditional variance-covariance and by definition is positive. The constant , is a part of the lower triangular vector , which is also a constant matrix. is a residual parameter matrix that includes to capture the ARCH effect in the residual in markets and . B is a conditional variance matrix where stands for the relationship between the conditional variance between markets and . Then, the diagonal elements of matrices and capture the impact of past shocks and past volatility of the asset. On the other hand, and , where , capture the cross-market effects of shocks and volatility, Li and Majerowska (2008). These cross-markets effects are shock transmission effects and volatility spillover effects. We utilize the Wald Test to test the null hypothesis that the difference between A and B equals zero in order to evaluate the volatility spillover effects.
The unrestricted BEKK model in bivariate form is given by:
The equation-by-equation model is given as follows:
The conditional correlation between each financial index and industrial metals index can be estimated by the following equation:
where and are the two pairs of conditional variances, while is the corresponding conditional covariance.
4. Results
In the analysis we examine the price of S&P Industrial Metals and stock market indices of G7 countries. Although the consequences of the conflict in financial markets are well known and deep analyzed, other essays mainly consider the WTI or gold to go through the impact of the conflict on the financial markets. We use the S&P Industrial Metals index because it is a reliable reference for the market trend of the relevant commodities—such as iron, copper, aluminum, and nickel—exported by Russia and Ukraine. In addition, these metals are extremely necessary for the functioning of the industrial equipment and for the energy transition. Therefore, the novelty of our research lies in the significant spillovers between the Industrial Metals index and G7 financial indices. In particular, we consider the daily returns of S&P Industrial Metals index and G7 indices—US (S&P 500), Canada (TSX 60), UK (FTSE 100), Japan (NIKKEI 225), Germany (DAX 30), France (CAC 40) and Italy (FTSE MIB). The indices of the economies belonging to the G7 were considered in the analysis because they are countries similar to each other in terms of development but at the same time they are different in terms of the degree of trade with Russia and Ukraine. Then, if on the one hand this makes the analysis robust and comparable, on the other it allows us to grasp the differences and trace them, at least in part, to the greater or lesser interconnection with the two belligerents. In addition, it gives us a more complete picture of the effects of the war on the markets of heterogeneous countries various linked to Russia and Ukraine. As seen above, Russia and Ukraine are among the main commodity-exporting countries and exports range from energy raw materials to precious metals up to agricultural products. However, following the pandemic and the conflict the demand for commodities increased due to the resulting economic revival and the demand for industrial metals has also increased both to limit the dependence on fossil fuels and to accelerate the ecological transition that various Western countries are pursuing. The sample period—3 January 2018, to 17 September 2024—was marked by some events, such as the pandemic and the Russia–Ukraine war, which were able to have an impact on the markets. The sample therefore consists of 1833 observations for each time series. The analysis begins in January 2018 so that the pre-conflict period is broad and mitigates the effect that the pandemic had on the markets. For these reasons, we split the sample into two periods: the pre-conflict period—spanning from 3 January 2018 to 23 February 2022—and the conflict period—spanning from 24 February 2022 to 17 September 2024. The data are collected by Refinitiv Eikon. The daily closing price returns are defined as follows:
where is the daily price of each market index at time .
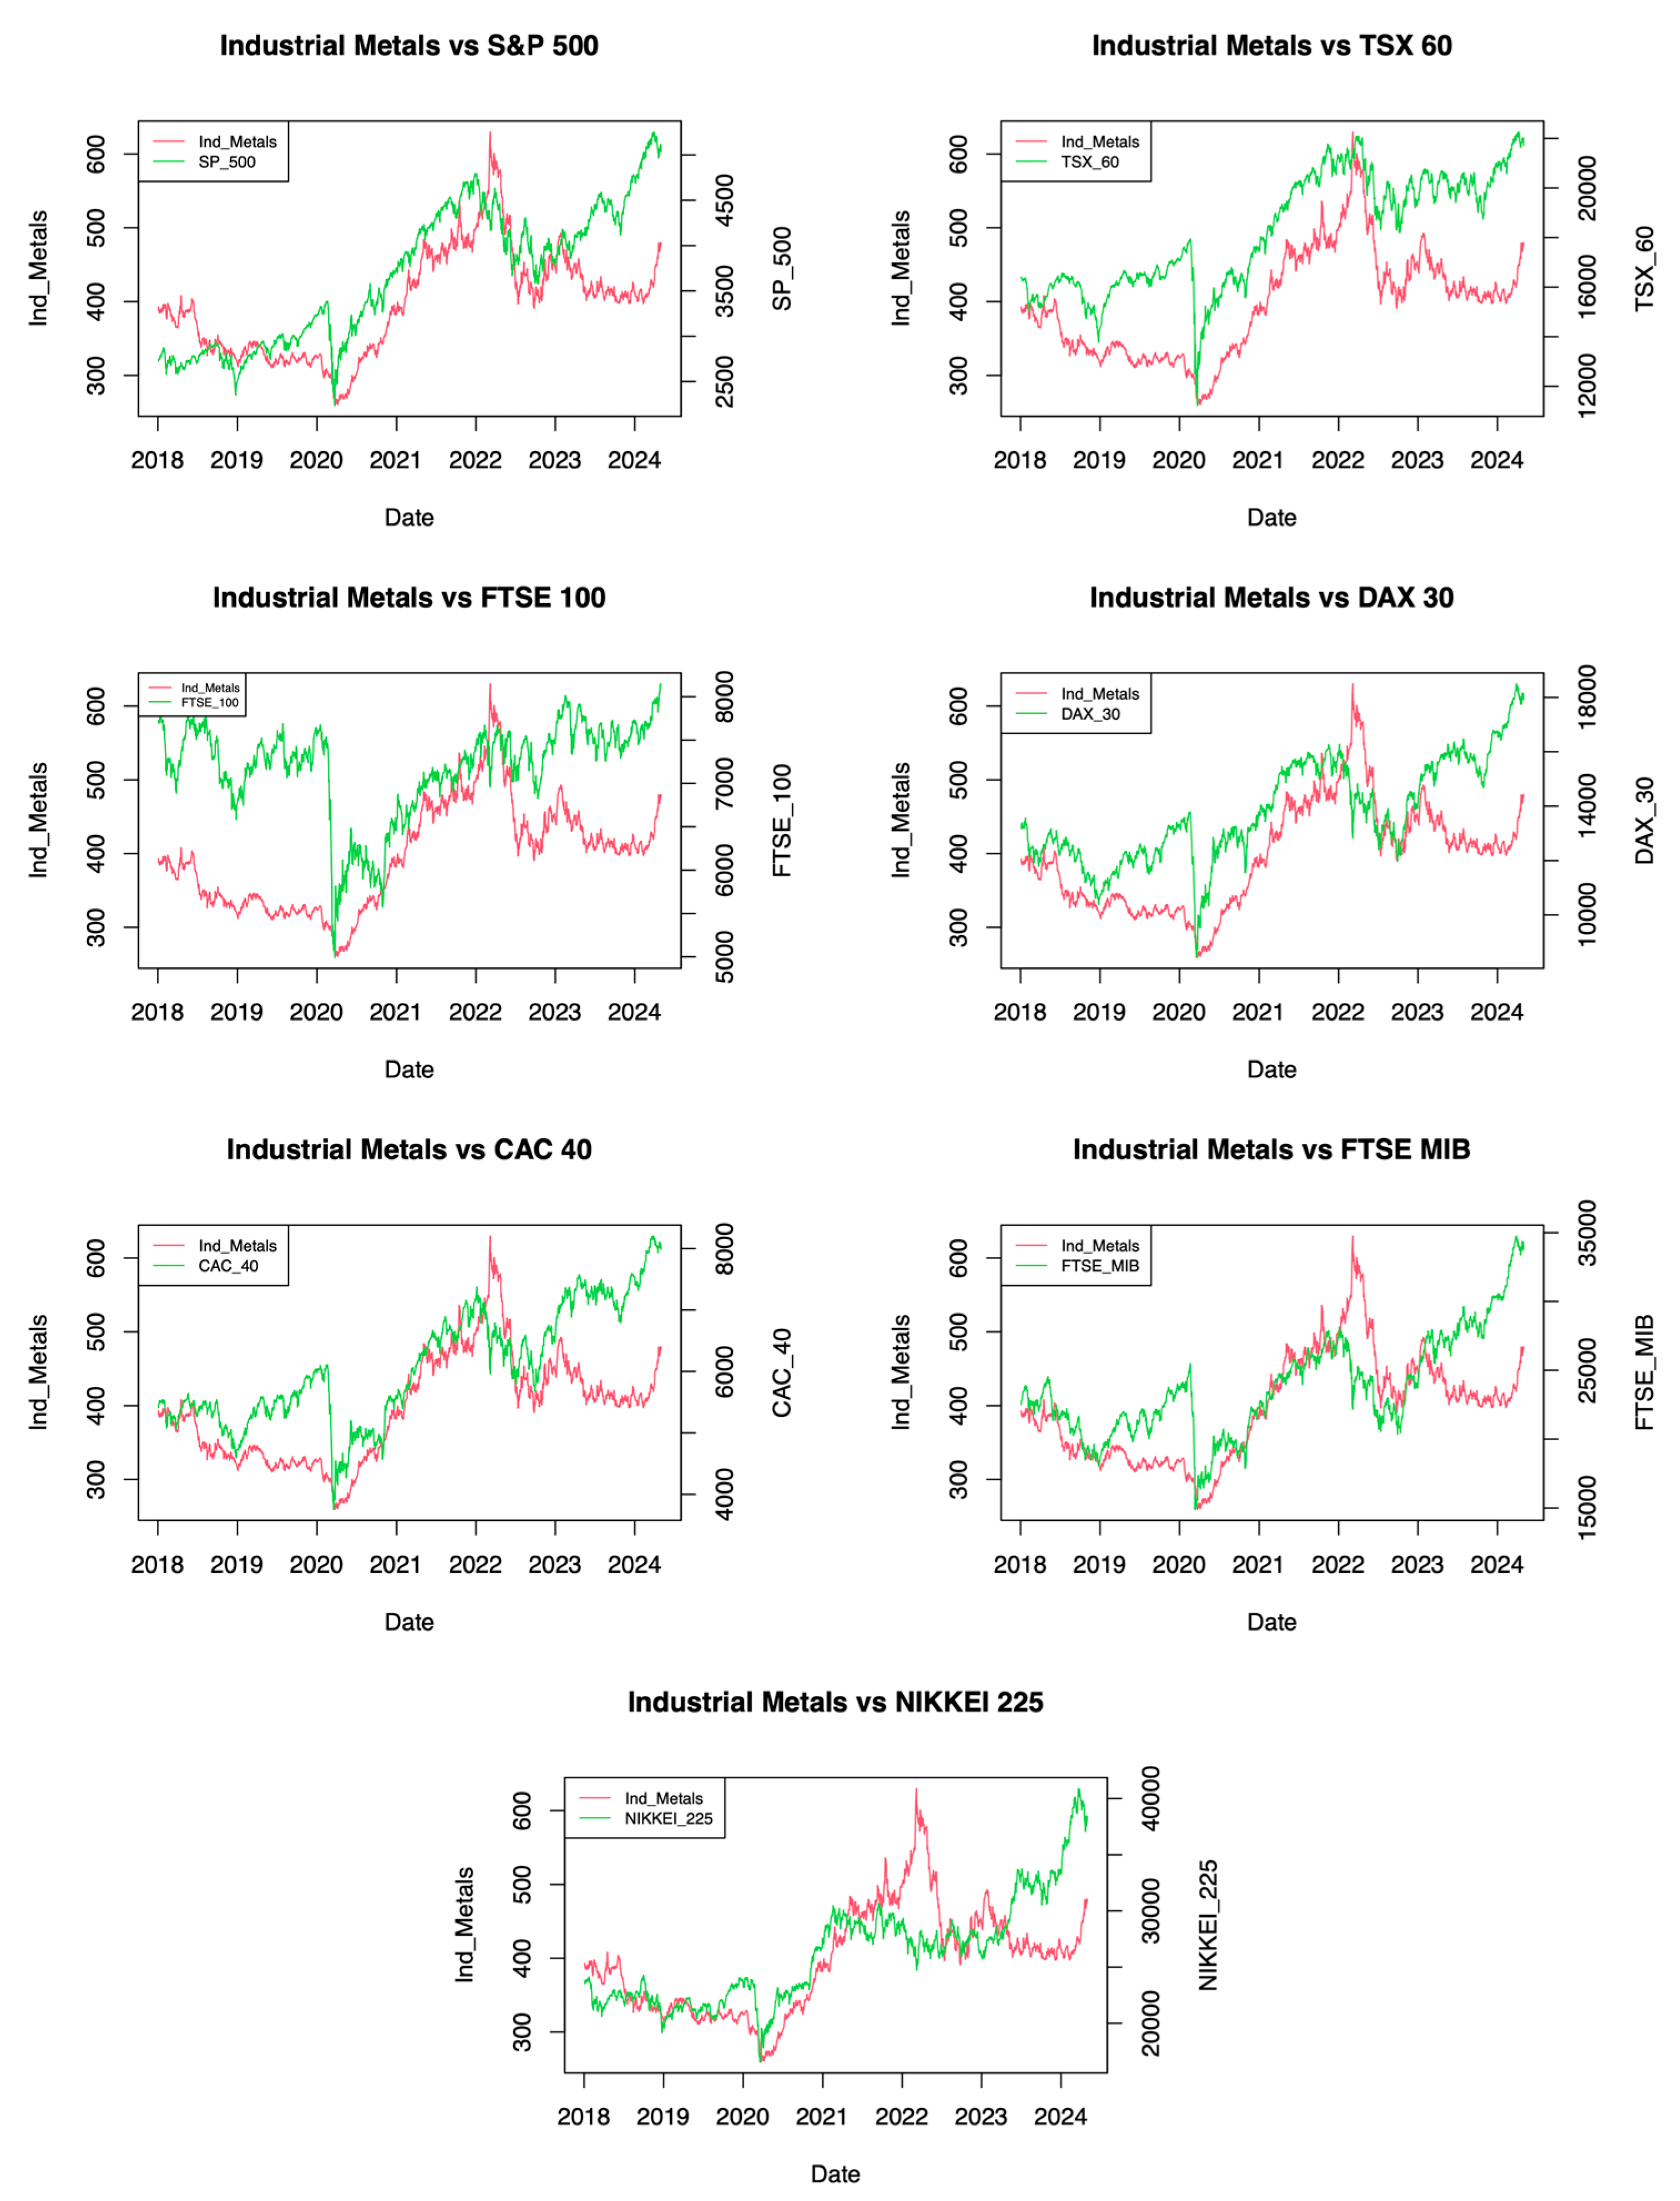
The sample period was marked by some events such as the Russia–Ukraine war which were able to have an impact on the markets. In fact, the conflict between Russia and Ukraine raised the price of commodities. In particular, although the prices of all the commodities analyzed began their growth at the end of 2021, not all of them showed the same trend. Figure 1 shows the relationship between the S&P Industrial Metals and the G7 indices. The graphical analysis shows that the analyzed indices reacted differently to the war than they did to the outbreak of the pandemic. In fact, after the conflict all financial market indices decreased, beyond 10 percent but reached their minimum between September and October 2022, a few months after it started. In 2022, after the start of the conflict, the European indices—DAX 30, CAC 40 and FTSE MIB—show a greater decrease compared to the others. This probably can be explained by the fact that European countries are most affected by the conflict given the magnitude of trade with Russia and Ukraine. In general, the American and European stock markets show similar trends with growing values until the beginning of 2022, which overall is very volatile, and at the end of the year show a slight decline, more marked for European countries. The Asian market, after the growth phase at the beginning of 2021, shows a stable value throughout 2022 and at the beginning of 2023 a growth phase begins again. The S&P Industrial Metals index behaved in a completely different way and did not record a decrease in prices but continued in its growth path, which began in 2020 and reached its maximum on the day after the conflict.
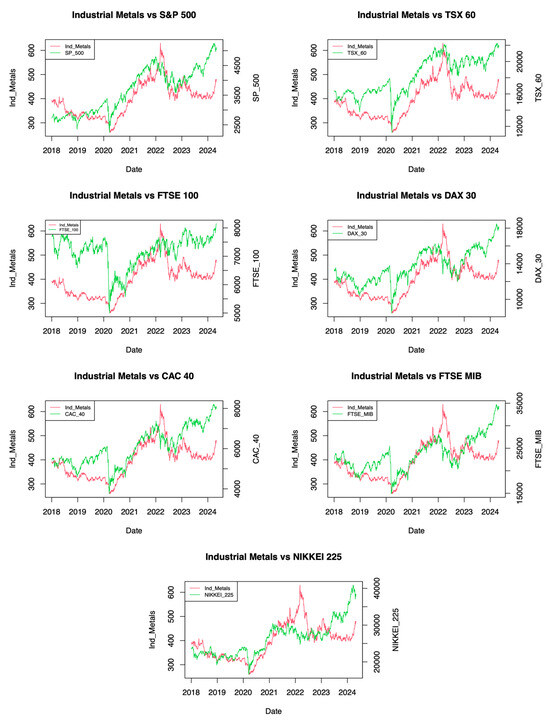
Figure 1.
Stock indices and Industrial metals.
Table 1 presents the descriptive statistics for stock markets and commodities. If we examine the difference between max and min, we note that the greatest gap is recorded in commodity markets. But all series show a positive and close to zero mean, except industrial metals in the conflict period. The skewness shows negative values for all indices, except in the pre-conflict period, CAC 40, DAX 30, and industrial metals, and this is also true in all samples. In any case, all values are close to zero, indicating a greater level of skewness. Also, for kurtosis, all indices show positive values, and in some cases, they are higher than 3, indicating a leptokurtic distribution. The results of the Augmented Dickey-Fuller test for the presence of a unit root and the PP test for stationarity confirm that all returns are stationary for all the periods considered.

Table 1.
Descriptive statistics.
In this section, we analyze the estimation of pairwise models employing the BEKK framework. The pairs are made up of each market index of the G7 countries compared to the Industrial Metals index. The indices of the economies belonging to the G7 were considered in the analysis because they are countries like each other in terms of development, but at the same time different in terms of the degree of trade with Russia and Ukraine. Then, if on the one hand this makes the analyses robust and comparable, on the other, it allows us to grasp the differences and trace them, at least in part, to the greater or lesser interconnection with the two belligerents. Furthermore, it gives us a more complete picture of the effects of the war on the markets of heterogeneous countries variously linked to Russia and Ukraine. Table 2 reports the estimation results for each pair and for all periods. The coefficients and represent the constant term of the mean equation; instead, , and are the constant term of the variance equation. It is explained in more detail the diagonal parameters in matrix A that capture the ARCH effects, the own shock, and and the diagonal parameters in matrix B that capture the GARCH effects, own volatility spillovers, and . Whereas the results of the coefficient estimate and , at the 1% level are statistically significant in many cases, it is possible to state that current volatility is significantly influenced by one’s past squared shocks and one’s past volatility. And this is irrespective of the pairs considered. Furthermore, the fact that for all the pairs considered, indicates that current conditional variances are affected more by the size of previous conditional variances rather than by the size of previous innovations. Therefore, the considerations made regarding the fact that past volatility coefficients are higher than past shock coefficients allow us to state that previous volatilities are a more significant predictor of current volatilities than past own shocks, and this for all sample periods. Thus, the results show that lagged shocks and volatility significantly and positively influence the current conditional volatility of commodities and stock returns in most countries analyzed during two periods. In particular, during the conflict period, the spillover effects of the shocks themselves are positive and significant on stock returns across all countries. Then, the results suggest that past shocks inversely influence the current volatility of stock returns in periods when external events disrupt financial markets.
Table 2.
BEKK estimates.
If we examine the shocks and volatility spillovers between indices and Industrial Metals, i.e., the off-diagonal elements of matrices and and with we see evidence of significant cross-market effects between return variability given the significant two-way transmission links and volatility. In fact, in many pairwise models the estimates of , and , are statistically significant at the 1% level. More specifically, there is evidence of bidirectional shock transmission effects between stock indices and Industrial Metals as the off-diagonal parameters, and , are both statistically significant, in Italian, Japanese, and Canadian markets. It should be noted, however, that all values are negative, except for NIKKEI 225 in which is positive. Consequently, past news on shocks in these markets that delayed shocks in one market negatively influence the current conditional volatility of the other. While in the case of the NIKKEI 225 index result suggests that past news on shocks negatively affects the current conditional volatility of Industrial Metals, while previous shocks in Industrial Metals have a positive impact on the current volatility of the NIKKEI 225 index. Even in these pairs, however, the bidirectional shock spillover suggests interdependencies between stock indices and Industrial Metals as well as between Industrial Metals and stock indices. In fact, a bidirectional volatility spillover effect between stock indices and crude oil is highlighted, as both and are statistically significant at 5% level for FTSE MIB, with the estimate of being significant at the 1% level in the case of TSX 60. Then it can be said that the current conditional volatility of the indices depends both on their past volatility and on the past volatility of Industrial Metals. This suggests interconnections between financial markets and Industrial Metals. This is true for the all sample. If we examine separately the pre-conflict and conflict periods we note similar results in the pre-conflict period. In the conflict period, we note a negative and significant coefficient in European markets (CAC 40, DAX 30, and FTSE MIB) and positive with S&P 500. Then, past news on shocks negatively affects the current conditional volatility of Industrial Metals for the former markets and positively for the latter market. Furthermore, given that is significant for the S&P 500 and for CAC 40, DAX 30, FTSE 100, FTSE MIB, and TSX 60, we affirm that the past conditional volatility of S&P 500 negatively affects the current volatility of Industrial Metals. While the past volatility of Industrial Metals positively affects the current volatility of European stock indices, and negatively affects the volatility of the TSX 60 index.
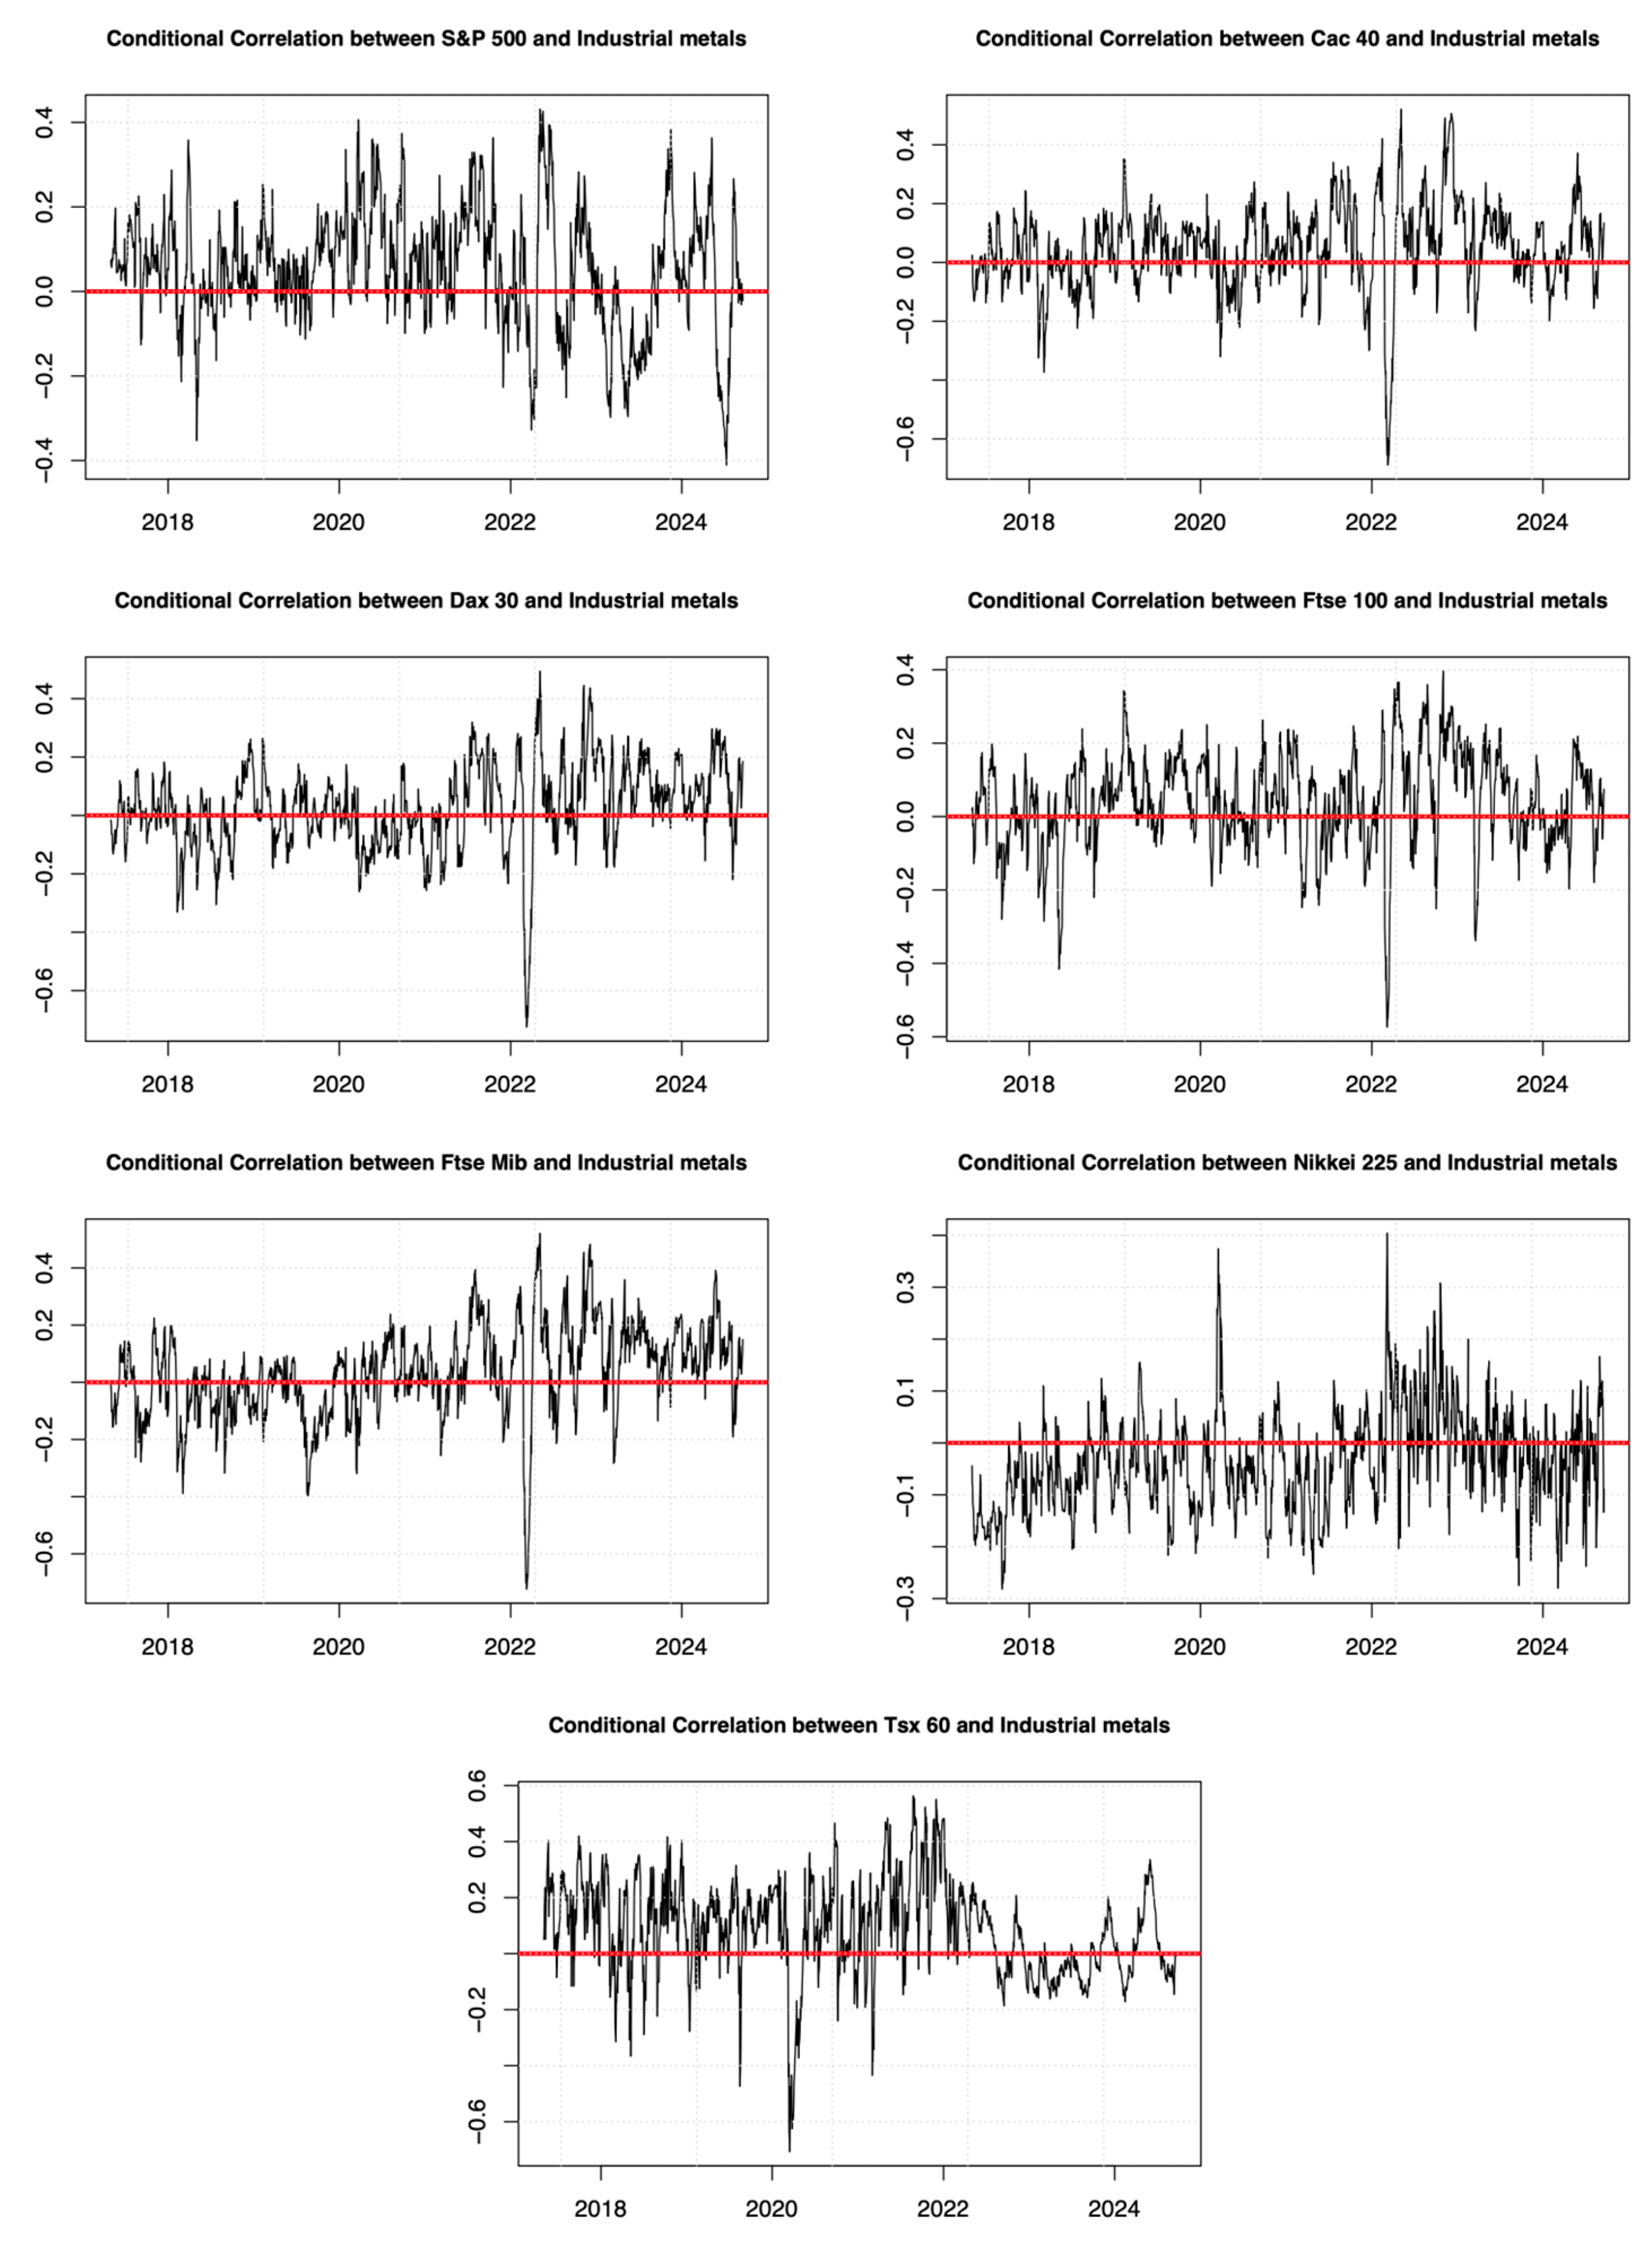
Finally, the conditional correlation graphs between the different pairs confirm the dynamic conditional correlations. The correlations take both positive and negative values, although mostly positive correlations are observed especially after 2022. These seem to be associated with the effects that the war between Russia and Ukraine has had on the markets, and in particular on that of Industrial Metals.
In Figure 2, the graphs of the conditional correlations between the different pairs of stock indices. These reinforce the dynamic correlations between the pairs. Furthermore, the graphs show how the correlations assume both positive and negative values, although mostly positive correlations are observed. Moreover, the high peaks in the conditional correlations, both positive and negative, occur in correspondence with the conflict between Russia and Ukraine especially for European stock indices. Furthermore, it is noted how the correlations assume greater variability in all stock markets.
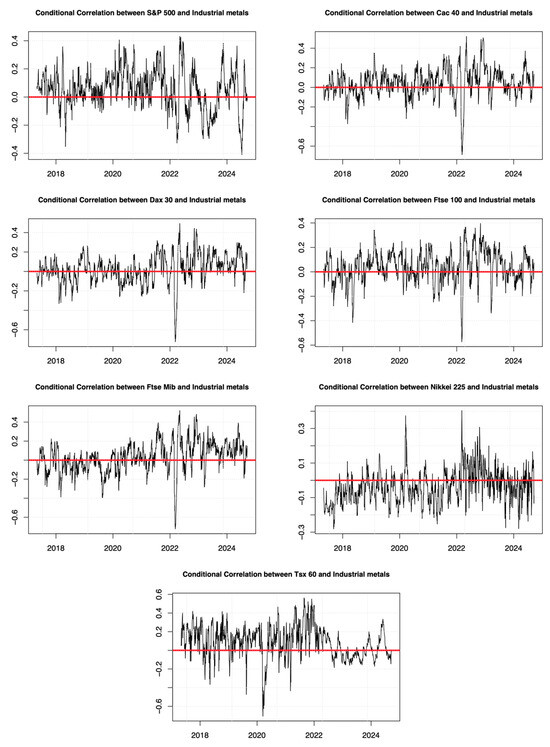
Figure 2.
Conditional correlation.
5. Conclusions
The Russia–Ukraine conflict has altered economic dynamics and global balances with commodity prices experiencing remarkable increases. These effects recorded in the commodity markets have also had a backlash on the stock markets of different countries. Then, we analyze the relationship between the stock return of G7 countries and the S&P Industrial Metals index, distinguishing the pre-Conflict and Conflict period. Through the application of pair-wise bivariate BEKK models for stock market index-commodity pairs, the conditional volatility dynamics and the conditional linkages and correlations between the pairs were analyzed. The results showed evidence of bidirectional shock transmission effects between financial indices and commodities. Furthermore, we identified bidirectional volatility spillover effects between numerous pairs. Finally, it was shown that there are time-varying conditional correlations with positive correlations mostly prevailing. These results provide strong evidence for the progress of market integration and further support the findings of previous studies on interdependencies.
Future studies could focus on examining the long-term dynamics between other stock markets and commodities by comparing the results among the various groups or countries, or they could consider how different types of geopolitical events impact differently the stock indices of the various countries. In this regard, although we have provided tentative explanations, formal statistical analyses of the role of various geopolitical uncertainty indices and the dynamics between stock and commodity markets are a limitation of our work.
Practical Implications
Despite the above-mentioned limitations, the findings have significant implications for portfolio managers, investors, and policymakers.
First, the results of the BEKK model have clear implications for hedgers. In fact, given the temporal variability between the commodity index and the stock markets and the long-lasting nature of the propagation of volatility spillover in the war period, the portfolio weights should be adjusted: a commodity index hedge for these markets is only effective for the conflict period when tension on commodity markets has increased. Furthermore, asymmetries can lead to a reduction in the impact of the previous volatility of each index on its current volatility. Chancharat and Sinlapates (2023) reach similar results regarding the correlation between oil and the Asian stock markets. In practice, the results show that in periods of high volatility and instability, investors should use great caution in their choices. Indeed, the stock market presents numerous risks and opportunities for investors particularly during times of crisis, and it is this that underlies changes in diversification strategies that must be adapted to the type of outbreak.
Second, understanding the relationship between stock and by onself commodity markets, particularly industrial metals, is useful for investors to develop more rational investment strategies. Consequently, enable market participants to make more informed decisions.
Third, policymakers in order to maintain stable financial markets, should develop and implement robust risk management policies that consider how geopolitical risk modifies the relationship between one market and another.
Therefore, in regulatory development, policymakers should favor targeted and flexible policies that differ according to changing market situations, with particular attention to periods of transitions from stable to turbulent phases.
Policymakers have sought to strengthen the security of supply of raw materials to reduce dependence on imports from Russia. The limited diversification of raw material supplies is a risk factor for investors, but even more so for policymakers’ decisions. From this perspective, the Russia–Ukraine war fueled energy security problems while, as argued by Deng et al. (2023), most investors were directed towards climate regulation. Then, in the long term, the way to combine the two needs is to increase the share of renewable energy. The analysis shows how different markets—financial and commodity markets—follow dissimilar patterns and respond to the boost in different ways. Then, this mechanism must be clearly distinguished and understood to limit the risks and seize the opportunities they offer.
Author Contributions
Conceptualization, M.L. and R.P.; methodology, M.L.; software, M.L.; validation, M.L. and R.P.; formal analysis, M.L.; data curation, M.L.; writing—original draft preparation, M.L. and R.P.; writing—review and editing, M.L., A.M. and R.P.; supervision, A.M.; funding acquisition, A.M. All authors have read and agreed to the published version of the manuscript.
Funding
This research received no external funding.
Data Availability Statement
The raw data supporting the conclusions of this article will be made available by the authors on request.
Conflicts of Interest
The authors declare no conflicts of interest.
Notes
| 1 | Available online: www.usda.gov (accessed on 1 April 2025). |
| 2 | Cfr. Available online: www.oec.world/en (accessed on 1 April 2025). |
References
- Adekoya, Oluwasegun B., Mahdi G. Asl, Johnson A. Oliyide, and Parviz Izadi. 2023. Multifractality and cross correlation between the crude oil and the European and non-European stock markets during the Russia-Ukraine war. Resources Policy 80: 103134. [Google Scholar] [CrossRef]
- Ahmed, Abdullahi D., and Rui Huo. 2021. Volatility transmissions across international oil market, commodity futures and stock markets: Empirical evidence from China. Energy Economics 93: 104741. [Google Scholar] [CrossRef]
- Ahmed, Shaker, Mostafa M. Hasan, and Md R. Kamal. 2023. Russia-Ukraine crisis: The effects on the European stock market. European Financial Management 29: 1078–118. [Google Scholar] [CrossRef]
- Al-Yahyaee, Khamis Hamed, Walid Mensi, Ahmet Sensoy, and Sang Hoon Kang. 2019. Energy, precious metals and GCC stock markets: Is there any risk spillover? Pacific-Basin Finance Journal 56: 45–70. [Google Scholar] [CrossRef]
- Biswas, Priti, Prachi Jain, and Debasish Maitra. 2024. Are shocks in the stock markets driven by commodity markets? Evidence from Russia-Ukraine war. Journal of Commodity Markets 34: 100387. [Google Scholar] [CrossRef]
- Boldanov, Rustam, Degiannakis Stavros, and George Filis. 2016. Time-varying correlation between oil and stock market volatilities: Evidence from oil-importing and oil-exporting countries. International Review of Financial Analysis 48: 209–20. [Google Scholar] [CrossRef]
- Boubaker, Heni, and Ali Raza Syed. 2017. A wavelet analysis of mean and volatility spillovers between oil and BRICS stock markets. Energy Economics 64: 105–17. [Google Scholar] [CrossRef]
- Boubaker, Sabri, John W. Goodell, Dharen K. Pandey, and Vineeta Kumari. 2022. Heterogeneous impacts of wars on global equity markets: Evidence from the invasion of Ukraine. Finance Research Letters 48: 102934. [Google Scholar] [CrossRef]
- Boungou, Whelsy, and Alhonita Yatie. 2022. The impact of the Ukraine-Russia war on world stock market returns. Economics Letters 215: 110516. [Google Scholar] [CrossRef]
- Bouri, Elie, Anshul Jain, P. C. Biswal, and David Roubaud. 2017. Cointegration and nonlinear causality amongst gold, oil, and the Indian stock market: Evidence from implied volatility indices. Resources Policy 52: 201–6. [Google Scholar] [CrossRef]
- Burns, Christopher B., and Daniel L. Prager. 2024. Do agricultural swaps co-move with equity markets? Evidence from the COVID-19 crisis. Journal of Commodity Markets 34: 100405. [Google Scholar] [CrossRef]
- Chancharat, Surachai, and Parichat Sinlapates. 2023. Dependencies and dynamic spillovers across crude oil and stock markets throughout the COVID-19 pandemic and Russia-Ukraine conflict: Evidence from the ASEAN+6. Finance Research Letters 57: 104249. [Google Scholar] [CrossRef]
- Chen, Shengming, Ahmed Bouteska, Taimur Sharif, and Mohammad Z. Abedin. 2023. The Russia- Ukraine war and energy market volatility: A novel application of the volatility ratio in the context of natural gas. Resources Policy 85: 103792. [Google Scholar] [CrossRef]
- Choi, Sun-Yong. 2022. Evidence from a multiple and partial wavelet analysis on the impact of geopolitical concerns on stock markets in North-East Asian countries. Finance Research Letters 46: 102465. [Google Scholar] [CrossRef]
- Chortane, Sana G., and Dharen K. Pandey. 2022. Does the Russia-Ukraine war lead to currency asymmetries? A US dollar tale. The Journal of Economic Asymmetries 26: e00265. [Google Scholar] [CrossRef]
- Creti, Anna, Marc Joets, and Valerie Mignon. 2013. On the links between stock and commodity markets’ volatility. Energy Economics 37: 16–28. [Google Scholar] [CrossRef]
- Deng, Jing, Zheng, Huike, and Xiaoyun Xing. 2023. Dynamic spillover and systemic importance of global clean energy companies: A tail risk network perspective. Finance Research Letters 55: 103990. [Google Scholar] [CrossRef]
- Engle, Robert F., and Kenneth F. Kroner. 1995. Multivariate simultaneous generalized ARCH. Econometric Theory 11: 122–50. [Google Scholar] [CrossRef]
- Estrada, Mario A. R., and Evangelos Koutronas. 2022. The impact of the Russian Aggression against Ukraine on the Russia-EU trade. Journal of Policy Modelling 44: 599–616. [Google Scholar] [CrossRef]
- Ewing, Bradley T., and Farooq Malik. 2016. Volatility spillovers between oil prices and the stock market under structural breaks. Global Finance Journal 29: 12–23. [Google Scholar] [CrossRef]
- Hanif, Waqas, Sinda Hadhri, and Rim El Khoury. 2024. Quantile spillovers and connectedness between oil shocks and stock markets of the largest oil producers and consumers. Journal of Commodity Markets 34: 100404. [Google Scholar] [CrossRef]
- Hsu, Shu-Han, Chwen Sheu, and Jiho Yoon. 2021. Risk spillovers between cryptocurrencies and traditional currencies and gold under different global economic conditions. The North American Journal of Economics and Finance 57: 101443. [Google Scholar] [CrossRef]
- Inacio, C. M. C, L. Khristoufek, and S. A. David. 2023. Assessing the impact of the Russia-Ukraine war on energy prices: A dynamic cross-correlation analysis. Physica A: Statistical Mathematics and its Application 626: 129084. [Google Scholar] [CrossRef]
- Izzeldin, Marwan, Yaz G. Muradoglu, Vasileios Pappas, Athina Petropoulou, and Sheeja Sivaprasad. 2023. The impact of the Russia-Ukrainian war on global financial markets. International Review of Financial Analysis 87: 102598. [Google Scholar] [CrossRef]
- Jebabli, Ikram, Mohamed Arouri, and Frederic Teulon. 2014. On the effects of world stock market and oil price shocks on food prices: An empirical investigation based on TVP-VAR models with stochastic volatility. Energy Economics 45: 66–98. [Google Scholar] [CrossRef]
- Jude, Octavian, Avraham Turgeman, Claudiu Botoc, and Laura Raisa Milos. 2023. Volatility and spillover effects between Central-Eastern European stock markets and energy markets: An emphasis on crisis periods. Energies 16: 6159. [Google Scholar] [CrossRef]
- Karamti, Chiraz, and Ahmed Jeribi. 2023. Stock markets from COVID-19 to the Russia-Ukraine crisis: Structural breaks in interactive effects panels. The Journal of Economic Asymmetries 28: e00340. [Google Scholar] [CrossRef]
- Katsiampa, Paraskevi, Larisa Yarovaya, and Damian Zieba. 2022. High-frequency connectedness between Bitcoin and other top-traded crypto assets during the COVID-19 crisis. Journal of International Financial Markets, Institutions and Money 79: 101578. [Google Scholar] [CrossRef]
- Khalfaoui, Rabeh, Giray Gozgor, and John W.Goodell. 2023. Impact of Russia-Ukraine war attention on cryptocurrency: Evidence from quantile dependence analysis. Finance Research Letters 52: 103365. [Google Scholar] [CrossRef]
- Li, Hang, and Ewa Majerowska. 2008. Testing stock market linkages for Poland and Hungary: A multivariate GARCH approach. Research in International Business and Finance 22: 247–66. [Google Scholar] [CrossRef]
- Lo, Gaye-Del, Isaac Marcelin, Theophile Bassene, and Babacar Sen. 2022. The Russo-Ukrainian war and financial markets: The role of dependence on Russian commodities. Finance Research Letters 50: 103194. [Google Scholar] [CrossRef]
- Malik, Farooq, and Bradley T. Ewing. 2009. Volatility transmission between oil prices and equity sector returns. International Review of Financial Analysis 18: 95–100. [Google Scholar] [CrossRef]
- Malik, Farooq, and Shawkat Hammoudeh. 2007. Shock and volatility transmission in the oil, US and Gulf equity markets. International Review of Economics and Finance 16: 357–68. [Google Scholar] [CrossRef]
- Manelli, Alberto, Roberta Pace, and Maria Leone. 2024. Russia-Ukraine conflict, commodities and stock market: A quantile VAR analysis. Journal of Risk and Financial Management 17: 29. [Google Scholar] [CrossRef]
- McAleer, Michael. 2019. What they did not tell you about algebraic non- existence, mathematical (ir-)regularity and (non-)asymptotic properties of the full BEKK dynamic conditional covariance model. Journal of Risk and Financial Management 12: 66. [Google Scholar] [CrossRef]
- Mensi, Walid, Makram Beljid, Adel Boubaker, and Shunsuke Managi. 2013. Correlations and volatility spillovers across commodity and stock markets: Linking energies, food, and gold. Economic Modelling 32: 15–22. [Google Scholar] [CrossRef]
- Mhadhbi, Khalil, and Ines Guelbi. 2024. Oil price volatility and MENA stock markets: A comparative analysis of oil exporters and importers. Engineering Proceedings 68: 63. [Google Scholar] [CrossRef]
- Micallef, Josep, Simon Grima, Jonathan Spiteri, and Ramona Rupeiga-Apoga. 2023. Assessing the causality relationship between the geopolitical risk index and the agricultural commodity markets. Risks 11: 84. [Google Scholar] [CrossRef]
- Obi, Pat, Freshia Waweru, and Moses Nyangu. 2023. An event study on the reaction of equity and commodity markets to the onset of Russia-Ukraine conflict. Journal of Risk and Financial Management 16: 256. [Google Scholar] [CrossRef]
- Paientko, Tatiana, and Stanley Amakude. 2024. Interconnected markets: Unveiling volatility spillovers in commodities and energy markets through BEKK-GARCH modelling. Analytics 3: 11. [Google Scholar] [CrossRef]
- Qureshi, Anum, Muhammad S. Rizwan, Ghufran Ahmad, and Dawood Ashraf. 2022. Russia- Ukraine war and systemic risk: Who is taking the heat? Finance Research Letters 48: 103036. [Google Scholar] [CrossRef]
- Rigobon, Roberto, and Brian Sack. 2005. The effects of war risk on US financial markets. Journal of Banking & Finance 29: 1769–89. [Google Scholar] [CrossRef]
- Rossi, Fabrizio, Yinan Ni, Antonio Salvi, Yanfei Sun, and Richard J. Cebula. 2025. Energy supply shock on European stock markets: Evidence from the Russia-Ukraine war. Journal of Risk and Financial Management 18: 223. [Google Scholar] [CrossRef]
- Sun, Meihong, and Chao Zhang. 2022. Comprehensive analysis of global stock market reactions to the Russia-Ukraine war. Applied Economics Letters 30: 2673–80. [Google Scholar] [CrossRef]
- Umar, Zaghum, Onur Polat, Sun-Yong Choi, and Tamara Teplova. 2022. The impact of the Russia- Ukraine conflict on the connectedness of financial markets. Finance Research Letters 48: 102976. [Google Scholar] [CrossRef]
- Wang, Zhengzhong, Shuihan Liu, Yunjie Wei, and Shouyang Wang. 2023. Estimating the impact of the outbreak of wars on financial assets: Evidence from Russia-Ukraine conflict. Heliyon 9: e21380. [Google Scholar] [CrossRef] [PubMed]
- Wu, Feng-Lin, Xu-Dong Zhan, Jia-Qi Zhou, and Ming-Hui Wang. 2023. Stock market volatility and Russia-Ukraine conflict. Finance Research Letters 55: 103919. [Google Scholar] [CrossRef]
- Yousaf, Imran, Ritesh Patel, and Larisa Yarovaya. 2022. The reaction of G20+ stock markets to the Russia-Ukraine conflict “black-swan” event: Evidence from event study approach. Journal of Behavioral and Experimental Finance 35: 100723. [Google Scholar] [CrossRef]
- Zapata, Hector O., Junior E. Betanco, Maria Bampasidou, and Michael Diliberto. 2023. A cyclical phenomenon among stock and commodity markets. Journal of Risk and Financial Management 16: 320. [Google Scholar] [CrossRef]
Disclaimer/Publisher’s Note: The statements, opinions and data contained in all publications are solely those of the individual author(s) and contributor(s) and not of MDPI and/or the editor(s). MDPI and/or the editor(s) disclaim responsibility for any injury to people or property resulting from any ideas, methods, instructions or products referred to in the content. |
© 2025 by the authors. Licensee MDPI, Basel, Switzerland. This article is an open access article distributed under the terms and conditions of the Creative Commons Attribution (CC BY) license (https://creativecommons.org/licenses/by/4.0/).