1. Introduction
The insurance sector is an essential segment of the financial market and institutions. Policymakers are using the sector to decrease and eliminate technical insurance risk. The rational development of the insurance sector is a crucial assumption for satisfactory economic development. The sector’s stability is a crucial problem and is managed by the regulatory rules of the regulatory authority and by inner risk-eliminating measures.
The Czech economy is specifically due to its considerable openness, and the insurance sector is growing, relatively stable, and adaptable to economic cycles and unexpected economic shocks. According to (
OECD.Stat 2022;
Czech Insurance Association 2023;
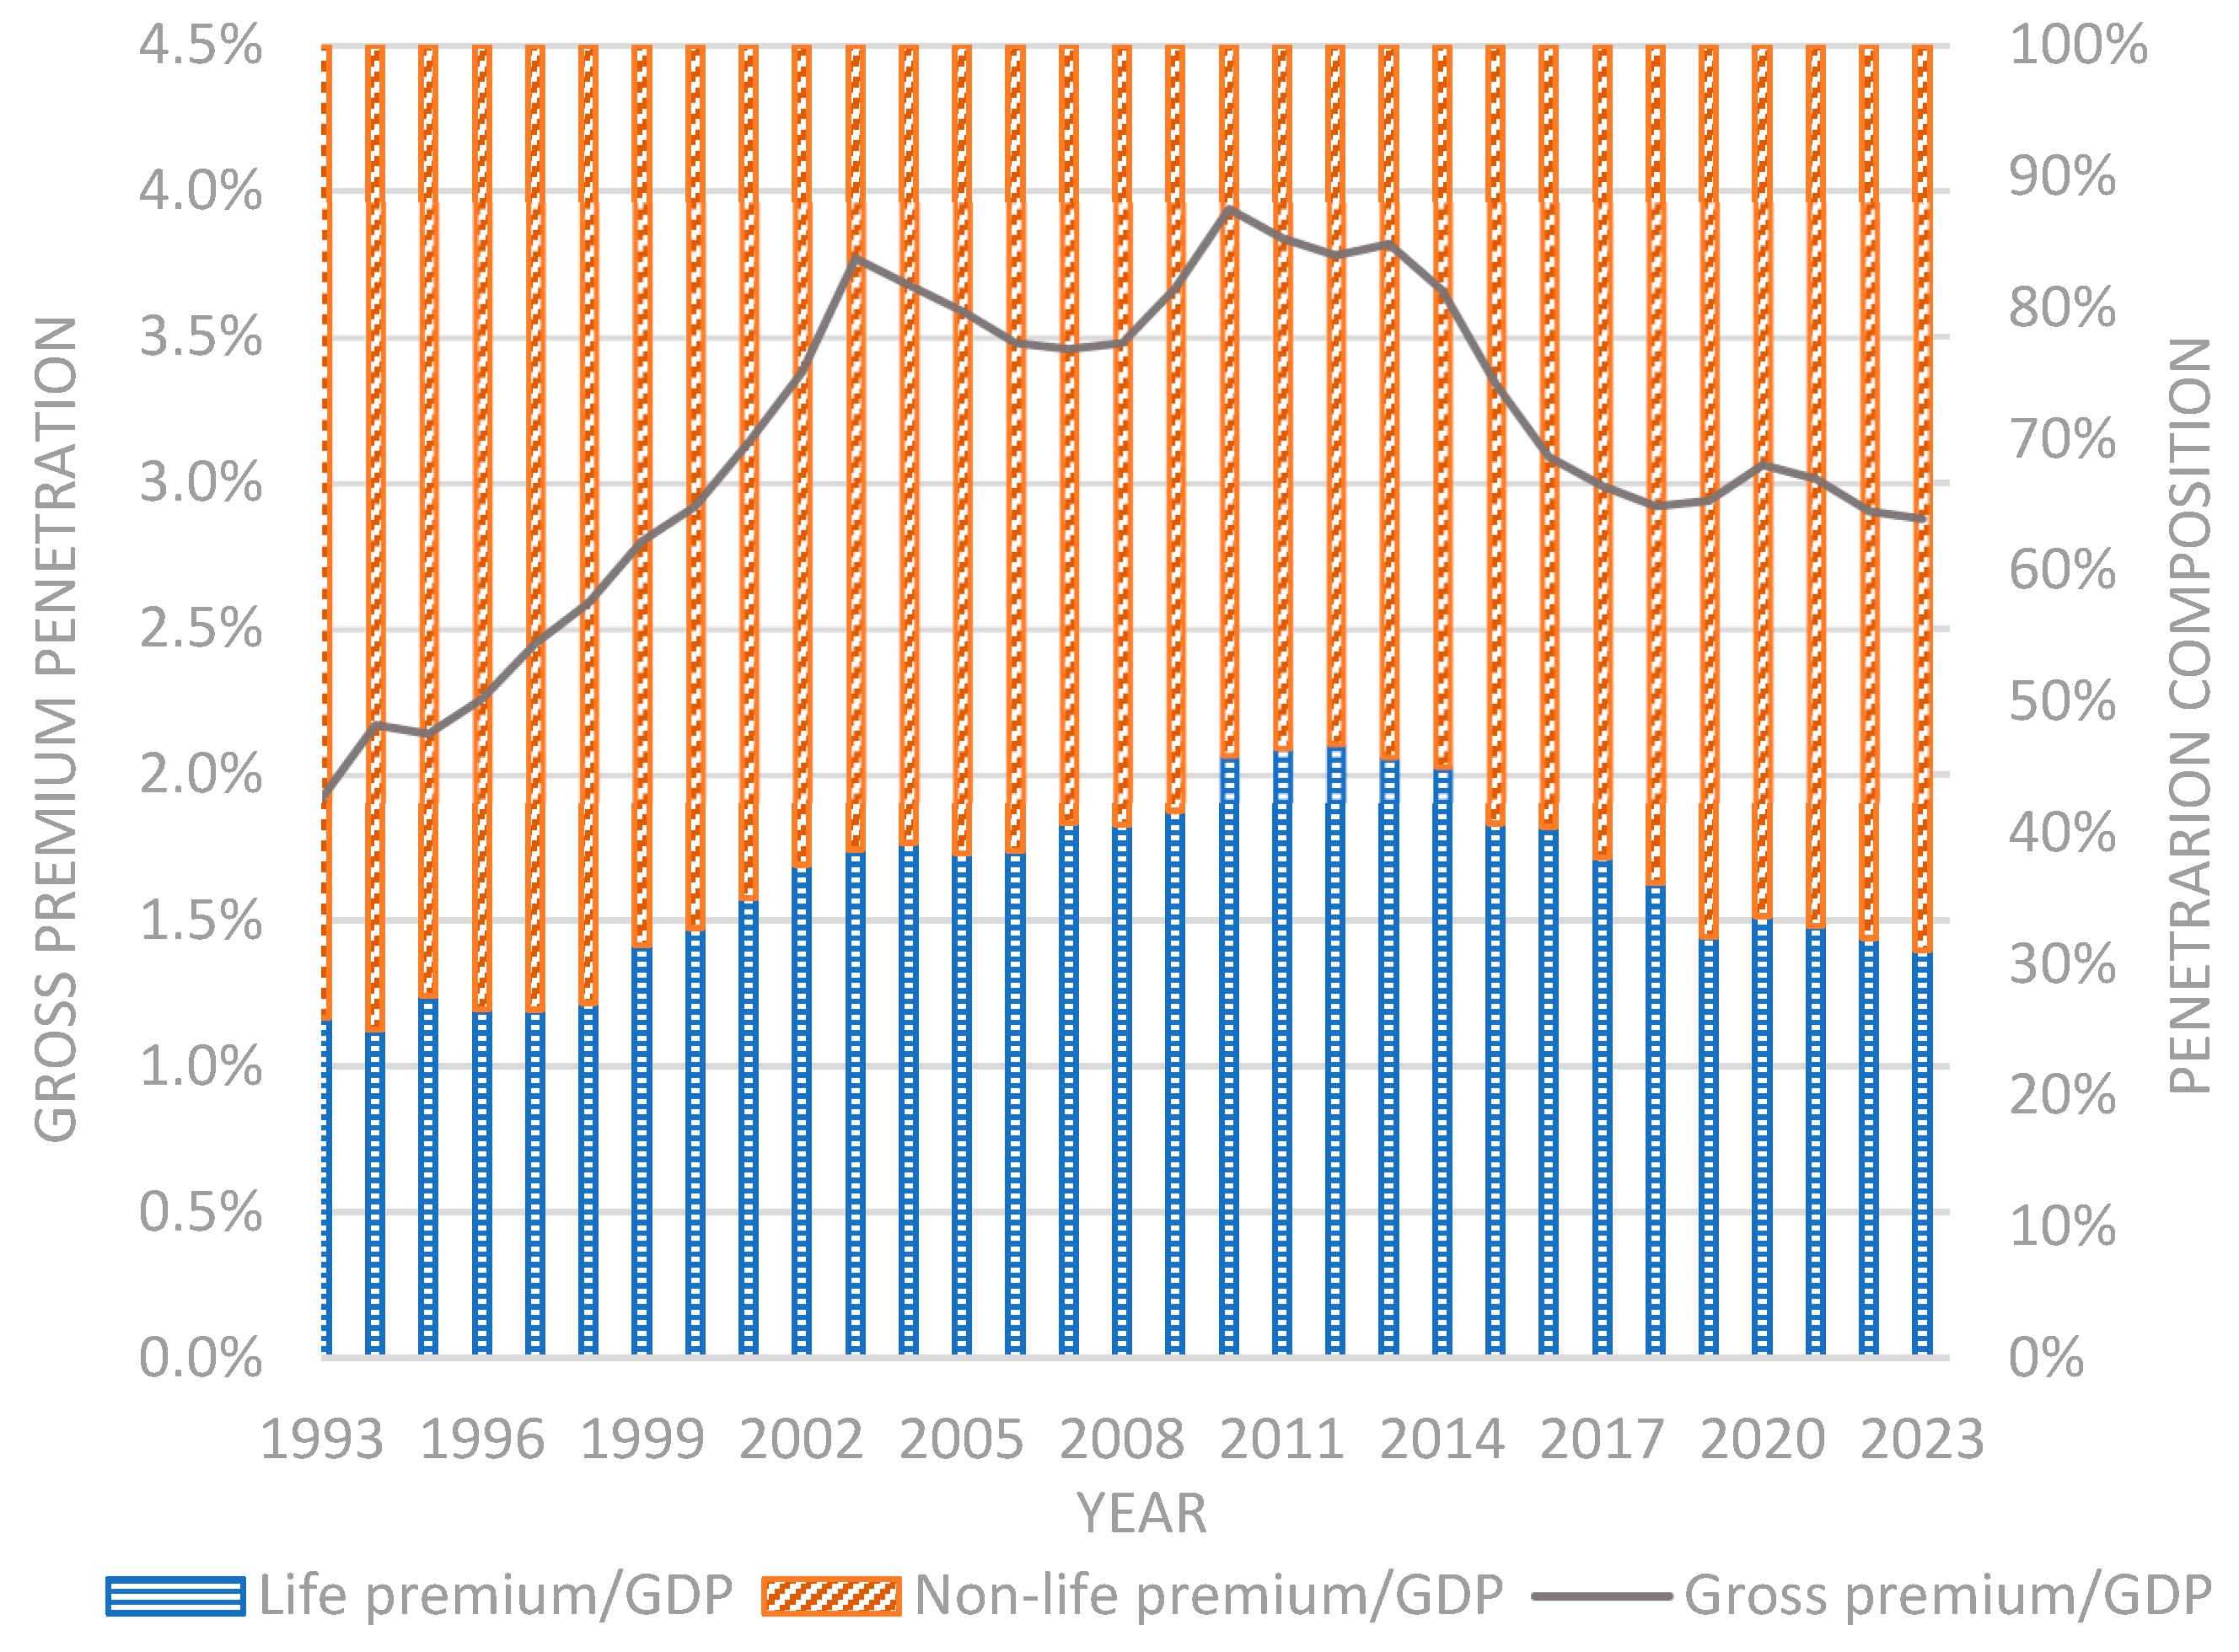
Czech Statistical Office 2023), the gross penetration (Gross premium/GDP) was 2.9%, the life penetration (life premium/GDP) was 2.1%, and the non-life penetration (non-life premium/GDP) was 0.8% in the year 2023; see the development of ratio and structure in
Figure 1. The penetration ratio is relatively low in comparison with Europe’s 6.4%; however, comparability with other countries is not easy because of different tax, social, and health systems. Nine out of 10 Czech inhabitants have some insurance contract. Most often, 61 per cent of Czech inhabitants have household insurance and 47 per cent have life insurance.
The analysis of profitability and risk of the ROE ratio is based on finding value drivers, including their significance and impact. The decomposition method can provide profitability analysis using a pyramid analysis, allowing for a deep investigation of the problem. The static profitability deviation analysis explores one-period deviation and finds influential factors (drivers) due to significance. The profitability risk analysis is based on a dynamic analysis stemming from the time-series data of several periods. The variance analysis of the ROE modelling the risk can serve to decompose the risk and find substantial, strategic, and more stable influential factors.
This paper’s goal is to perform a profitability static decomposition analysis and risk (dynamic) decomposition analysis of the ROE measure decomposed by the pyramid approach of the Czech insurance sector from the years 2018 to 2022 by a CARAMEL categorisation. The period is characterised by several non-standard and shock economy development phases. The first stage in 2018 and 2019 is the overheating economy; in the second stage, in 2020 and 2021, there was the Covid pandemic shock; the Ukraine war, an energy crisis, and a high inflation wave governed the economy in 2022.
This paper is structured as follows: (1) a research methodology description of the ROE pyramid decomposition, static and risk (dynamic) deviation methods, and furthermore input data are introduced; (2) the empirical results for a static profitability analysis are computed and analysed; and (3) risk (dynamic) profitability analyses are computed, interpreted, and discussed.
2. Methodology Description and Input Data
This section includes methodologies proposed and applied as follows: the proposal of the pyramid decomposition of the financial performance indicator ROE based on CARAMEL categorisation of the insurance sector. Furthermore, a procedure for an additive relationship is presented, and the functional method for the calculation of influence deviations of multiplicative relationship is introduced. Risk (dynamic) analysis based on a time-series of indices and variance analysis is described.
2.1. The Pyramid Decomposition Proposal of ROE
The intention of the insurance sector
ROE decomposition proposal is to incorporate particular aspects of the insurance sector’s effective and adaptable development. The basic blocks and chosen financial ratios of interest are based on a CARAMEL financial ratios composition (capital adequacy, asset quality, reinsurance and actuarial issues, management, earnings, liquidity) coined by
Das et al. (
2003) and applied, e.g., by
Surya and Sudha (
2020).
The pyramid decomposition proposal of
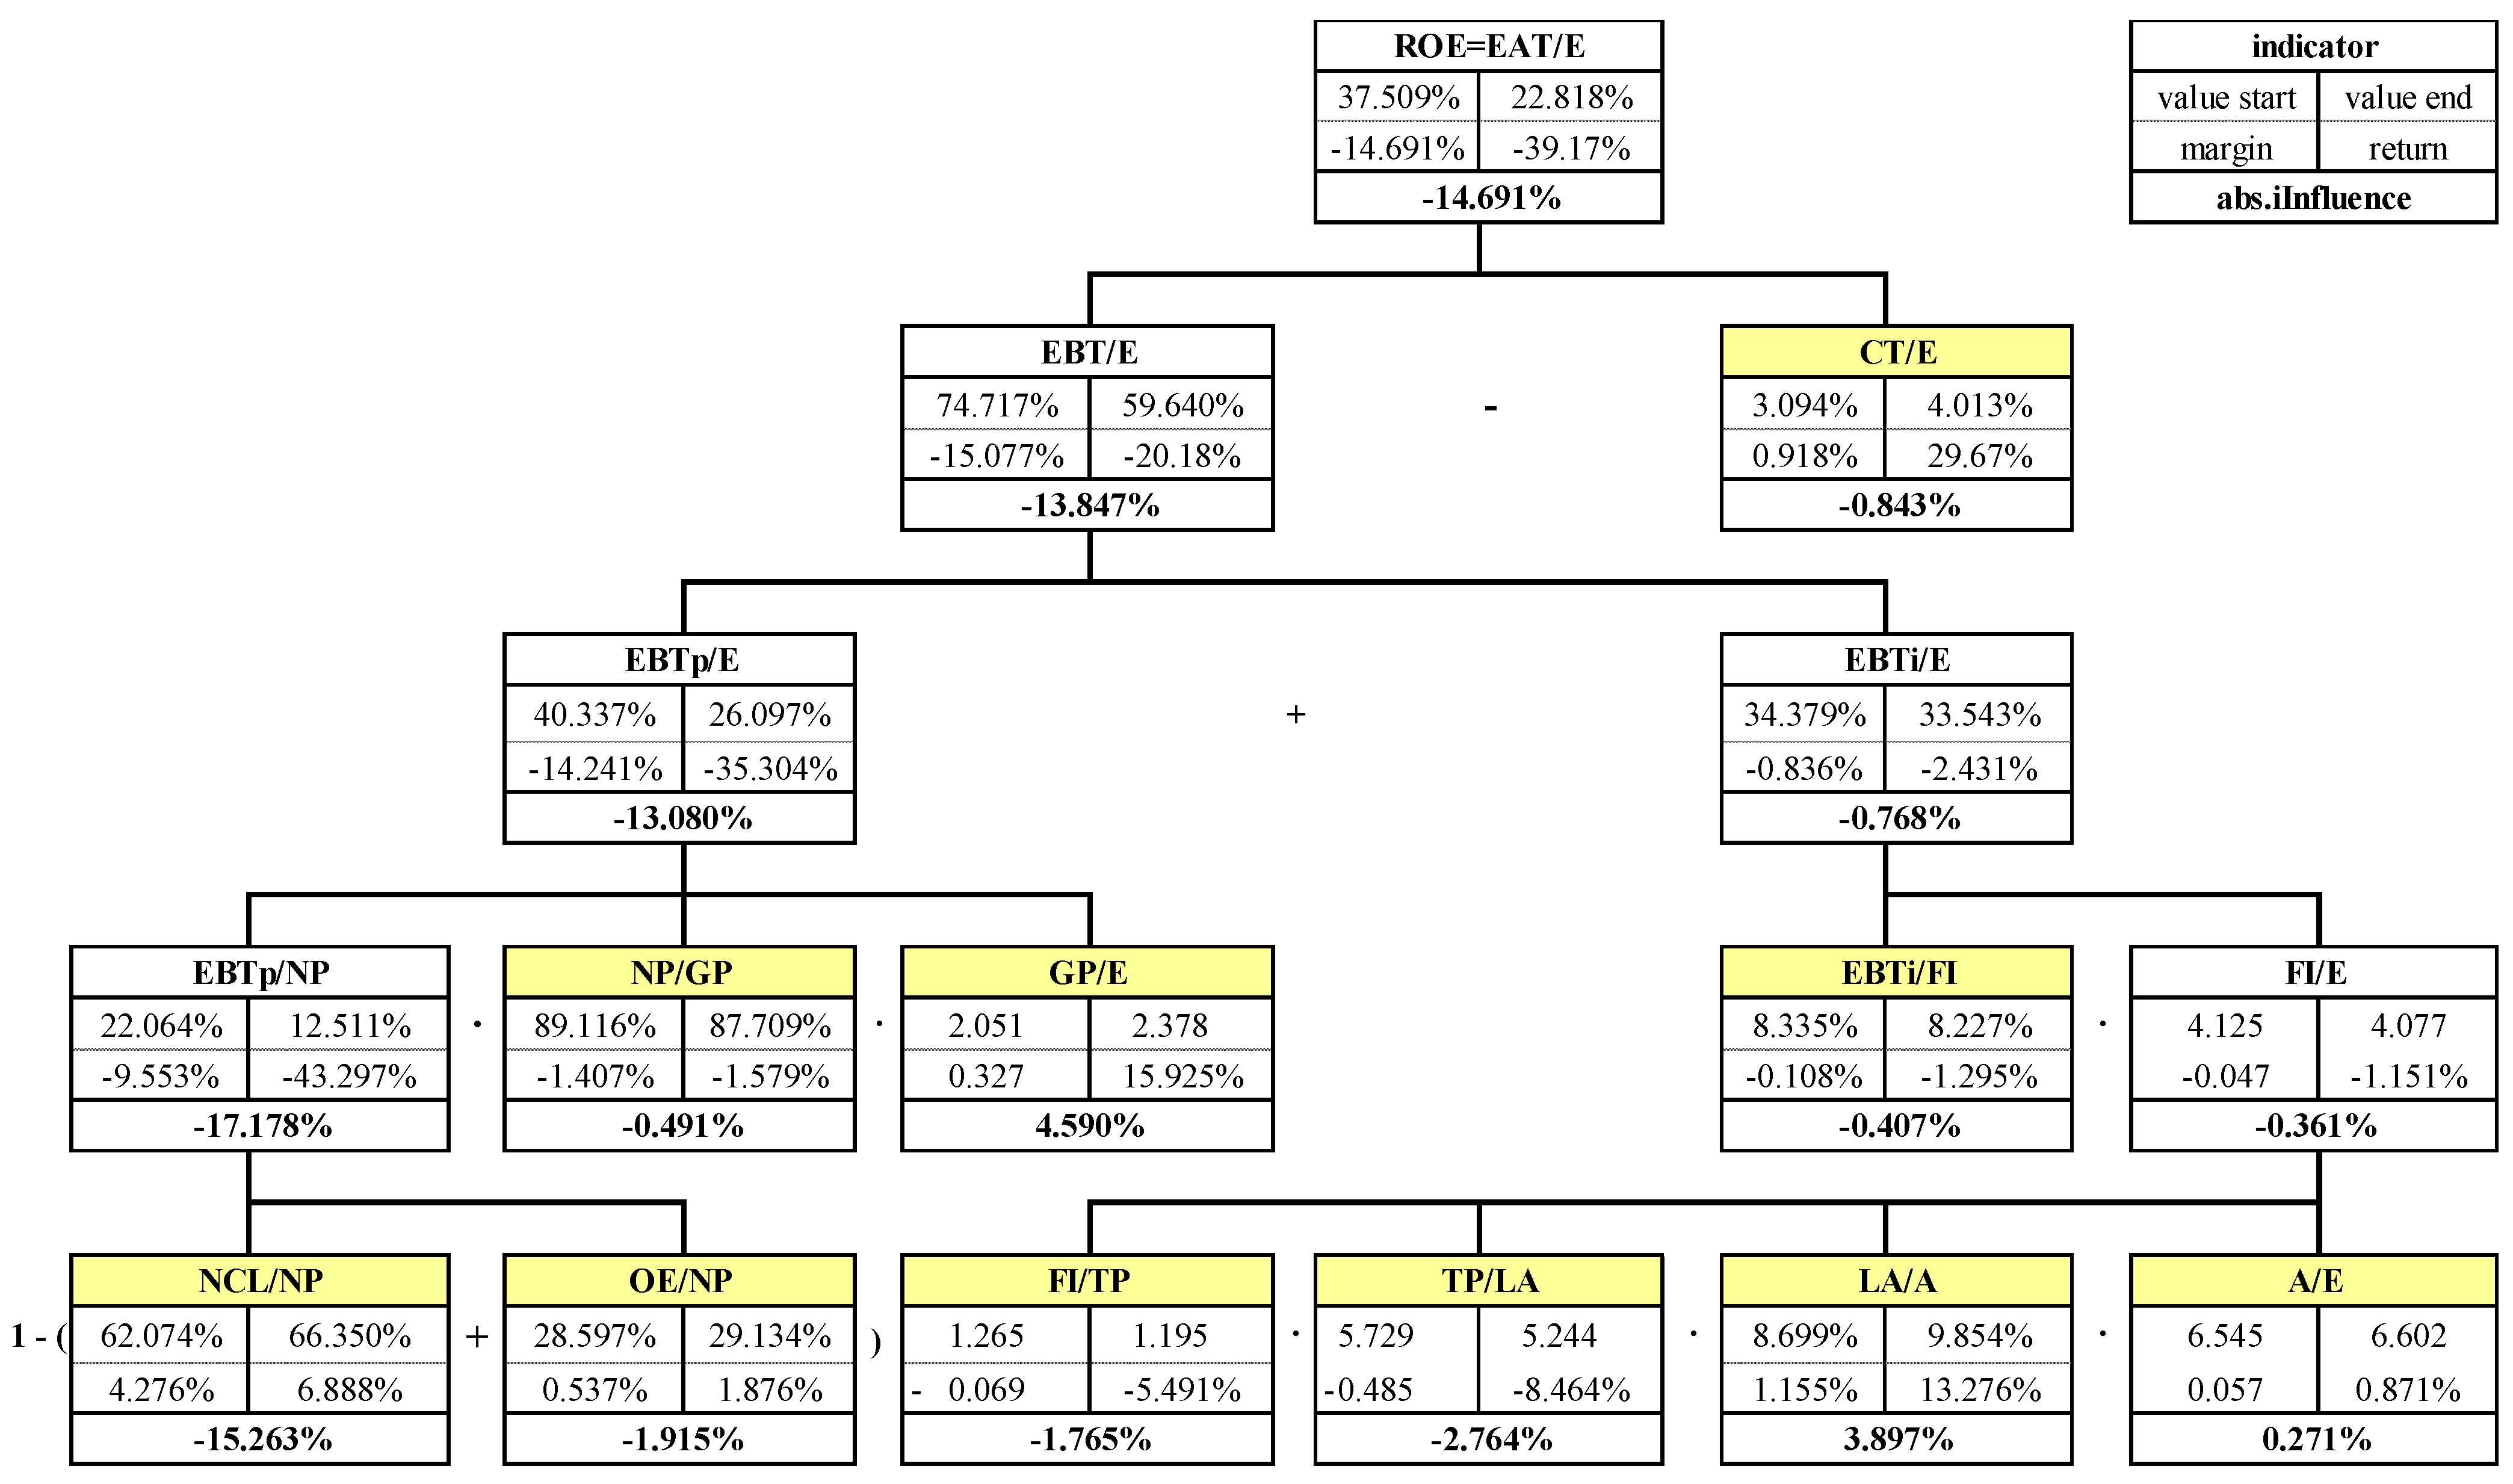
ROE is presented in
Figure 2 and starts as follows:
, substituting for ,
and after other substitutions and then
, finally we get the proposed decomposition equation,
Whereas is a return on equity, is earnings after tax, is earnings before tax, is equity, is corporate tax, is a net premium, is a gross premium, is net claims, is operating expenditure, is earnings before tax from the premium, is earnings before tax from investments, are financial investments, is technical provisions (reserves), is liquid assets, and is assets.
Due to the CARAMEL composition, financial ratios are categorised as follows: Capital adequacy ( solvency ratio), Asset quality ( financial leverage, ), Reinsurance and Actuarial issues ( retention ratio), Management (), Earnings (, , ), and Liquidity (, liquidity ratio).
Figure 2.
Proposed pyramid decomposition of insurance sector ROE, the deviation for the years 2022/2021.
Figure 2.
Proposed pyramid decomposition of insurance sector ROE, the deviation for the years 2022/2021.
2.2. Static Decomposition Deviation Analysis
In the static deviation analysis, a non-linear or linear decomposition function is supposed to be known. A deviation of the (top) analysed measure as the summation of the particular indicator influences is the following: , here is the analysed measure, is the deviation of the analysed measure , is a certain explanation indicator, and is the influence of the specific indicator on the analysed measure . Influences should be specifically determined for summation and multiplication operations.
For the summation operation , then , here , and , are indicator values in the beginning period (index 0) and the subsequent period (index 1).
In the case of the multiplication operation,
the procedure is performed by a deviation analysis, which is to be made by applying various methods with pros and cons. The basic techniques used are the following: the method of gradual changes, the method of division with residue, the logarithmic method, the integral method, and the functional method. The advanced logarithmic method is suitable for deviation analysis but is limited to positive changes in the indices (e.g.,
Ang 1994,
2004,
2005;
Ang and Lee 1994;
Park 1992). The advanced functional method overcomes the logarithmic method’s restriction and is suitable for both positive and negative indicator changes.
The formulas for four, three, and two indices are derived using the functional method in
Appendix A. The formulas for the four explaining indices are the following:
where
and
. Analogical formulas for three and two influence factors are to be derived.
2.3. Risk (Dynamic) Decomposition Analysis
A variance analysis can be used for risk (dynamic) analysis of deviations. The decomposed function on the pyramid decomposition is computed as a linear function’s variance (e.g.,
Gaffney et al. 2007;
Dluhosova et al. 2022).
A variance is calculated from a linear function
. In the case of the original function of indices being non-linear, the linear part of Taylor’s expansion can be used for linearisation, and therefore,
. Hence, we substitute
so
. Assuming a knowledge of the time series of financial indices,
,
, the covariance matrix
and the correlation matrix
can be computed. Afterwards, the variance formula is the following
. Conclusively, the influence of the financial indices on the whole variance is expressed as follows,
and a standardised influence is provided by
2.4. Input Data
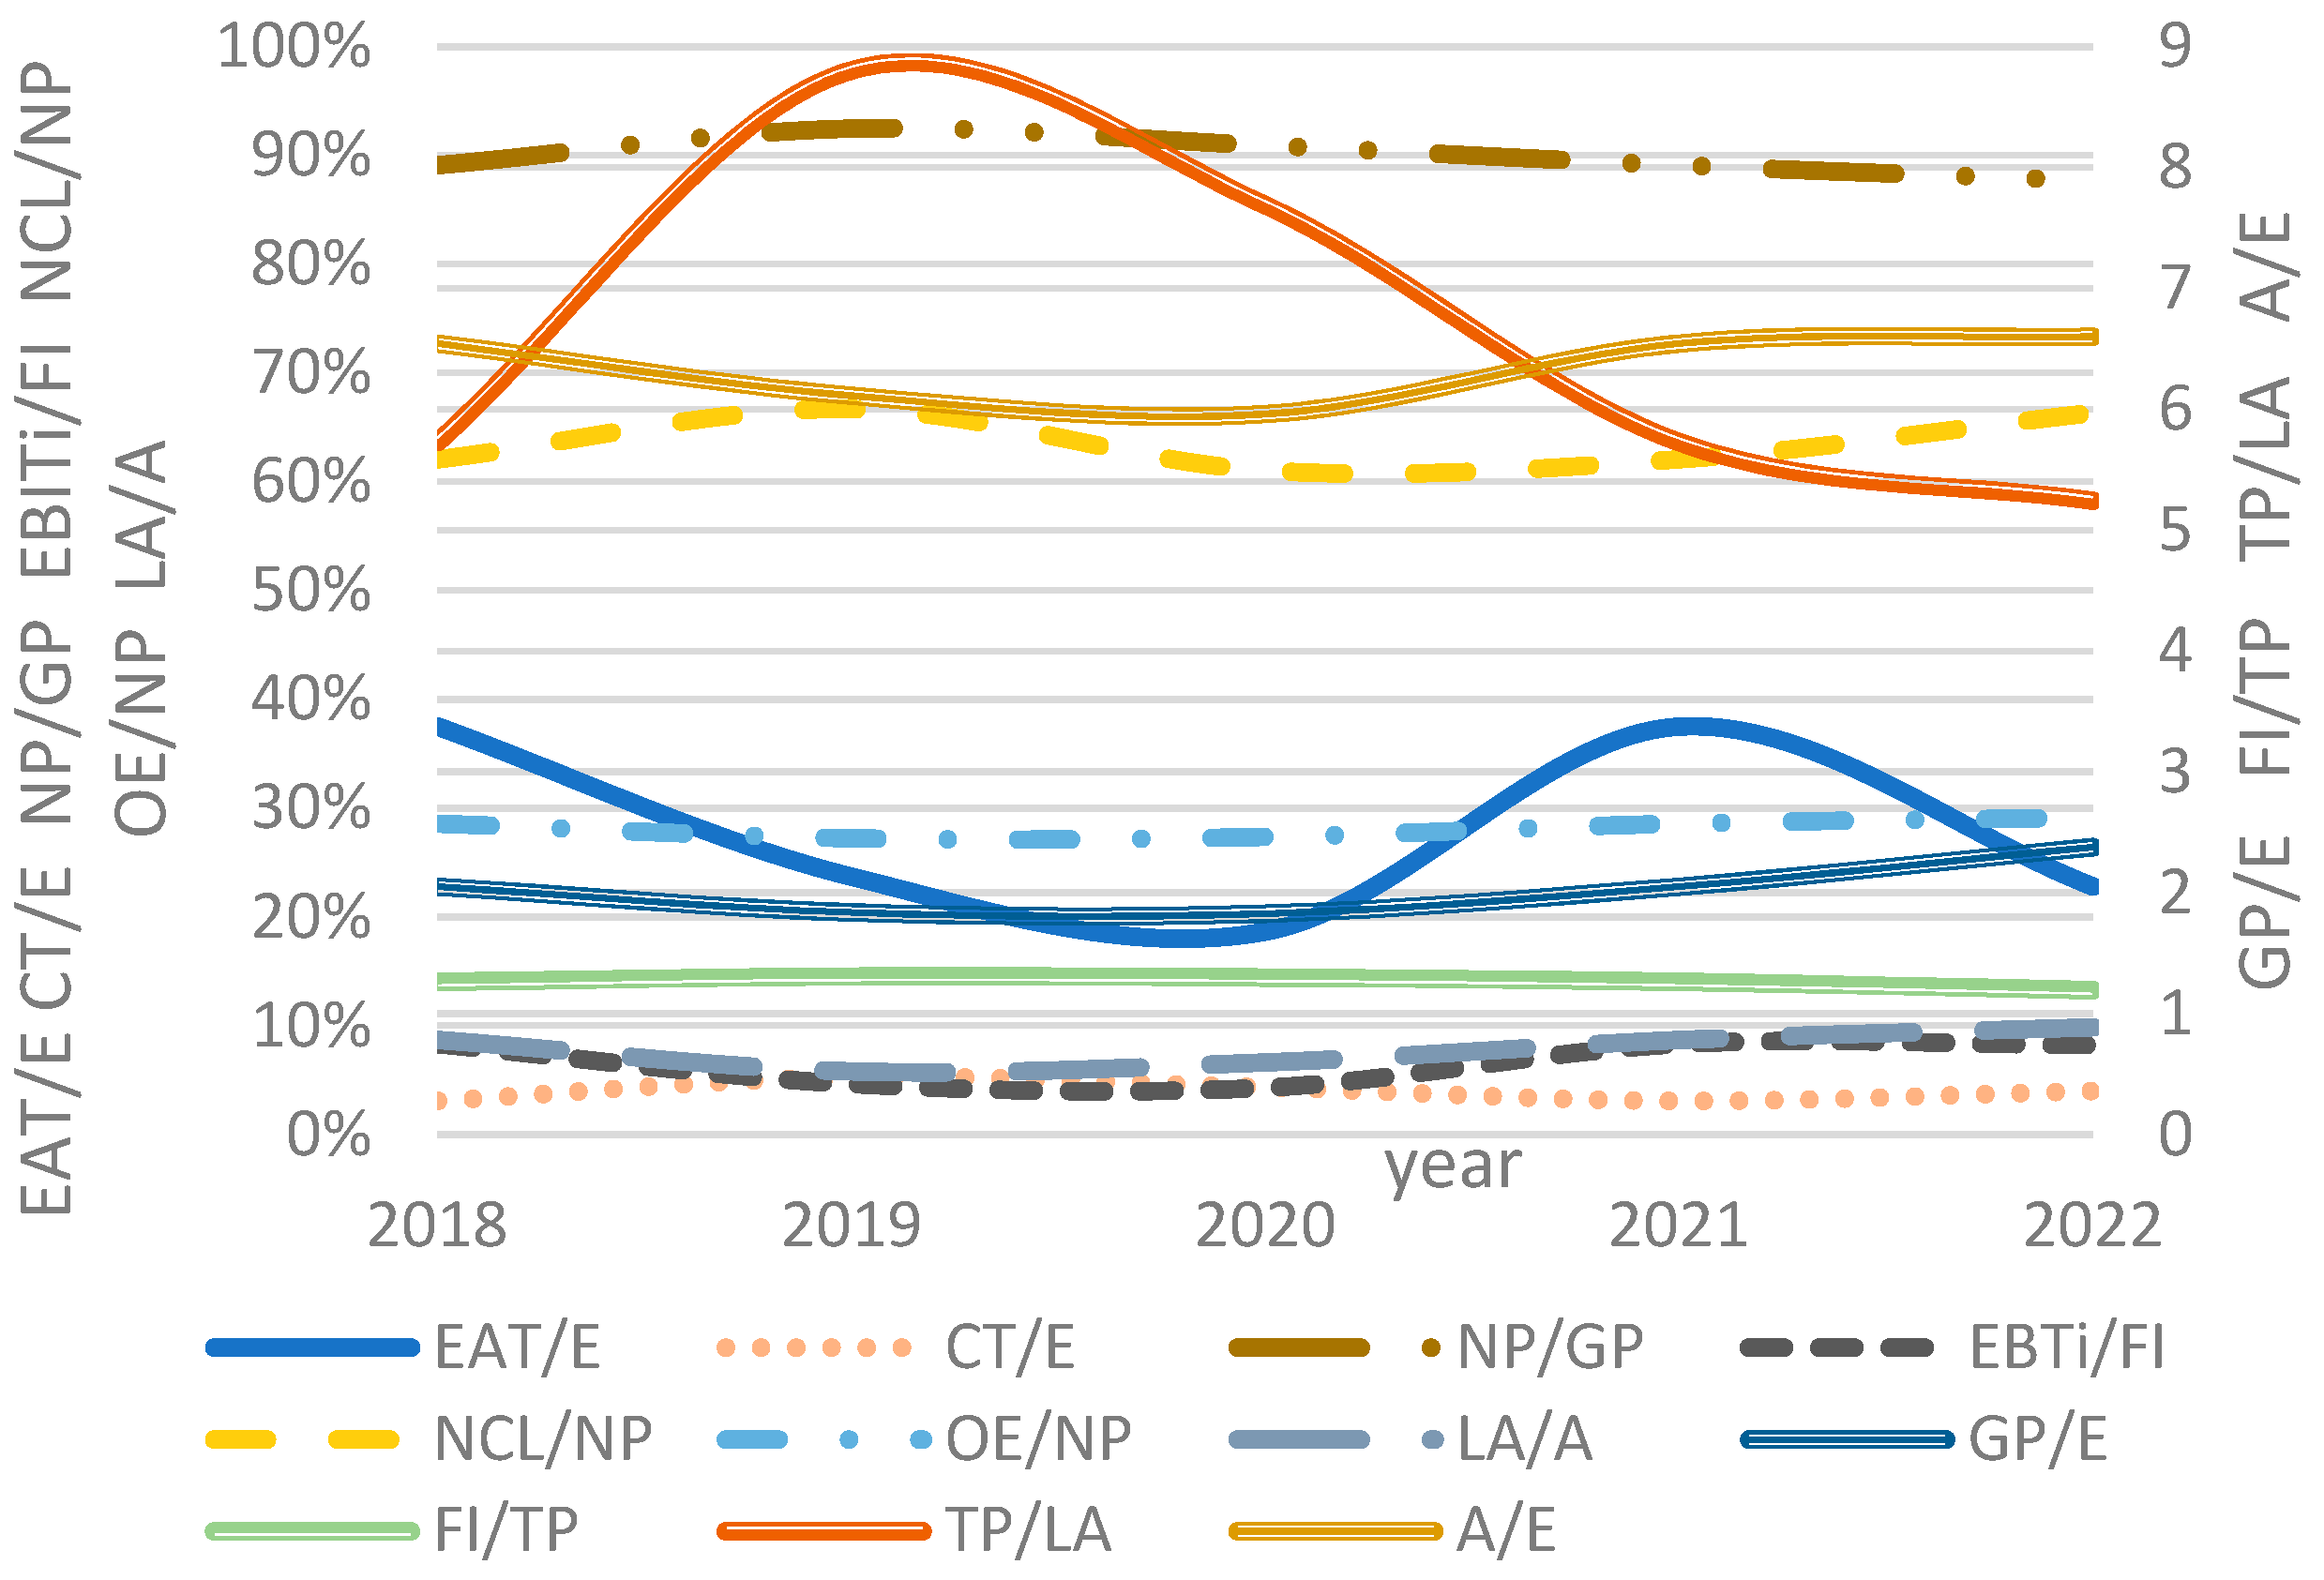
Table 1 and
Figure 3 show the input data of the Czech insurance sector indices, which reflect the proposed pyramid decomposition in
Figure 2 of the
ROE top measure. Data are on a yearly basis for the period 2018 to 2022. Data sources (
Czech Insurance Association 2023) are used to calculate indicator values.
3. The Empirical Results of Decomposition Analyses
The static and risk (dynamic) analyses in the empirical part stem from the methodology introduced in
Section 3. It reflects the paper’s goals.
3.1. Static Deviation Analysis
The static analysis is performed due to (
Section 2.1), and the functional analysis methodology described in
Section 3 is applied because of a generalised conception.
Table 2 demonstrates the detailed results, and
Table 3 the CARAMEL decomposition results.
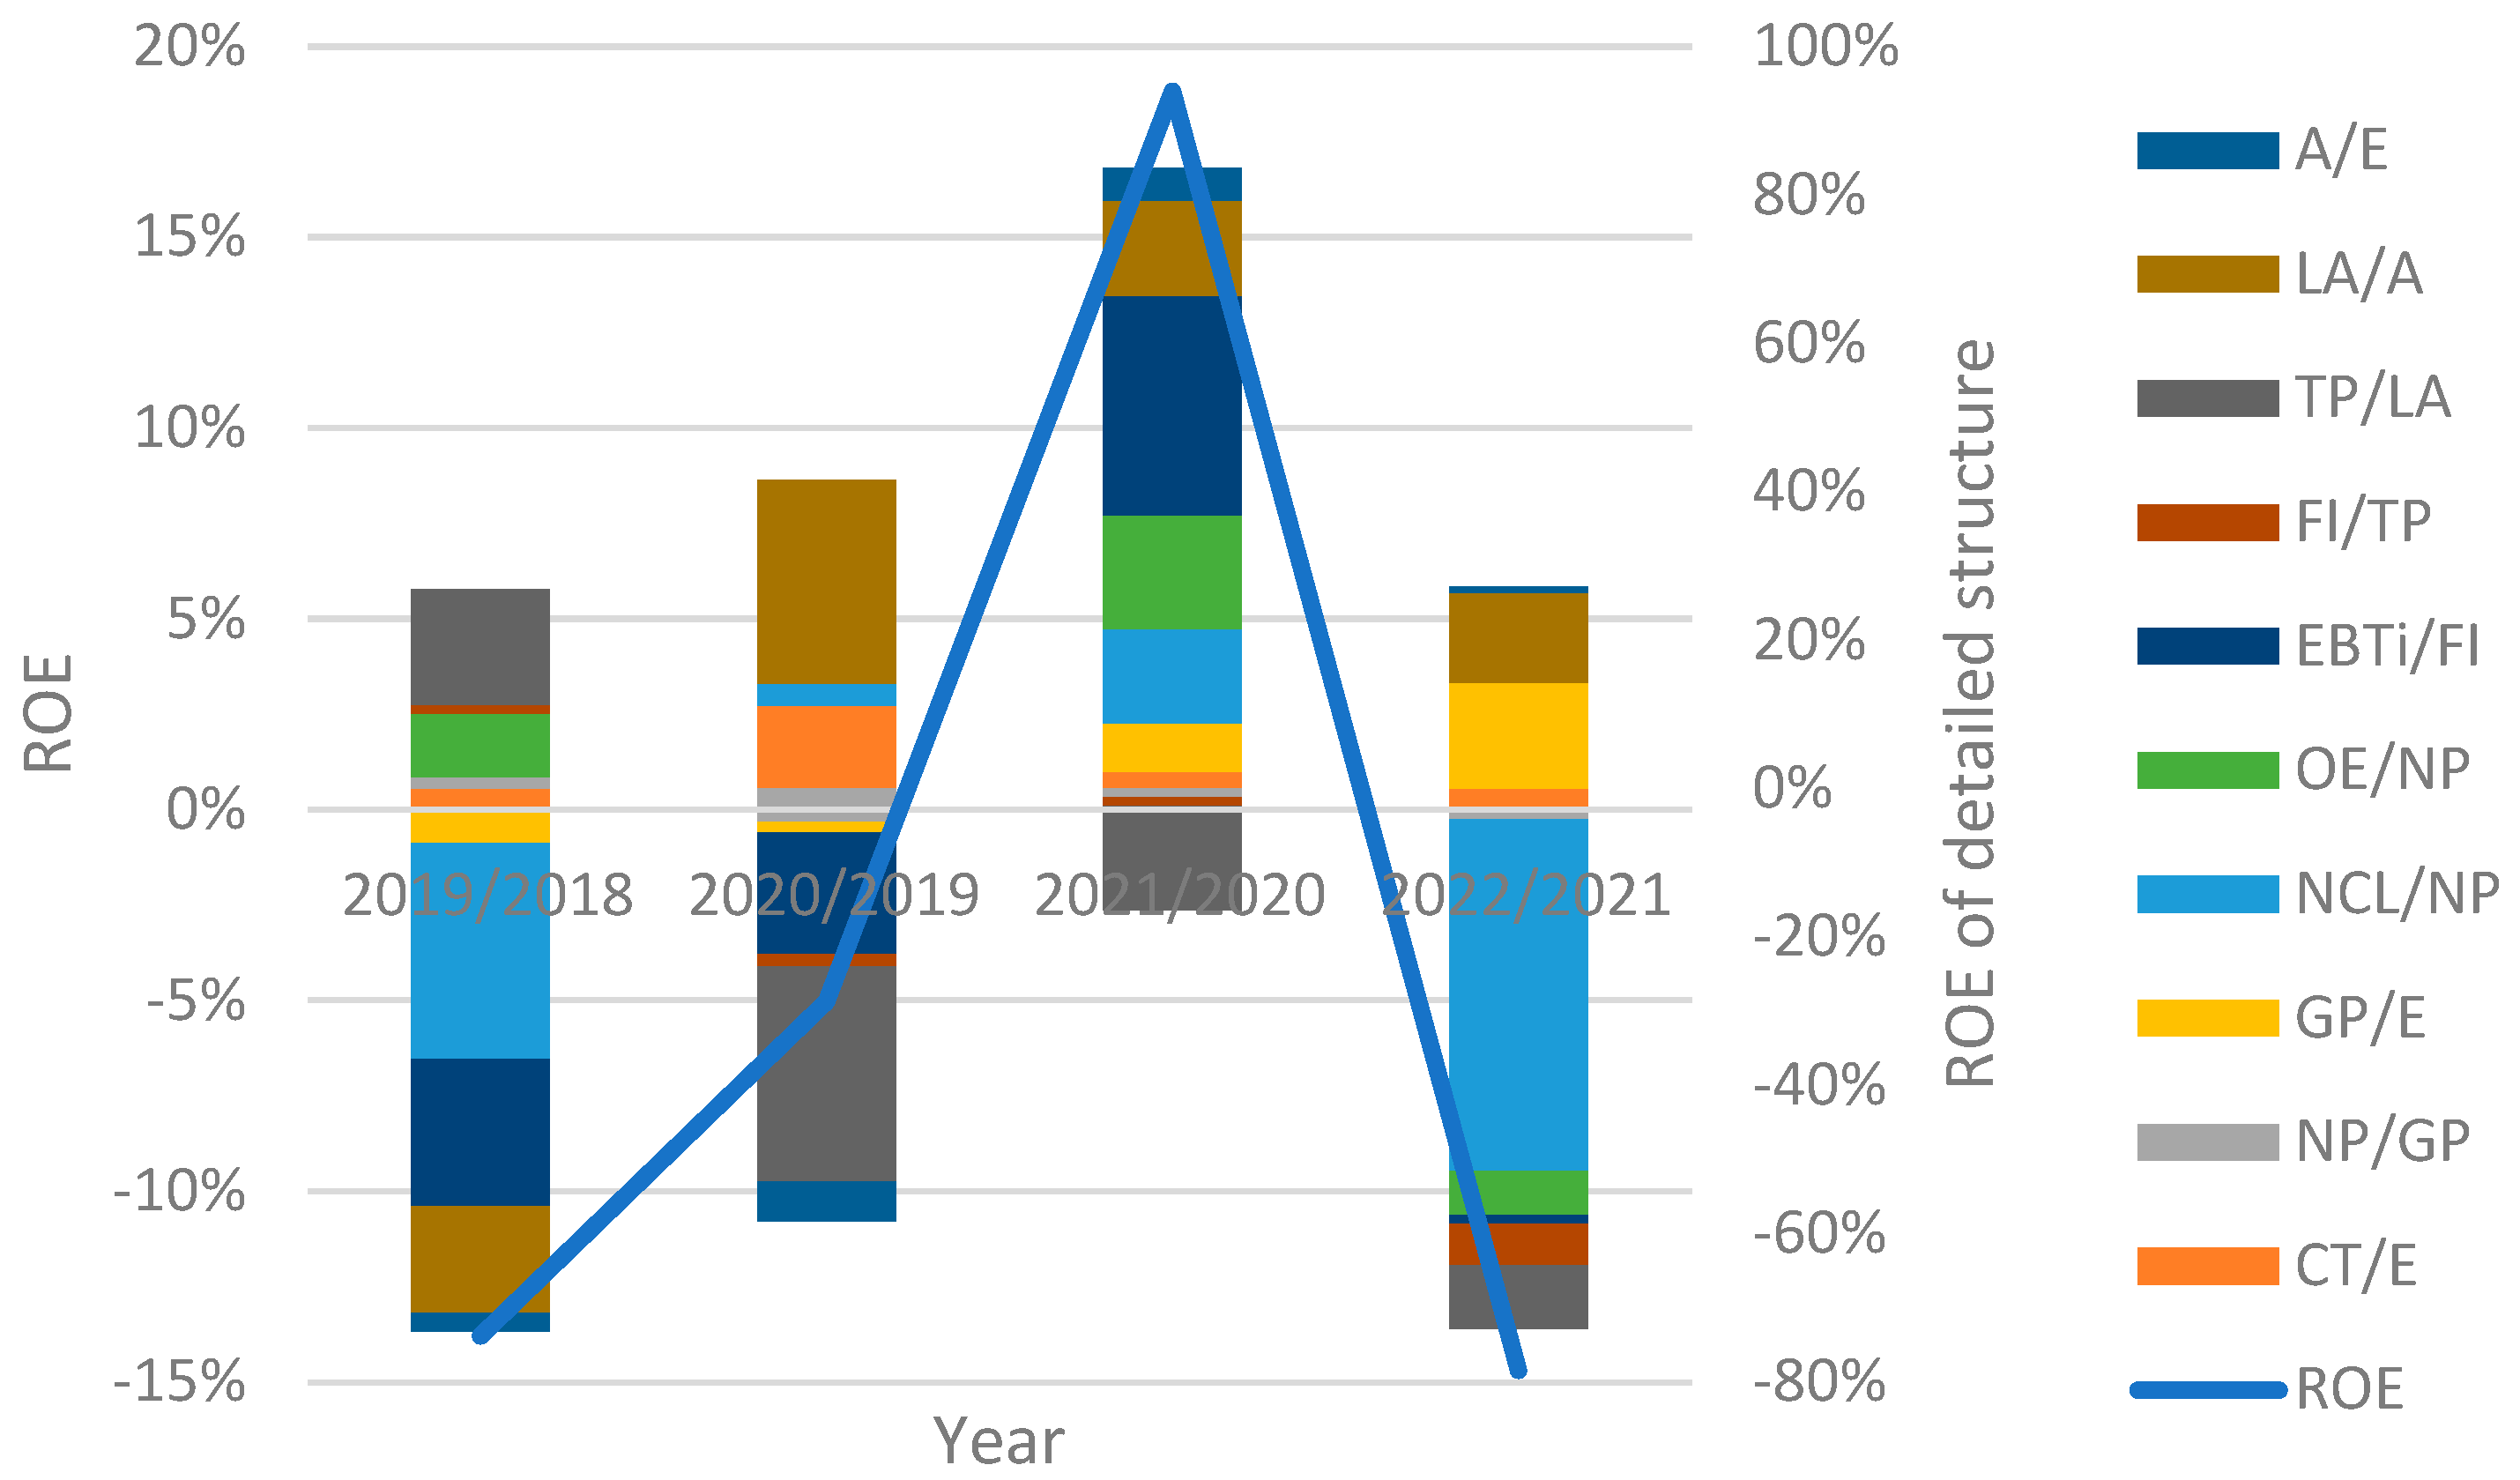
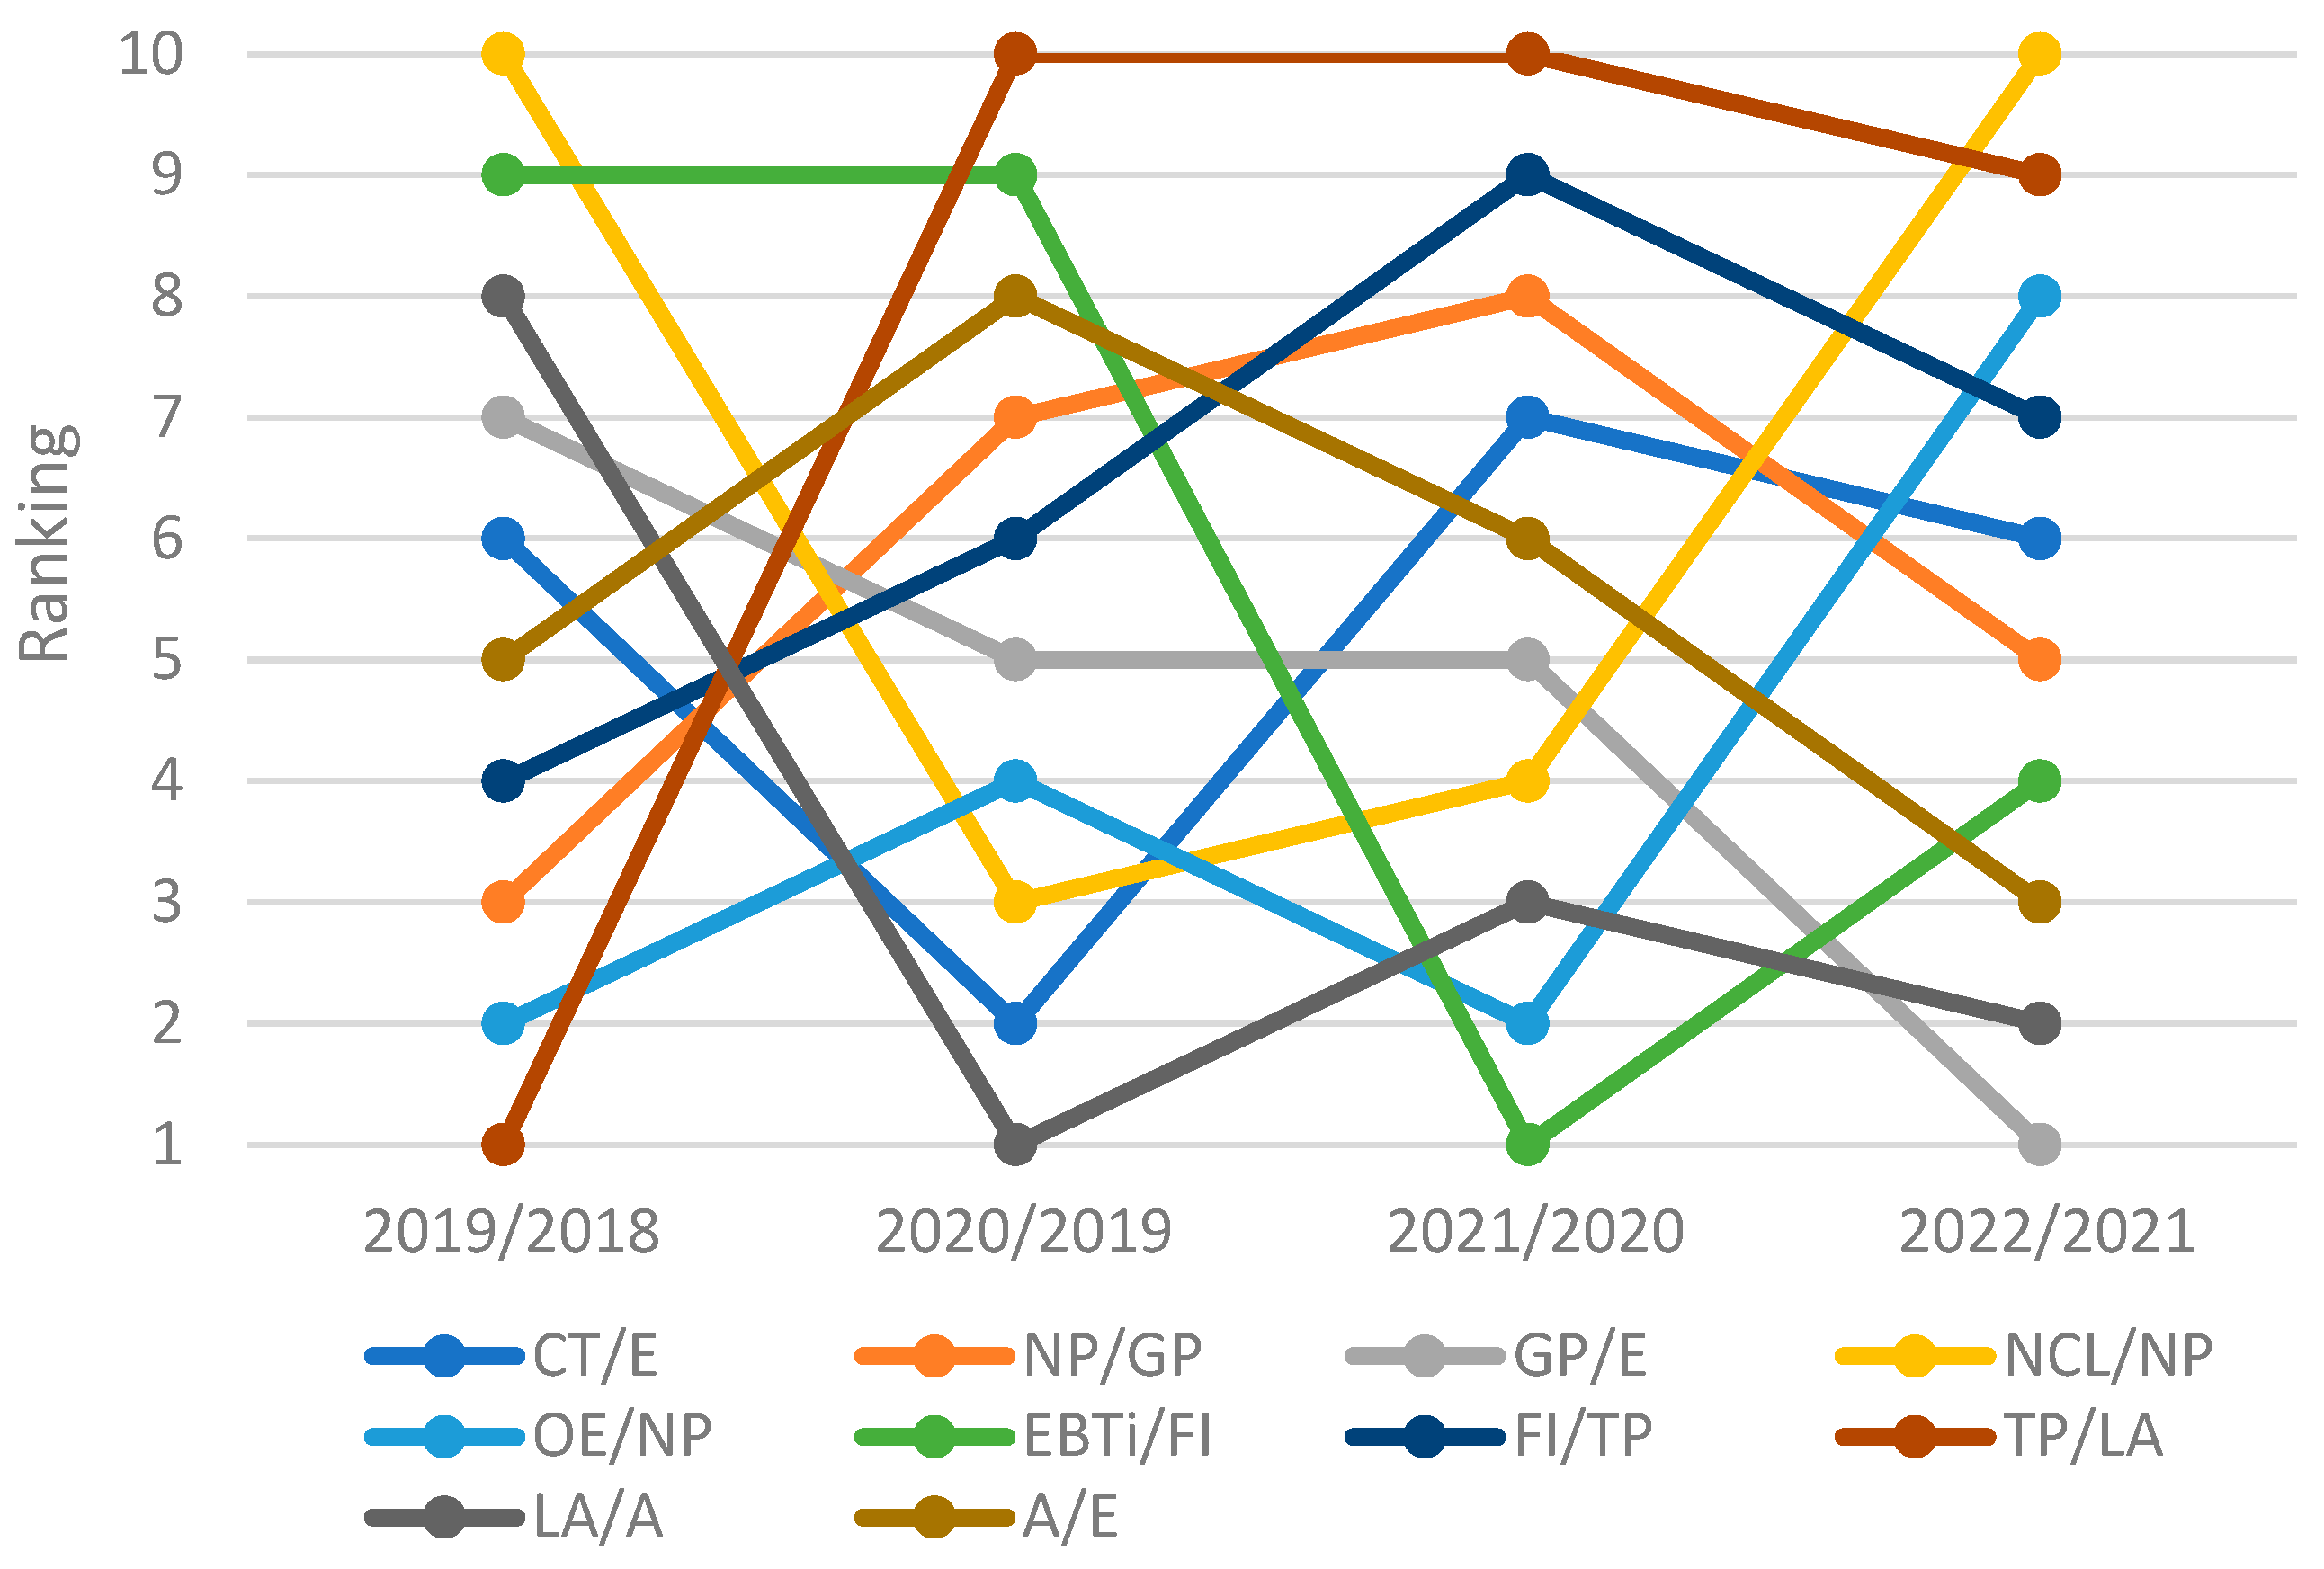
Figure 4 presents a detailed structure of the indices’ influence, and
Figure 5 presents the ranking of the detailed indices’ influence.
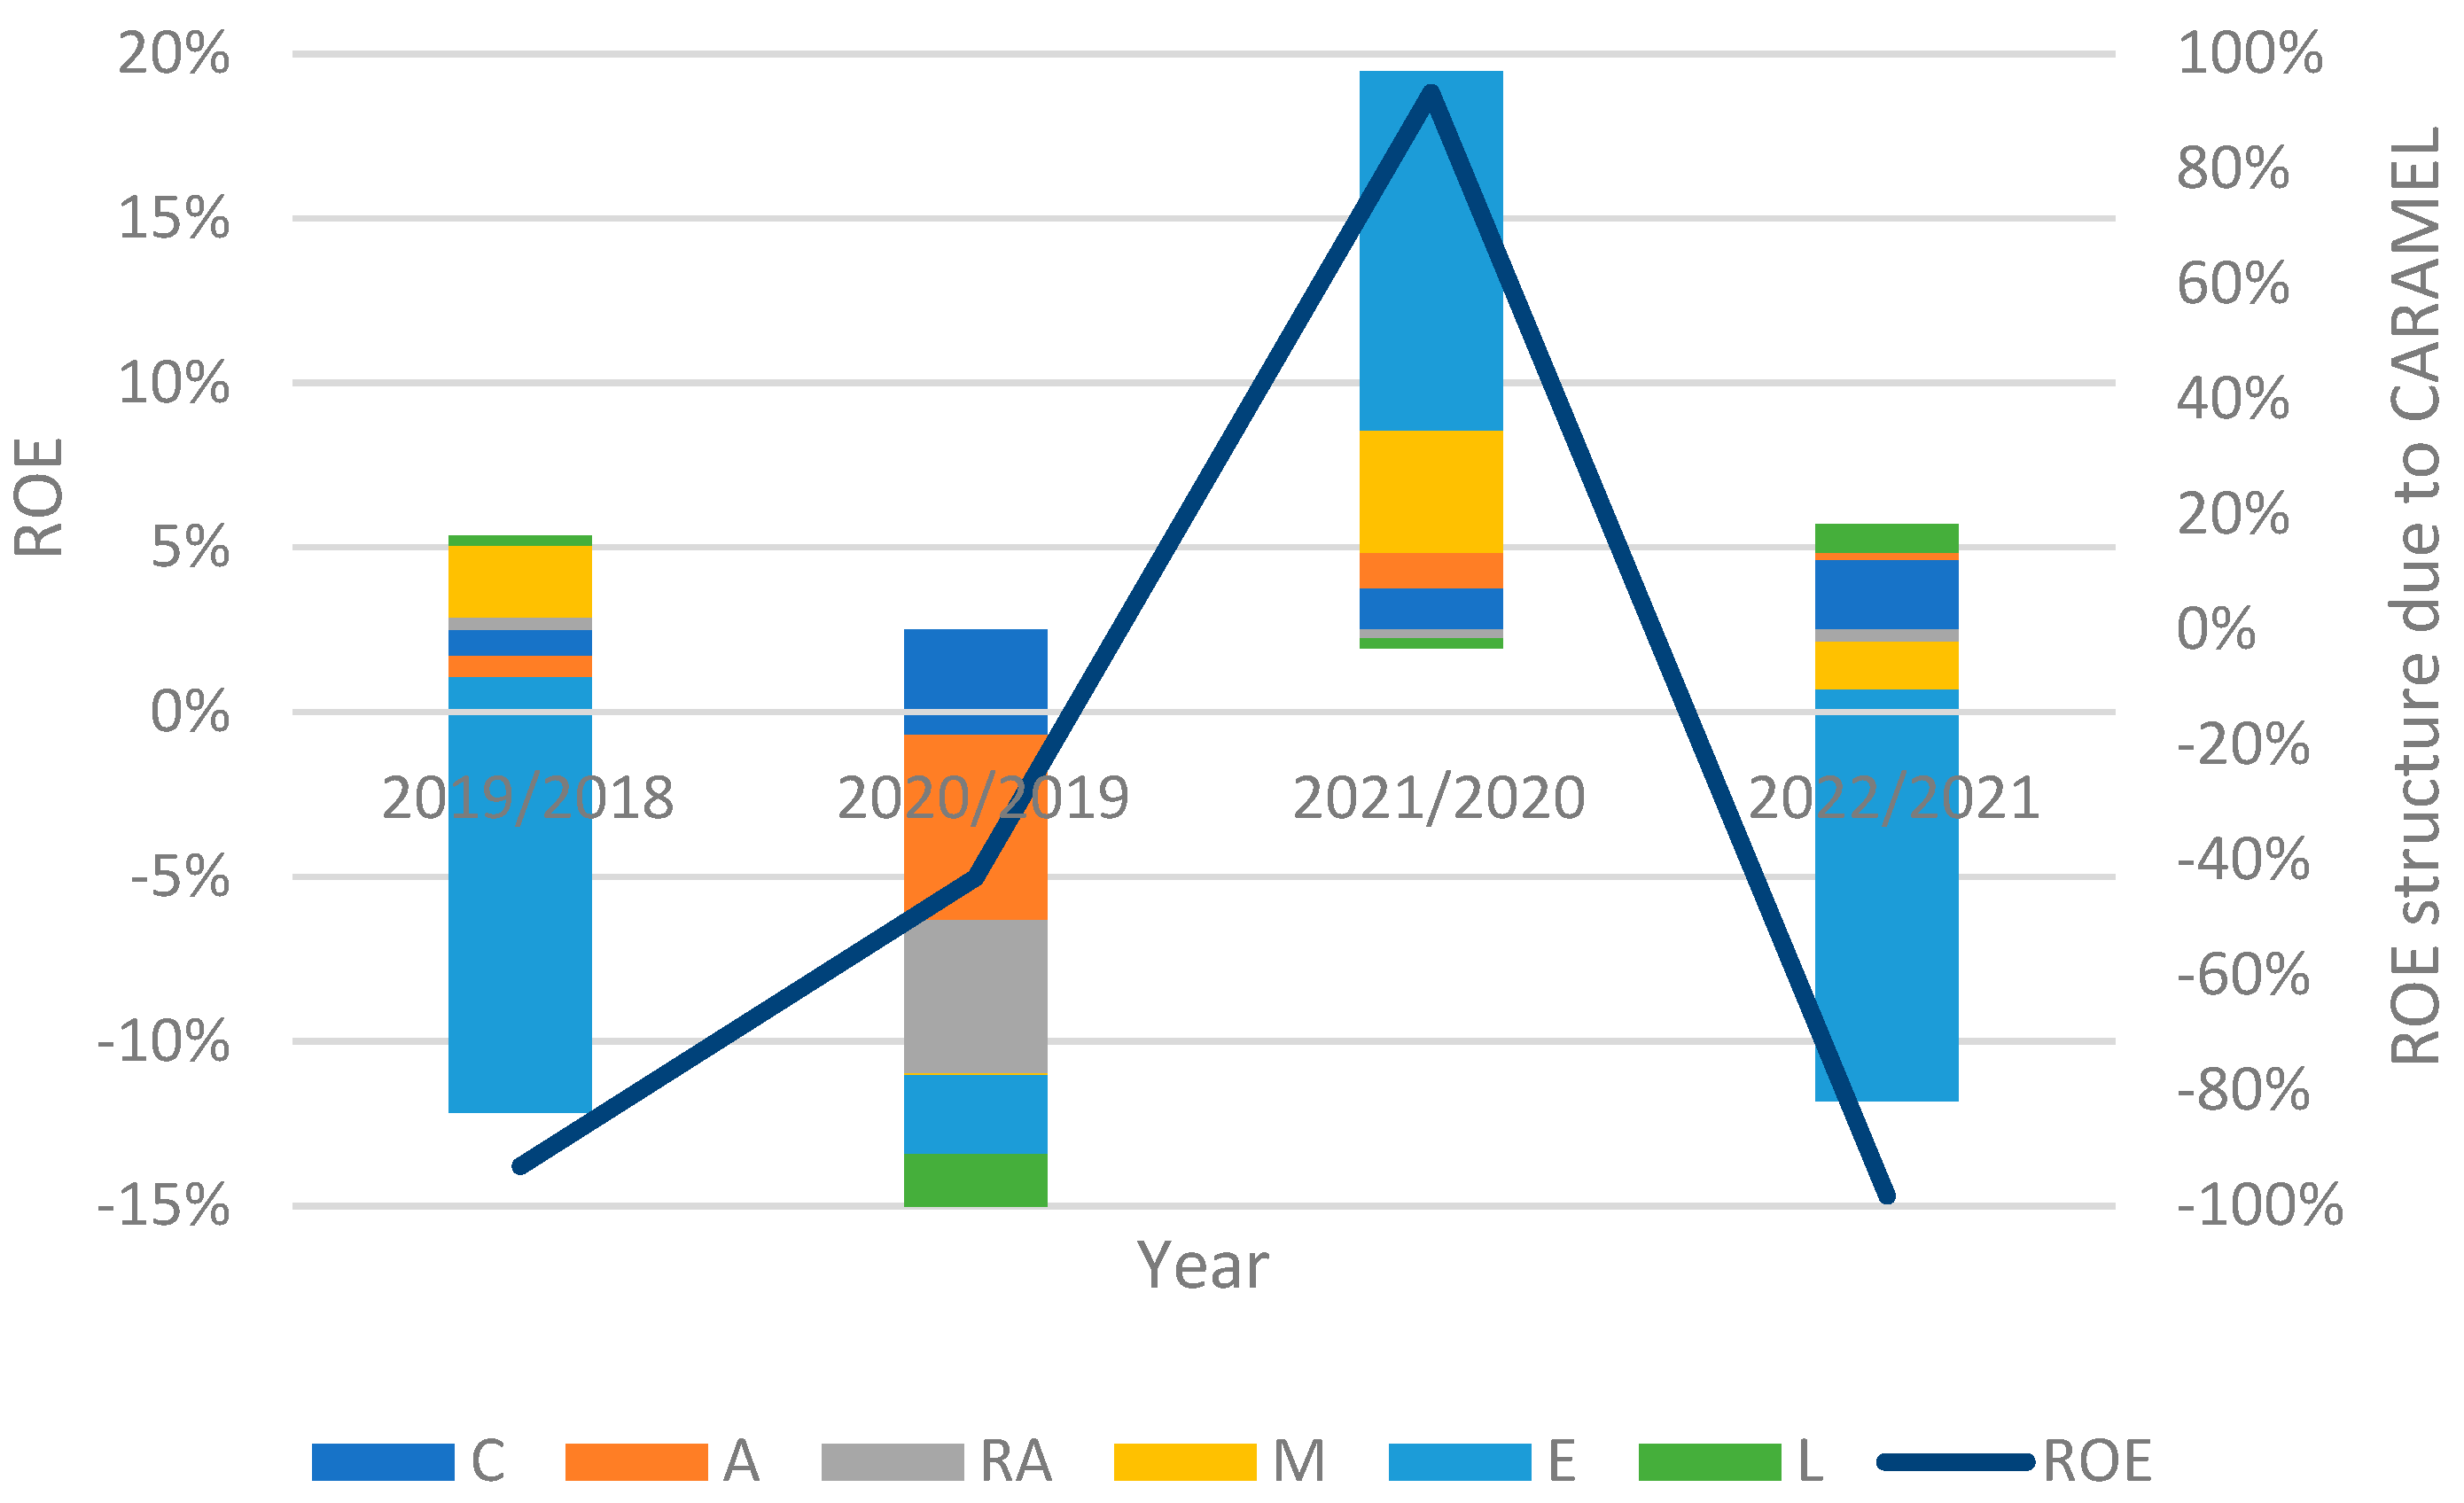
Figure 6 illustrates the influence structure, and
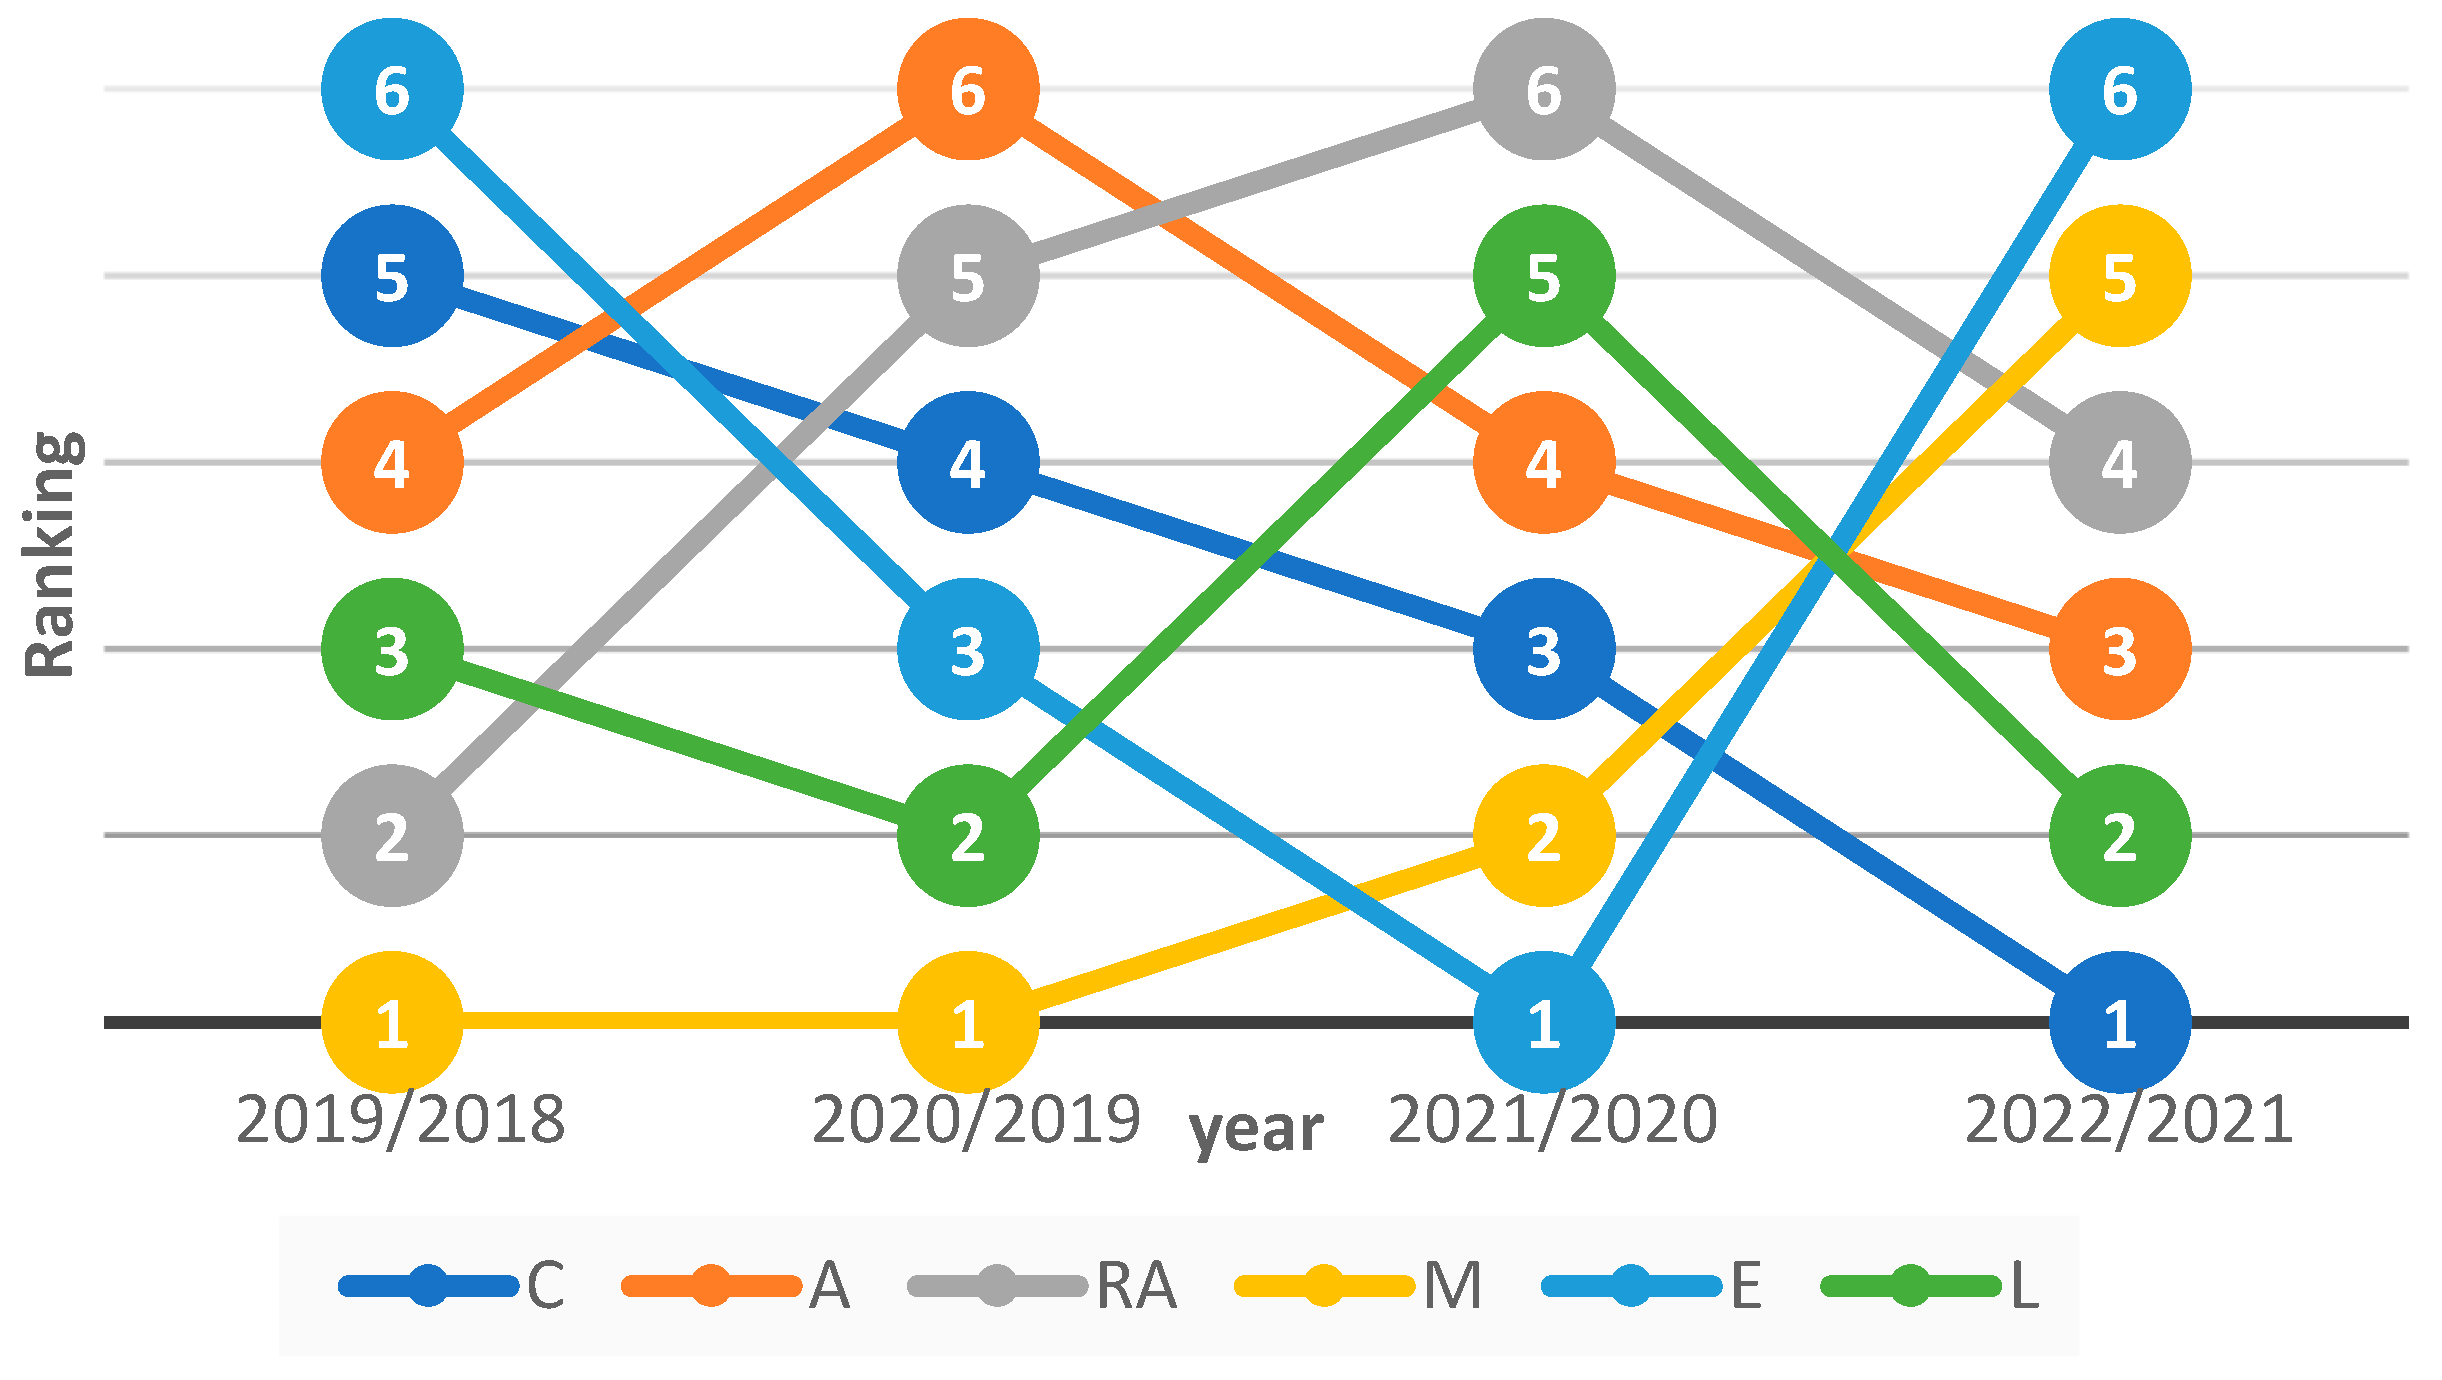
Figure 7 the ranking of the CARAMEL categorisation.
Figure 2 presents the computation for the comparison years 2022/2021.
Looking at the detailed decomposition for the years 2022/2021, the most positive impact on the ROE is the solvency ratio (4.59%); the second is the liquidity ratio (3.90%), followed by the financial leverage (0.27%). However, because the ROE is decreased (−14.69%), it is most significantly caused by the ratio (−15.26%), followed by a group of indices (−2.76%), (−1.92%), and (−1.77%). The last non-significant group consists of (−0.84%), (−0.49%), and (−0.41%).
The results of the Caramel decomposition show the positive influence of capital adequacy (2.824%), liquidity (1.133%), and asset quality (0.271%). The earnings group mainly shows a decrease (−16.513%). The more minor impact consists of the management (−1.915%) and the reinsurance (−0.491%).
There are characteristic trends in the Caramel group: management is improving; capital adequacy is worsening; reinsurance and asset quality are of a concave trend; liquidity is relatively stable; earnings show a convex shape.
The correlation matrix for the influence of the yearly Caramel categorisation in
Table 4 suggests a high positive correlation of 2019/2018 with 2022/2021 (0.9214) and high negative relations of 2019/2018 with 2021/2020 (−0.8825) and 2021/2020 with 2022/2021 (−0.9512). It shows a relative similarity of development in some years.
Apparently, ranking and deviation volumes are unstable and change entirely yearly for both decomposition levels. It is apparent that the earning indices substantially determine the ROE deviation in either increasing or decreasing alternatives. Solvency (capital adequacy) has a positive influence on ROE deviation. The primary reason for indices ranking volatility can be seen in the economic period with an unstable development and unexpected shocks caused by an overheating economy, the Covid pandemic shock, the Ukraine war, the energy crisis, and the high inflation wave. The suitability of the functional method was verified.
3.2. Risk (Dynamic) Analysis
The risk (dynamic) analysis serves to find long-term and risky drivers influencing profitability measured by variance composition. The risk (dynamic) analysis was carried out for the
ROE measure due to the method described in
Section 3 with the application of (
Section 2.2). Input data for every year from 2018 to 2022, introduced in
Table 1, are used. The alpha parameters are calculated in the following way:
Table 5 shows the correlation matrix and the standard deviation of ratios. Furthermore, detailed decomposition in
Table 6 and the CARAMEL categorisation in
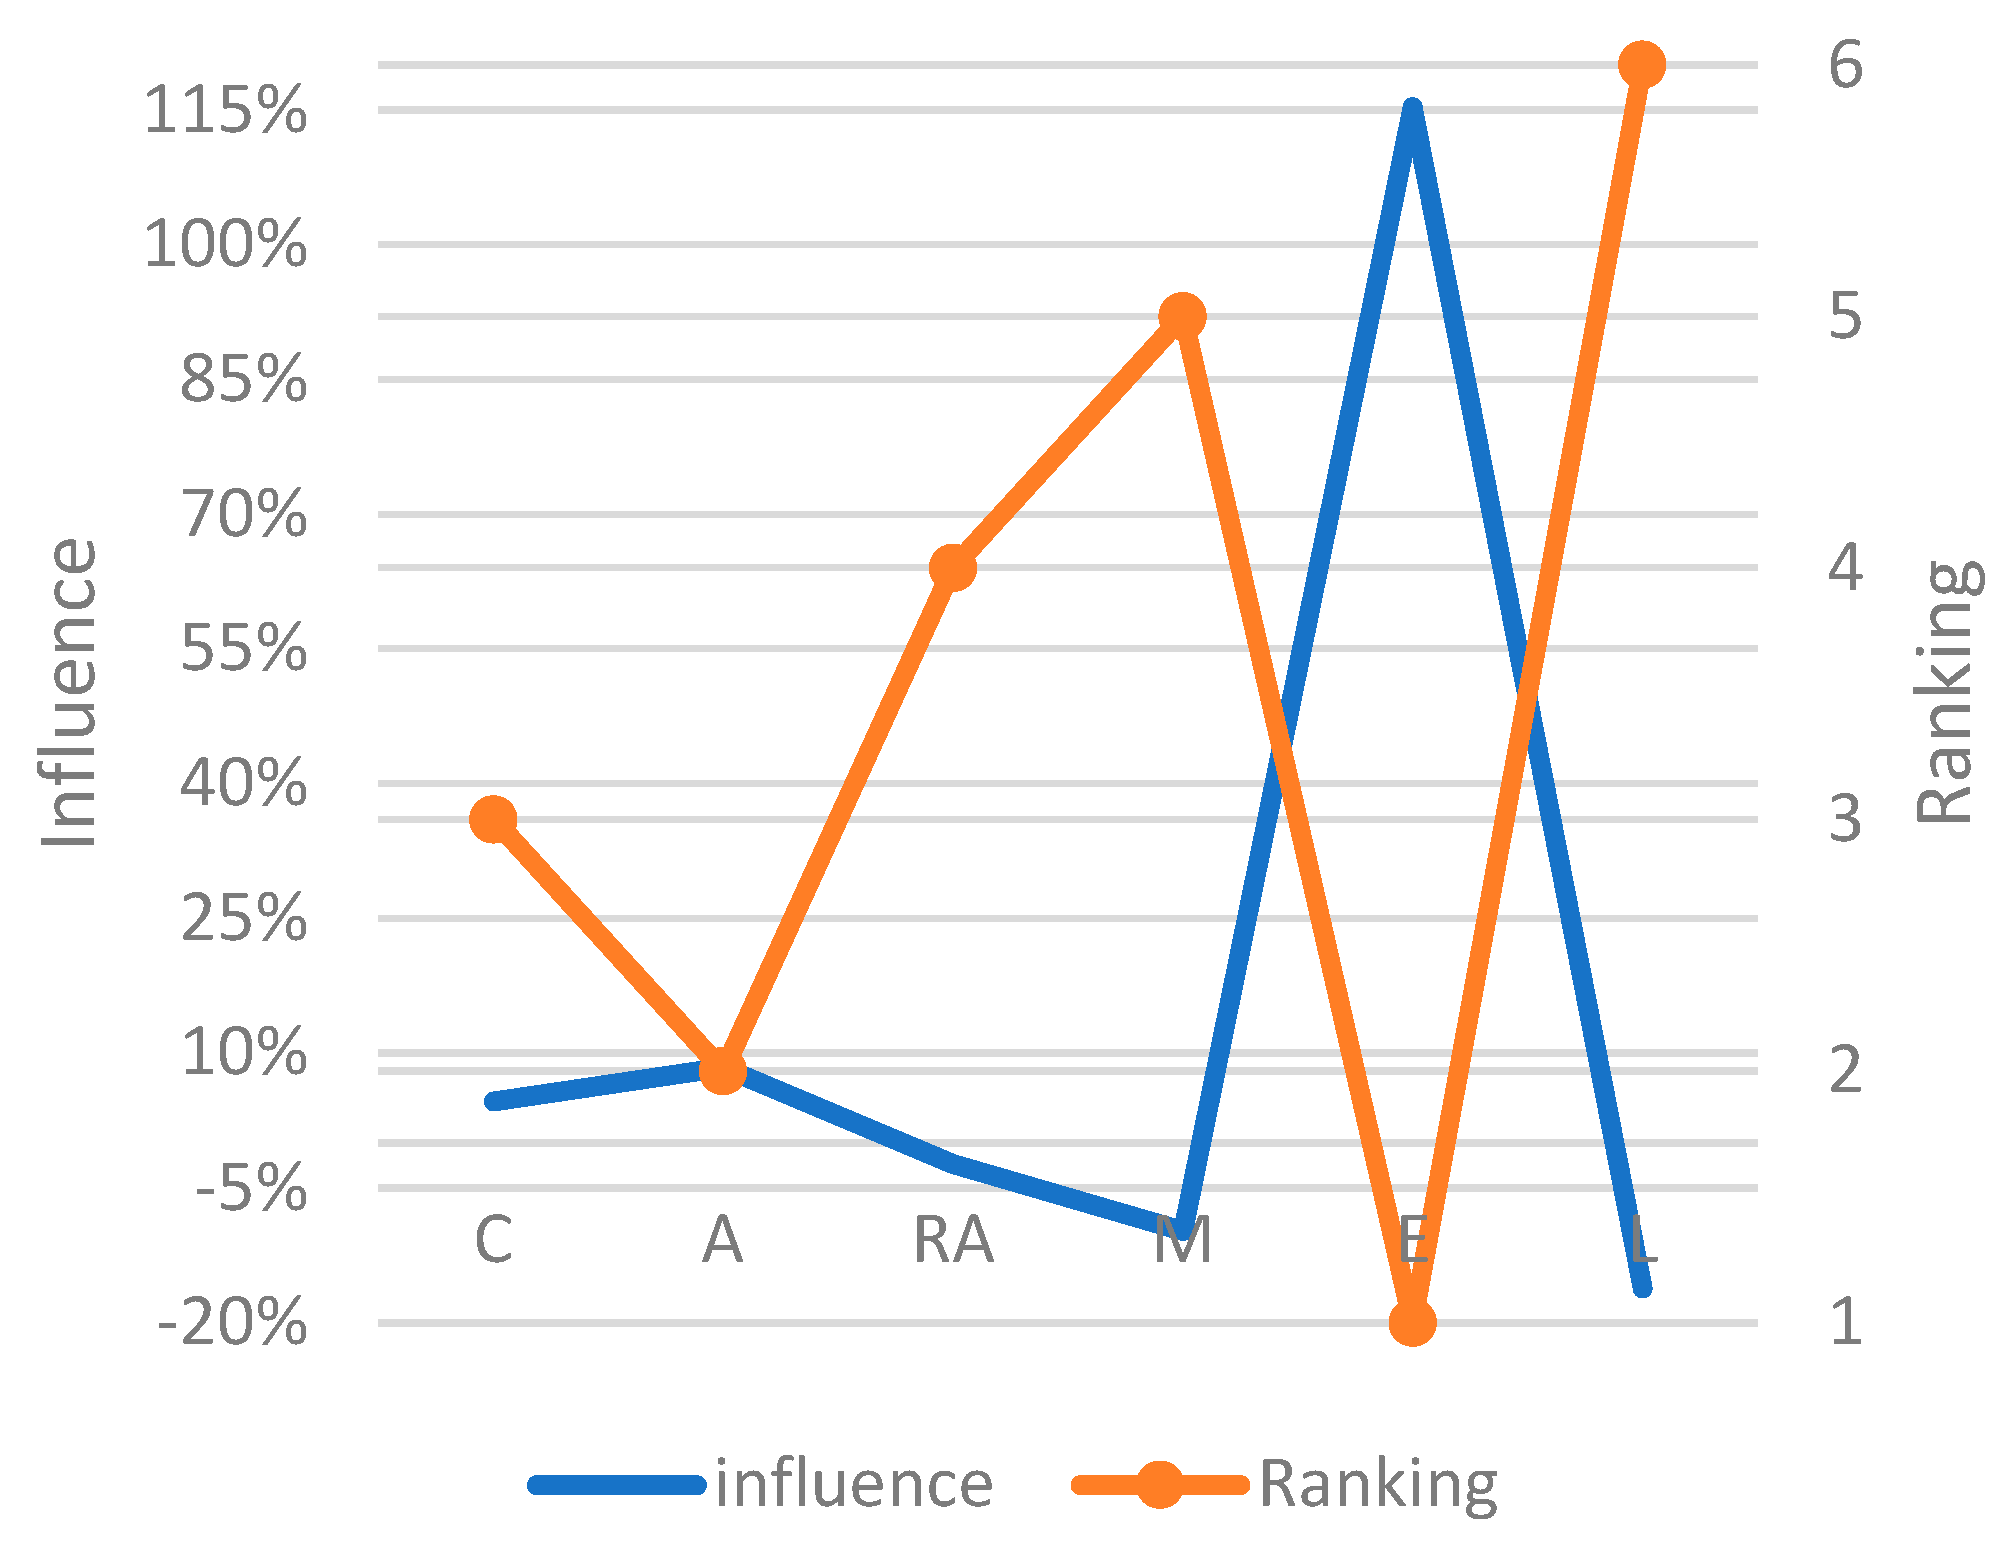
Table 7 present ratio influences and variances. A graphical presentation of the profitability risk (dynamic) CARAMEL composition for variance and ranking is illustrated in
Figure 8.
The risk (dynamic) analysis serves to find long-term and risky drivers influencing profitability measured by variance composition. Looking at the detailed decomposition, for the given period, the risk is mostly increased by (71.07%), the liquidity ratio 37.39%, (34.27%), (9.96%), financial leverage (8.39%), and solvency (6.85%). Decreasing factories are firstly (−53.55%), (−9.81%), (−2.34%), (−2.23%),
Risk, according to the Caramel categorisation, is increased enormously by the earnings (115.302%), asset quality (8.392%), and capital adequacy (4.617%). Risk is decreased mainly by liquidity (−16.169%), management (−9.806%), and reinsurance (−2.336%).
The results turned out that the substantial drivers increasing risk are earnings and asset quality; on the other hand, risk is reduced by liquidity and management indicators.
The profitability risk (dynamic) analysis of the insurance sector shows the ranking of the influential indices, particularly in a case study of an unstable period with economic shocks. The advantage of this approach is that the findings are valid for a stated period and can be considered to be stable results.
The risk (dynamic) analysis results can be considered valuable information for the long-term strategy of the financial sector. The obtained information can be used to support tactical and strategic analysis and managerial decisions as well.
4. Conclusions
The paper’s goal was to perform a static and risk (dynamic) profitability analysis of the open economy Czech insurance sector in an unstable period with economic shocks.
The pyramid decomposition system of financial ratios was proposed and verified to reflect the CARAMEL categorisation of the insurance financial ratios system.
Static analysis using the functional method was applied and verified. It turned out that the advantage of the functional method consists of common application possibilities, including positive and negative ratio indices in the analysis. The yearly non-stable drivers of insurance sector profitability deviation were confirmed. In spite of this, the most influential were the earnings ratio deviations in either increasing or decreasing ROE alternatives. Solvency (capital adequacy) positively influenced the ROE deviation. So, static pyramid decomposition analysis can be a valuable and effective profitability analysis tool for finding more influential drivers yearly.
The weakness of the static approach lies in the non-stability of the results. Every inter-year comparison is usually different according to economic development and conditions. Applying the risk (dynamic) decomposition method based on the variance analysis can overcome the drawbacks of the static method. From the time-series data, long-term profitability fluctuation drivers can be deduced. It turned out, according to the CARAMEL categorisation, that earnings and asset quality enormously increase the risk of the insurance sector. Conversely, risk is decreased mainly by liquidity and management.
The insurance sector was analysed using real data in a non-stable period of an economic shock chain. Simultaneously, the static and risk (dynamic) methods were verified, and significant influential factors were identified. The limitation of the study lies in that a deep and separate analysis of the economic shocks (overheating economy, Covid, Ukraine war) has not been conducted. The results can serve as a background for an operating (static) and strategic (dynamic) analysis and for making decisions.
Author Contributions
Z.Z. and D.D. contributed to the paper’s conception and methodology. Formal analysis was carried out by Z.Z., D.D., K.L. and I.R. The first draft of the manuscript was written by Z.Z., and all the authors commented on previous versions of the manuscript. Conceptualisation: Z.Z., D.D.; Methodology: Z.Z., D.D.; Data Curation: I.R.; Software: Z.Z.; Writing—Original Draft: Z.Z.; Writing—Review & Editing: D.D., K.L., I.R.; Funding acquisition: D.D.; Formal analysis and investigation: Z.Z., D.D., K.L. and I.R. All authors have read and agreed to the published version of the manuscript.
Funding
The paper is supported by the Grant Agency of the VSB-Technical University Ostrava SP2024/045.
Data Availability Statement
The original contributions presented in this study are included in the article. Further inquiries can be directed to the corresponding author(s).
Conflicts of Interest
The authors declare no conflicts of interest.
Appendix A. The Functional Method Derivation of the Multiplicative Equation
- (a)
The multiplicative equation of four indicators
For the multiplicative function,
influence can be derived as follows:
, after rearrangement,
In financial terminology, the discrete returns are depicted
and
, then
Furthermore, because of dividing it into four factors, the equation is rearranged as follows,
From the previous equation, particular factor influences can be stated as follows,
- (b)
The multiplicative equation of three indicators
Derived analogously for three indicators.
- (c)
The multiplicative equation of two indicators
Derived analogously for two indicators.
References
- Adams, Mike, Bruce Burton, and Philip Hardwick. 2003. The determinants of credit ratings in the United Kingdom insurance industry. Journal of Business Finance and Accounting 30: 539–72. [Google Scholar] [CrossRef]
- Albers, Sönke. 1998. A framework for analysis of sources of profit contribution variance between actual and plan. International Journal of Research in Marketing 15: 109–22. [Google Scholar] [CrossRef]
- Ang, Beng Wah. 1994. Decomposition of industrial energy consumption: The energy intensity approach. Energy Economics 16: 163–74. [Google Scholar] [CrossRef]
- Ang, Beng Wah. 2004. Decomposition analysis for policymaking in energy: Which is the preferred method? Energy Policy 32: 1131–39. [Google Scholar] [CrossRef]
- Ang, Beng Wah. 2005. The LMDI approach to decomposition analysis: A practical guide. Energy Policy 33: 867–71. [Google Scholar] [CrossRef]
- Ang, Beng Wah, and S. Y. Lee. 1994. Decomposition of industrial energy consumption: Some methodological and application issues. Energy Economics 16: 83–92. [Google Scholar] [CrossRef]
- Barua, Bipasha, Suborna Barua, and Rezwanul HasanRana. 2018. Determining the financial performance of non-life insurers: Static and dynamic panel evidence from an emerging economy. Journal of Development Areas 52: 153–67. [Google Scholar] [CrossRef]
- Benali, Nadia, and Feki Rochdi. 2017. The impact of natural disasters on insurers’ profitability: Evidence from Property/Casualty insurance company in United States. Research in International Business and Finance 42: 1394–400. [Google Scholar] [CrossRef]
- Borodin, Alex, Irina Mityushina, Elena Streltsova, Andrey Kulikov, Irina Yakovenko, and Anzhela Namitulina. 2021. Mathematical modeling for financial analysis of an enterprise: Motivating of not open innovation. Journal of Open Innovation: Technology, Market, and Complexity 7: 79. [Google Scholar] [CrossRef]
- Czech Insurance Association. 2023. Insurance Market Development. Available online: https://www.cap.cz/en/statistics/insurance-market-development (accessed on 18 April 2024).
- Czech Statistical Office. 2023. Available online: https://csu.gov.cz/home (accessed on 18 April 2024).
- Das, Udaibir S., Nigel Davies, and Richard Podpiera. 2003. Insurance and Issues in Financial Soundness. IMF Working Paper WP/03/138. Washington, DC: International Monetary Fund. [Google Scholar]
- Dluhosova, Dana, Karolina Lisztwanova, Antonin Poncik, Iveta Ratmanova, and Zdenek Zmeskal. 2022. Dynamic and Static Decomposition Analysis of the Czech Automotive Production Sector. European Research Studies Journal 25: 84–95. [Google Scholar] [CrossRef]
- Dluhošová, Dana. 2004. Approaches to financial performance analysis of companies and sectors on EVA—Economic Value Added measure. Finance a úvěr—Czech Journal of Economics and Finance 54: 11–12. [Google Scholar]
- Doumpos, Michael, Chrysovalantis Gaganis, and Fotios Pasiouras. 2012. Estimating and explaining the financial performance of property and casualty insurers: A two-stage analysis. Journal of Competitiveness and Business Economics Research Journal 5: 155–70. [Google Scholar] [CrossRef]
- Eling, Martin, and Ruo Jia. 2019. Efficiency and profitability in the global insurance industry. Pacific-Basin Finance Journal 57: 101190. [Google Scholar] [CrossRef]
- Eling, Martin, Ruo Jia, and Philipp Schaper. 2022. The magic triangle: Growth, profitability and safety in the insurance industry. The Geneva Papers on Risk and Insurance—Issues and Practice 47: 321–48. [Google Scholar] [CrossRef]
- Gaffney, Kevin, Valeri Gladkikh, and R. Alan Webb. 2007. A case study of a variance analysis framework for managing distribution costs. Accounting Perspectives 6: 167–90. [Google Scholar] [CrossRef]
- Green, H. William, and Dan Segal. 2004. Profitability and efficiency in the U.S. life insurance industry. Journal of Productivity Analysis 21: 229–47. [Google Scholar] [CrossRef]
- Jarraya, Bilel Haterm Afi, and Anis Omri. 2023. Analysing the profitability and efficiency in European non-life insurance industry. Methodology and Computing in Applied Probability 25: 68. [Google Scholar] [CrossRef]
- Jencova, Sylvia, Eva Litavcova, and Petra Vasanicova. 2018. Implementation of Du Pont model in non-financial corporations. Montenegrin Journal of Economics 14: 131–41. [Google Scholar] [CrossRef]
- Jeppson, Nathan H., John A. Ruddy, and David F. Salerno. 2021. The influence of social media usage on the DuPont method of analysis. Journal of Corporate Accounting and Finance 32: 31–44. [Google Scholar] [CrossRef]
- Jin, Yan. 2017. DuPont analysis, earnings persistence, and return on equity: Evidence from mandatory IFRS adoption in Canada. Accounting Perspectives 16: 205–35. [Google Scholar] [CrossRef]
- Kaya, Emine Öner. 2015. The effects of firm-specific factors on the profitability of non-life insurance companies in Turkey. International Journal of Financial Studies 3: 510–29. [Google Scholar] [CrossRef]
- Killins, Robert N. 2020. Firm-specific, industry-specific and macroeconomic factors of life insurers’ profitability: Evidence from Canada. North American Journal of Economics and Finance 51: 101068. [Google Scholar] [CrossRef]
- Kirkbeşoğlu, Erden, Jon McNeill, and Emir H. Ozder. 2015. An evaluation of the effectiveness of insurance organisations at providing information to policyholders: A cross-cultural comparison between United Kingdom and Turkey. International Business Research 8: 35. [Google Scholar] [CrossRef]
- Kryzanowski, Lawrence, and Sana Mohsni. 2015. Earnings forecasts and idiosyncratic volatilities. International Review of Financial Analysis 41: 107–23. [Google Scholar] [CrossRef]
- Kwon, Jean W., and Leigh Wolfrom. 2017. Analytical tools for the insurance market and macro-prudential surveillance. OECD Journal: Financial Market Trends 2016: 1–49. [Google Scholar]
- Lorson, Jonas, and Joël Wagner. 2014. Sales efficiency in life insurance: The drivers for growth in the German market. The Geneva Papers 39: 493–524. [Google Scholar] [CrossRef]
- OECD.Stat. 2022. Available online: https://stats.oecd.org/Index.aspx?DatasetCode=INSIND (accessed on 18 April 2024).
- Park, Se-Hark. 1992. Decomposition of industrial energy consumption: An alternative method. Energy Economics 14: 265–70. [Google Scholar] [CrossRef]
- Pottier, Steven W. 1997. Life insurer financial distress, Best’s ratings and financial ratios. Journal of Risk and Insurance 65: 275–88. [Google Scholar] [CrossRef]
- Sharma, Abhijit, Md Diara Jadi, and Damian Ward. 2021. Analysing the determinants of financial performance for UK insurance companies using financial strength ratings information. Economic Change and Restructuring 54: 683–97. [Google Scholar] [CrossRef]
- Shiu, Yung-Ming. 2009. Dynamic financial analysis in the insurance industry. The Geneva Papers on Risk and Insurance—Issues and Practice 34: 175–96. [Google Scholar] [CrossRef]
- Siopi, Evaggelia, and Thomas Poufinas. 2023. Impact of internal and external factors on the profitability and financial strength of insurance groups. International Advances in Economic Research 29: 129–49. [Google Scholar] [CrossRef]
- Surya, M., and B. Sudha. 2020. Insurance financial soundness indicator—Caramel model. International Journal of Advanced Science and Technology 29: 1234–42. [Google Scholar]
- Szymańska, Elżbieta Jadwiga. 2017. Determinants of profitability of enterprises of meat industry in Poland. Acta Scientiarum Polonorum Oeconomia 16: 83–91. [Google Scholar] [CrossRef]
- Torbati, Ali Reza, and Mohammad KazemSayadi. 2018. A new approach to investigate the performance of insurance branches in Iran using best-worst method and fuzzy inference system. Journal of Soft Computing and Decision Support Systems 5: 13–18. [Google Scholar]
- Van Gestel, Tony, David Martens, Bart Baesens, Daniel Feremans, Johan Huysmans, and Jan Vanthienen. 2007. Forecasting and analysing insurance companies’ ratings. International Journal of Forecasting 23: 513–29. [Google Scholar] [CrossRef]
- Zmeškal, Zdeněk, Dana Dluhošová, Karolina Lisztwanová, Antonín Pončík, and Iveta Ratmanová. 2023. Distribution prediction of decomposed relative EVA measure with Levy-driven mean-reversion processes: The case of an automotive sector of a small open economy. Forecasting 5: 453–71. [Google Scholar] [CrossRef]
| Disclaimer/Publisher’s Note: The statements, opinions and data contained in all publications are solely those of the individual author(s) and contributor(s) and not of MDPI and/or the editor(s). MDPI and/or the editor(s) disclaim responsibility for any injury to people or property resulting from any ideas, methods, instructions or products referred to in the content. |
© 2025 by the authors. Licensee MDPI, Basel, Switzerland. This article is an open access article distributed under the terms and conditions of the Creative Commons Attribution (CC BY) license (https://creativecommons.org/licenses/by/4.0/).
