
Advanced Operator Theory for Energy Market Trading: A New Framework


Abstract
1. Introduction
2. Mathematical Frameworks
2.1. Preliminaries on Semigroup Theory
- i
- is the identity function,
- ii
- for all ,
- iii
- fixed one has for all .
- i.
- regular if and ;
- ii.
- exit if and ;
- iii.
- entrance if and ;
- iv.
- natural if and .
- (i)
- implies ;
- (ii)
- implies ;
- (iii)
- implies ;
- (iv)
- implies .
- i.
- ;
- ii.
- for all , ;
- iii.
- for all , .
2.2. A Generalized Operator for an Option Pricing Model, and Its Semigroup
- if , the SDE (14) becomeswhere we let and . When , the SDE (15) represents Longstaff’s model in the financial literature, which describes the dynamics of the short-term interest rate of zero-coupon bonds. The parameter k represents the speed of adjustment to the process long mean, while is the volatility. It belongs to the class of the so-called “double square-root” processes and is a modified version of the Cox–Ingersoll–Ross (CIR) process;
- if , the SDE (14) becomeswhere we let and . The SDE (16) is used in economics and genetics as a model to describe the evolution of certain population growth processes with environmental effects varying randomly over time. It is clear that, if and represent the drift and the volatility of , respectively, it reduces to the classic Black–Scholes (BS) model.
- Case 1: if ,
- Case 2: if ,
- Case 3: if ,
- first of all, find a closed solution of SDE (14)
- then, search for a drift coefficient function such that for any ,
- finally, try Novikov’s condition, which ensures that a Radon–Nikodym derivative (in Girsanov’s theorem) is a martingale.
3. Numerical Validation
3.1. Benchmark Models
- the geometric Brownian motion (GBM), used in the classic Black–Scholes model Black and Scholes (1973), in which the underlying asset is a geometric-Brownian motion, i.e.,where is the diffusion coefficient, the drift coefficient, and a (standard) -Brownian motion.The (conditioned) expectation of such a process is given byfor any .
- the skew-geometric Brownian motion (sGBM) recently proposed in Ascione et al. (2024b), Bufalo and Fanelli (2024), Bufalo et al. (2022), Zhu and He (2018), for instance. As is well known, asset returns are generally not normally distributed in financial markets, but show a significant amount of skewness and extra-kurtosis. For this reason, the authors hypothesized that the underlying asset is a skew-geometric Brownian motion, i.e.,with being the scale parameter, the location parameter, and a (standard) -skew-Brownian motion (see, e.g., Ito et al. (2012)). In particular, according to (Corns and Satchell 2007, Proposition 2.1), we adopt the following stochastic representation for :with being two independent Brownian motions, and the rescaled shape parameter.The (conditioned) expectation of this process is given by (see (Ascione et al. 2024b, Proposition 3.3))for any , where .
3.2. Distributions of Market Returns
- The Shapiro–Wilk (SW) test uses the null hypothesis that a sample is normally distributed. It is based on comparing how far the asymmetry and kurtosis measures are from the values of the (standard) normal distribution. The SW test statistic is defined aswhere is the h-th order statistic, is the sample mean, and the vector is given by , where indicates the transposed of the array , where is the expected values of the order statistics of i.i.d. (standard) normal variables, and is the covariance matrix of these order statistics.
- The Jarque–Bera (JB) test is a goodness-of-fit test of whether a sample has skewness and kurtosis matching a normal distribution. The JB test statistic is defined aswhere represent the sample skewness and kurtosis, respectively, i.e.,
- The Anderson–Darling (AD) test is a modification of the Kolmogorov–Smirnov (KS) test, used to assess whether a sample has a specific distribution. Differently from the KS test, it gives more weight to the tails. The AD test is defined aswhere represents the ordered data.
3.3. Calibration
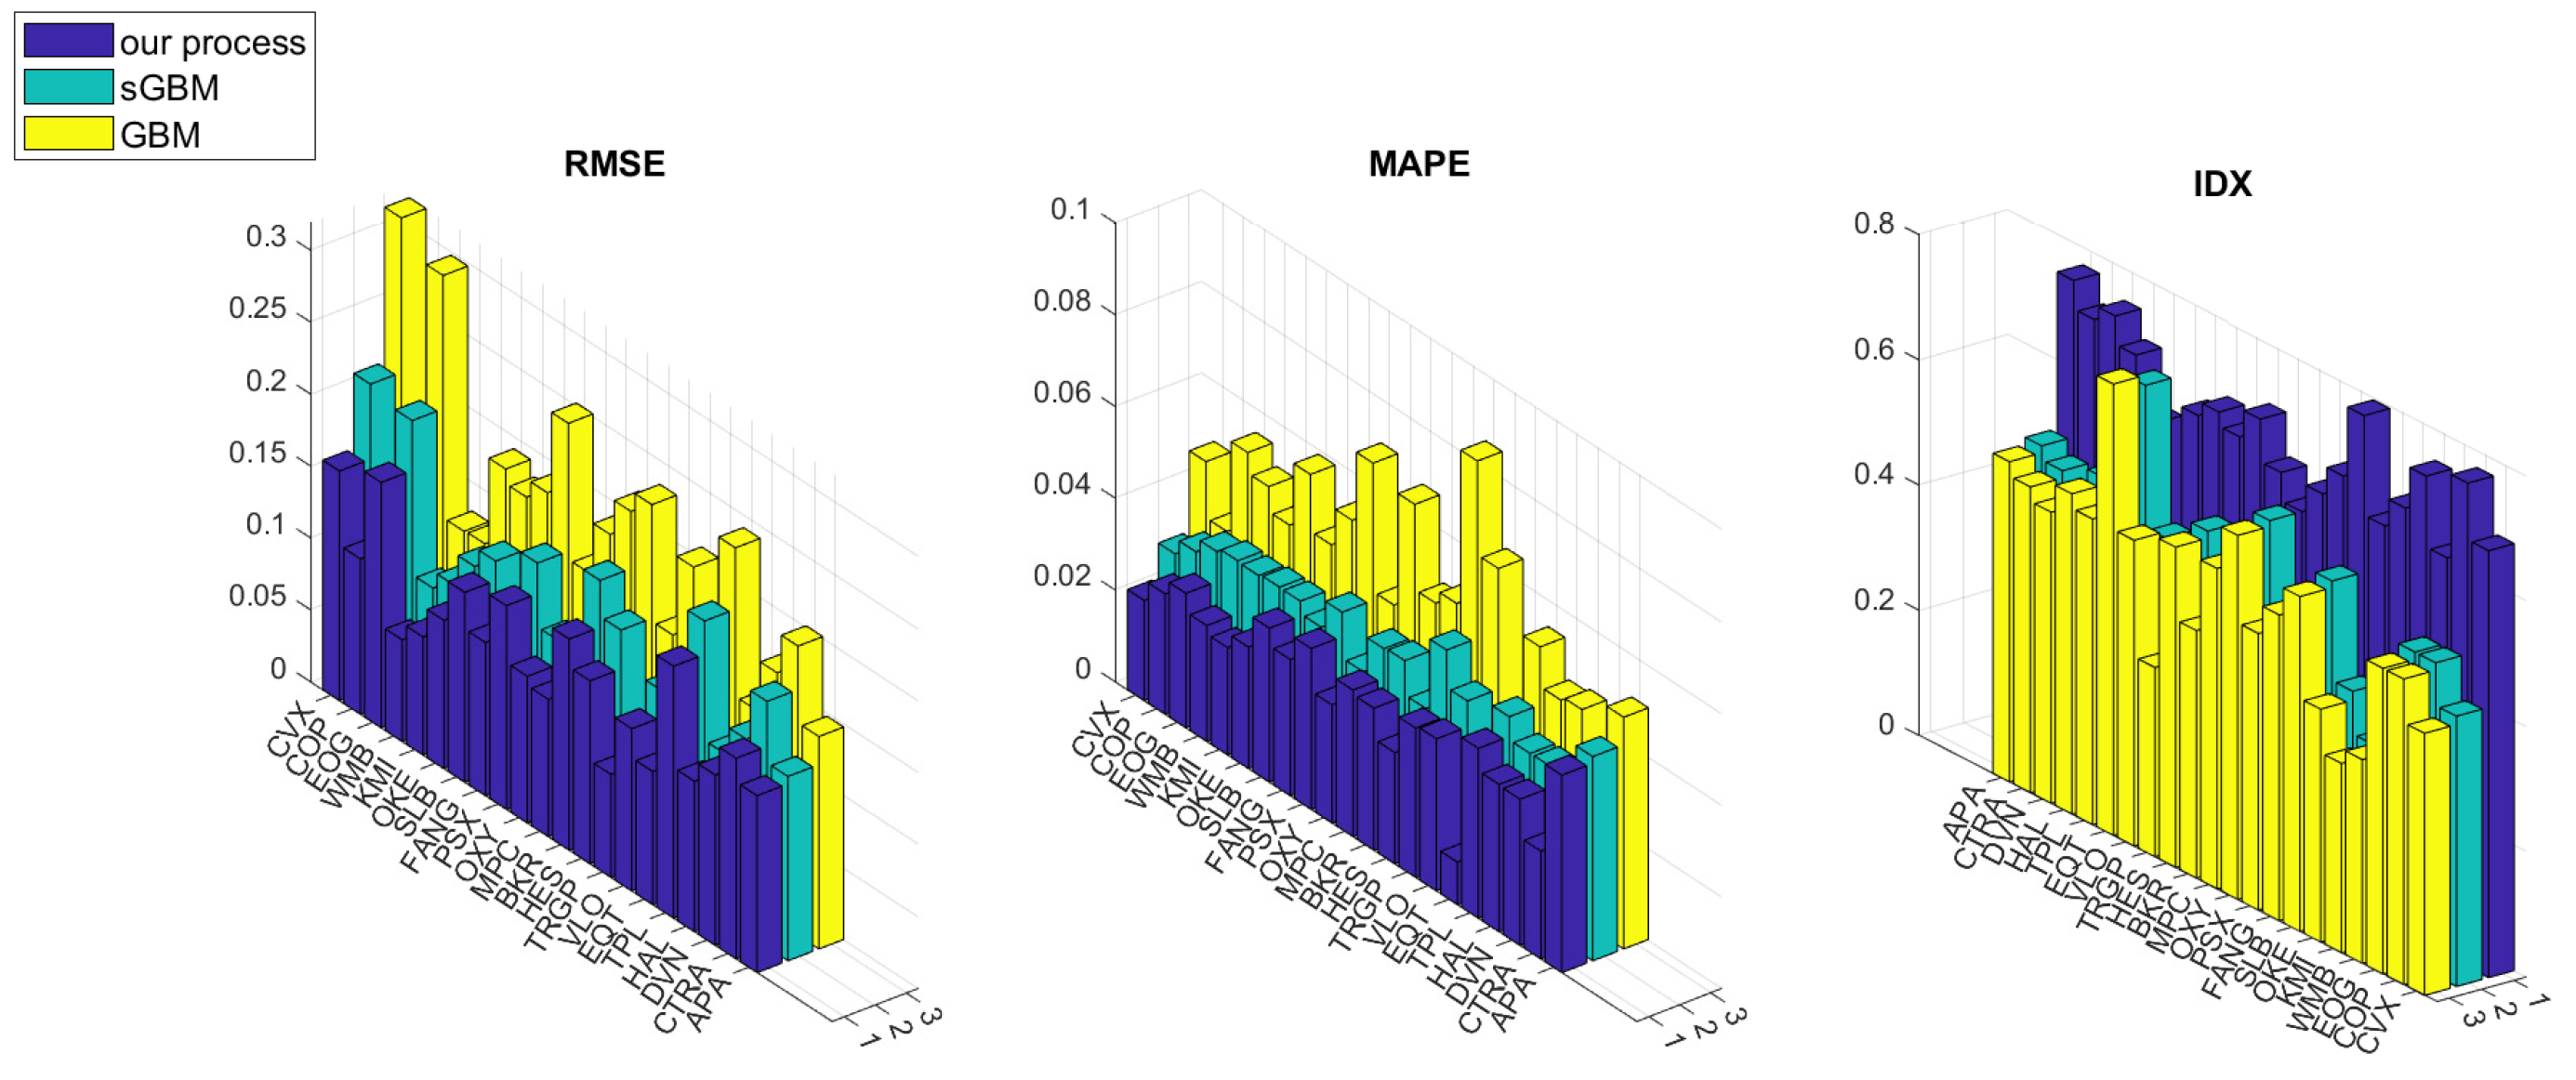
3.4. In Sample Simulations
- The root mean squared error (RMSE):
- The mean absolute percentage error (MAPE):
- The index of directionality (IDX) introduced in Orlando and Bufalo (2021):where and . The IDX indicates the percentage success (in sign) of prediction directionality, i.e., the percentage of times where the simulated values rise or fall coherently with the real data.
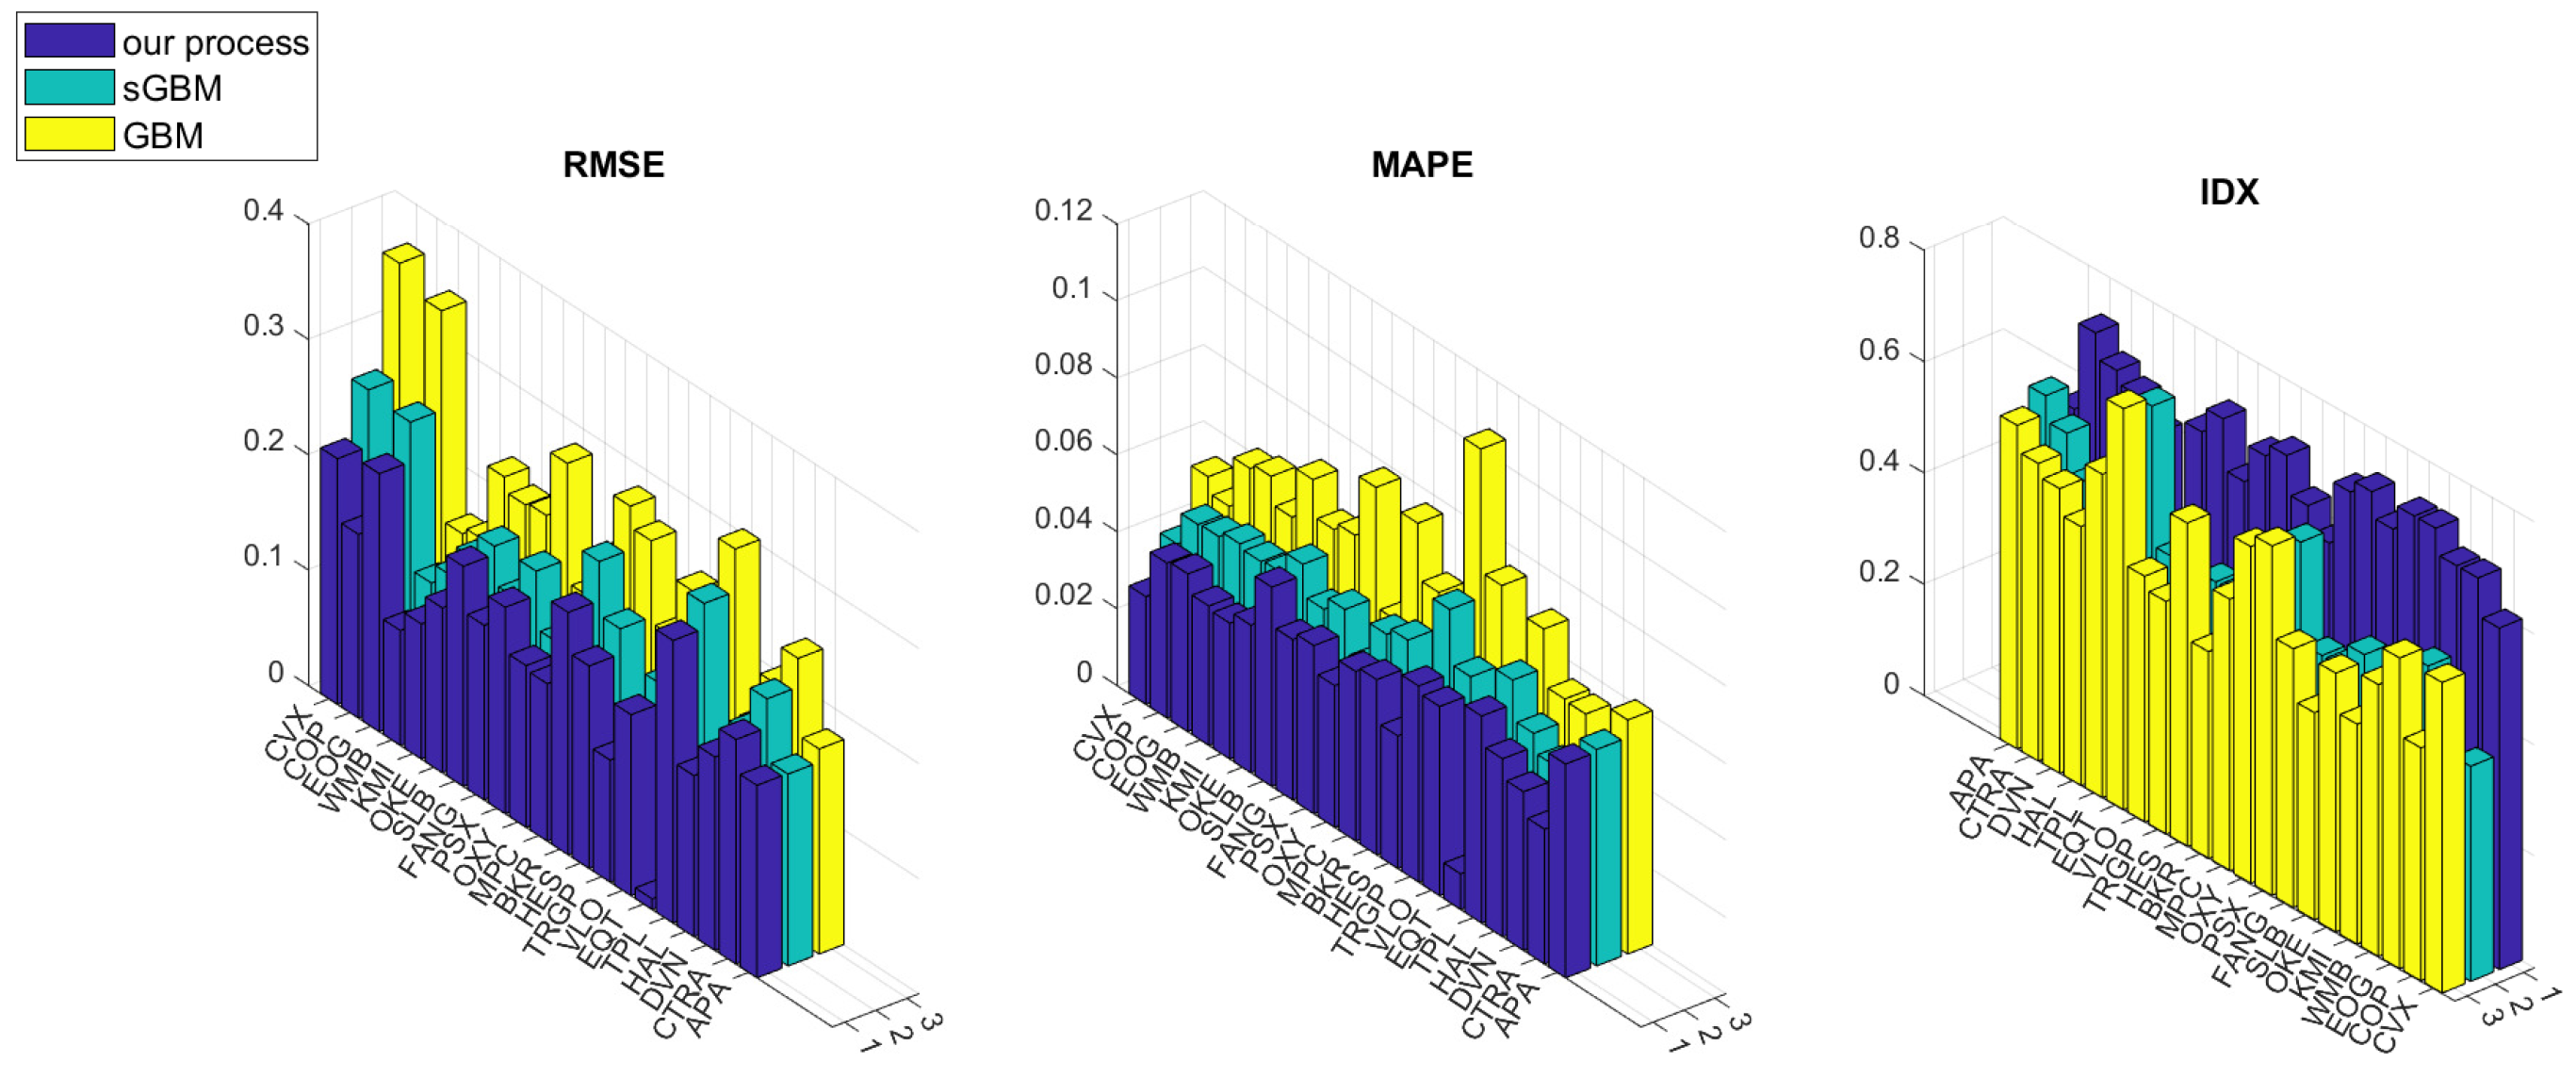
3.5. Forecasts
4. Conclusions
Author Contributions
Funding
Data Availability Statement
Conflicts of Interest
| 1 | being the closure of J, i.e., in this case . |
References
- Ascione, Giacomo, Bufalo Michele, and Orlando Giuseppe. 2024a. Credit default swap spreads modeling and forecasting with a stochastic square-root three-factor model. Journal of Computational and Applied Mathematics 451: 115993. [Google Scholar] [CrossRef]
- Ascione, Giacomo, Bufalo Michele, and Orlando Giuseppe. 2024b. Modeling volatility of disaster-affected populations: A non-homogeneous geometric-skew brownian motion approach. Communications in Nonlinear Science and Numerical Simulation 130: 107761. [Google Scholar] [CrossRef]
- Barndorff-Nielsen, Ole E. 2001. Non-gaussian processes in finance. In Levy Processes: Theory and Applications. Berlin: Springer. [Google Scholar]
- Black, Fischer, and Myron Scholes. 1973. The pricing of options and corporate liabilities. Journal of Political Economy 81: 637–54. [Google Scholar] [CrossRef]
- Bourza, Mohamed. 2023. Euler-maruyama approximation for diffusion process generated by divergence form operator with discontinuous coefficients. Jordan Journal of Mathematics and Statistics (JJMS) 16: 515–33. [Google Scholar]
- Böttcher, Björn, René Schilling, Jian Wang, Björn Böttcher, René Schilling, and Jian Wang. 2013. A primer on feller semigroups and feller processes. In Lévy Matters III: Lévy-Type Processes: Construction, Approximation and Sample Path Properties. Berlin: Springer, pp. 1–30. [Google Scholar]
- Bufalo, Michele, and Viviana Fanelli. 2024. Modelling the chinese crude oil futures returns through a skew-geometric brownian motion correlated with the market volatility index process for pricing financial options. Applied Stochastic Models in Business and Industry 40: 1377–401. [Google Scholar] [CrossRef]
- Bufalo, Michele, Brunero Liseo, and Orlando Giuseppe. 2022. Forecasting portfolio returns with skew-geometric brownian motions. Applied Stochastic Models in Business and Industry 38: 620–50. [Google Scholar] [CrossRef]
- Bufalo, Michele, Rosa Maria Mininni, and Silvia Romanelli. 2019. A semigroup approach to generalized black-scholes type equations in incomplete markets. Journal of Mathematical Analysis and Applications 477: 1195–223. [Google Scholar] [CrossRef]
- Ceci, Claudia, Bufalo Michele, and Orlando Giuseppe. 2024. Modelling the industrial production of electric and gas utilities through the cir 3 model. Mathematics and Financial Economics 18: 1–25. [Google Scholar] [CrossRef]
- Corns, T. Richard A., and Stephen E. Satchell. 2007. Skew brownian motion and pricing european options. The European Journal of Finance 13: 523–44. [Google Scholar] [CrossRef]
- Diebold, Francis X., and Robert S. Mariano. 2002. Comparing predictive accuracy. Journal of Business & Economic Statistics 20: 134–44. [Google Scholar]
- Engel, Klaus J. 2000. One-Parameter Semigroups for Linear Evolution Equations. Berlin: Springer. [Google Scholar]
- Ethier, Stewart N., and Thomas G. Kurtz. 2009. Markov Processes: Characterization and Convergence. Hoboken: John Wiley & Sons. [Google Scholar]
- Goldstein, Gisele Ruiz, Jerome A. Goldstein, Rosa Maria Mininni, and Silvia Romanelli. 2016. The Semigroup Governing the Generalized Cox-Ingersoll-Ross Equation. Advances in Differential Equations 21: 235–64. [Google Scholar] [CrossRef]
- Goldstein, Jerome A. 2017. Semigroups of Linear Operators and Applications. Mineola: Courier Dover Publications. [Google Scholar]
- Goldstein, Jerome A., Rosa Maria Mininni, and Silvia Romanelli. 2007. Markov semigroups and estimating functions, with applications to some financial models. Communications on Stochastic Analysis 1: 3. [Google Scholar] [CrossRef]
- Hwang, Taeyoon, and Timothy J. Vogelsang. 2024. Some fixed-b results for regressions with high frequency data over long spans. Journal of Econometrics 244: 105773. [Google Scholar] [CrossRef]
- Itô, Kiyosi, and Henry P. McKean, Jr. 2012. Diffusion Processes and Their Sample Paths. Berlin: Springer Science & Business Media. [Google Scholar]
- Karatzas, Ioannis, and Steven Shreve. 1998. Brownian Motion and Stochastic Calculus. Berlin: Springer. [Google Scholar]
- Karlin, Samuel, and Howard E. Taylor. 1981. A Second Course in Stochastic Processes. Amsterdam: Elsevier. [Google Scholar]
- Mil’shtein, Grigori Noyhovich. 1979. A method of second-order accuracy integration of stochastic differential equations. Theory of Probability & Its Applications 23: 396–401. [Google Scholar]
- Orlando, Giuseppe, and Bufalo Michele. 2021. Interest rates forecasting: Between hull and white and the cir#—How to make a single-factor model work. Journal of Forecasting 40: 1566–80. [Google Scholar]
- Øksendal, Bernt, and Bernt Øksendal. 2003. Stochastic Differential Equations. Berlin: Springer. [Google Scholar]
- Peskir, Goran, and Albert Shiryaev. 2006. Optimal Stopping and Free-Boundary Problems. Basel: Birkhäuser. [Google Scholar]
- Shiryaev, Albert Nikolaevic. 2004. Stochastic Calculus for Finance II: Continuous-Time Models.
- Shreve, Steve. 2004. Stochastic Calculus for Finance. Berlin: Springer. [Google Scholar]
- Taira, Kazuaki. 1984. Diffusion processes and partial differential equations. In North-Holland Mathematics Studies. Amsterdam: Elsevier, vol. 98, pp. 197–210. [Google Scholar]
- Zhu, Song-Ping, and Xin-Jiang He. 2018. A new closed-form formula for pricing european options under a skew brownian motion. The European Journal of Finance 24: 1063–74. [Google Scholar] [CrossRef]


| Asset | Mean | Standard Dev. | Skewness | Kurtosis |
|---|---|---|---|---|
| Chevron Corporation (CVX) | 6.3758 | 0.0272 | 0.7121 | 3.231 |
| Conoco Phillips (COP) | −9.2635 | 0.0323 | −0.1026 | 3.2221 |
| EOG Resources, Inc. (EOG) | −4.6655 | 0.0358 | −0.4703 | 3.3402 |
| Williams Companies, Inc. (WMB) | −9.2619 | 0.0284 | −0.5748 | 3.8821 |
| Kinder Morgan, Inc. (KMI) | −9.4588 | 0.0289 | −1.1115 | 5.7160 |
| ONEOK, Inc. (OKE) | −7.9725 | 0.0348 | −1.1504 | 6.3662 |
| Schlumberger N.V. (SLB) | 5.7053 | 0.0418 | −0.0357 | 2.5529 |
| Diamondback Energy, Inc. (FANG) | 2.8406 | 0.0384 | 0.3411 | 3.0976 |
| Phillips 66 (PSX) | −1.1050 | 0.0460 | −1.1130 | 5.5000 |
| Occidental Petroleum Corporation (OXY) | 3.8091 | 0.0330 | −0.0863 | 3.5804 |
| Marathon Petroleum Corporation (MPC) | 1.4819 | 0.0397 | −9.8637 | 2.6393 |
| Baker Hughes Company (BKR) | −3.9330 | 0.0379 | −0.5770 | 3.7861 |
| Hess Corporation (HES) | 1.6281 | 0.0328 | 0.8284 | 3.9164 |
| Targa Resources, Inc. (TRGP) | −0.0142 | 0.0383 | −0.9581 | 5.3760 |
| Valero Energy Corporation (VLO) | 1.1847 | 0.0410 | −0.1199 | 2.7115 |
| EQT Corporation (EQT) | −0.0157 | 0.0757 | −0.8760 | 5.3174 |
| Texas Pacific Land Corporation (TPL) | −2.909 | 0.0477 | −0.3243 | 3.7044 |
| Halliburton Company (HAL) | 5.352 | 0.0444 | 0.1826 | 3.0245 |
| Devon Energy Corporation (DVN) | 6.5625 | 0.0396 | 0.1687 | 2.4979 |
| Coterra Energy, Inc. (CTRA) | 2.5539 | 0.0348 | −0.0010 | 2.7696 |
| APA Corporation (APA) | 8.8974 | 0.0501 | 0.1248 | 2.0983 |
| Asset | SW Test | JB Test | AD Test | |||
|---|---|---|---|---|---|---|
| resp. | p-value | resp. | p-value | resp. | p-value | |
| Chevron Corporation (CVX) | 0 | 0.0802 | 0 | 0.0586 | 0 | 0.8273 |
| Conoco Phillips (COP) | 0 | 0.2288 | 0 | 0.5000 | 0 | 0.8227 |
| EOG Resources, Inc. (EOG) | 0 | 0.3825 | 0 | 0.1972 | 0 | 0.2766 |
| Williams Companies, Inc. (WMB) | 0 | 0.0345 | 0 | 0.0578 | 0 | 0.8616 |
| Kinder Morgan, Inc. (KMI) | 1 | 0.0029 | 1 | 0.0018 | 0 | 0.9686 |
| ONEOK, Inc. (OKE) | 1 | 0.0020 | 1 | 0.0010 | 0 | 0.8412 |
| Schlumberger N.V. (SLB) | 0 | 0.6420 | 0 | 0.5000 | 0 | 0.1448 |
| Diamondback Energy, Inc. (FANG) | 0 | 0.7933 | 0 | 0.5000 | 0 | 0.0842 |
| Phillips 66 (PSX) | 1 | 0.0024 | 1 | 0.0022 | 0 | 0.9206 |
| Occidental Petroleum Corporation (OXY) | 0 | 0.5401 | 0 | 0.5000 | 0 | 0.3130 |
| Marathon Petroleum Corporation (MPC) | 0 | 0.9560 | 0 | 0.5000 | 0 | 0.0100 |
| Baker Hughes Company (BKR) | 0 | 0.1556 | 0 | 0.0656 | 0 | 0.2815 |
| Hess Corporation (HES) | 0 | 0.0142 | 0 | 0.0240 | 0 | 0.9250 |
| Targa Resources, Inc. (TRGP) | 1 | 0.0070 | 1 | 0.0035 | 0 | 0.8107 |
| Valero Energy Corporation (VLO) | 0 | 0.6678 | 0 | 0.5000 | 0 | 0.4595 |
| EQT Corporation (EQT) | 1 | 0.0015 | 1 | 0.0043 | 0 | 0.9989 |
| Texas Pacific Land Corporation (TPL) | 0 | 0.4769 | 0 | 0.2276 | 0 | 0.1786 |
| Halliburton Company (HAL) | 0 | 0.3004 | 0 | 0.5000 | 0 | 0.8474 |
| Devon Energy Corporation (DVN) | 0 | 0.5736 | 0 | 0.5000 | 0 | 0.5407 |
| Coterra Energy, Inc. (CTRA) | 0 | 0.3866 | 0 | 0.5000 | 0 | 0.7395 |
| APA Corporation (APA) | 0 | 0.213 | 0 | 0.2457 | 0 | 0.9141 |
| Asset | Our Process vs. GBM | Our Process vs. sGBM |
|---|---|---|
| Chevron Corporation (CVX) | 0.0062 | 0.1217 |
| Conoco Phillips (COP) | 0.0036 | 0.1687 |
| EOG Resources, Inc. (EOG) | 0.0170 | 0.1656 |
| Williams Companies, Inc. (WMB) | 0.2063 | 0.0761 |
| Kinder Morgan, Inc. (KMI) | 0.1350 | 0.0496 |
| ONEOK, Inc. (OKE) | 0.2011 | 0.1346 |
| Schlumberger N.V. (SLB) | 0.0068 | 0.0791 |
| Diamondback Energy, Inc. (FANG) | 0.0001 | 0.0011 |
| Phillips 66 (PSX) | 0.0155 | 0.1070 |
| Occidental Petroleum Corporation (OXY) | 0.0006 | 0.0193 |
| Marathon Petroleum Corporation (MPC) | 0.0895 | 0.4491 |
| Baker Hughes Company (BKR) | 0.0923 | 0.5454 |
| Hess Corporation (HES) | 0.0265 | 0.5025 |
| Targa Resources, Inc. (TRGP) | 0.1550 | 0.0848 |
| Valero Energy Corporation (VLO) | 0.0296 | 0.2587 |
| EQT Corporation (EQT) | 0.1677 | 0.0223 |
| Texas Pacific Land Corporation (TPL) | 0.0003 | 0.0047 |
| Halliburton Company (HAL) | 0.0047 | 0.0907 |
| Devon Energy Corporation (DVN) | 0.0008 | 0.0203 |
| Coterra Energy, Inc. (CTRA) | 0.0005 | 0.0089 |
| APA Corporation (APA) | 0.1056 | 0.5400 |
| Statistics | Max. Variation | Min. Variation |
|---|---|---|
| RMSE | 0.1204 | 0.4721 |
| MAPE | 0.2145 | 0.8651 |
| IDX | 0.3945 | 0.3629 |
| 1. Let n be the length of the observed series . |
| 2. Consider a rolling window of fixed size weeks. |
| 3. Choose the predictive horizon . Start from . |
| 4. while |
| 5. Take the observations of , with . |
| 6. Calibrate the parameters of the selected model, as explained in Section 3.3. |
| 7. Compute the out of sample values through Formula (36) |
| 8. Compute the in of sample values through scheme (32) |
| (with substitutions (33) or (34) for the benchmarks). |
| 9. Update ; |
| 10. end |
Disclaimer/Publisher’s Note: The statements, opinions and data contained in all publications are solely those of the individual author(s) and contributor(s) and not of MDPI and/or the editor(s). MDPI and/or the editor(s) disclaim responsibility for any injury to people or property resulting from any ideas, methods, instructions or products referred to in the content. |
© 2025 by the authors. Licensee MDPI, Basel, Switzerland. This article is an open access article distributed under the terms and conditions of the Creative Commons Attribution (CC BY) license (https://creativecommons.org/licenses/by/4.0/).
Share and Cite
Bufalo, M.; Fanelli, V. Advanced Operator Theory for Energy Market Trading: A New Framework. Risks 2025, 13, 118. https://doi.org/10.3390/risks13070118
Bufalo M, Fanelli V. Advanced Operator Theory for Energy Market Trading: A New Framework. Risks. 2025; 13(7):118. https://doi.org/10.3390/risks13070118
Chicago/Turabian StyleBufalo, Michele, and Viviana Fanelli. 2025. "Advanced Operator Theory for Energy Market Trading: A New Framework" Risks 13, no. 7: 118. https://doi.org/10.3390/risks13070118
APA StyleBufalo, M., & Fanelli, V. (2025). Advanced Operator Theory for Energy Market Trading: A New Framework. Risks, 13(7), 118. https://doi.org/10.3390/risks13070118