1. Introduction
Research on the performance of cryptocurrency portfolios during adverse market periods has received great interest in academia and the investment world since the pre-coronavirus disease (pre-COVID) period (see
Petukhina et al. 2021;
Jalal et al. 2025). However, cryptocurrencies are inherently risky (
Smutny et al. 2021), and losses emanating from cryptocurrencies are likely to affect South Africa’s growth, production, and employment, especially when banks invest in these assets. In addition, most research has concentrated solely on Bitcoin (see
Farell 2015;
Gallersdörfer et al. 2020). Although there is a lack of studies on the impact of adding cryptocurrencies to bank equity portfolios in South Africa, there is a high expectation that many investors and portfolio managers may want to explore adding cryptocurrencies to their portfolios due to their perceived diversification role as observed in other emerging economies (
Letho et al. 2022). In emerging markets such as South Africa, where banks play a critical role in economic development through credit provision to both large businesses and small, medium, and micro enterprises (SMMEs) and financial intermediation (
Sibande et al. 2025), understanding the implications of cryptocurrency exposure within bank equity portfolios becomes imperative since with increased losses, the banks’ ability to extend credit will be curtailed. As South Africa strives to meet its inclusive growth targets outlined in the National Development Plan 2030 (
National Planning Commission 2013), assessing the risk–return tradeoffs of incorporating cryptocurrencies into bank portfolios takes on added socio-economic relevance.
Despite the expanding body of literature on the diversification role of cryptocurrencies, a notable gap remains regarding how cryptocurrencies interact with traditional bank equities within the South African context, especially under varying market conditions. Most existing research overlooks the unique structural features of South African financial markets, as well as the regulatory, economic, and institutional frameworks that may influence portfolio dynamics. Moreover, while various optimization techniques have been employed in the literature, ranging from mean–variance optimization (MVO) models to advanced algorithms such as particle swarm optimization (PSO), their influence on constructing diversified portfolios that include cryptocurrencies and local bank stocks remains limited. The few studies that explore portfolio performance often ignore important metrics, such as return streaks, or unrealistically assume that returns are normally distributed, which may not hold during periods of market turmoil when extreme returns are more probable (
Kozlowski et al. 2019;
Harris et al. 2015).
This study aims to fill these research gaps by evaluating the performance of diversified portfolios composed of South African bank equities and major cryptocurrencies using optimization techniques of PSO and random optimization. The results from these techniques are then compared with those from the equal-weighted portfolio and the traditional mean–variance optimization (MVO) model. By incorporating constraints to ensure diversification and by analyzing return streaks, this research goes beyond conventional risk–return metrics to provide a more nuanced understanding of portfolio behavior in both calm and crisis market conditions. This study also interrogates the implications of asset correlation and how this may present opportunities or risks for investors seeking to hedge against extreme market downturns.
Key findings suggest that while bank stocks and cryptocurrencies exhibit high intra-group correlations, their intergroup correlations remain low, creating the potential for diversification. Cryptocurrencies tend to move contrary to the JSE index, offering hedge opportunities during crises, whereas bank stocks align closely with the overall market. Notably, PSO-optimized portfolios demonstrated superior diversification and were better at capturing variations in risk across different market conditions compared with random optimization. While adding cryptocurrencies marginally enhances portfolio diversification, it also increases overall risk. In contrast, combining bank stocks with limited cryptocurrency exposure improved Sharpe ratios and offered better risk-adjusted returns. Furthermore, streak analysis highlighted that asset performance changes over time, with the optimal portfolio composition varying across market conditions. These findings hold important implications for institutional and retail investors, as well as for policymakers interested in understanding the challenges and opportunities posed by merging cryptocurrencies with other asset classes in developing financial markets.
2. Literature Review
According to the Financial Sector Conduct Authority (
FSCA 2022), the South African financial sector stands out among emerging markets as one of the most developed, characterized by a robust asset-to-GDP ratio and the dominance of a few major banks. ABSA, FNB, Nedbank, and Standard Bank collectively hold a commanding share of bank deposits, illustrating a strong but concentrated financial sector (
FSCA 2022). Based on recent economic data from Statistics South Africa (STATSSA), the sector’s contribution to national output has grown, with finance being a top contributor to GDP since 2016 and accounting for around 20% of GDP growth in Q2 2023 (
STATSSA 2023). This economic strength is paralleled by the increasing attention given to alternative financial instruments, particularly cryptocurrencies, which, according to
Letho et al. (
2022) and
Jiang et al. (
2022), have attracted increased global attention for both their volatility and diversification potential. Cryptocurrencies, despite being relatively new financial assets, have significantly disrupted traditional asset markets and sparked intense interest among regulators, investors, and academics (
Petukhina et al. 2021;
Jalal et al. 2025). Globally, the cryptocurrency market has experienced massive growth, reaching a peak capitalization of USD 2.5 trillion in 2021 (
IMF 2021). In South Africa, the market is still in its infancy, with approximately 12 trading platforms and daily trading volumes fluctuating between USD 16 million and USD 133 million, according to the National Treasury of South Africa (hereafter,
National Treasury of South Africa IFWG CAR-WG 2021). This nascent market presents both opportunities and risks, particularly given the high volatility and speculative nature of crypto assets (
PBO 2021). These concerns have led to the development of regulatory frameworks aimed at mitigating potential threats to financial stability (
National Treasury of South Africa IFWG CAR-WG 2021) while simultaneously recognizing the transformative potential of cryptocurrencies in diversified portfolios.
Most of the studies on cryptocurrency portfolio performance (such as
Kumar and Bhatia 2020;
Saydar and Bedir 2021) and bank stock portfolio performance (such as
Letho et al. 2022;
Ma et al. 2020;
Youssef et al. 2023;
Mills and Zeng 2021) have been based on the Sharpe ratio as the performance measurement. The Sharpe ratio measure of portfolio performance, however, assumes a normal distribution of returns. Nevertheless, many studies that have analyzed bank stocks (such as
Mohsin et al. 2020;
Herbert and Agwor 2021) have concluded that bank stock returns deviate from a normal distribution. Likewise, cryptocurrency returns have been found to follow a non-normal distribution (
Bouri et al. 2021). Therefore, we compare the results of the Sharpe ratio to those derived from the adjusted Sharpe ratio, which incorporates higher moments of the empirical returns distribution, that is, skewness and kurtosis, and thus relaxes the strict assumption of a normal distribution where skewness and excess kurtosis are assumed to be zero. Thus, measures that ignore this phenomenon in these data may present higher Sharpe ratios, as found by
Mercurio et al. (
2020), thereby implying superior risk-adjusted portfolio performance, which may be erroneous.
In addition, the portfolio performance of financial assets, such as cryptocurrencies and financial stocks, has been widely analyzed using the naïve EWP method (
Ang et al. 2020;
Rueda et al. 2021) because it is easy to compute since no optimization is required (
Ma et al. 2020). However, the EWP method ignores investor risk aversion (
Davis and Lleo 2016). Moreover,
Fernandes et al. (
2021), using stock data from 72 publicly listed European banks, found that the higher risk taken by institutional investors in the pre-COVID-19 period culminated in higher risk in the post-COVID-19 period, which may explain the increase in risk aversion found by
Bäckman et al. (
2020), in the post-COVID-19 period. Increased risk aversion has also been observed in cryptocurrencies (
Dabbous et al. 2022). The increased risk aversion was also found to be associated with changes in portfolio allocation (
Guiso et al. 2018). PSO and random optimization methods were found to be effective in the presence of a complex dependency structure among assets. Therefore, in addition to the EWP, we apply the particle swarm optimization (PSO) method that, according to
Thakkar and Chaudhari (
2021), tends to achieve a quick optimal solution and can account for asset risk in the portfolio. We then compare the PSO results to those of a random portfolio because of the popularity of both of these methods and their ability to apply realistic dynamic optimization. The traditional MVO method has also been widely used, but according to
Ziane et al. (
2024), MVO makes a restrictive assumption of normally distributed returns. This assumption may result in an underestimation of risk since the extreme returns are captured by the tails of the distribution, and a normal distribution has very thin tails. Thus, the normal distribution ignores the presence of extreme returns in these data. MVO is used to compare portfolio performance, but it is not applied in other analyses since it is a one-period optimization method, and the focus of this study is dynamic portfolio analysis.
Furthermore, most of the studies have focused on one cryptocurrency (
Shaik et al. 2023) or one sector (
Su and Kao 2022). However, limited assets or asset classes may imply that portfolios are not well diversified. We deviate from this approach by using six bank stocks and five cryptocurrencies. These assets have not been chosen arbitrarily. Instead, the financial sector is the biggest sector of the South African economy (
World Bank 2022). Cryptocurrencies, on the other hand, were only recently recognized as financial products in South Africa by the Financial Sector Conduct Authority (
FSCA 2022), and we expect a greater amount of interest from investors as they consider adding cryptocurrencies to their portfolios because of their perceived diversification role. In addition to using less correlated assets in the portfolio, asset selection may also be based on streak analysis. Although the aspect of streak analysis that is based on streak theory (see
Rabin 2002) has received limited attention in the literature, it may be used to decide which assets to add to the portfolio. In a realistic setup where investment capital is often a scarce resource (see
Keynes 1936), investors may desire a limited combination of assets, thereby selecting assets with different streaks. For example, short-term investors may select assets with positive streaks, and long-term investors may select assets with negative streaks but where a price reversal is imminent to gain from buying low and selling high (see
Klos et al. 2023).
Although most of the studies analyzing cryptocurrencies were based on periods between the post-global financial crisis (post-GFC) and the pre-COVID-19 period (
Kostika and Laopodis 2020;
Allen 2022), this period lacked a major financial crisis. However, crises have the potential to create very large losses, which in turn may wipe out entire portfolios (
Kurznack et al. 2021). In addition, correlations in financial assets such as equity have increased in the post-COVID-19 period (
Balcilar et al. 2022). This is because financial data are often dependent on historical events since current conditions rely on the past (
Dewick and Liu 2022). In addition to facilitating the acquisition of reliable risk measures (
Phadkantha et al. 2019), correlations can be used to diversify portfolios by including fewer correlated assets (
Koumou 2020), and cryptocurrencies and financial assets have been found to have low correlations (
Allen 2022). In the pre-COVID-19 period, bank stocks faced downward pressures during financial crises, and cryptocurrencies provided diversification benefits during this period (
Schmitz and Hoffmann 2020). Thus, investors may consider adding cryptocurrencies to bank equity to achieve more diversified portfolios. However, only through a dynamic portfolio analysis can we examine how long the diversification role lasts. In this study, we seek to further determine how the diversification role of cryptocurrencies has differed in the pre- and post-COVID-19 periods. The choices of cryptocurrencies used here include some of the most popular. For South Africa, Bitcoin has been the most popular, although trading in cryptocurrencies is relatively new (
Greeff 2019), and only recently has the treasury released a regulatory document for cryptocurrencies (
National Treasury of South Africa IFWG CAR-WG 2021).
To enhance portfolio construction methods, this study incorporates both traditional and modern optimization strategies. While the equal-weighted portfolio (EWP) is easy to compute and popular among researchers (
Ang et al. 2020;
Rueda et al. 2021), it ignores investor risk preferences (
Davis and Lleo 2016). Recent developments have shown the effectiveness of advanced methods such as particle swarm optimization (PSO), which offers quick convergence and adaptability to complex asset structures (
Thakkar and Chaudhari 2021). Random portfolio is also employed for comparison because of its computational simplicity, where weights are simply randomly generated (see
Wang et al. 2024). Although the mean–variance optimization (MVO) model has been widely used, its reliance on normally distributed returns limits its application in volatile markets (
Ziane et al. 2024). By integrating PSO and random optimization, this study provides a more realistic assessment of portfolio risk and return dynamics in the South African context.
The primary objective of this study is to evaluate the comparative performance and diversification potential of cryptocurrency and bank equity portfolios in South Africa. In doing so, it aims to address methodological shortcomings in prior studies by utilizing dynamic optimization techniques and performance metrics that account for higher moments of return distributions. Special focus is given to the comparison between the pre- and post-COVID-19 periods to assess whether the perceived diversification benefits of cryptocurrencies have changed over time. This study seeks to understand how portfolio performance varies under different asset combinations and optimization strategies and whether including cryptocurrencies improves portfolio robustness against financial market shocks. To determine how the portfolios perform in different market conditions, we further extend the analysis by comparing the performance of cryptocurrency and bank equity portfolios to the performance of the FTSE/JSE ALSI index. The Johannesburg Securities Exchange (JSE) is South Africa’s (and Africa’s) largest stock exchange and the 19th largest in the world, according to the South African Revenue Service (
SARS 2022). According to the monthly statistics, the FTSE/JSE ALSI index comprises 99% of the JSE (
Lawrence et al. 2024).
This research contributes to both the academic literature and practical investment strategies in several ways. First, it expands the scope of portfolio performance evaluation by including multiple cryptocurrencies and bank stocks rather than limiting the analysis to a single asset or sector (
Shaik et al. 2023;
Su and Kao 2022). Second, it provides a much-needed South African perspective, where the financial sector is not only dominant but also undergoing rapid digital transformation (
World Bank 2022;
FSCA 2022). Third, the inclusion of streak analysis offers a novel angle for asset selection (
Rabin 2002;
Klos et al. 2023). Last, this study informs policymakers and financial institutions about the implications of integrating cryptocurrencies into bank stock portfolios, thereby aiding in the design of balanced regulatory and investment frameworks in an era of digital finance.
The remainder of the paper is structured as follows:
Section 3 and
Section 4 describe the methodology, data used, and empirical findings, while in
Section 5 and
Section 6, we present the discussion and conclusion, respectively.
3. Methodology
Zhu et al. (
2011) suggest that in the presence of a non-linear constrained optimization problem, popular meta-heuristic optimization techniques such as particle swarm optimization (PSO) would be more efficient compared with traditional approaches such as mean–variance optimization when constructing optimal risky portfolios. In the PSO, asset weight allocation is carried out using the multi-objective and multi-constrained PSO to arrive at the optimally diversified portfolio, where portfolio risk is minimized, and return is maximized. Where the Sharpe ratio (
) measures portfolio performance, the optimal diversified portfolio is the one that maximizes the Sharpe ratio. The annualized Sharpe ratio is described in Equation (1) as:
where
is the mean of portfolio returns,
is the risk-free rate of return, and
is the standard deviation of
and the measure of portfolio risk. Therefore, the Sharpe ratio represents a tradeoff between investor objectives of maximizing expected returns and minimizing risk. Asset weights (
) are then selected by the optimizer to achieve these objectives.
However, if portfolio returns (
) deviate from a normal distribution, the adjusted Sharpe ratio (
) which incorporates skewness and kurtosis in the return’s distribution, would be a better measure of portfolio performance (
Mistry and Shah 2013) and
is given in Equation (2) as:
where
is the annualized Sharpe ratio,
is the skewness, and
is the kurtosis. Skewness and kurtosis are used to indicate deviation from a normal distribution, where
and excess kurtosis,
assumptions must hold.
In this study, the four approaches used for portfolio optimization and comparing portfolio performance are PSO, random, EWP, and MVO. The first two approaches require complex optimizers. Whereas the traditional MVO method is also used, it is based on the unrealistic assumption of normally distributed returns, which ignores the presence of extreme returns in the tails of the distribution. MVO is also a single-period optimization method, and thus, its application in this study is limited to portfolio performance comparison. EWP does not require any optimizer, and instead, a simple method of allocating the same asset weights is used. For the EWP, in the presence of
assets in the portfolio, each asset in the EWP carries the same weight given in (3) as:
3.1. Particle Swarm Optimization
Particle swarm optimization (hereafter, PSO), discussed and presented here briefly (see
Zhu et al. (
2011) for a detailed discussion), is one of the meta-heuristic optimization techniques. The PSO algorithm has starting values, each with position and velocity. Each particle in PSO advances towards its best position (pbest) or its fitness value and those around it towards their global best positions (gbest). With the initial positions (
) and initial velocities (
), the gap between pbest and the initial position is thus
and the gap between gbest and the initial position is given as
. These positions are updated at each iteration, and the new position of particle
is given as:
where
is the particles
’s position and
is particle
’s velocity relative to dimension
at iteration
.
For our constrained risky portfolio with the objective given in Equation (5) and constraints given in Equations (6) and (7) below, the objective function in
Zhu et al. (
2011) is thus given as:
where
is the number of assets,
is the covariance between assets
and
’s returns,
is the weight of each asset in the portfolio,
is the mean return of asset
, (6) represents full investment, and (7) prevents short selling. The ultimate objective is to find asset weight combinations (
) for each quarter that provides the maximum Sharpe ratio given in Equation (5). Equations (5)–(7) are used to determine the pbest and gbest of the particles.
3.2. Random Optimization
The simplex method for generating random portfolios presented by
Peterson et al. (
2015) assumes full investment (or
), box, group, and position constraints, where the latter three help to avoid concentrated portfolios. Thus, the allocated weights result in more diversified portfolios. To create random portfolios, we begin by generating uniform random numbers,
. The portfolio weights (
) are then changed to satisfy the min of the box constraints in Equation (8).
where
in Equation (9) controls Face-Edge-Vertex (FEV) biasing such that,
It can be observed that as approaches infinity, the set of weights will tend to be concentrated in one asset. A vector of fev can be utilized to sample the interior and exterior. The number of portfolios, permutations, and the length of fev affect how the random portfolios are generated. The higher the permutations and fev, the higher the number of portfolios generated for each value of fev.
3.3. Mean–Variance Optimization (MVO)
The MVO portfolio of
Markowitz (
1952) is a traditional portfolio optimization technique and one of the most widely used (see
Stoyanova and Guliashki 2020). Given a portfolio of
n assets with mean returns,
and a covariance matrix,
between assets
and
, the portfolio mean return and variance or risk are given as
and
, respectively. The objective and constraints of the MVO portfolio, which has weights
, are shown in (10) below (see
Emmanuel et al. 2025):
where the first set represents the objective function, and the second set represents the full investment and long-only constraints. The objective and constraints are then combined in the Lagrange multiplier,
in (11) and solved analytically for the portfolio optimal weights (
).
After constructing the portfolio, the portfolio performance of the MVO portfolio can then be calculated using the Sharpe ratio in (1).
3.4. Streak Analysis and Asset Selection
Streaks are computed from a generic function provided by
Schumann (
2023) that computes uninterrupted up and down movements (streaks) in returns series, where uninterrupted implies that no countermovement of (up) down percent or more occurs in up (down) movements and where the vertical scale (streaks percent) is a log scale where a drop of 50% takes the same vertical distance as a rise of 100%. These streaks show when up and down movements started and ended. We are able to ascertain which combination of cryptocurrencies and bank stocks will yield better portfolio performance in the post-COVID-19 period if investors desire a limited number of assets in their portfolio by choosing assets that have smaller downward streaks among the assets streaking downwards. Subsequently, over the short term, for the highest portfolio return, the best asset combination will involve only assets that are streaking upwards. Over the long term, investors may pick downward-streaking stocks in anticipation of gaining from an imminent price reversal (see
Klos et al. 2023).
4. Empirical Findings
The analysis of the performance of the cryptocurrency and bank equity portfolio is performed using a multi-asset particle swarm optimizer (MA-PSO). The results are then compared with the random optimizer where we have utilized these log-returns data of the Johannesburg securities exchange’s all-share index (JSE ALSI) as the benchmark index, six bank stocks including ABSA, Capitec Bank, First National Bank (FNB), Nedbank, Standard Bank, and Investec, and five cryptocurrencies including Bitcoin (BTC), Dogecoin (DOGE), Ethereum (ETH), Monero (XMR), and Ripple (XRP).
We present the main results of the performance and streak analysis in a period that includes the coronavirus disease (COVID-19) crisis. We also compare portfolio diversification measures that have been applied extensively in the literature, which include the portfolio diversification index (PDI), diversification ratio (DR), diversification delta (DD), and diversification delta star (DD*) (see
Berouaga et al. 2023;
Vermorken et al. 2012). PDI values range from 1 to
(number of assets), where 1 indicates an undiversified portfolio, and
represents a totally diversified portfolio. DD and DD* values range between 0 and 1, where 1 indicates a perfectly diversified portfolio. Higher PDI, DR, DD, and DD* values indicate better diversified portfolios. DD* incorporates higher moments into DD. The PDI, DD, DD*, and DR measures are applied through the DiversificationR
package and assume EWP portfolios. JSE, ALSI, and bank stock data are obtained from I-Net BFA, and cryptocurrency data are obtained from Yahoo Finance. All data consist of 1694 observations of daily closing prices from 9 November 2017 to 22 August 2024. We calculate the log-returns of daily closing prices using
where
is the stock price of the financial asset
i at time,
.
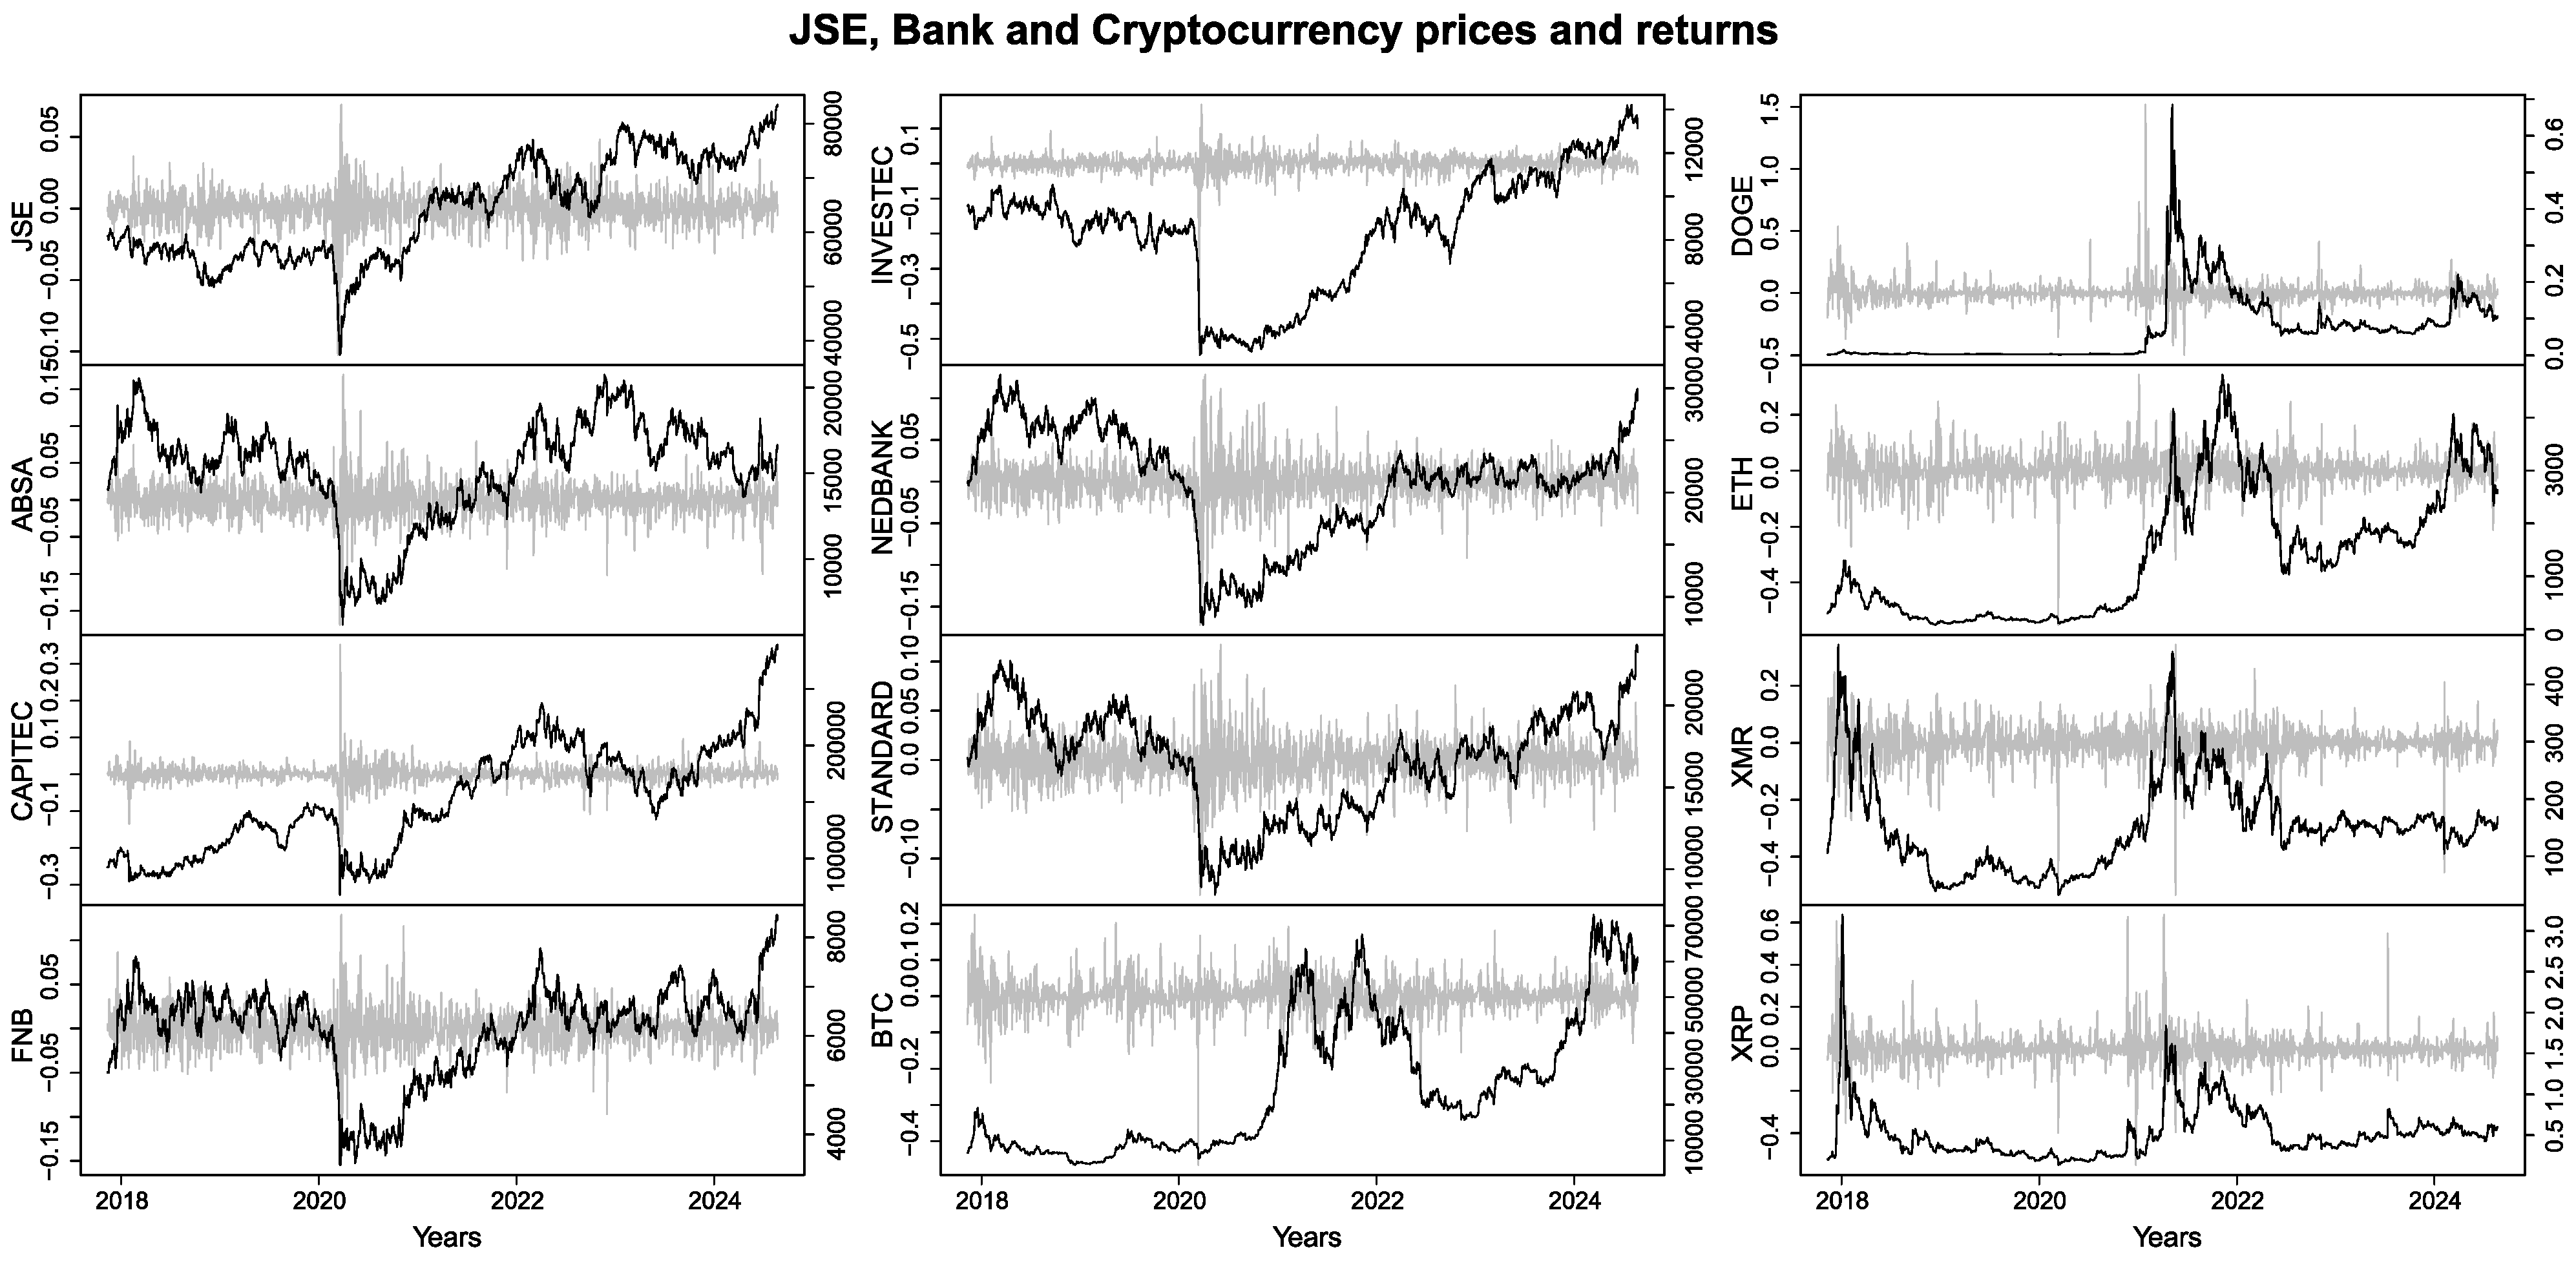
Asset prices in
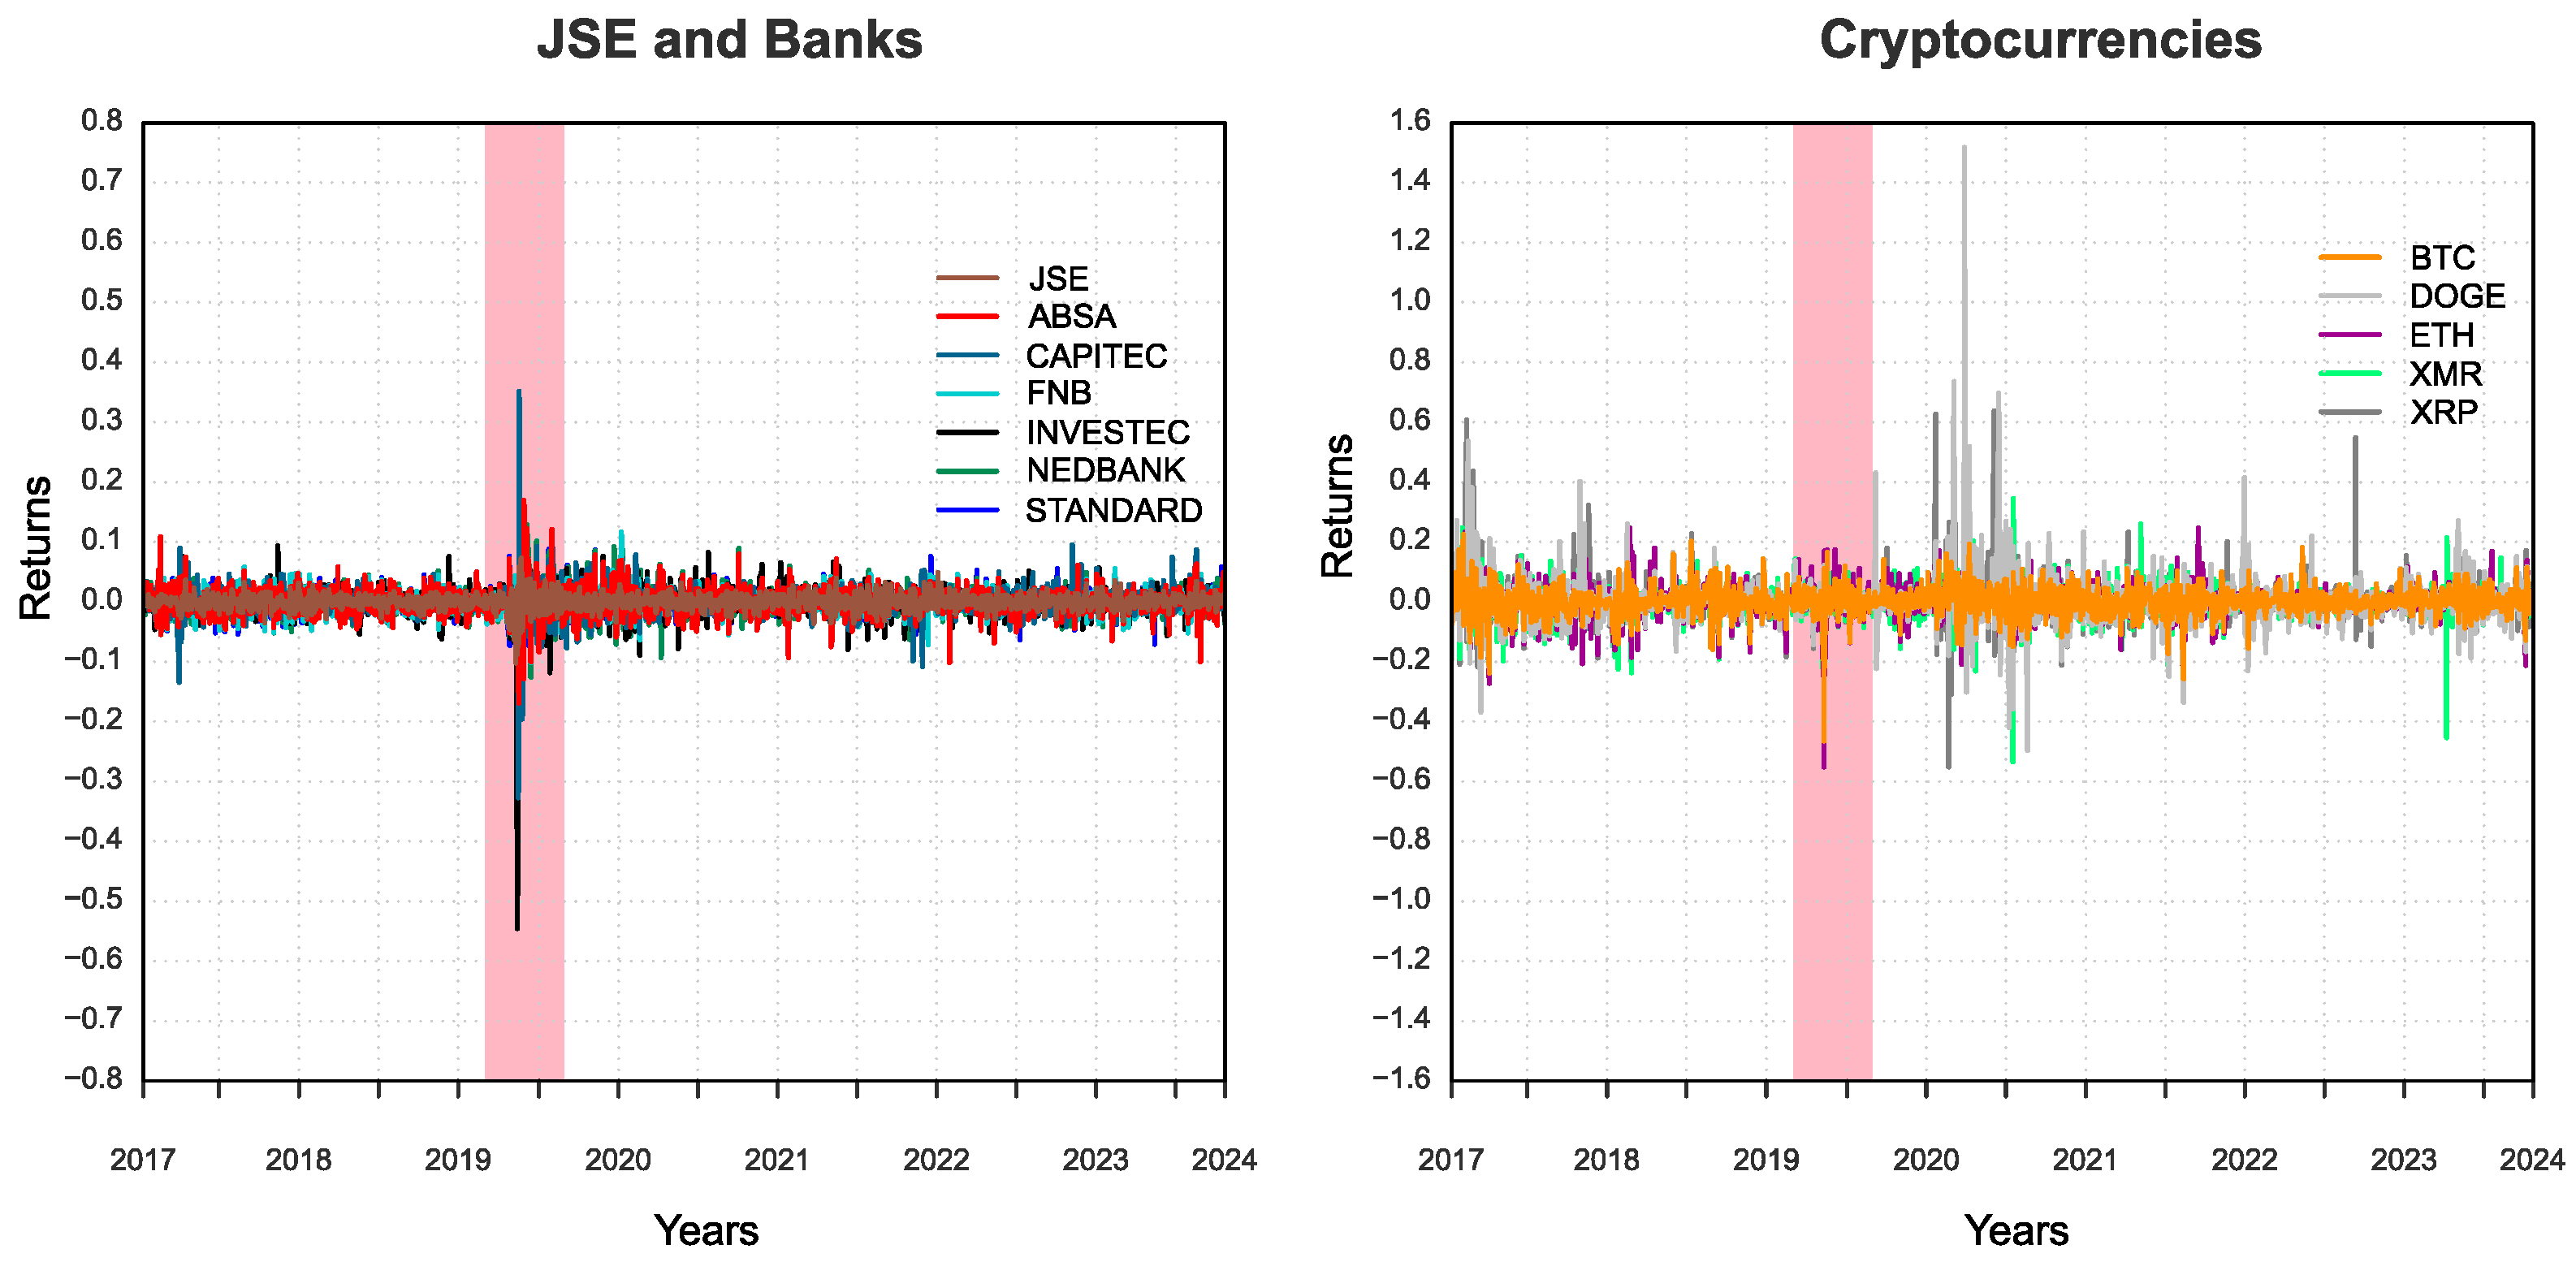
Figure A1 show trends in these data, an indication of a non-stationary series, and therefore, we extract non-trending asset returns data for the analysis. Line plots of asset prices and returns show that assets of the same category co-move and are highly volatile, albeit with more volatility in the cryptocurrency category. Whereas all returns data for banks and cryptocurrencies in
Figure 1 show higher volatility during the first six months of 2020 when the COVID-19 crisis was at its peak, cryptocurrencies show much higher volatility in calmer periods both preceding and after the January 2020 to June 2020 crisis period.
Preliminary results of the descriptive statistics for daily log-returns data of the JSE index, cryptocurrencies, and bank stocks given in
Table 1 below deviate from the normal distribution where zero skewness and zero excess kurtosis are assumed. Except for Dogecoin and Ripple, which are positively skewed, the rest of these data are negatively skewed. Also, excess kurtosis differs from zero. Therefore, the Sharpe ratio performance measure would be inadequate, and the adjusted Sharpe ratio would be a better measure of portfolio performance. In addition, standard deviation statistics show that cryptocurrencies are more volatile than bank stocks.
The Ljung–Box test results for autocorrelation in
Table 2 show that the null hypothesis of no autocorrelation is rejected for all asset returns since
p < 0.05. Additionally, all assets fail the normality test since the Jarque–Bera test results show that the null hypothesis of normally distributed returns is rejected.
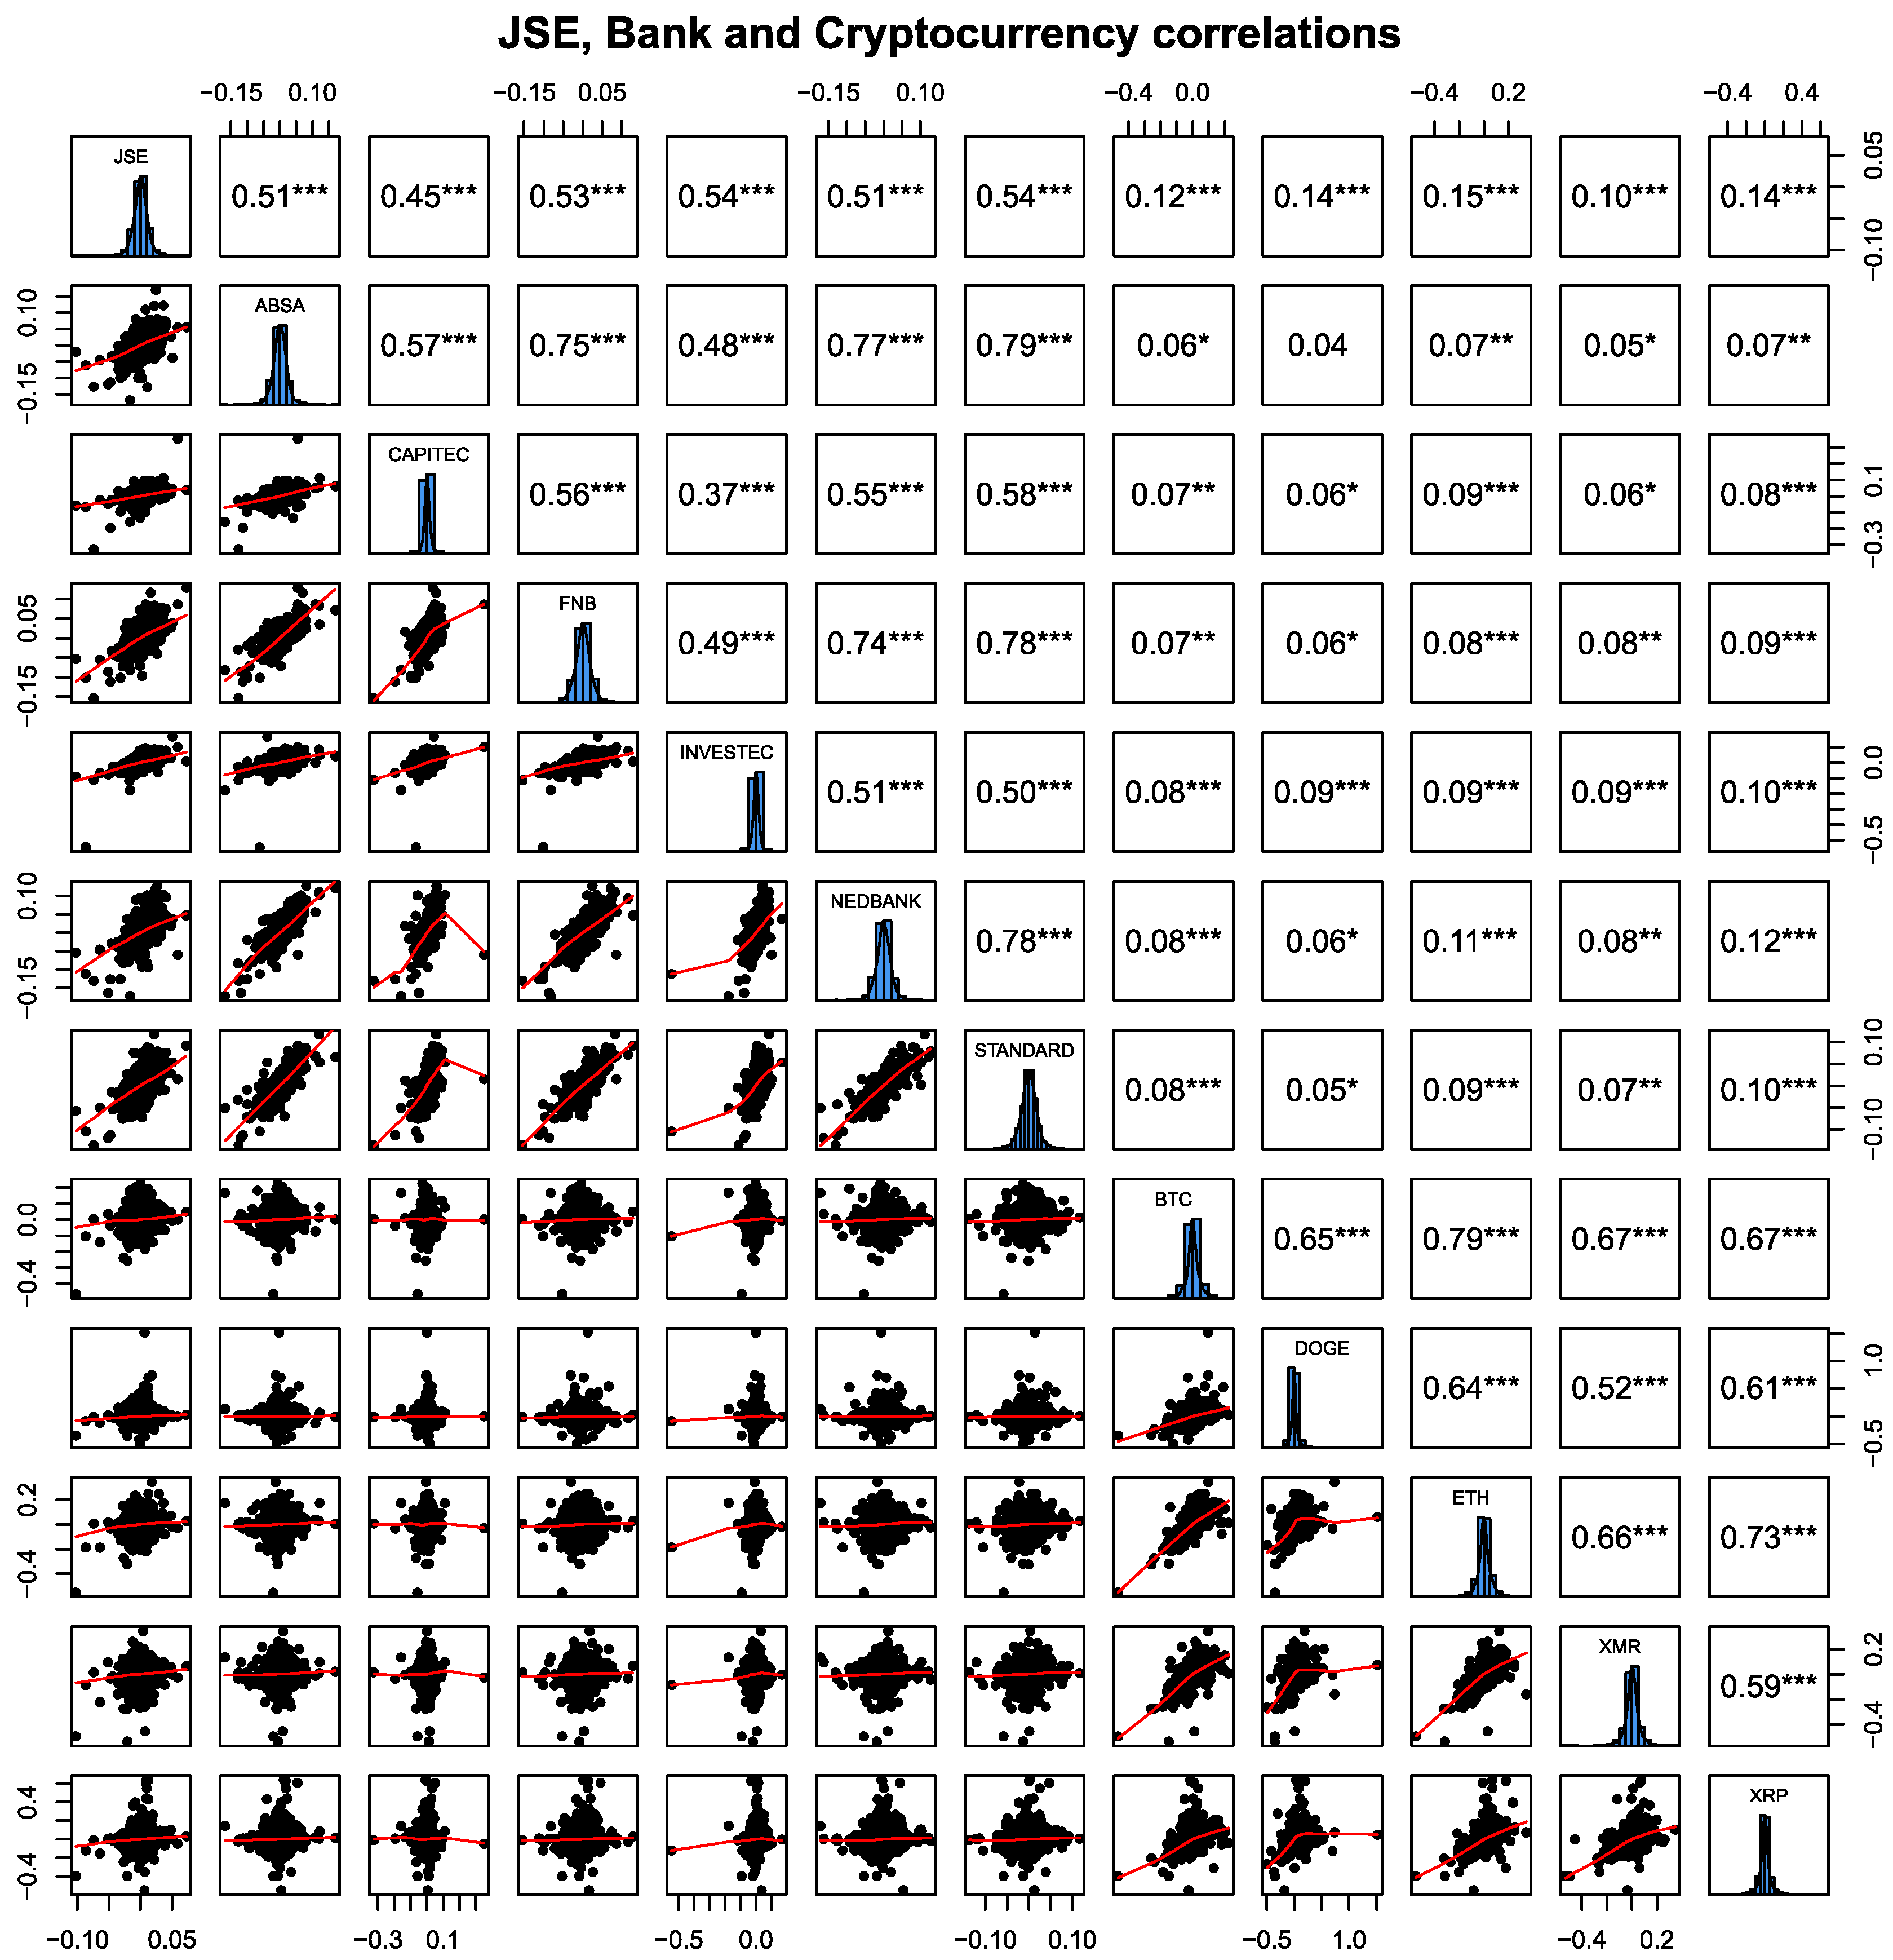
Asset return correlations in
Figure 2 show that assets in the same sector have higher correlations and, thus, tend to co-move. For example, most bank stocks have correlations exceeding 0.5, and all pairs of the four biggest banks in South Africa, namely Standard Bank, ABSA, Nedbank, and FNB, have positive correlations exceeding 0.75. This indicates that it may be difficult to offset losses in one bank stock with a gain in another bank stock. Cryptocurrency pairs also have high positive correlations exceeding 0.72. However, for pairs between banks and cryptocurrencies, all assets exhibit very low correlations. For diversification purposes, cryptocurrencies would thus appear to be good assets to add to the portfolio, as observed in previous studies (see
Ma et al. 2020;
Damianov and Elsayed 2020;
Trimborn et al. 2020). However, these correlations are averages from the entire period of this study, and during crisis periods, these correlations may increase. Moreover, some studies have found that cryptocurrencies increase portfolio volatility (
Białkowski 2020). Therefore, portfolio managers need to assess the risk tolerance of clients because these assets are inherently volatile, even in calm market conditions.
For portfolio analysis, we have used the asset weights for each quarter (approximately 63 days) in the rebalanced portfolio, with the analysis period having approximately 26 quarters. These weights differ from quarter to quarter, thereby rendering this approach more realistic when compared with equal asset weights.
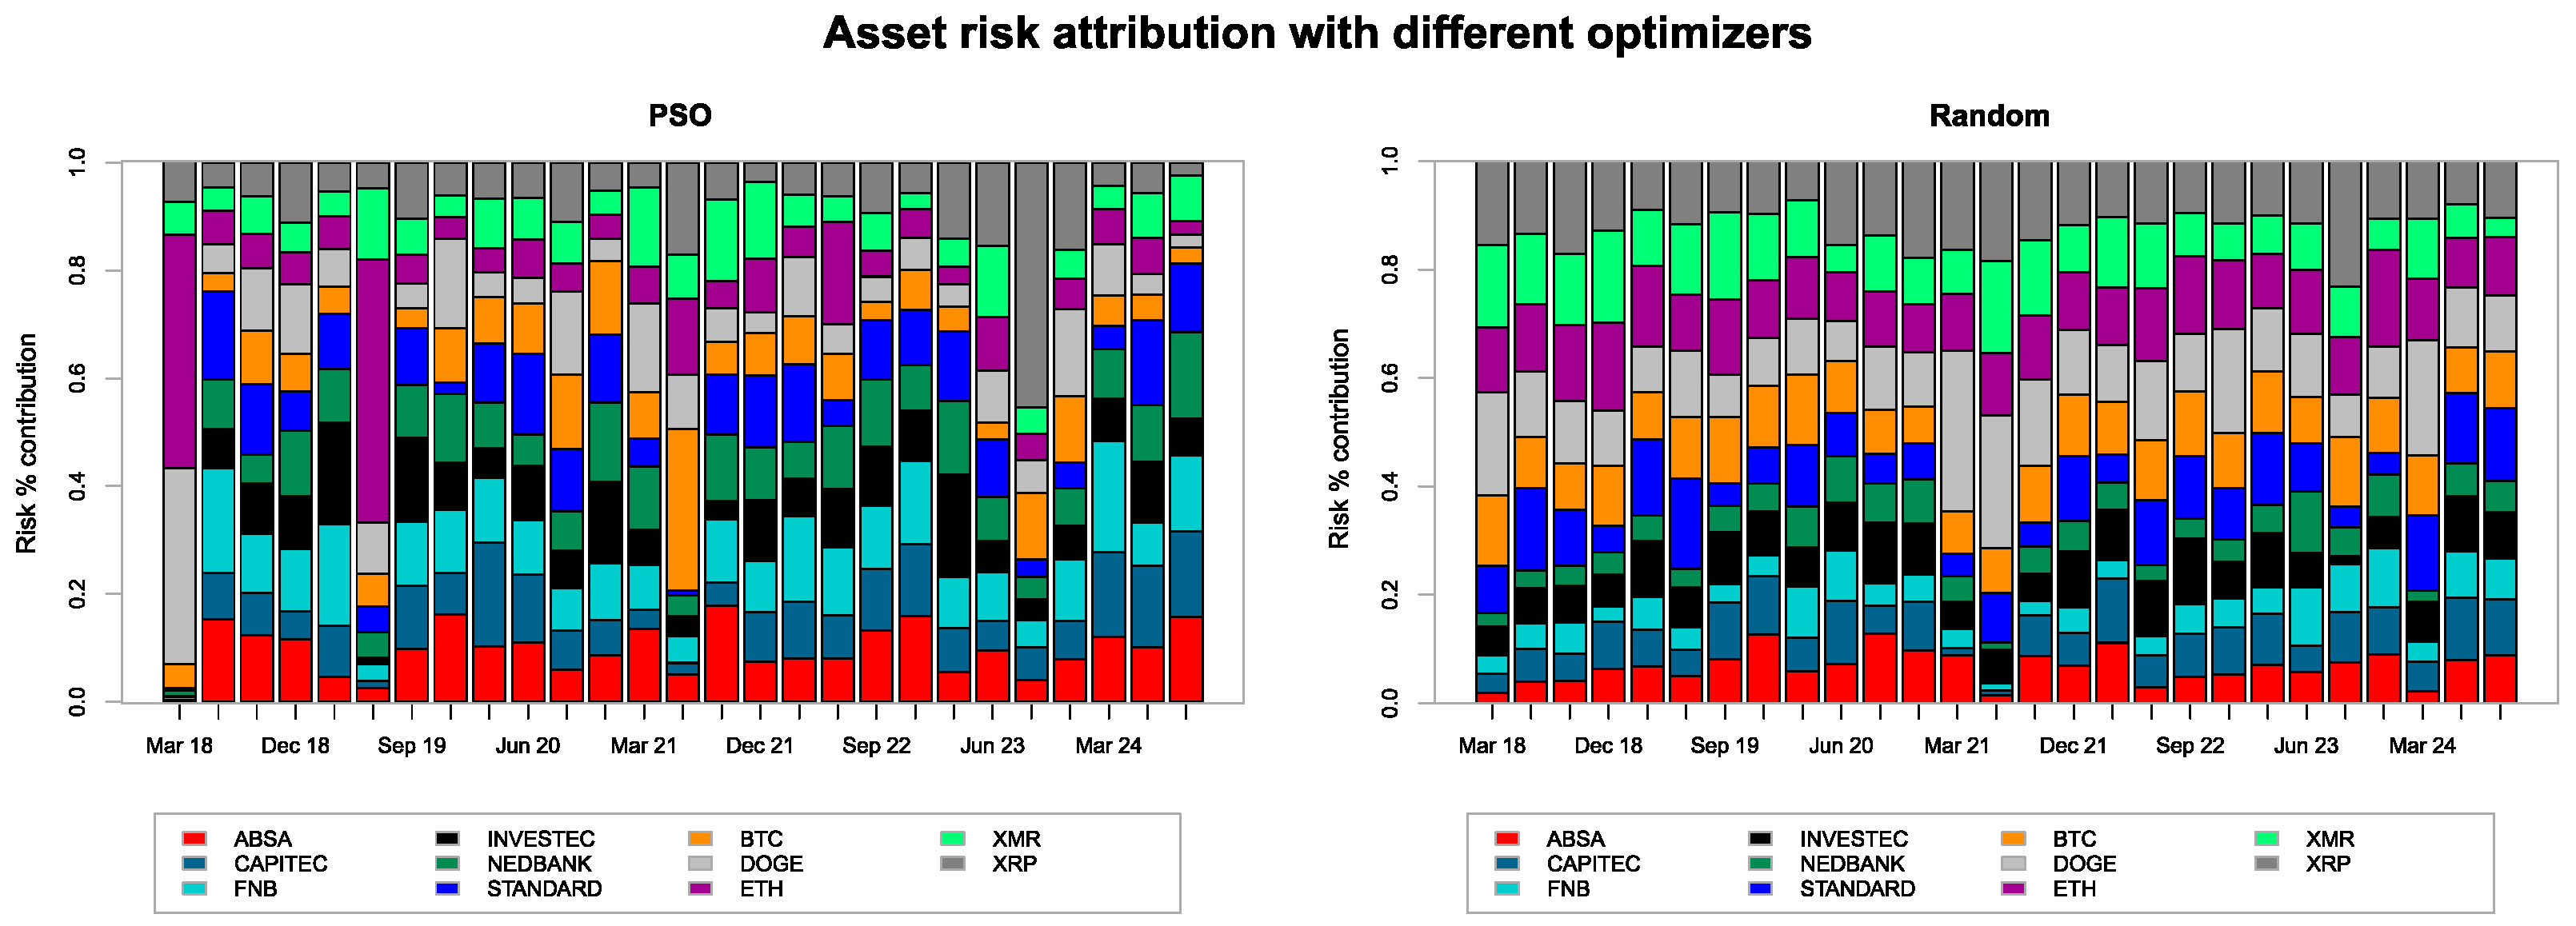
The objective of minimizing risk and maximizing the return of the portfolio, or portfolio optimization, involves the selection of asset weights that result in the highest risk-adjusted return as measured by the Sharpe ratio. The weights shown in
Figure 3 show that cryptocurrencies tend to be allocated more weight during the crisis period of January 2020 to June 2020 and less weight in the calmer market periods. This is an indication that during a short crisis period, cryptocurrencies will boost portfolio performance if added to the portfolio. In addition, compared with the random optimizer, the PSO optimizer appears to allocate more weight to cryptocurrencies when compared with the random optimizer. This means that portfolios where the PSO optimizer is used are more diversified.
Figure 4 shows that compared with bank stocks, cryptocurrencies contributed more towards the portfolio risk during calm market conditions and less risk compared with bank stocks during the first six months of 2020. As observed by
Corbet et al. (
2018), this shows that cryptocurrencies are good additions for diversification in the portfolio during a short crisis period. This aspect is captured more prominently by the PSO optimizer than the random optimizer.
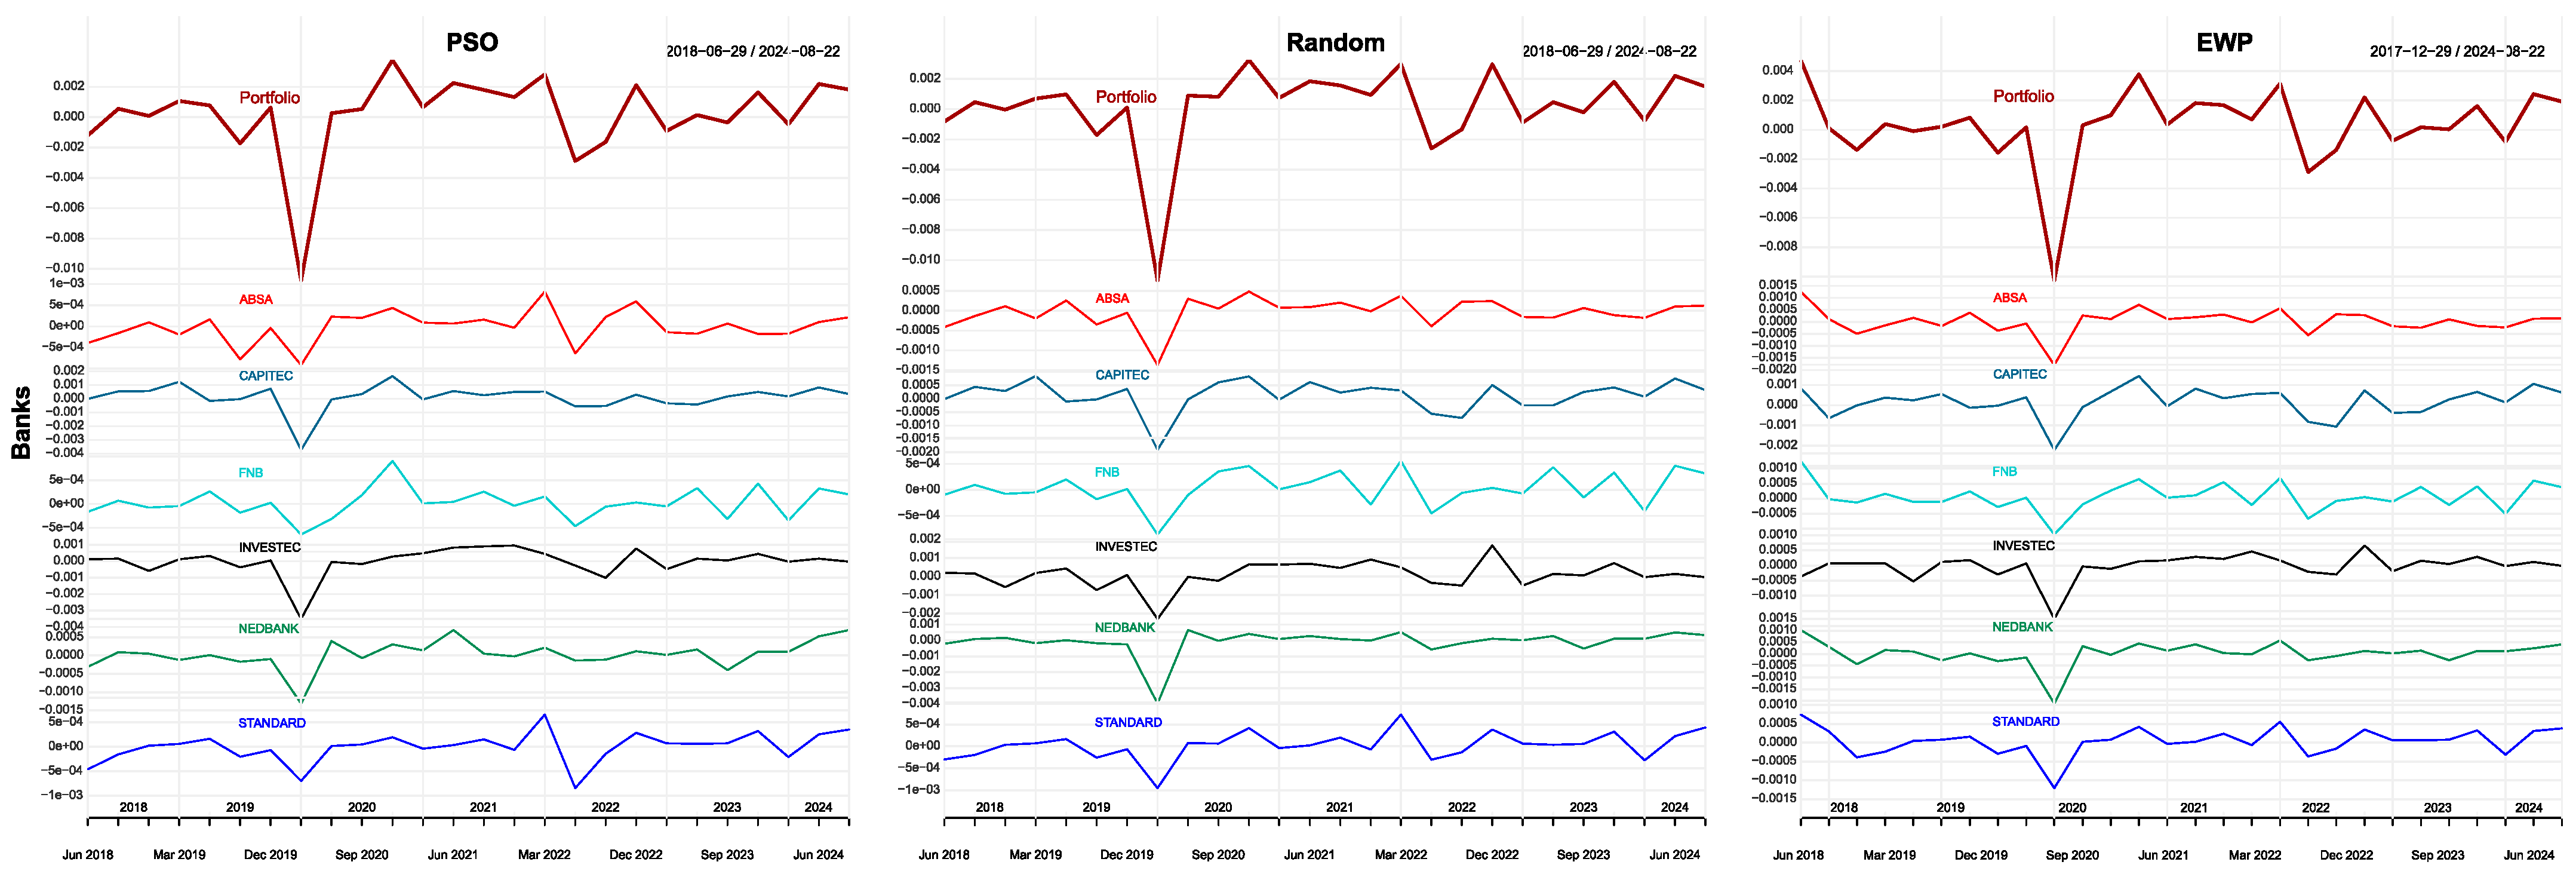
Asset return contributions to the portfolio, on the other hand, are shown in
Figure 5,
Figure 6 and
Figure 7 for bank-only, cryptocurrency-only, and a combination of bank stock and cryptocurrency portfolios. In the bank stock-only portfolio in
Figure 5, the PSO, random, and EWP methods show that during the major crisis of 2020, the biggest contributors to portfolio losses were Investec, Capitec Bank, Nedbank, Standard Bank, and the smallest contributors to portfolio losses were FNB and ABSA for all optimizers. Higher portfolio gains and losses were captured by PSO and random optimizers compared with the EWP. In the periods beyond the 2020 crisis, the performance of all optimizers was identical.
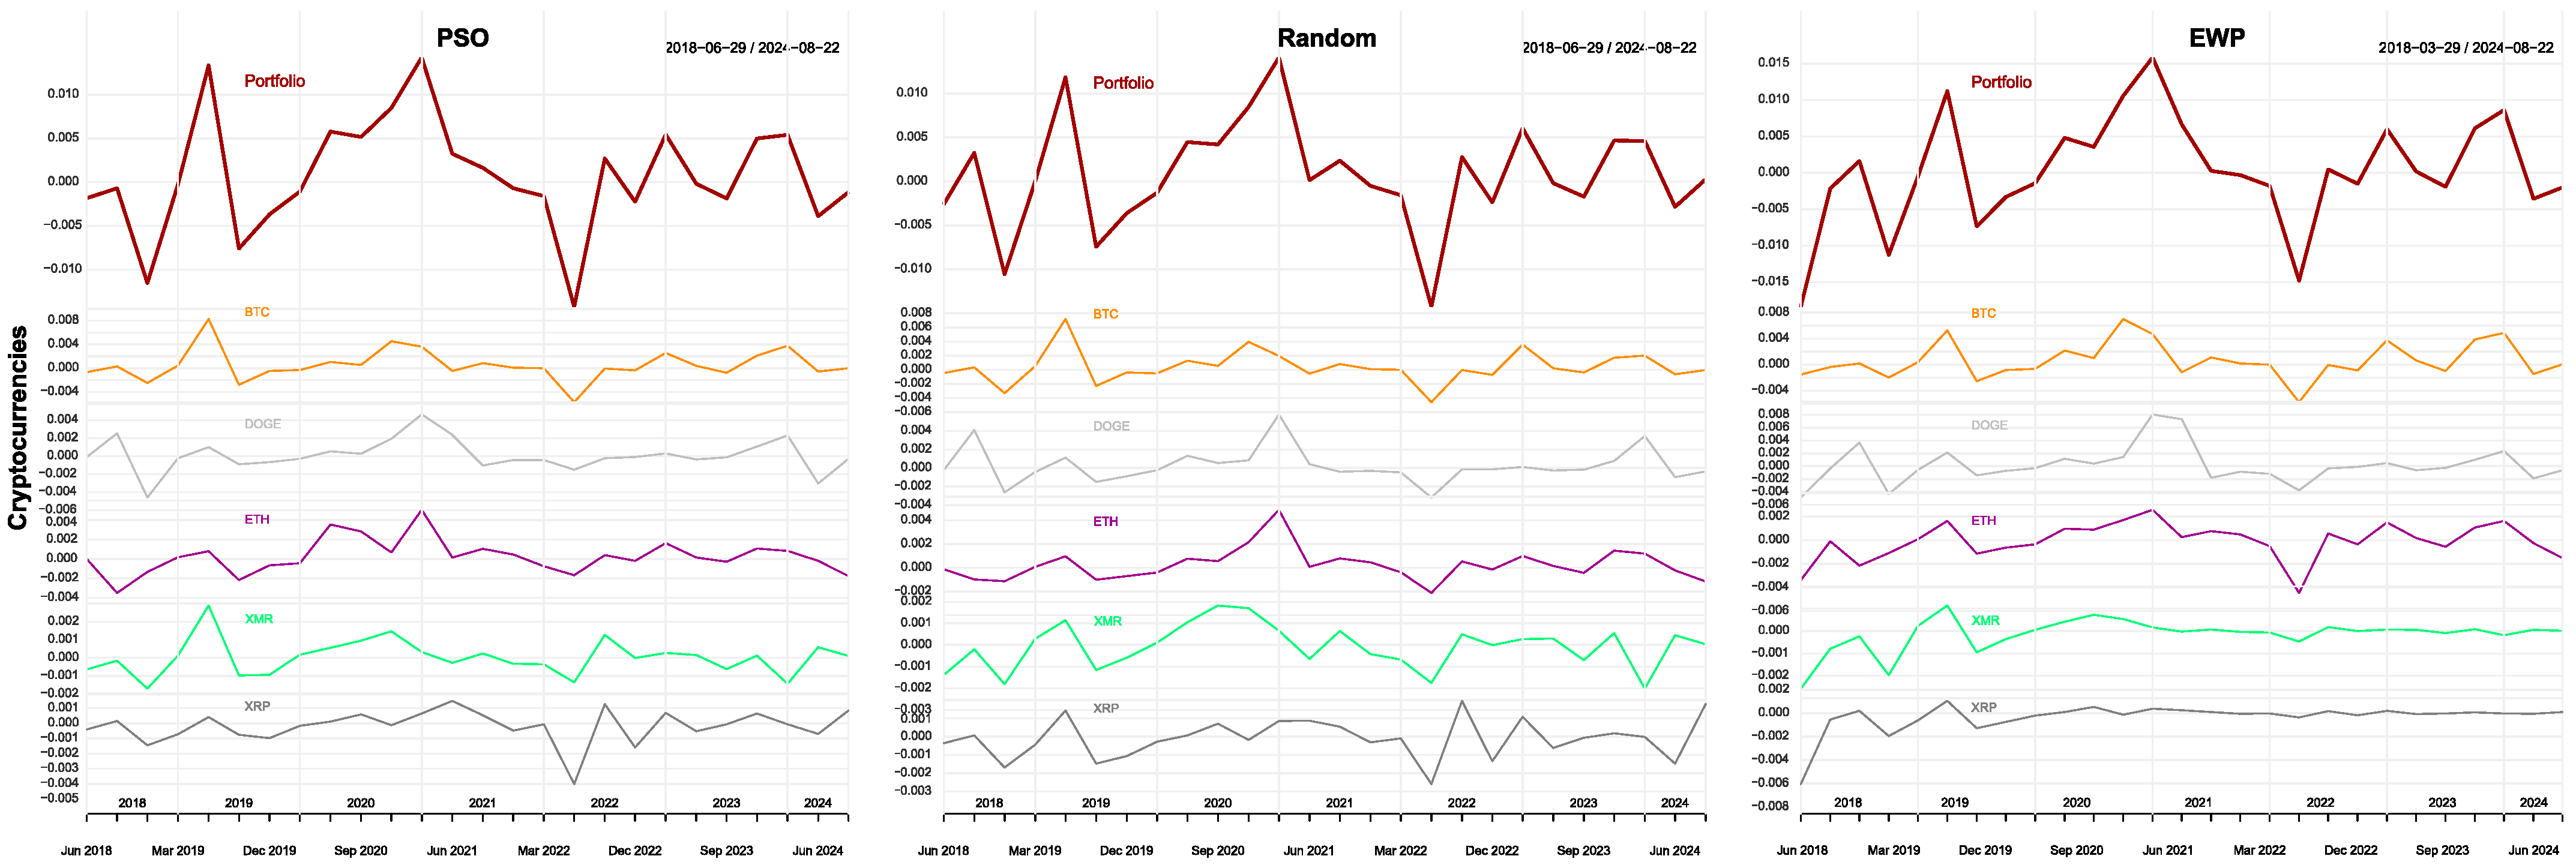
In the cryptocurrency-only portfolio in
Figure 6, the EWP method shows that apart from Bitcoin, Dogecoin, and Ethereum, other cryptocurrencies’ contributions are negligible. Thus, EWP may result in concentrated portfolios and thus lead to less diversified portfolios. PSO and random optimizers, on the other hand, show non-negligible returns contributions from all cryptocurrencies and hence favor the inclusion of cryptocurrencies, which results in more diversified portfolios.
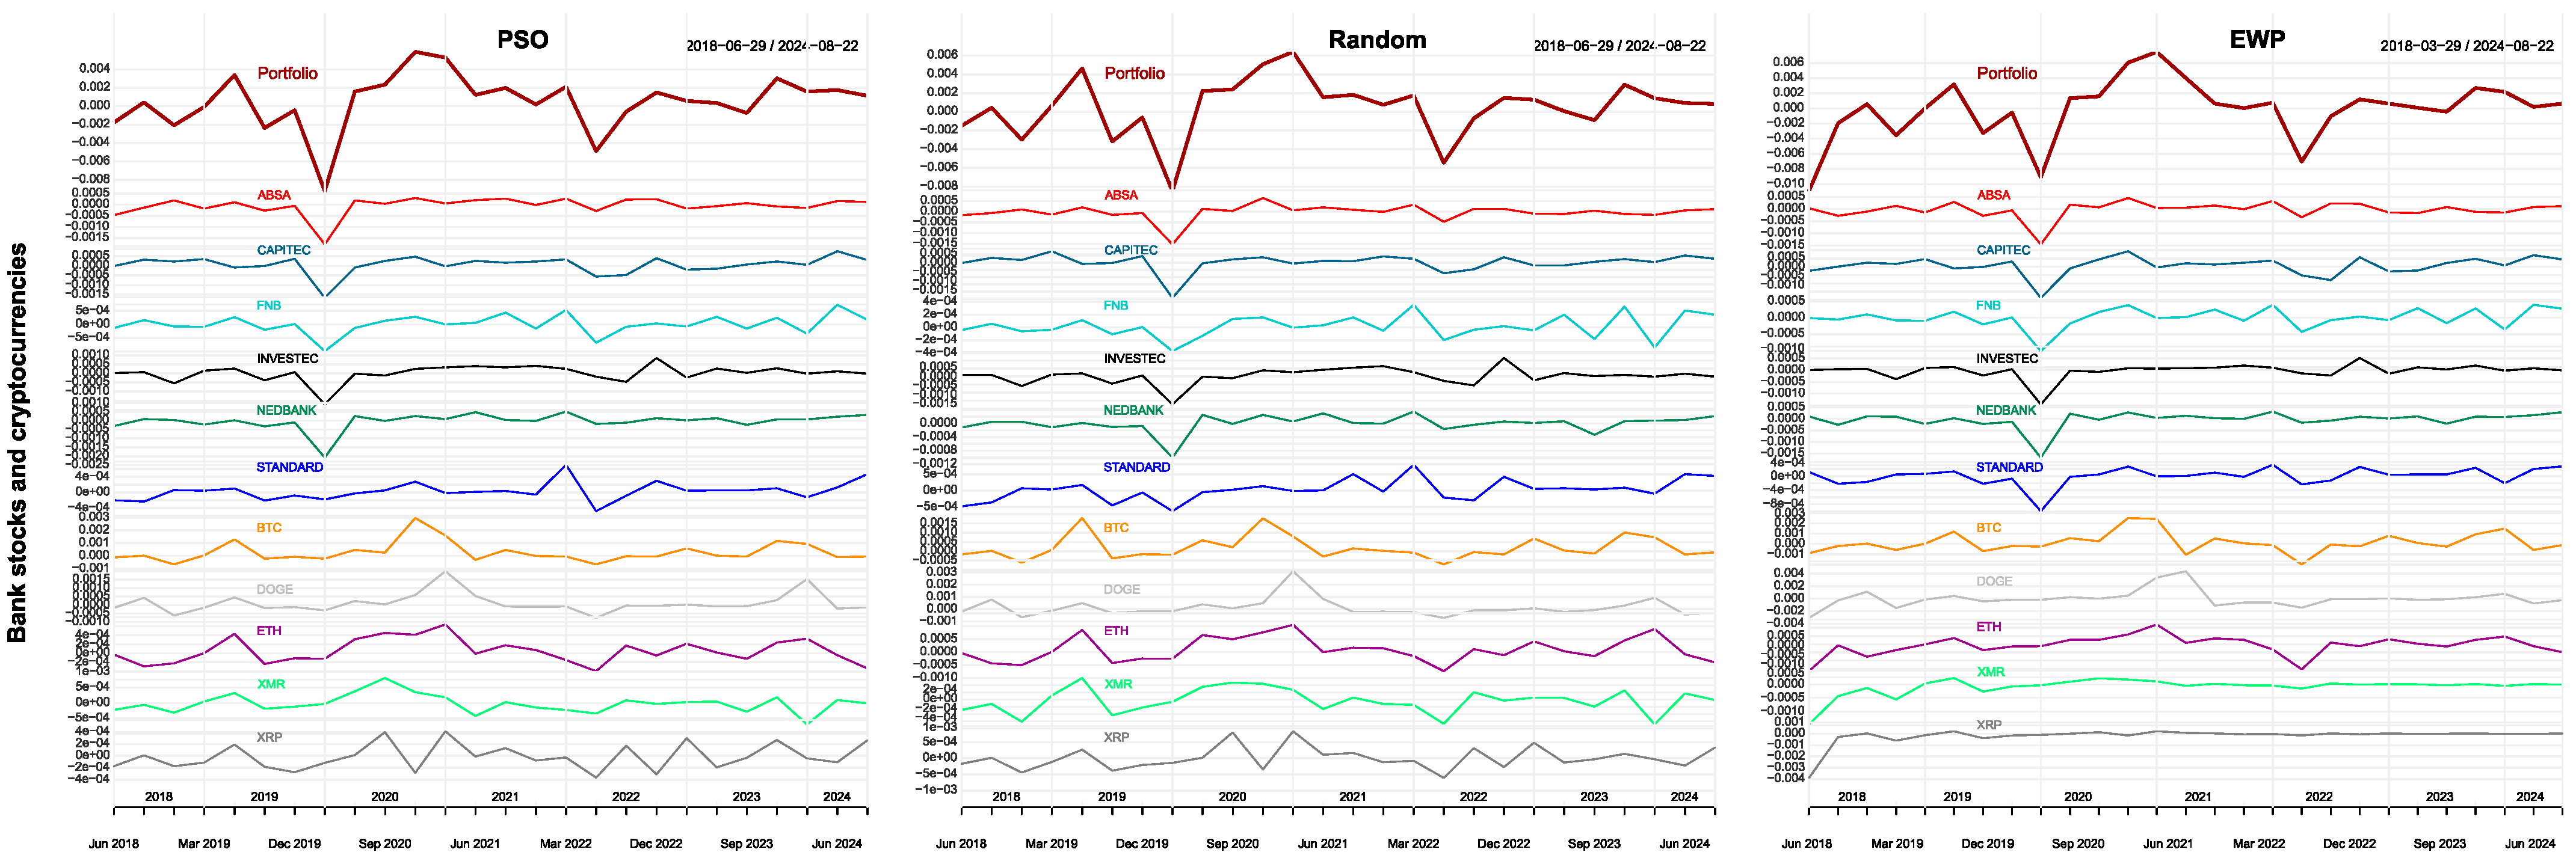
In the combined bank stock and cryptocurrency portfolio in
Figure 7, for all optimizers, bank stocks contributed more towards portfolio losses, and cryptocurrencies contributed more towards portfolio gains during the 2020 crisis. Cryptocurrencies offered diversification benefits during the 2020 crisis. This is observed in past studies such as
Riahi et al. (
2024). However, in 2022, the fall in portfolio returns resulted from falling prices of Bitcoin, Dogecoin, and Ethereum, compared with bank stocks. In the cryptocurrency-only portfolio and in the bank stock and cryptocurrency portfolio, cryptocurrencies recorded gains during the 2020 crisis but recorded losses in the 2022 brief crisis period. Thus, although cryptocurrencies were found to be safe haven assets during brief crisis periods (
Corbet et al. 2018), this could have changed in the recent 2022 market decline.
Leong et al. (
2025) ascribe the 2022–2023 fall in cryptocurrency prices to bankruptcies and failures in the cryptocurrency market.
The dynamic portfolio performance metrics of the annualized Sharpe ratios we provide in
Figure 8 show that the bank stock-only portfolio experienced its worst performance in the first six months of 2020, after which there was a tremendous recovery until the beginning of 2022 for all methods. For the cryptocurrency-only portfolio, there was a slight decline, coupled with a much bigger recovery compared with bank stocks for all methods. But this performance only lasted until July 2020. Thereafter, the portfolio of cryptocurrencies experienced an immense decline in performance for all methods. The portfolio of cryptocurrencies and bank stocks has a performance that replicates that of cryptocurrencies more and less of bank stocks. This is observed more with the EWP compared with the PSO and random portfolio optimizers.
The dynamic annualized standard deviation metrics in
Figure 9 show that for all methods, the portfolio of bank stock-only was very risky in the first six months of 2020, after which there was a great decline in portfolio risk until the beginning of 2022. The cryptocurrency-only portfolio experienced great risk uncertainty for all optimization methods. However, risk has been declining since the beginning of 2022. The portfolio of cryptocurrencies and bank stocks has a risk profile that replicates that of cryptocurrencies more for all methods. Similar to the Sharpe ratios, this is observed more in the EWP compared with the PSO and Random portfolios. The EWP portfolio, however, recorded the biggest decline in portfolio risk in the first six months of 2020. This could, however, be due to an underestimation of the portfolio risk during this period.
PDI, DR, DD, and DD* results in
Table 3 show that the portfolios are not well diversified, but including cryptocurrencies in bank stocks marginally increase portfolio diversification.
Unlike the adjusted Sharpe ratios that incorporate higher moments of skewness and excess kurtosis, the Sharpe ratios in
Table 4 overestimate the portfolio performance. The adjusted Sharpe ratios show that, on average, for the bank stock-only portfolio, the dynamic portfolio outperforms the EWP, and the PSO optimizer outperforms the random optimizer. For the cryptocurrency-only portfolio, the dynamic portfolio underperforms the EWP, and the random optimizer outperforms the PSO optimizer. However, results in the lower panel show that for a combination of bank stocks and cryptocurrencies, we obtain a better-performing portfolio with higher Sharpe and adjusted Sharpe ratios than that of bank stock-only or cryptocurrency-only portfolios, and the PSO and random optimized portfolios perform better than the EWP portfolio. Although the risk for the bank-only portfolio, as measured by the standard deviation, is much lower than that of cryptocurrencies, when these asset classes are combined, the increased risk of bank stock-only is minuscule to that of a reduction in the cryptocurrency-only portfolio. This indicates that risk-sensitive investors holding bank stocks may prefer not to add cryptocurrencies to their portfolios. However, if risk-sensitive investors are holding cryptocurrencies, adding bank stocks will significantly lower their portfolio risk. The MVO portfolio, a one-period static portfolio, on the other hand, outperforms the other portfolios. However, unlike other techniques used in this study, where no underlying distribution is assumed for these data, the MVO portfolio assumes beforehand that these data follow a normal distribution (see
Ziane et al. 2024). Hence, results from MVO performance should be interpreted with caution because, in the absence of normality in the returns distribution, the tails of the distribution will hold more data, which represents returns under extreme market conditions.
Streaks in
Figure 10 show that the JSE index was more stable compared with bank stocks and cryptocurrencies. Among bank stocks, negative streaks show that FNB, Nedbank, and Standard Bank performed better than Capitec Bank and Investec, with lower downward streak losses during the first six months of 2020 when the COVID-19 crisis was at its peak. However, Absa bank stock returns were more volatile during this period, although with comparable losses to those of FNB, Nedbank, and Standard Bank. Among cryptocurrencies, Ethereum, Dogecoin, and Monero performed better than Bitcoin and Ripple, with lower downward streak losses during the first six months of 2020. However, after three months of this six-month period, Monero remained in a downward streak, and Ethereum moved into an upward streak, with Monero and Dogecoin being very volatile. Whereas the post-COVID-19 period has posed challenges in picking stocks for the portfolio, for investors that prefer a shorter investment horizon, the most resilient asset combination during the first six months of 2020 should have included the JSE index, FNB, Nedbank, Standard Bank, and Ethereum, as these are upward streaking stocks but long-term investors may pick downward streaking stocks in anticipation of a price reversal and gaining from buying low and selling high (see
Klos et al. 2023). Bitcoin, which has received much attention in the literature, when included, would have lowered the performance of the portfolio. Outside the first six months of 2020, the extended current period shows a reversal, with Capitec Bank and Investec recording upward streaks while FNB and Nedbank recorded downward streaks. Standard Bank remains the most adaptable and continues to streak upwards. Thus, the best combination during the current and extended post-COVID-19 period may include the JSE index and bank stocks, including Standard Bank, Investec, and Capitec Bank. The addition of cryptocurrencies to the portfolio during this period would lower the portfolio performance.
5. Discussion
This study finds that assets within the same category, either bank stocks or cryptocurrencies, exhibit high intra-category correlations, suggesting limited diversification benefits within those groups. Particularly, bank stocks showed correlations exceeding 0.73, while cryptocurrency pairs exceeded 0.59. However, the correlation between bank stocks and cryptocurrencies remained very low, making cryptocurrencies potentially attractive for diversification. Volatility across all assets spiked during the COVID-19 crisis (January–June 2020), but cryptocurrencies demonstrated persistently higher volatility, especially outside the crisis periods. Portfolio optimization using the multi-asset particle swarm optimizer (MA-PSO), random optimizer, and naïve equal-weighted portfolio (EWP) showed that portfolios allocating more weight to cryptocurrencies, especially during the crisis, achieved higher Sharpe ratios. The MA-PSO led to broader diversification by including more cryptocurrencies with meaningful contributions, compared with EWP, where the portfolio was concentrated in a few cryptocurrencies, such as Bitcoin and Ethereum. Diversification metrics indicated marginal improvements when cryptocurrencies were added to bank stock portfolios. However, during the post-crisis period, bank stocks outperformed cryptocurrencies, suggesting their stronger performance in calmer market conditions. Streak results showed that the JSE index, FNB, Nedbank, Standard Bank, and Ethereum comprised the most resilient asset combination during the first six months of 2020, and Bitcoin, which has received much attention in the literature, when included, would have lowered the performance of the portfolio. Outside the first six months of 2020, the extended current period showed a reversal, with Capitec Bank and Investec streaking upwards while FNB and Nedbank streaked downwards. Standard Bank remained the most flexible asset and continued to streak upwards. Therefore, in the post-COVID-19 period, the best asset combination should contain the JSE index and bank stocks of Standard Bank, Investec, and Capitec Bank. The addition of cryptocurrencies to the portfolio during this period may lead to lower portfolio performance.
These findings align with earlier studies that demonstrate low correlations between traditional financial assets and cryptocurrencies (
Corbet et al. 2018), reaffirming cryptocurrencies’ diversification potential. However, in contrast to
Białkowski (
2020), who argued that cryptocurrencies increase portfolio volatility and whose analysis was solely based on cryptocurrencies and pre-COVID-19 data, our results suggest that adding bank stocks to cryptocurrency portfolios significantly reduces overall risk. The dynamic allocation strategy further supports the findings of
Kozlowski et al. (
2019), emphasizing that non-normal return distributions are better handled by heuristic optimizers such as PSO rather than traditional models such as MVO, which assume the normality of returns. Additionally, while Bitcoin has been the focus of much of the literature, our findings point to Ethereum and the JSE Index as more resilient assets during crisis periods.
The differences observed compared with the prior literature may stem from the broader and more recent time horizon of this study, which includes both the pre- and post-COVID-19 periods. Earlier studies often focused solely on pre-2020 data or considered only Bitcoin, whereas this analysis incorporates a wider set of cryptocurrencies and financial assets. Furthermore, the use of alternative optimization techniques, such as MA-PSO, allows for more flexible asset weightings that reflect tail risks more accurately than traditional mean–variance approaches.
Practically, these results have significant implications for portfolio managers and investors. The evidence suggests that in times of crisis, including cryptocurrencies—especially via dynamic optimization methods such as MA-PSO—can improve portfolio performance. However, in stable periods, bank stocks may provide better risk-adjusted returns. Thus, asset allocation strategies should be responsive to market conditions. For risk-averse investors, maintaining an allocation of bank stocks while selectively incorporating resilient cryptocurrencies such as Ethereum could better balance return and volatility. Additionally, this study highlights the importance of using optimization models that account for non-normal return distributions, particularly in volatile or crisis markets.
6. Conclusions
This study aimed to examine the diversification potential and performance of portfolios comprising bank stocks and cryptocurrencies in the pre- and post-COVID-19 periods. The findings of this study show that while assets within the same category exhibit strong intra-group correlations, thereby limiting internal diversification, the correlation between bank stocks and cryptocurrencies remains low, supporting the latter’s value in cross-asset diversification. The dynamic portfolio analysis revealed that during crisis periods, higher cryptocurrency allocations, particularly through dynamic optimization methods such as MA-PSO, led to superior risk-adjusted returns. However, in calmer market conditions, bank stocks outperformed, and the addition of cryptocurrencies did not significantly enhance performance.
For investors and practitioners, this study offers actionable insights into adaptive asset allocation strategies. During volatile or crisis periods, incorporating cryptocurrencies, especially Ethereum, via dynamic strategies such as MA-PSO can improve portfolio performance by capturing tail risk and enhancing Sharpe ratios. However, in post-crisis or stable environments, bank stocks such as Standard Bank, Investec, and Capitec Bank provide stronger and more consistent returns. Thus, investors should consider market conditions when designing portfolios and apply advanced optimization techniques that better capture non-normal return characteristics. Additionally, South African portfolio managers must carefully evaluate investor risk tolerance before adding cryptocurrencies, with regulators imposing stringent guidelines to reduce the potential risks and losses investors may face. Moreover, given the pivotal role that banks play in the South African economy, with increased losses emanating from investing in highly risky assets, their ability to continue extending credit to businesses may be impacted. This may also hinder the government’s goal of increasing employment through inclusive economic growth as set out in the National Development Plan 2030.
This study contributes to the growing literature by analyzing a more extensive time horizon that includes the pre-, during-, and post-COVID-19 periods. It advances previous work by incorporating a broader set of financial assets and applying alternative optimization models, such as MA-PSO, that accommodate non-normal distributions. It also deviates from the dominant approach of focusing on Bitcoin by analyzing other cryptocurrencies. These contributions offer a more nuanced understanding of asset performance and allocation in crisis and post-crisis contexts.
Despite its contributions, this study’s limitations include its primary focus on South African bank stocks and a limited set of cryptocurrencies, which may affect the generalizability of the results to other markets. Future research could explore a more diverse set of traditional assets, such as bonds, exchange rates, and real estate, and a more diverse set of cryptocurrencies. Additionally, although PSO convergence is fast, similar to most meta-heuristic algorithms, this may lead to the possibility of particles converging to a local optimum or personal best and not a global optimum, thereby providing a sub-optimal solution (see
Qaraad et al. 2023). Therefore, better methods that avoid this scenario may be explored.


