
A Study on the Topological Insights and Network Visualization Mapping of the Indian Equity Market


Abstract
1. Introduction
- RQ1:
- What are the topological properties of the Indian equity market network, and how do they compare with those of other emerging markets?
- RQ2:
- How do different industrial sectors contribute to the structure and dynamics of the Indian equity market?
- RQ3:
- How does network visualization and reduction (using MST analysis and disparity filtering) improve our understanding of market dynamics?
- Previous studies done on the network analysis of Indian equity markets are mostly focused on the study of interconnectedness at the initial level, using old study samples from before 2016 (Bhattacharjee et al. 2016), considering a smaller number of stocks for analysis (Kulkarni et al. 2024), or incorporating corporate interlock (Sankar et al. 2015). Keeping these in mind, the present study comprehensively decodes the level of interconnectedness of different sectors within the Indian equity market network;
- Thereafter, it provides useful insights into the topological aspects of the Indian equity market network by estimating six different network metrics, namely the disparity, closeness centrality, eigenvector centrality, influence strength, weighted clustering coefficient, and domination power;
- Then, this study’s estimates are used for a comparative analysis with other emerging markets, namely Brazil and South Africa;
- Lastly, this study further deploys reduced network visualization to obtain useful insights at the micro level (stock).
2. Literature Review
2.1. Network Finance Literature
2.2. Network Analysis Methods in the Extant Literature
2.3. Network Based Studies on Indian Equity Market
3. Data and Methodology
3.1. Data
3.2. Weighted Network Construction Workflow
3.2.1. Rolling Window Methodology
3.2.2. Calculation of Edge Weights in the Network
3.3. Network Metric Computation
3.3.1. Disparity
3.3.2. Closeness Centrality
3.3.3. Eigenvector Centrality
3.3.4. Influence Strength
3.3.5. Weighted Clustering Coefficient
3.3.6. Domination Power
3.4. Network Reduction Methods and Visualization
3.4.1. Minimum Spanning Tree
3.4.2. Disparity Filtering
4. Results and Discussion
4.1. Topological Properties of the Network
4.2. Aggregated Sector-Wise Average Network Measures
4.3. Reduced Network Visualization and Interpretation
4.4. Comparative Analysis of Findings with Studies in Emerging Market
5. Theoretical Contributions
6. Managerial Implication of the Study
7. Conclusions
Author Contributions
Funding
Data Availability Statement
Conflicts of Interest
Appendix A

References
- Agarwal, Vineet, Richard J. Taffler, and Chenyang Wang. 2025. Investor emotions and market bubbles. Review of Quantitative Finance and Accounting 4: 339–69. [Google Scholar] [CrossRef]
- Ahn, Yong-Yeol, Sebastian E. Ahnert, James P. Bagrow, and Albert-László Barabási. 2011. Flavor network and the principles of food pairing. Scientific Reports 1: 196. [Google Scholar] [CrossRef] [PubMed]
- Akkaya, Murat. 2021. Behavioral Portfolio Theory. In Applying Particle Swarm Optimization. Edited by Burcu Adıgüze Mercangöz. International Series in Operations Research & Management Science. Cham: Springer, vol. 306. [Google Scholar] [CrossRef]
- ANI. 2024. India’s IPO Fundraising Set for Landmark Year 2024. LiveMint. Available online: https://www.livemint.com/market/ipo/indias-ipo-fundraising-set-for-landmark-year-2024-s-p-global-market-intelligence-11733635115553.html (accessed on 3 April 2025).
- Aste, Tomaso, William Shaw, and Tiziana Di Matteo. 2010. Correlation Structure and Dynamics in Volatile Markets. New Journal of Physics 12: 085009. [Google Scholar] [CrossRef]
- Baitinger, Eduard, and Jochen Papenbrock. 2017. Interconnectedness Risk and Active Portfolio Management: The Information Theoretic Perspective. Available online: https://papers.ssrn.com/sol3/papers.cfm?abstract_id=2909839 (accessed on 20 January 2025).
- Bajardi, Paolo, Alain Barrat, Fabrizio Natale, Lara Savini, and Vittoria Colizza. 2011. Dynamical Patterns of Cattle Trade Movements. PLoS ONE 6: e19869. [Google Scholar] [CrossRef]
- Barbi, Alex Quintino, and Gilberto Aparecido Prataviera. 2019. Nonlinear dependencies on Brazilian equity network from mutual information minimum spanning trees. Physica A: Statistical Mechanics and Its Applications 523: 876–85. [Google Scholar] [CrossRef]
- Barfuss, Wolfram, Guido Previde Massara, Tiziana Di Matteo, and Tomaso Aste. 2016. Parsimonious modeling with information filtering networks. Physical Review E 94: 062306. [Google Scholar] [CrossRef]
- Barrat, Alain, Marc Barthelemy, Romualdo Pastor-Satorras, and Alessandro Vespignani. 2004. The architecture of complex weighted networks. Proceedings of the National Academy of Sciences USA 101: 3747–52. [Google Scholar] [CrossRef]
- Barthélemy, Marc, Alain Barrat, Romualdo Pastor-Satorras, and Alessandro Vespignani. 2005. Characterization and modeling of weighted networks. Physica A 346: 34–43. [Google Scholar] [CrossRef]
- Belhoula, Mohamed Malek, Walid Mensi, and Kamel Naoui. 2024. Impacts of investor’s sentiment, uncertainty indexes, and macroeconomic factors on the dynamic efficiency of G7 stock markets. Quality & Quantity 58: 2855–86. [Google Scholar] [CrossRef]
- Berouaga, Younes, Cherif El Msiyah, and Jaouad Madkour. 2023. Portfolio optimization using minimum spanning tree model in the Moroccan Stock exchange market. International Journal of Financial Studies 11: 53. [Google Scholar] [CrossRef]
- Bhattacharjee, Biplab, Muhammad Shafi, and Animesh Acharjee. 2016. Investigating the influence relationship models for stocks in Indian equity market: A weighted network modelling study. PLoS ONE 11: e0166087. [Google Scholar] [CrossRef] [PubMed]
- Bhattacharjee, Biplab, Muhammad Shafi, and Animesh Acharjee. 2019. Network mining based elucidation of the dynamics of cross-market clustering and connectedness in Asian region: An MST and hierarchical clustering approach. Journal of King Saud University-Computer and Information Sciences 31: 218–28. [Google Scholar] [CrossRef]
- Bhattacharjee, Biplab, Rajiv Kumar, and Arunachalam Senthilkumar. 2022. Unidirectional and bidirectional LSTM models for edge weight predictions in dynamic cross-market equity networks. International Review of Financial Analysis 84: 102384. [Google Scholar] [CrossRef]
- Boginski, Vladimir, Sergiy Butenko, and Panos M. Pardalos. 2005. Statistical analysis of financial networks. Computational Statistics & Data Analysis 48: 431–43. [Google Scholar]
- Bonanno, Giovanni, Guido Caldarelli, Fabrizio Lillo, and Rosario N. Mantegna. 2003. Topology of correlation-based minimal spanning trees in real and model markets. Physical Review E 68: 046130. [Google Scholar] [CrossRef]
- Brechmann, Eike Christian. 2013. Hierarchical Kendall Copulas and the Modeling of Systemic and Operational Risk. Ph.D. thesis, Technical University of Munich, Munich, Germany. [Google Scholar]
- Brida, Juan Gabriel, and Wiston Adrián Risso. 2008. Multidimensional minimal spanning tree: The Dow Jones case. Physica A 387: 5205–10. [Google Scholar] [CrossRef]
- Brin, Sergey, and Lawrence Page. 1998. The anatomy of a large-scale hypertextual web search engine. Computer Networks and ISDN Systems 30: 107–17. [Google Scholar] [CrossRef]
- Carvalho, Lucas, and Tanya Araújo. 2024. The dynamics of exchange traded funds: A geometrical and topological approach. Applied Network Science 9: 73. [Google Scholar] [CrossRef]
- Cerqueti, Roy, Hayette Gatfaoui, and Giulia Rotundo. 2024. Resilience for financial networks under a multivariate GARCH model of stock index returns with multiple regimes. Annals of Operations Research, 1–27. [Google Scholar] [CrossRef]
- Chakrabarti, Prasenjit, Mohammad Shameem Jawed, and Manish Sarkhel. 2021. COVID-19 pandemic and global financial market interlinkages: A dynamic temporal network analysis. Applied Economics 53: 2930–45. [Google Scholar] [CrossRef]
- Chan, Lupe S. H., Amanda M. Y. Chu, and Mike K. P. So. 2023. A moving-window bayesian network model for assessing systemic risk in financial markets. PLoS ONE 18: e0279888. [Google Scholar] [CrossRef]
- Choi, Insu, and Woo Chang Kim. 2024. A multifaceted graph-wise network analysis of sector-based financial instruments’ price-based discrepancies with diverse statistical interdependencies. The North American Journal of Economics and Finance 75: 102316. [Google Scholar] [CrossRef]
- Clemente, Gian Paolo, Rosanna Grassi, and Asmerilda Hitaj. 2021. Asset allocation: New evidence through network approaches. Annals of Operations Research 299: 61–80. [Google Scholar] [CrossRef]
- Clemente, Gian Paolo, Rosanna Grassi, and Asmerilda Hitaj. 2022. Smart network based portfolios. Annals of Operations Research 316: 1519–41. [Google Scholar] [CrossRef]
- Deshmukh, Arun Kumar, Ashutosh Mohan, and Ishi Mohan. 2022. Goods and Services Tax (GST) Implementation in India: A SAP–LAP–Twitter Analytic Perspective. Global Journal of Flexible Systems Management 23: 165–83. [Google Scholar] [CrossRef] [PubMed]
- Dhingra, Barkha, Shallu Batra, Vaibhav Aggarwal, Mahender Yadav, and Pankaj Kumar. 2024. Stock market volatility: A systematic review. Journal of Modelling in Management 19: 925–52. [Google Scholar] [CrossRef]
- Durante, Fabrizio, and Roberta Pappada. 2015. Cluster analysis of time series via Kendall distribution. In Strengthening Links Between Data Analysis and Soft Computing. Cham: Springer, pp. 209–16. [Google Scholar]
- Durante, Fabrizio, Enrico Foscolo, Roberta Pappada, and Hao Wang. 2015. A Portfolio Diversification Strategy via Tail Dependence. DEAMS Research Paper Series 3/2015, University of Trieste. Available online: https://www.openstarts.units.it/server/api/core/bitstreams/7db38d5e-d1fe-49c4-9722-3c6f71c471c8/content (accessed on 20 January 2025).
- Fama, Eugene F. 1970. Efficient capital markets. Journal of Finance 25: 383–417. [Google Scholar] [CrossRef]
- Fiedor, Paweł. 2014. Networks in financial markets based on the mutual information rate. Physical Review E 89: 052801. [Google Scholar] [CrossRef]
- Friedkin, Noah E. 1991. Theoretical Foundations for Centrality Measures. American Journal of Sociology 96: 1478–504. [Google Scholar] [CrossRef]
- Ghosh, Bikramaditya, and E. Kozarevic. 2019. Multifractal analysis of volatility for detection of herding and bubble: Evidence from CNX Nifty HFT. Investment Management and Financial Innovations 16: 182. [Google Scholar] [CrossRef]
- Gilmore, Claire G., Brian M. Lucey, and Marian Boscia. 2008. An ever-closer union? Examining the evolution of linkages of European equity markets via minimum spanning trees. Physica A 387: 6319–29. [Google Scholar] [CrossRef]
- Glasserman, Paul, and H. Peyton Young. 2016. Contagion in financial networks. Journal of Economic Literature 54: 779–831. [Google Scholar] [CrossRef]
- Goh, Yong Kheng, Haslifah M. Hasim, and Chris G. Antonopoulos. 2018. Inference of financial networks using the normalised mutual information rate. PLoS ONE 13: e0192160. [Google Scholar] [CrossRef]
- Gu, Yuxin, and Yinhong Yao. 2022. Dynamic correlation analysis on the financial institutions in Shanghai, Shenzhen, and Hong Kong stock markets based on complex network. Procedia Computer Science 214: 737–46. [Google Scholar] [CrossRef]
- Guo, Xue, Hu Zhang, and Tianhai Tian. 2018. Development of stock correlation networks using mutual information and financial big data. PLoS ONE 13: e0195941. [Google Scholar] [CrossRef] [PubMed]
- Hartman, David, and Jaroslav Hlinka. 2018. Nonlinearity in stock networks. Chaos: An Interdisciplinary Journal of Nonlinear Science 28: 083127. [Google Scholar] [CrossRef]
- Hatami, Zahra, H. Ali, D. Volkman, and P. Chetti. 2022. A new approach for analyzing financial markets using correlation Hong Kong stock markets based on complex network. Procedia Computer Science 214: 737–46. [Google Scholar]
- Hou, Lei, and Yueling Pan. 2022. Evaluating the connectedness of commodity future markets via the cross-correlation network. Frontiers in Physics 10: 1017009. [Google Scholar] [CrossRef]
- Huang, Chuangxia, Yunke Deng, Xin Yang, Xiaoguang Yang, and Jinde Cao. 2023. Can financial crisis be detected? Laplacian energy measure. The European Journal of Finance 29: 949–76. [Google Scholar] [CrossRef]
- Huang, Wei-Qiang, Xin-Tian Zhuang, and Shuang Yao. 2009. A network analysis of the Chinese stock market. Physica A: Statistical Mechanics and Its Applications 388: 2956–64. [Google Scholar] [CrossRef]
- Jung, Woo-Sung, Okyu Kwon, Fengzhong Wang, Taisei Kaizoji, Hie-Tae Moon, and H. Eugene Stanley. 2008. Group dynamics of the Japanese market. Physica A 387: 537–42. [Google Scholar] [CrossRef]
- Jung, Woo-Sung, Seungbyung Chae, Jae-Suk Yang, and Hie-Tae Moon. 2006. Characteristics of the Korean stock market correlations. Physica A 361: 263–71. [Google Scholar] [CrossRef]
- Karmuhil, Annadurai, and Ramasamy Murugesan. 2024. Examining the nexus of GST and selected stock indices: A multivariate time series and vector auto-regressive machine learning model. International Journal of Enterprise Network Management 15: 133–58. [Google Scholar] [CrossRef]
- Kaur, Jaspreet. 2024. Investors’ perception towards investor protection measures taken by the government of India and SEBI: An ordinal approach. International Journal of Law and Management 66: 720–51. [Google Scholar] [CrossRef]
- Kim, Hyun-Joo, In-mook Kim, Youngki Lee, and Byungnam Kahng. 2002a. Scale-free network in stock markets. Journal of the Korean Physical Society 40: 1105–8. [Google Scholar]
- Kim, Hyun-Joo, Youngki Lee, Byungnam Kahng, and In-mook Kim. 2002b. Weighted scale-free network in financial correlations. Journal of the Physical Society of Japan 71: 2133–36. [Google Scholar] [CrossRef]
- Kulkarni, Saumitra, Hirdesh K. Pharasi, Sudharsan Vijayaraghavan, Sunil Kumar, Anirban Chakraborti, and Areejit Samal. 2024. Investigation of Indian stock markets using topological data analysis and geometry-inspired network measures. Physica a Statistical Mechanics and Its Applications 643: 129785. [Google Scholar] [CrossRef]
- Kumari, Jyoti, and Jitendra Mahakud. 2015. Does investor sentiment predict the asset volatility? Evidence from emerging stock market India. Journal of Behavioral and Experimental Finance 8: 25–39. [Google Scholar] [CrossRef]
- Laloux, Laurent, Pierre Cizeau, Jean-Philippe Bouchaud, and Marc Potters. 1999. Noise Dressing of Financial Correlation Matrices. Physical Review Letters 83: 1467–70. [Google Scholar] [CrossRef]
- L’Her, Jean-François, Tarek Masmoudi, and Jean-Marc Suret. 2004. Evidence to support the four-factor pricing model from the Canadian stock market. Journal of International Financial Markets, Institutions and Money 14: 313–28. [Google Scholar] [CrossRef]
- Lukomnik, J., and J. P. Hawley. 2021. Moving Beyond Modern Portfolio Theory. Oxon: Routledge eBooks. [Google Scholar] [CrossRef]
- Maiti, Moinak, Darko Vukovic, Yaroslav Vyklyuk, and Zoran Grubisic. 2022. BRICS capital markets co-movement analysis and forecasting. Risks 10: 88. [Google Scholar] [CrossRef]
- Majapa, Mohamed, and Sean Joss Gossel. 2016. Topology of the South African stock market network across the 2008 financial crisis. Physica A 445: 35–47. [Google Scholar] [CrossRef]
- Malkiel, Burton G. 2003. The efficient market hypothesis and its critics. Journal of Economic Perspectives 17: 59–82. [Google Scholar] [CrossRef]
- Mandelbrot, Benoit. 1965. Self-similar error clusters in communications systems and the concept of conditional stationarity. IEEE Transactions on Communication Technology 13: 71–90. [Google Scholar] [CrossRef]
- Mantegna, Rosario N. 1999. Hierarchical structure in financial markets. The European Physical Journal B-Condensed Matter and Complex Systems 11: 193–97. [Google Scholar] [CrossRef]
- Mantegna, Rosario N., and H. Eugene Stanley. 1995. Scaling behaviour in the dynamics of an economic index. Nature 376: 46–49. [Google Scholar] [CrossRef]
- Mantegna, Rosario N., and H. Eugene Stanley. 2000. An Introduction to Econophysics: Correlation and Complexity in Finance. Cambridge: Cambridge University Press. [Google Scholar]
- Marti, Gautier, Frank Nielsen, and Philippe Donnat. 2016. Optimal copula transport for clustering multivariate time series. Paper presented at the 2016 IEEE International Conference on Acoustics, Speech and Signal Processing (ICASSP), Shanghai, China, 20–25 March; pp. 2379–83. [Google Scholar]
- Marti, Gautier, Frank Nielsen, Mikołaj Bińkowski, and Philippe Donnat. 2021. A Review of Two Decades of Correlations, Hierarchies, Networks and Clustering in Financial Markets. In Progress in Information Geometry. Signals and Communication Technology. Edited by Frank Nielsen. Cham: Springer. [Google Scholar] [CrossRef]
- Massara, Guido Previde, Tiziana Di Matteo, and Tomaso Aste. 2016. Network filtering for big data: Triangulated maximally filtered graph. Journal of Complex Networks 5: 161–78. [Google Scholar] [CrossRef]
- Matia, Kaushik, Mukul Pal, H. Salunkay, and H. Eugene Stanley. 2004. Scale-dependent price fluctuations for the Indian stock market. Europhysics Letters 66: 909–14. [Google Scholar] [CrossRef]
- Meng, Sun, and Yan Chen. 2023. Market Volatility Spillover, Network Diffusion, and Financial Systemic Risk Management: Financial Modeling and Empirical Study. Mathematics 11: 1396. [Google Scholar] [CrossRef]
- Musmeci, Nicolò, T. Aste, and T. Di Matteo. 2015. Bootstrapping topological properties and systemic risk of complex networks using the fitness model. Journal of Network Theory in Finance 1: 1–20. [Google Scholar] [CrossRef]
- Namaki, Ali, Amir H. Shirazi, R. Raei, and G. R. Jafari. 2011. Network analysis of a financial market based on genuine correlation and threshold method. Physica A: Statistical Mechanics and Its Applications 390: 3835–41. [Google Scholar] [CrossRef]
- Newman, Mark E. J. 2008. The mathematics of networks. The New Palgrave Encyclopedia of Economics 2: 1–12. [Google Scholar]
- Ng, Victor, Robert F. Engle, and Michael Rothschild. 1992. A multi-dynamic-factor model for stock returns. Journal of Econometrics 52: 245–66. [Google Scholar] [CrossRef]
- Nie, Chun-Xiao. 2020. A network-based method for detecting critical events of correlation dynamics in financial markets. Europhysics Letters 131: 50001. [Google Scholar] [CrossRef]
- Onnela, Jukka-Pekka, Anirban Chakraborti, Kimmo Kaski, and Janos Kertesz. 2003a. Dynamic asset trees and Black Monday. Physica A 324: 247–52. [Google Scholar] [CrossRef]
- Onnela, Jukka-Pekka, Anirban Chakraborti, Kimmo Kaski, Janos Kertesz, and Antti Kanto. 2003b. Asset trees and asset graphs in financial markets. Physica Scripta 2003: 48. [Google Scholar] [CrossRef]
- Onnela, Jukka-Pekka, Anirban Chakraborti, Kimmo Kaski, Janos Kertesz, and Antti Kanto. 2003c. Dynamics of market correlations: Taxonomy and portfolio analysis. Physical Review E 68: 056110. [Google Scholar] [CrossRef]
- Pan, Raj Kumar, and Sitabhra Sinha. 2007. Self-organization of price fluctuation distribution in evolving markets. European Physics Letters 77: 1–5. [Google Scholar] [CrossRef]
- Pan, Raj Kumar, and Sitabhra Sinha. 2008. Inverse-cubic law of index fluctuation distribution in Indian markets. Physica A: Statistical Mechanics and Its Applications 387: 2055–65. [Google Scholar] [CrossRef]
- Pawanesh, Pawanesh, Imran Ansari, and Niteesh Sahni. 2025. Exploring the core–periphery and community structure in the financial networks through random matrix theory. Physica A Statistical Mechanics and Its Applications 661: 130403. [Google Scholar] [CrossRef]
- Pástor, Ľuboš, and Robert F. Stambaugh. 2000. Comparing asset pricing models: An investment perspective. Journal of Financial Economics 56: 335–81. [Google Scholar] [CrossRef]
- Peron, Kauê Dal’Maso Thomas, Luciano da Fontoura Costa, and Francisco A. Rodrigues. 2012. The structure and resilience of financial market networks. Chaos an Interdisciplinary Journal of Nonlinear Science 22: 013117. [Google Scholar] [CrossRef]
- Plerou, Vasiliki, Parameswaran Gopikrishnan, Bernd Rosenow, Luis A. Nunes Amaral, Thomas Guhr, and H. Eugene Stanley. 2002. Random matrix approach to cross correlations in financial data. Physical Review E 65: 1–18. [Google Scholar] [CrossRef] [PubMed]
- Plerou, Vasiliki, Parameswaran Gopikrishnan, Bernd Rosenow, Luís A. Nunes Amaral, and H. Eugene Stanley. 1999. Universal and Nonuniversal Properties of Cross Correlations in Financial Time Series. Physical Review Letters 83: 1471–74. [Google Scholar] [CrossRef]
- Press Information Bureau. 2017. 10 Years of Make in India Transforming India into a Global Manufacturing Powerhouse. Available online: https://pib.gov.in/PressNoteDetails.aspx?NoteId=153203&ModuleId=3®=3&lang=1 (accessed on 3 April 2025).
- Prim, Robert Clay. 1957. Shortest Connection Networks and Some Generalizations. The Bell System Technical Journal 36: 1389–401. [Google Scholar] [CrossRef]
- Priya, Pragati, and Chandan Sharma. 2023. COVID-19 related stringencies and financial market volatility: Sectoral evidence from India. Journal of Financial Economic Policy 15: 16–34. [Google Scholar] [CrossRef]
- PTI. 2019. Big Bang Mini-Budget: Government Slashes Corporate Tax Rate to 25.17%. Available online: https://timesofindia.indiatimes.com/business/india-business/big-bang-mini-budget-government-slashes-corporate-tax-rate-to-25-17/articleshow/71221589.cms (accessed on 3 April 2025).
- Rakib, Mahmudul Islam, Md Jahidul Alam, Nahid Akter, Kamrul Hasan Tuhin, and Ashadun Nobi. 2024. Change in hierarchy of the financial networks: A study on firms of an emerging market in Bangladesh. PLoS ONE 19: e0301725. [Google Scholar] [CrossRef]
- Rosenow, Bernd, Parameswaran Gopikrishnan, Vasiliki Plerou, and H. Eugene Stanley. 2003. Dynamics of cross-correlations in the stock market. Physica A 324: 241–46. [Google Scholar] [CrossRef]
- Sabidussi, Gert. 1966. The centrality index of a graph. Psychometrika 31: 581–603. [Google Scholar] [CrossRef]
- Samitas, Aristeidis, Elias Kampouris, and Stathis Polyzos. 2022. COVID-19 pandemic and spillover effects in stock markets: A financial network approach. International Review of Financial Analysis 80: 102005. [Google Scholar] [CrossRef]
- Sankar, C. Prem, K. Asokan, and K. Satheesh Kumar. 2015. Exploratory social network analysis of affiliation networks of Indian listed companies. Social Networks 43: 113–20. [Google Scholar] [CrossRef]
- Schinckus, Christophe, and Franck Jovanovic. 2013. Towards a transdisciplinary econophysics. Journal of Economic Methodology 20: 164–83. [Google Scholar] [CrossRef]
- Serrano, M. Ángeles, Marián Boguná, and Alessandro Vespignani. 2009. Extracting the multiscale backbone of complex weighted networks. Proceedings of the National Academy of Sciences USA 106: 6483–88. [Google Scholar] [CrossRef]
- Serrano, M. Ángeles, Marián Boguná, and Francesc Sagués. 2012. Uncovering the hidden geometry behind metabolic networks. Molecular Biosystems 8: 843–50. [Google Scholar] [CrossRef]
- Shiller, Robert J. 2005. Irrational Exuberance, 2nd ed. Princeton: Princeton University Press. ISBN 978-0691123356. [Google Scholar]
- Silva, Thiago Christiano, Solange Maria Guerra, Benjamin Miranda Tabak, and Rodrigo Cesar de Castro Miranda. 2016. Financial networks, bank efficiency and risk-taking. Journal of Financial Stability 25: 247–57. [Google Scholar] [CrossRef]
- Sinha, Sitabhra, and Raj Kumar Pan. 2007. Uncovering the Internal Structure of the Indian Financial Market: Large Cross-correlation Behavior in the NSE. In Econophysics of Markets and Business Networks: Proceedings of the Econophys-Kolkata III. Edited by Bikas K. Chakrabarti. Milan: Springer, pp. 3–19. [Google Scholar]
- Soh, Harold, Sonja Lim, Tianyou Zhang, Xiuju Fu, Gary Kee Khoon Lee, Terence Gih Guang Hung, Pan Di, Silvester Prakasam, and Limsoon Wong. 2010. Weighted complex network analysis of travel routes on the Singapore public transportation system. Physica A 389: 5852–63. [Google Scholar] [CrossRef]
- Song, Dong-Ming, Michele Tumminello, Wei-Xing Zhou, and Rosario N. Mantegna. 2011. Evolution of worldwide stock markets, correlation structure, and correlation-based graphs. Physical Review E 84: 026108. [Google Scholar] [CrossRef]
- Song, Won-Min, Tiziana Di Matteo, and Tomaso Aste. 2011. Nested hierarchies in planar graphs. Discrete Applied Mathematics 159: 2135–46. [Google Scholar] [CrossRef]
- Song, Won-Min, Tiziana Di Matteo, and Tomaso Aste. 2012. Hierarchical information clustering by means of topologically embedded graphs. PLoS ONE 7: e31929. [Google Scholar] [CrossRef]
- Sreenu, Nenavath, and Ashis Kumar Pradhan. 2023. The effect of COVID-19 on Indian stock market volatility: Can economic package control the uncertainty? Journal of Facilities Management 21: 798–815. [Google Scholar] [CrossRef]
- Tabak, Benjamin M., Thiago R. Serra, and Daniel O. Cajueiro. 2010. Topological properties of stock market networks: The case of Brazil. Physica A 389: 3240–49. [Google Scholar] [CrossRef]
- Times Now News. 2024. Stock Market Investors Richer by ₹3.6 Lakh Crore as Bulls Celebrate Modi’s Return; RBI’s Revised GDP Projection Among Others. Times Now. Available online: https://www.timesnownews.com/business-economy/markets/stock-market-investors-richer-by-3-6-lakh-crore-as-bulls-celebrate-modis-return-rbis-revised-gdp-projection-among-others-article-110861670 (accessed on 20 January 2025).
- Tumminello, Michele, Fabrizio Lillo, and Rosario N. Mantegna. 2010. Correlation, hierarchies, and networks in financial markets. Journal of Economic Behavior & Organization 75: 40–58. [Google Scholar]
- Tumminello, Michele, Tiziana Di Matteo, Tomaso Aste, and Rosario N. Mantegna. 2007. Correlation based networks of equity returns sampled at different time horizons. The European Physical Journal B 55: 209–17. [Google Scholar] [CrossRef]
- Tumminello, Michele, Tomaso Aste, Tiziana Di Matteo, and Rosario N. Mantegna. 2005. A tool for filtering information in complex systems. Proceedings of the National Academy of Sciences USA 102: 10421–26. [Google Scholar] [CrossRef]
- Van Den Brink, René, and Robert P. Gilles. 2000. Measuring domination in directed networks. Social Networks 22: 141–57. [Google Scholar] [CrossRef]
- Varma, Yashraj, Renuka Venkataramani, Parthajit Kayal, and Moinak Maiti. 2021. Short-Term Impact of COVID-19 on Indian Stock Market. Journal of Risk and Financial Management 14: 558. [Google Scholar] [CrossRef]
- Wang, Gang-Jin, Chi Xie, and H. Eugene Stanley. 2018. Correlation Structure and Evolution of World Stock Markets: Evidence from Pearson and Partial Correlation-Based Networks. Computational Economics 1: 607–35. [Google Scholar] [CrossRef]
- Wang, Gang-Jin, Huahui Huai, You Zhu, Chi Xie, and Gazi Salah Uddin. 2024. Portfolio optimization based on network centralities: Which centrality is better for asset selection during global crises? Journal of Management Science and Engineering 9: 348–75. [Google Scholar] [CrossRef]
- Yassin, Ali, Hocine Cherifi, Hamida Seba, and Olivier Togni. 2025. Backbone extraction through statistical edge filtering: A comparative study. PLoS ONE 20: e0316141. [Google Scholar] [CrossRef]
- Zaheer, Kashif, Faheem Aslam, Yasir Tariq Mohmand, and Paulo Ferreira. 2023. Temporal changes in global stock markets during COVID-19: An analysis of dynamic networks. China Finance Review International 13: 23–45. [Google Scholar] [CrossRef]
- Zhang, Xin, Boris Podobnik, Dror Y. Kenett, and H. Eugene Stanley. 2014. Systemic risk and causality dynamics of the world international shipping market. Physica A: Statistical Mechanics and Its Applications 415: 43–53. [Google Scholar] [CrossRef]
- Zhou, XueZhong, Jörg Menche, Albert-László Barabási, and Amitabh Sharma. 2014. Human symptoms disease network. Nature Communications 5: 4212. [Google Scholar] [CrossRef] [PubMed]


| Sl. No. | Author(s) | Type of Network Approach Introduced to Investigate Correlation Structure of Financial Market Data |
|---|---|---|
| 1 | Mantegna (1999) | Hierarchical structure |
| 2 | Onnela et al. (2003b) | Dynamic asset graph |
| 3 | Tumminello et al. (2010) | Hierarchical clustering |
| 4 | Plerou et al. (2002) | Random matrix approach to cross-correlations in financial data |
| 5 | Tumminello et al. (2005) | Planar Maximal Filtering Graph (PMFG) |
| 6 | Boginski et al. (2005) | Correlation threshold method |
| 7 | Mantegna (1999) | Minimum Spanning Tree |
| 8 | Huang et al. (2009) | Threshold filtering method |
| 9 | Sinha and Pan (2007) | Largest eigenvalue is associated with the market mode (collective response of all stocks to macroeconomic factors) |
| 10 | Namaki et al. (2011) | Genuine correlation |
| Value of α | Barrat Weighted Clustering Coefficient |
|---|---|
| 0.2 | 0.864 |
| 0.15 | 0.836 |
| 0.10 | 0.771 |
| 0.05 | 0.632 |
| 0.01 | 0.463 |
| Unfiltered network | 0.790 |
| Sl. No. | Network Metric | Observation (for Average Values for 106 Observations) | Inference from the Average Measures of 106 Observations |
|---|---|---|---|
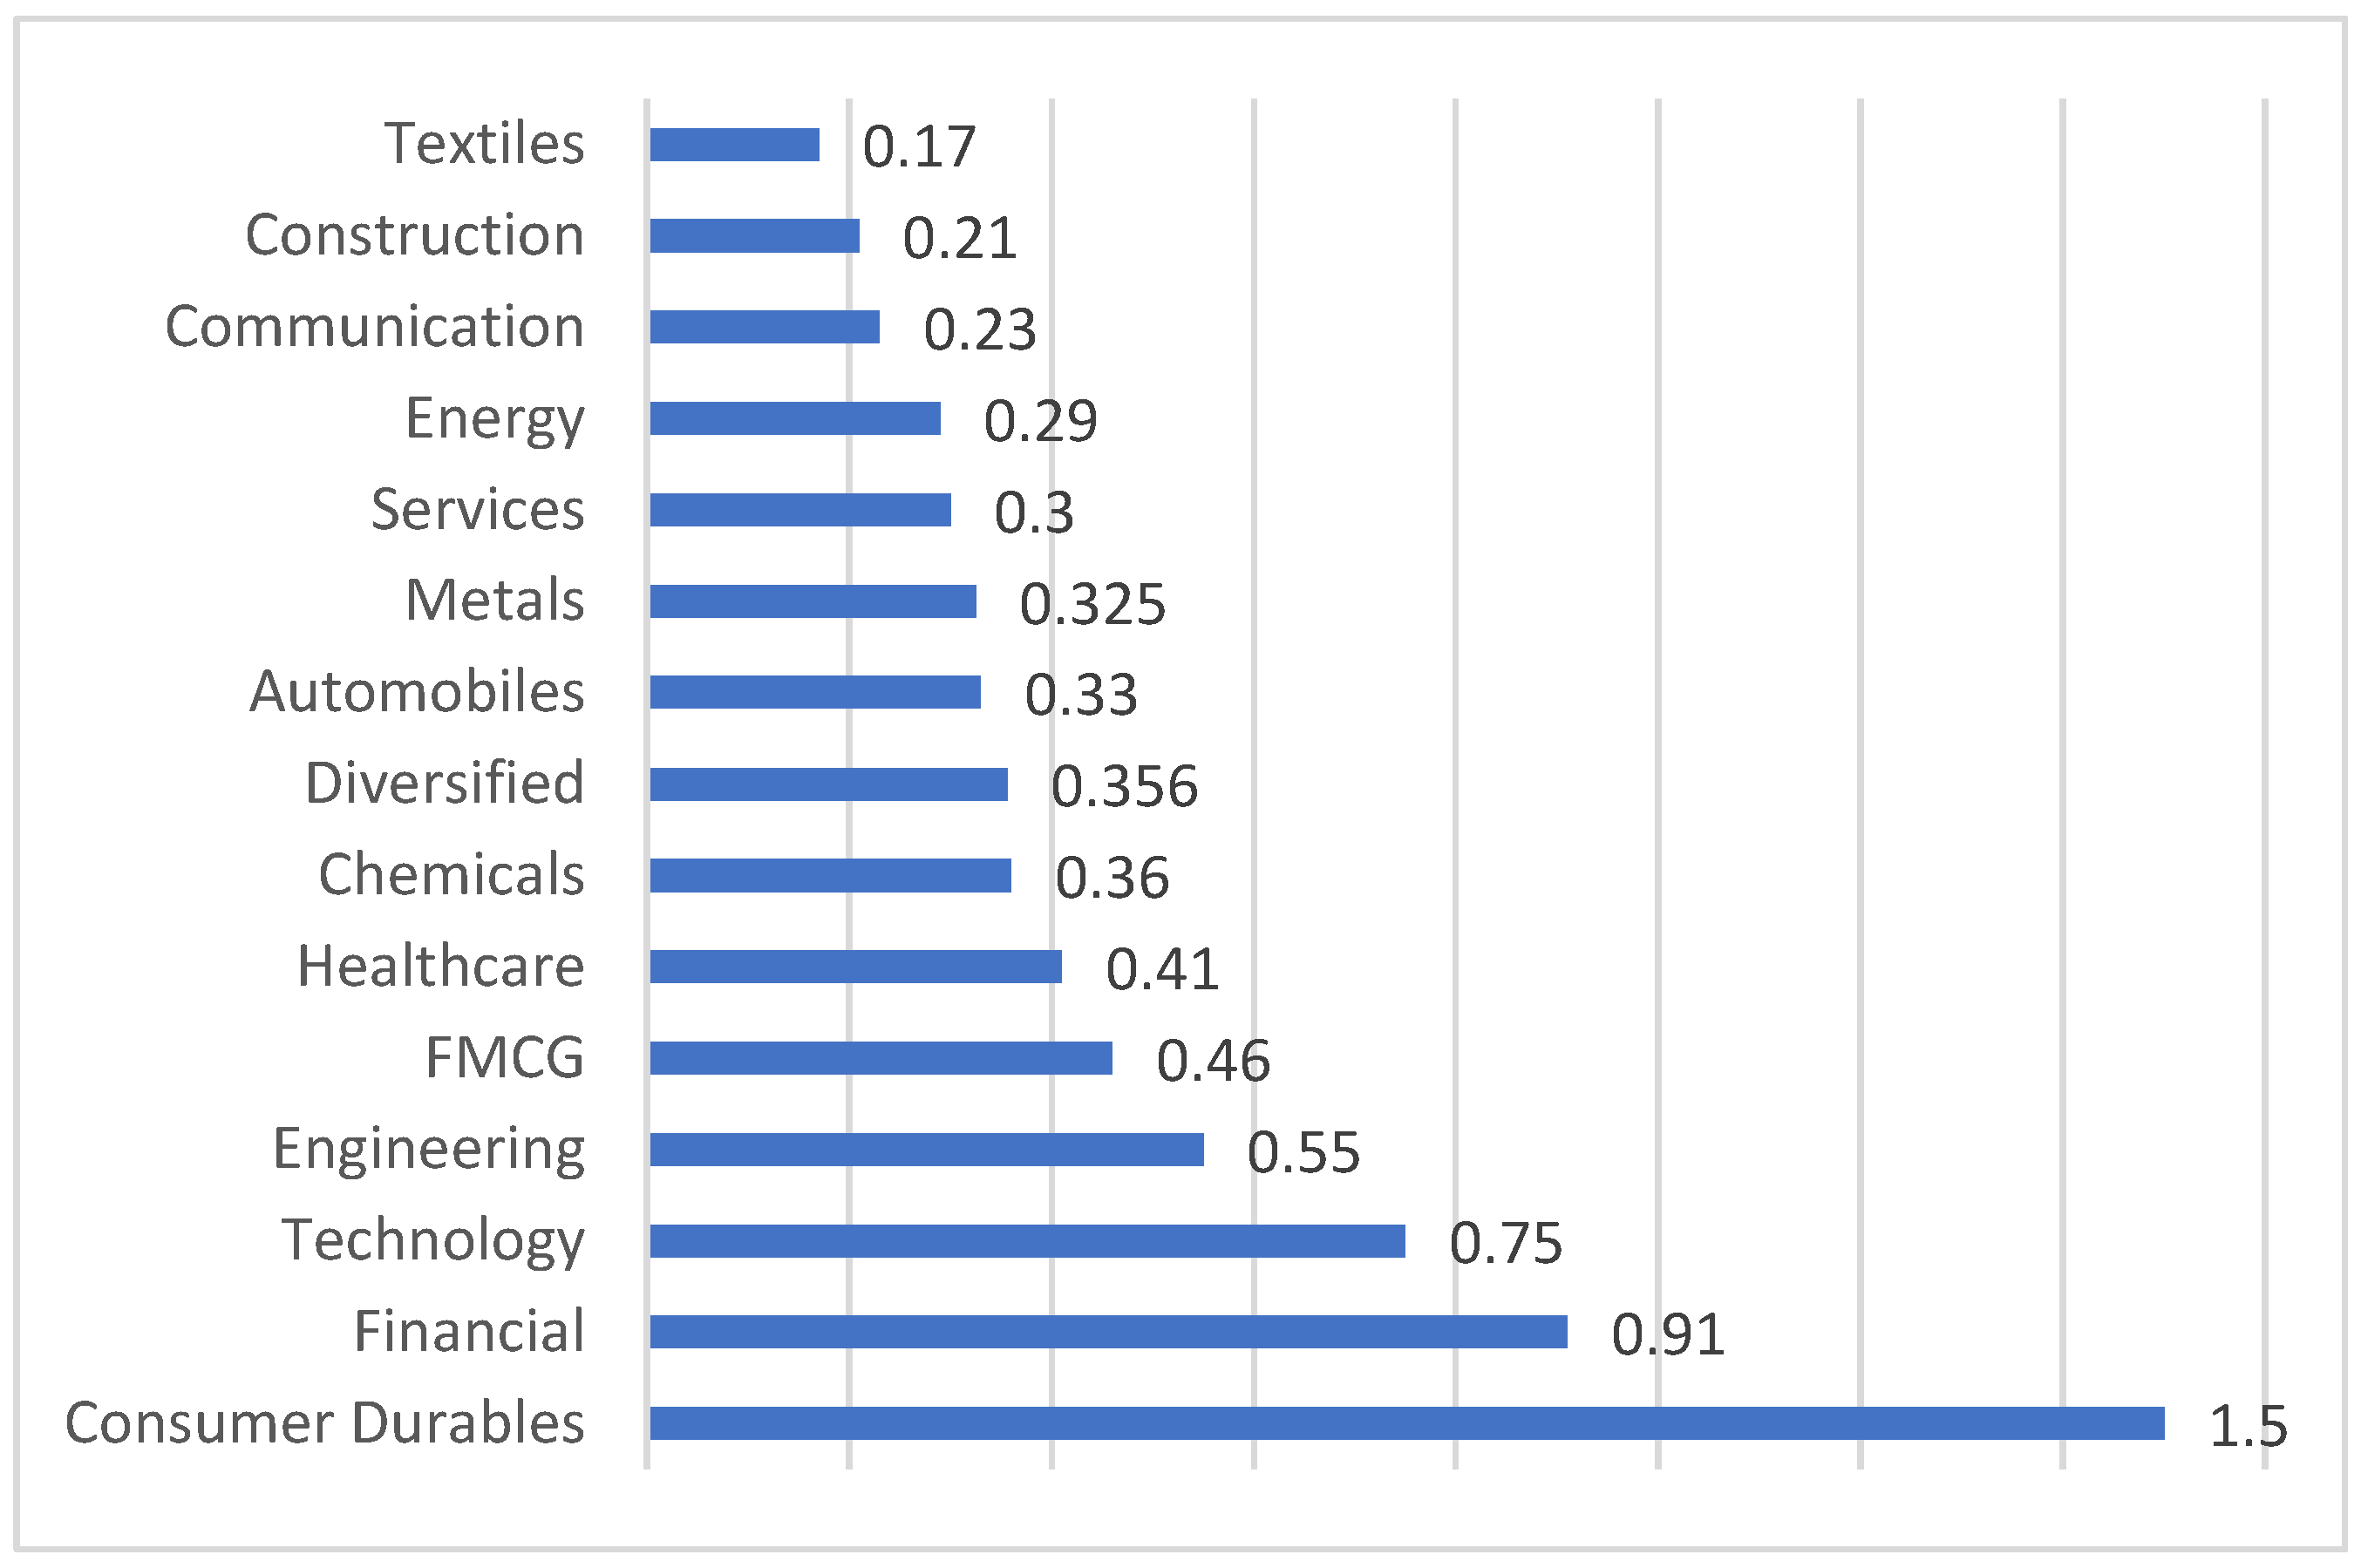
| 1 | Dominance | Highest ranked sector (Consumer Durables) differs by considerable amount from the lowest ranked sector (Textiles). Also, it is noteworthy that the average value of the highest-ranked sector is approximately 14 times that of the lowest-ranked sector. | There is an observable differential scoring pattern in the dominance measure of the sectors. This indicates that the industry sectors within the network exhibit high degrees of heterogeneity. |
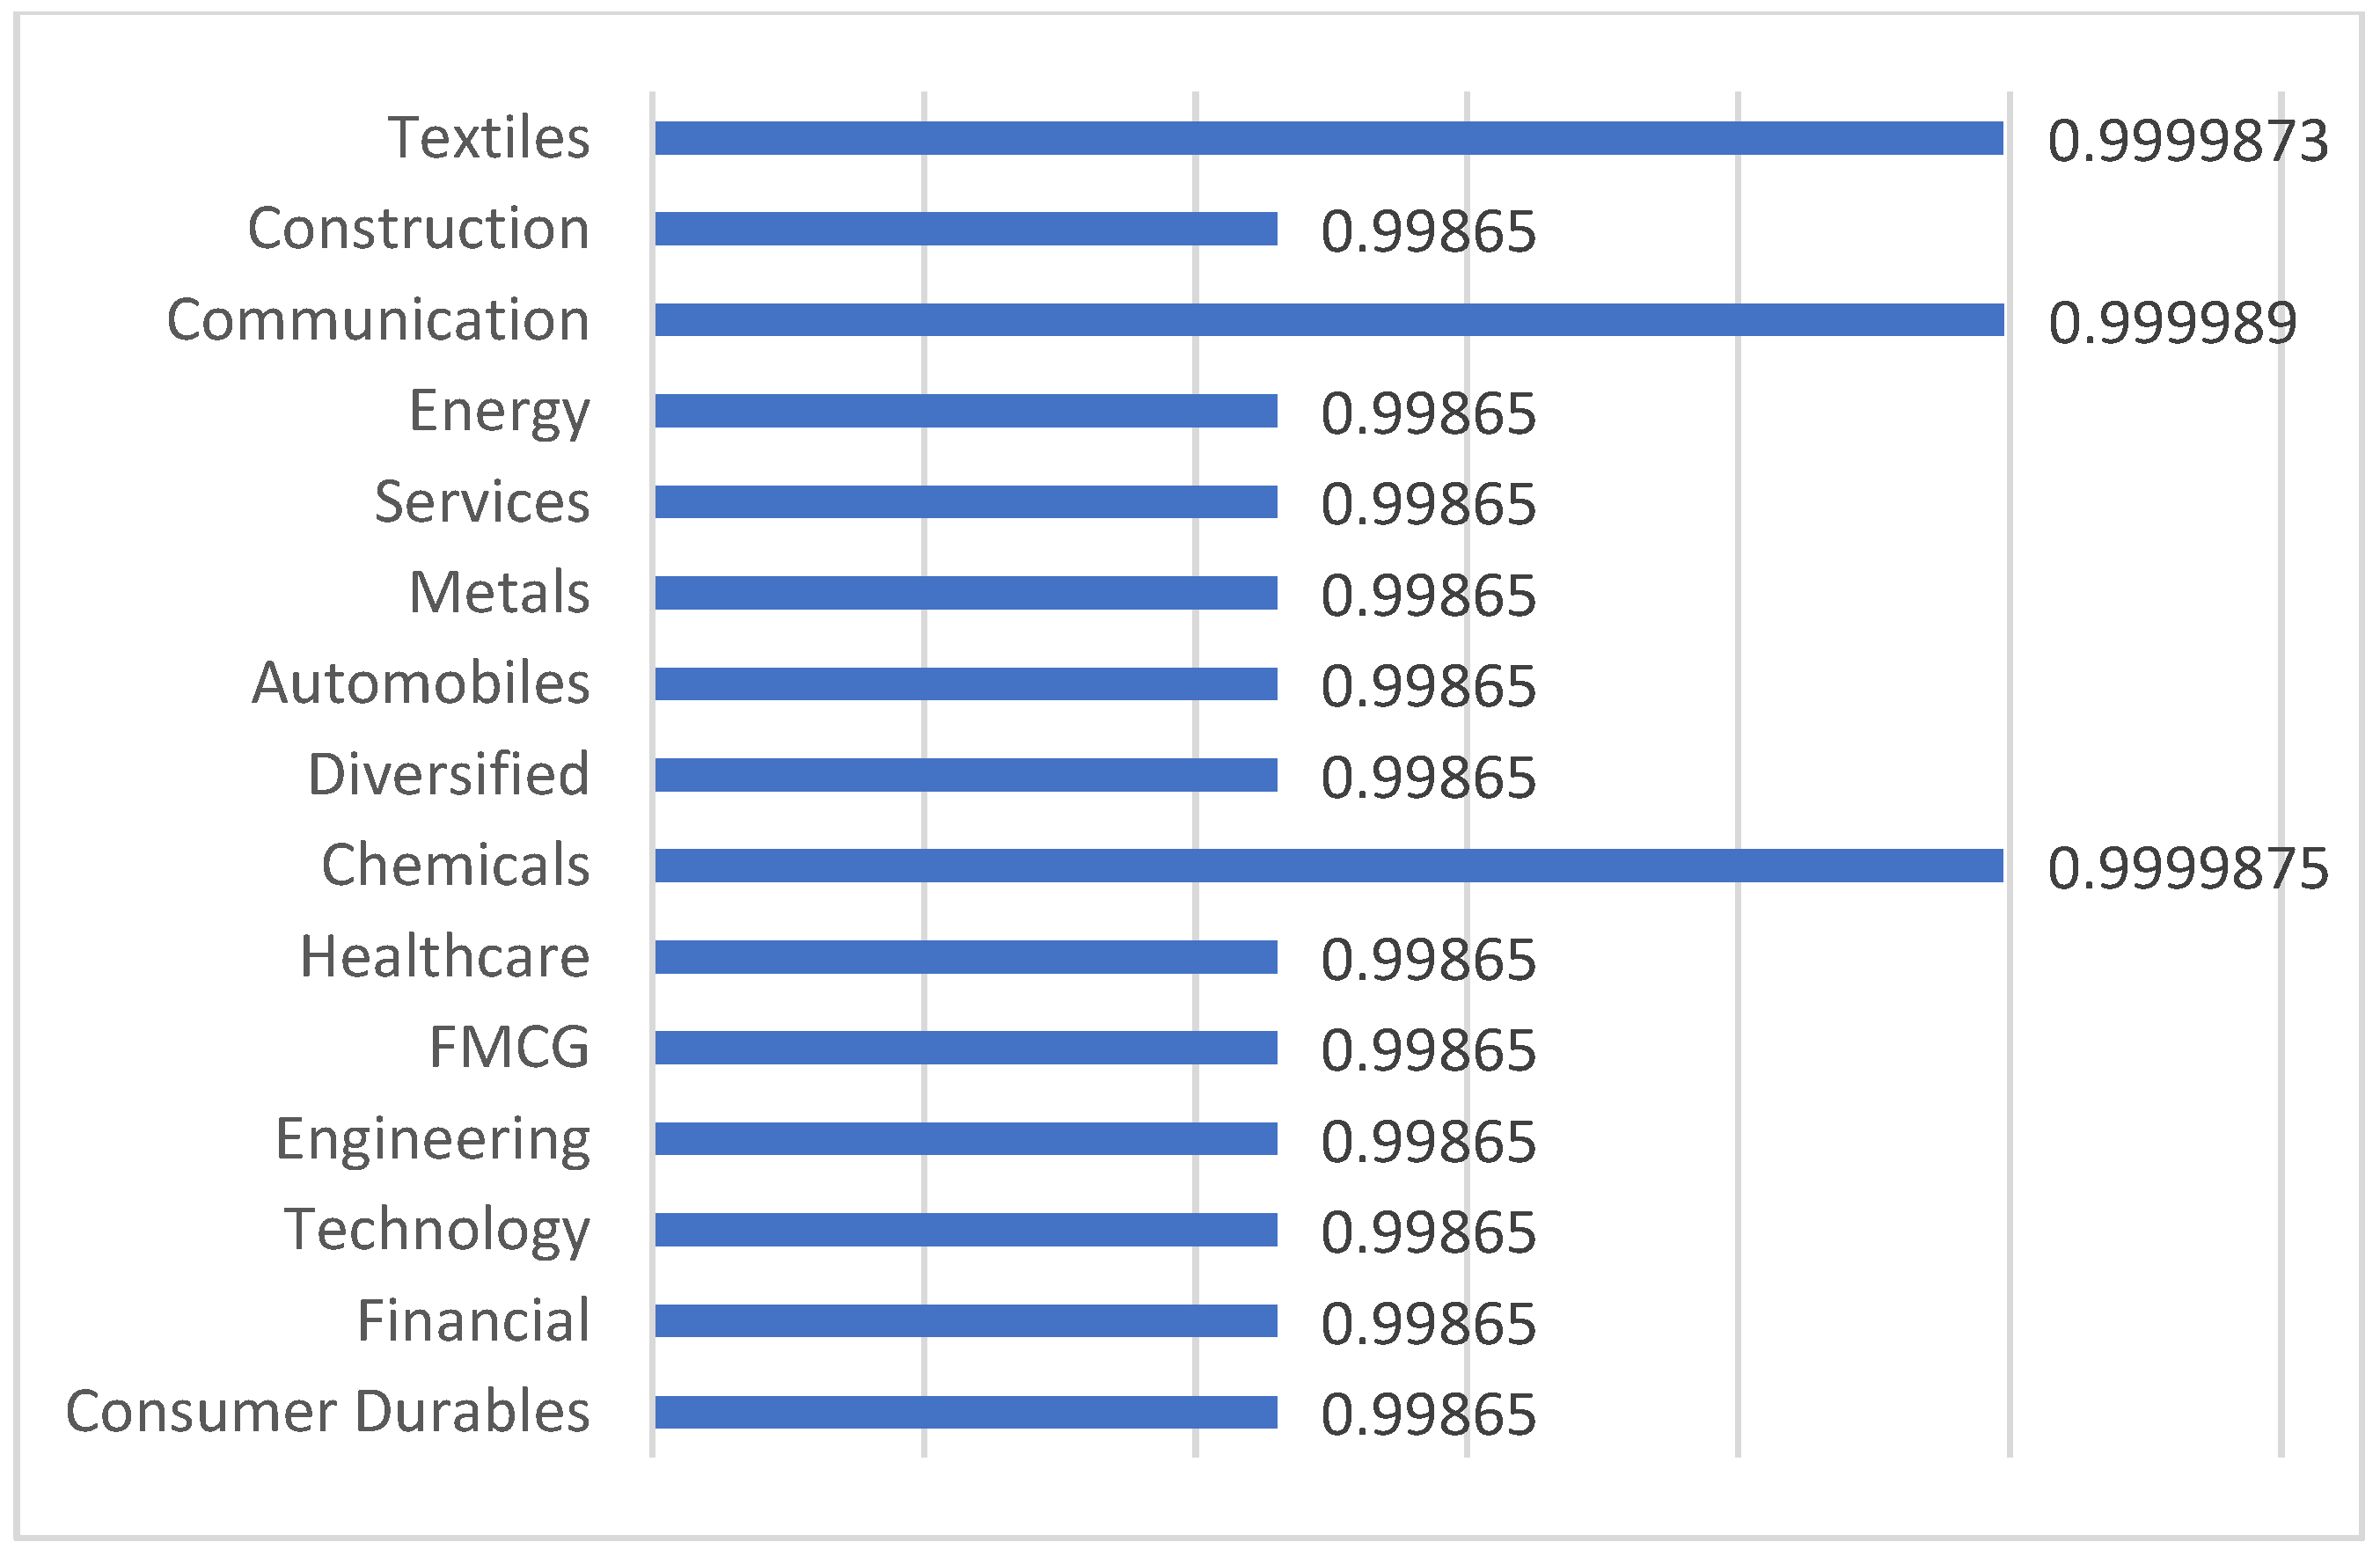
| 2 | Weighted clustering coefficients | Ratio of the highest-ranked sector (communications) to the lowest-ranked sector (financials & others) are close to 1 | Minimal heterogeneity is observed in this measure. |
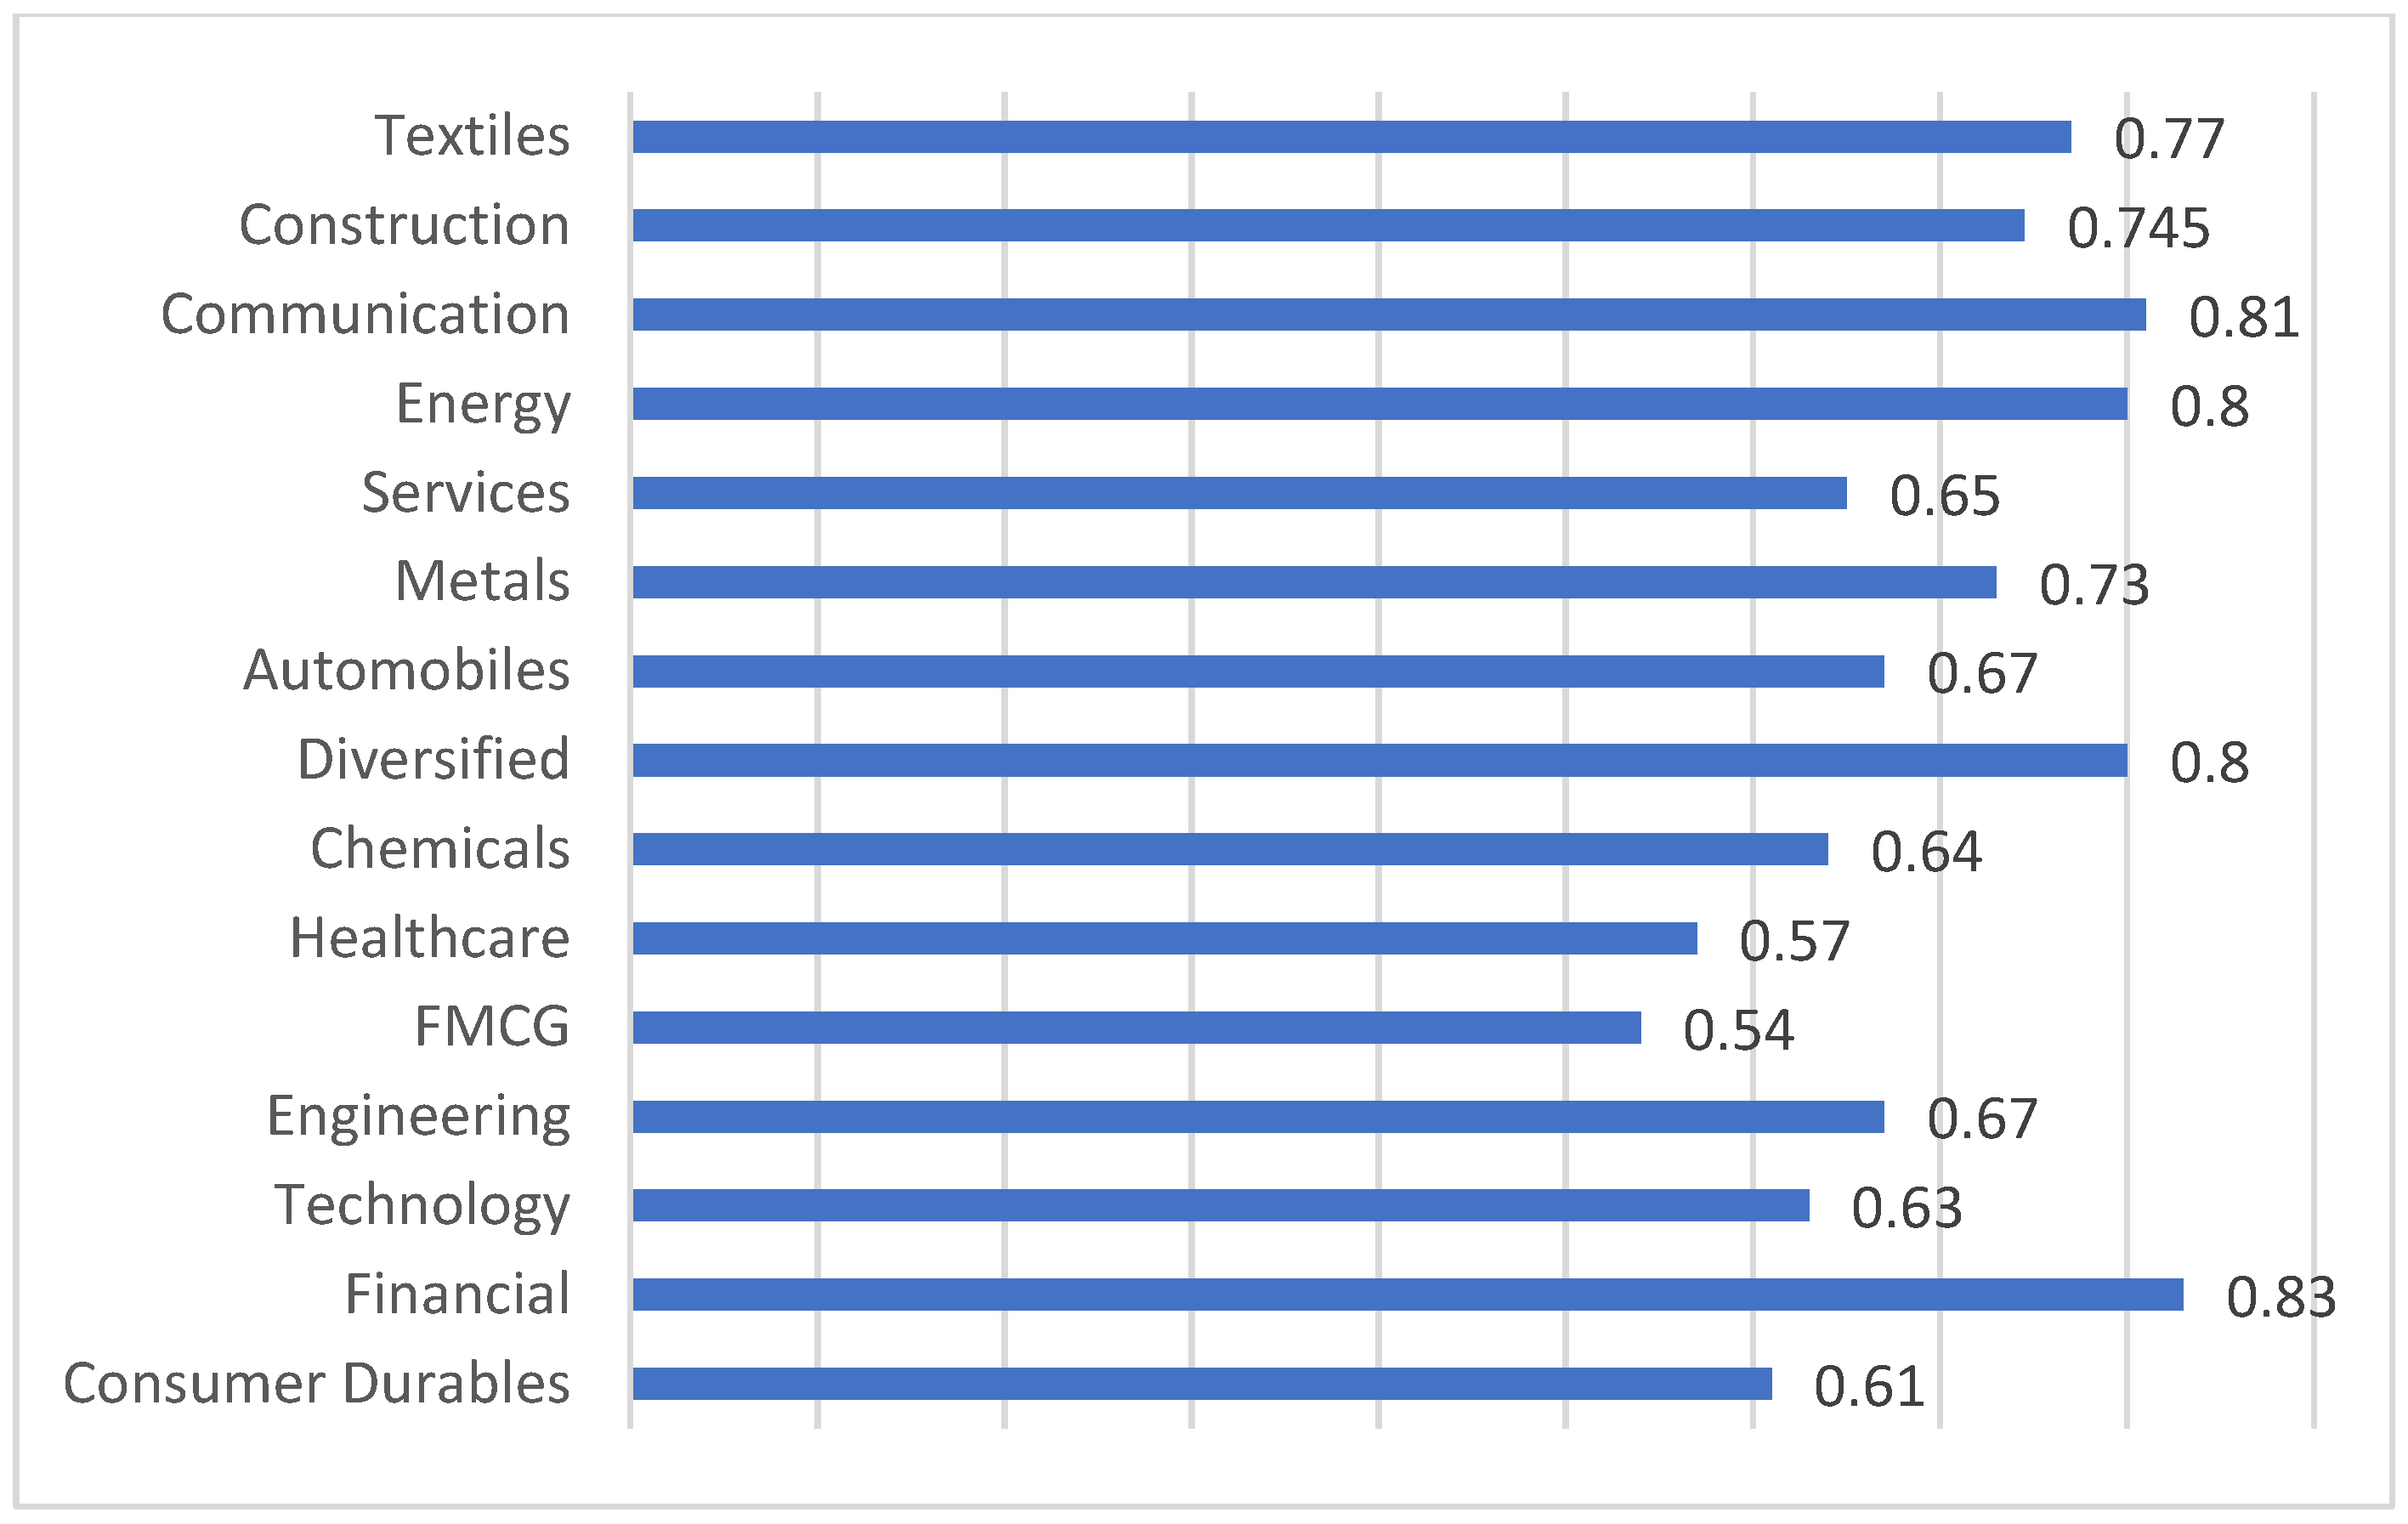
| 3 | Closeness centrality | Highest: financial sector Lowest: Healthcare sector | Higher closeness centrality stocks are strategically positioned, implying that the price fluctuations of these stocks can promptly influence the broader market. |
| 4 | Influence strength | Highest: financial sector Lowest: FMCGs | High influence strength values in the financial sector indicate that the asset returns of its stocks have the greatest direct influence on the asset returns of stocks in other sectors within the study dataset. This high influential pattern may be an outcome of the pivotal role played by financial institutions in the functioning of the overall Indian economy. |
| 5 | Disparity | Technology and healthcare sectors: High values. All other sectors except technology, healthcare, and finance have low disparity values | The high values of disparity in the stocks belonging to the technology and healthcare sectors indicate that the equity returns of these sectoral stocks exhibit low levels of interdependency among themselves and are highly heterogeneous. Thus, they have heterogeneity within themselves. |
| 6 | Eigenvector centrality | Highest: FMCGs sector Lowest: financial sector | Stocks possessing larger value of eigenvector centrality will have larger number of linkages to other high-scoring stocks and vice versa. |
| Sl. No. | Network Metric (or Visualization) | Observation in the Current Study | Observation in the Empirical Study on the Brazilian Market | Observation in the Empirical Study on the South African Market |
|---|---|---|---|---|
| 1 | Euclidian distances (di,j) | 0 to 1.422 | 0 to 1.38 | 0 to 1.456 |
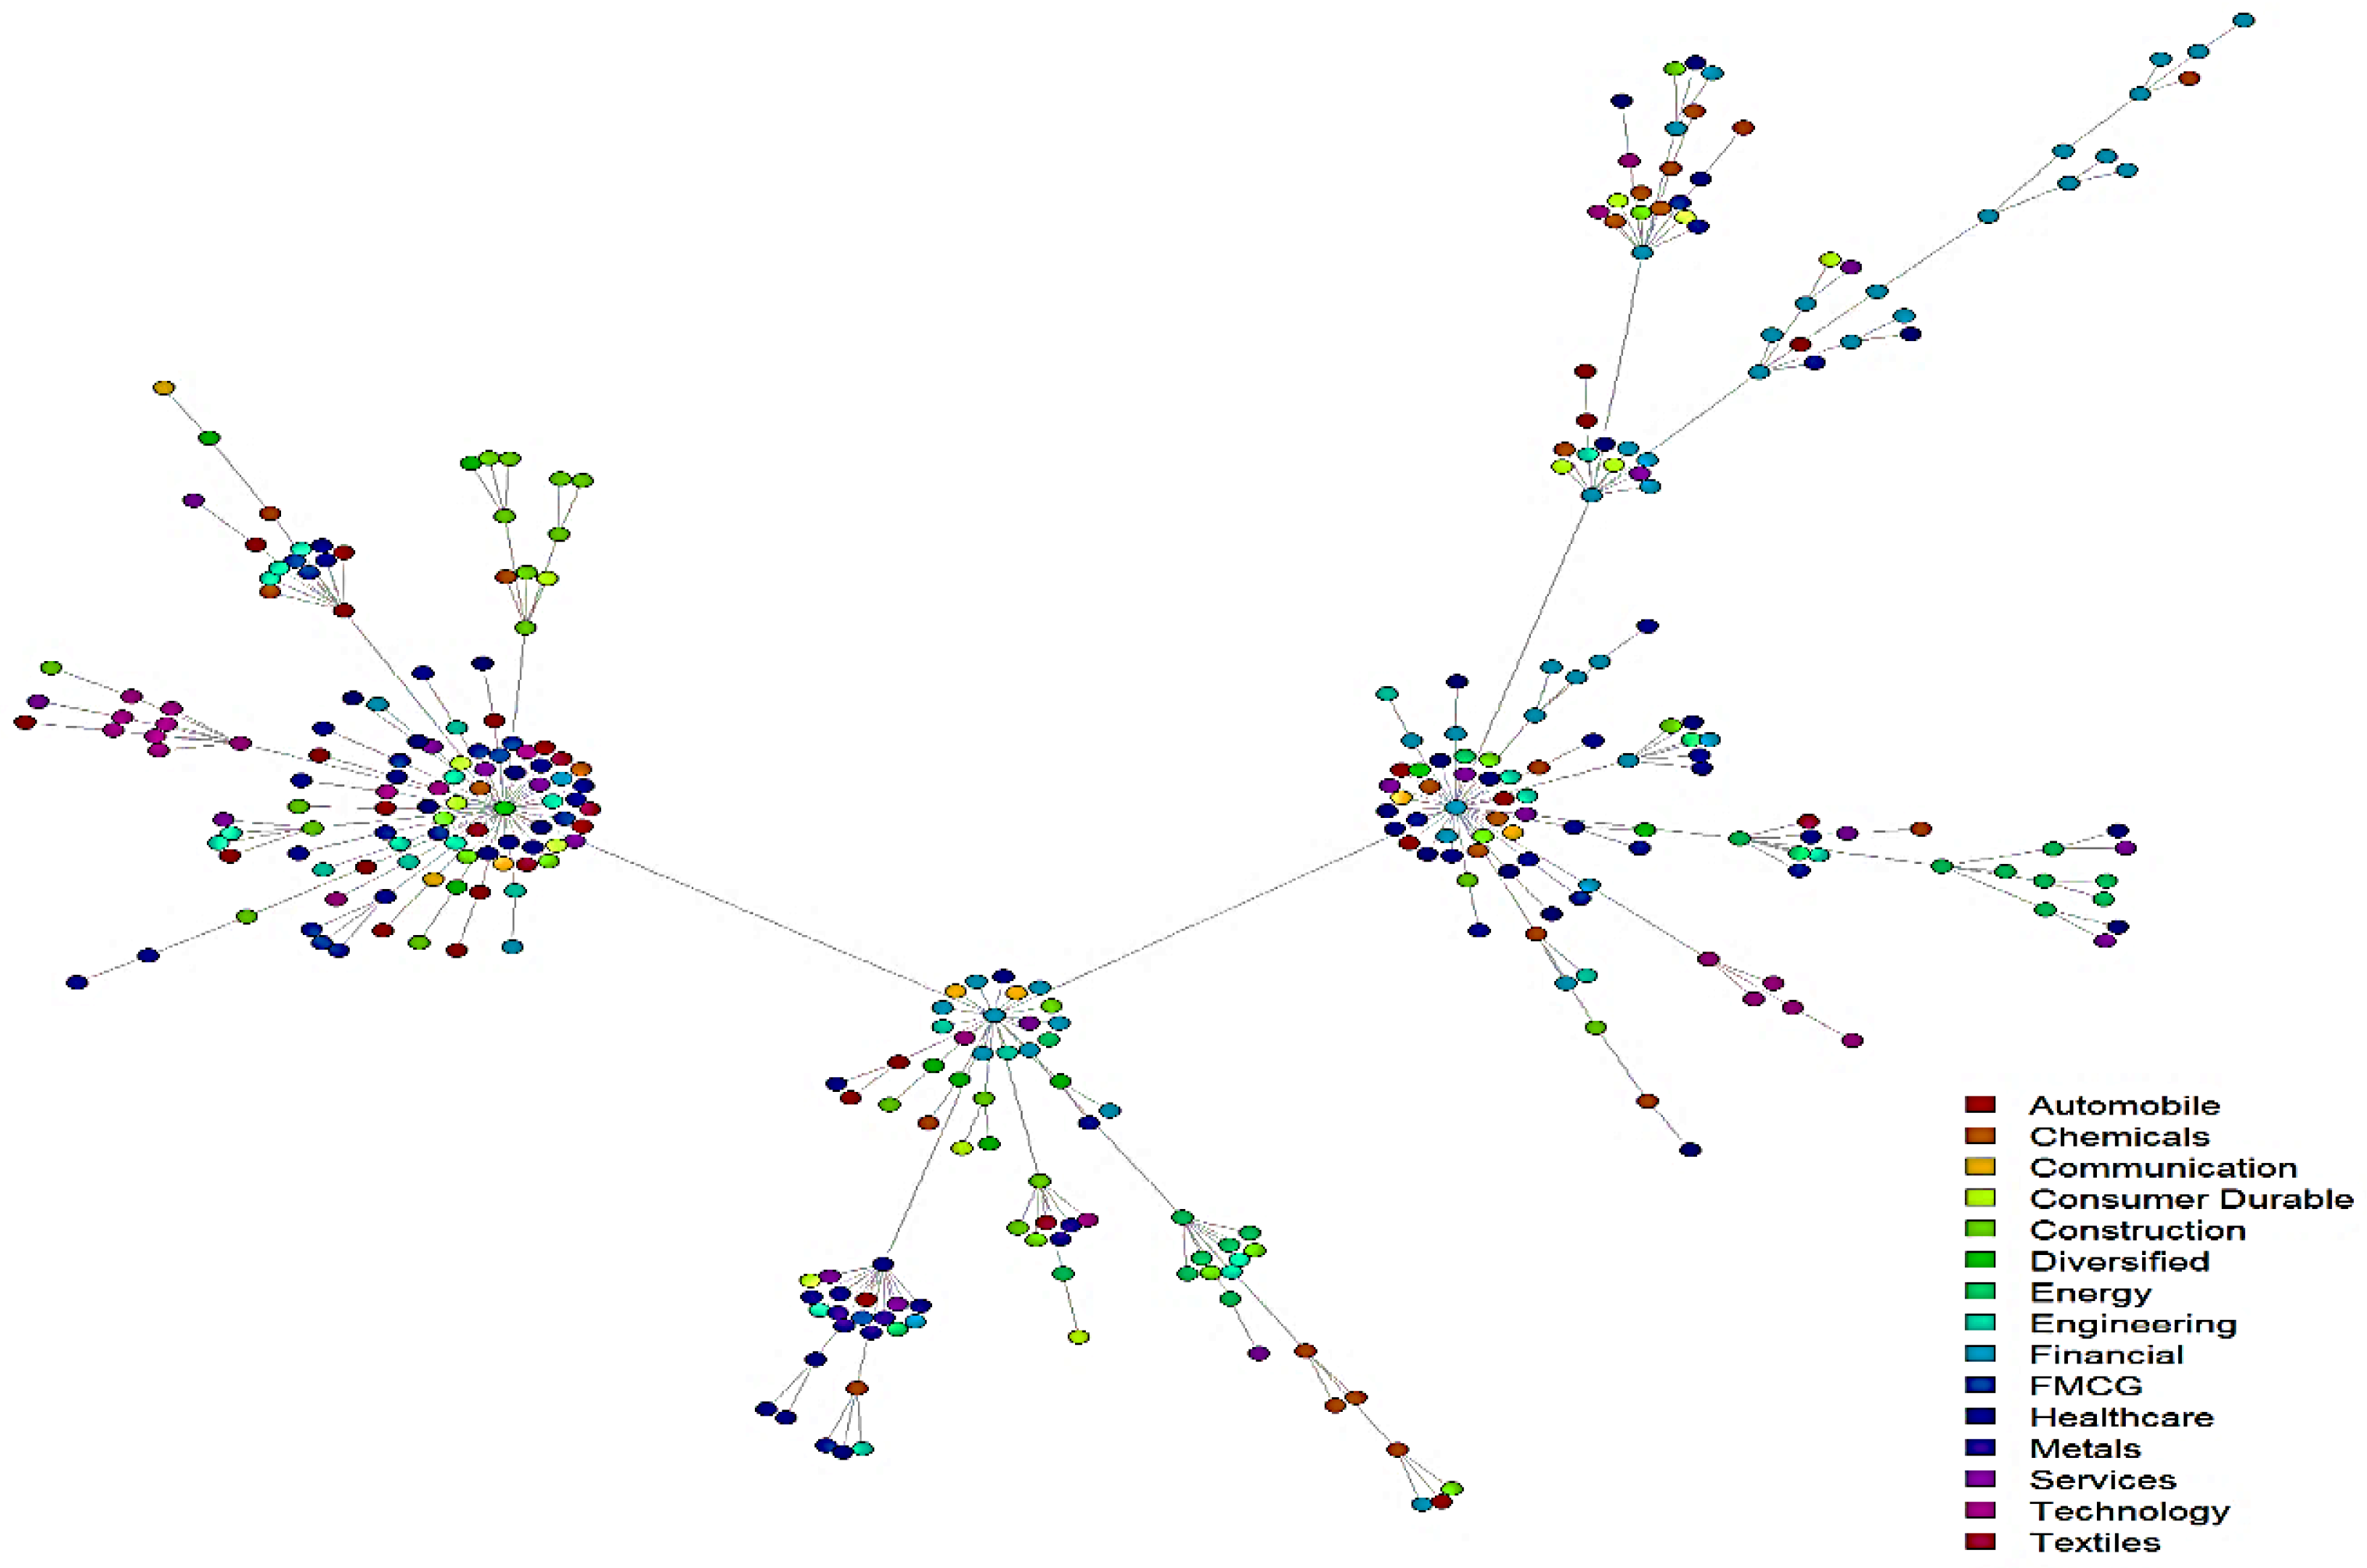
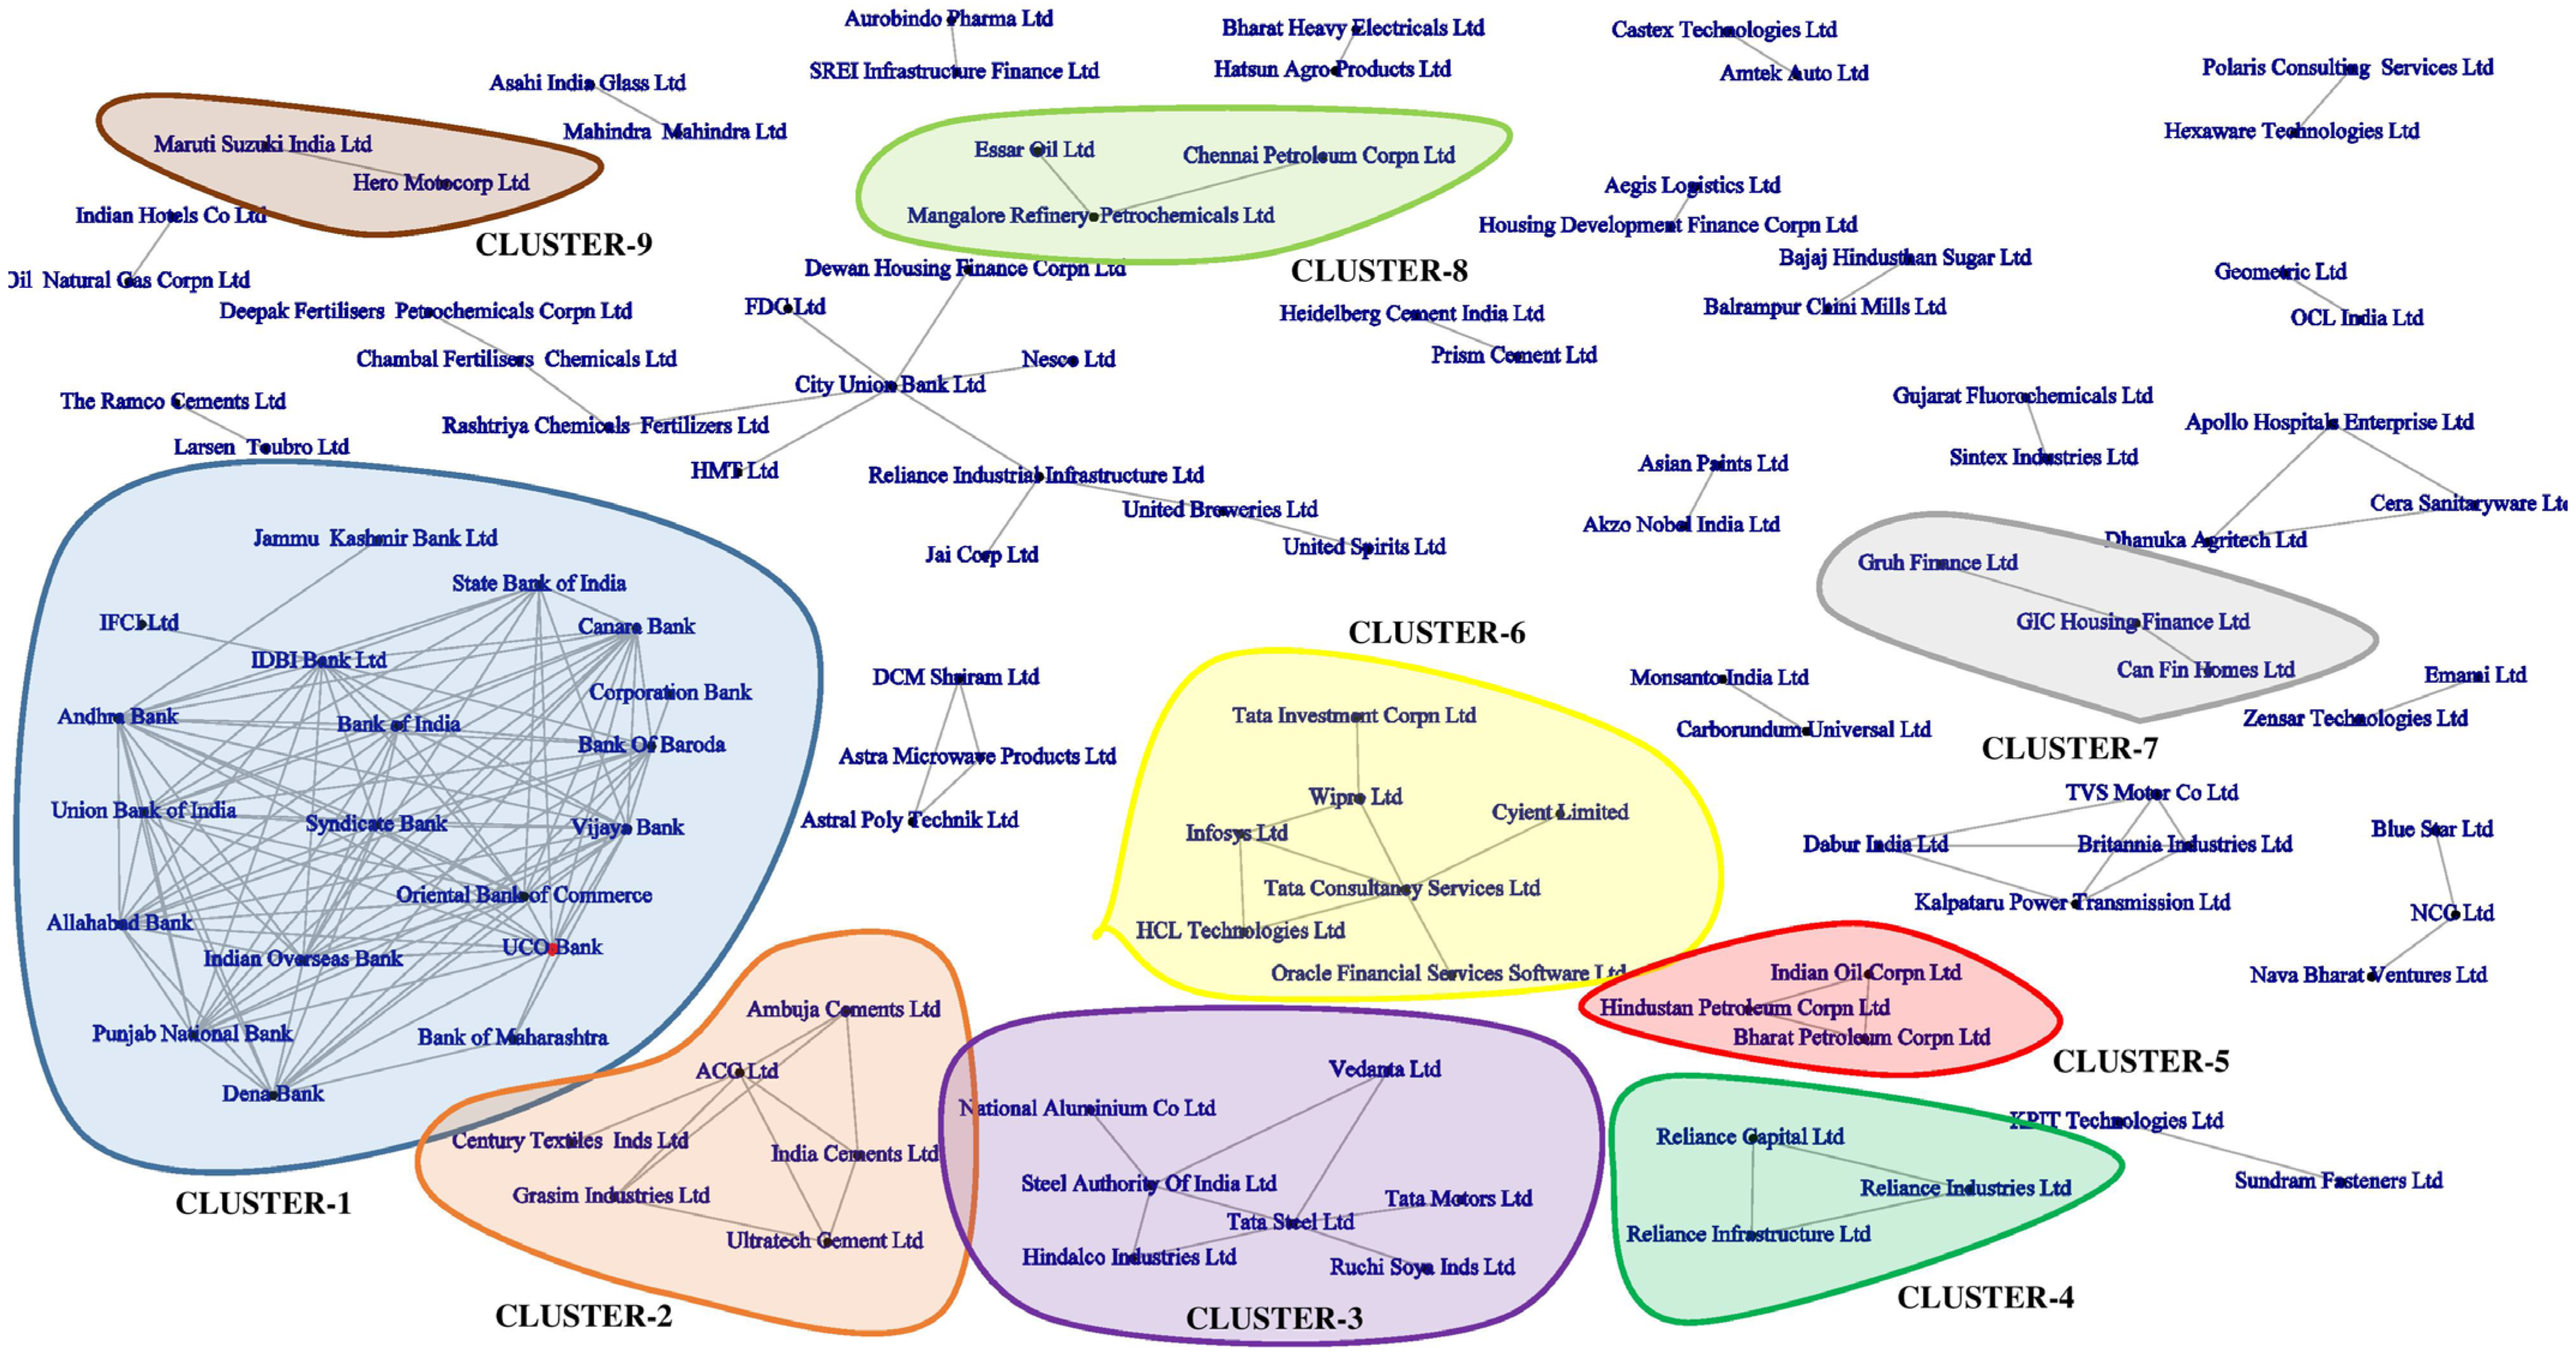
| 2 | MST Visualization | Formation of small local clusters among analogous industry group stocks and a large degree of in-cluster heterogeneity | Large in-cluster homogeneity | Large in-cluster homogeneity |
| 3 | Number of stocks in study dataset (Number of industries represented) | 335 stocks (15 sectors) | 47 stocks (8 sectors) | 100 stocks (9 sectors) |
| 4 | Average dominance strength | Consumer durables sector: highest Financial: second ranked Textiles: lowest | Materials: Highest Industrials: Lowest | Financial: Highest Oil & Gas: Lowest |
| 5 | Average weighted clustering coefficient | Communication, textiles, chemicals: highest Constructions & others: lowest | Financial: Highest Telecommunication: Lowest | Not computed |
| 6 | Average closeness centrality | Finance: highest Healthcare: lowest | Finance: Highest Telecommunication: Lowest | Not computed |
| 7 | Average disparity | Healthcare, technology: highest Textiles and others: lowest | Energy: Highest Telecommunication: Lowest | Not computed |
Disclaimer/Publisher’s Note: The statements, opinions and data contained in all publications are solely those of the individual author(s) and contributor(s) and not of MDPI and/or the editor(s). MDPI and/or the editor(s) disclaim responsibility for any injury to people or property resulting from any ideas, methods, instructions or products referred to in the content. |
© 2025 by the authors. Licensee MDPI, Basel, Switzerland. This article is an open access article distributed under the terms and conditions of the Creative Commons Attribution (CC BY) license (https://creativecommons.org/licenses/by/4.0/).
Share and Cite
Bhattacharjee, B.; Maiti, M. A Study on the Topological Insights and Network Visualization Mapping of the Indian Equity Market. Risks 2025, 13, 76. https://doi.org/10.3390/risks13040076
Bhattacharjee B, Maiti M. A Study on the Topological Insights and Network Visualization Mapping of the Indian Equity Market. Risks. 2025; 13(4):76. https://doi.org/10.3390/risks13040076
Chicago/Turabian StyleBhattacharjee, Biplab, and Moinak Maiti. 2025. "A Study on the Topological Insights and Network Visualization Mapping of the Indian Equity Market" Risks 13, no. 4: 76. https://doi.org/10.3390/risks13040076
APA StyleBhattacharjee, B., & Maiti, M. (2025). A Study on the Topological Insights and Network Visualization Mapping of the Indian Equity Market. Risks, 13(4), 76. https://doi.org/10.3390/risks13040076