Article

Dynamic Shock-Transmission Mechanism Between U.S. Trade Policy Uncertainty and Sharia-Compliant Stock Market Volatility of GCC Economies

by
Mosab I. Tabash
1,*,
Suzan Sameer Issa
2,
Marwan Mansour
3,4,
Mohammed W. A. Saleh
5,
Maha Rahrouh
1,
Kholoud AlQeisi
1 and
Mujeeb Saif Mohsen Al-Absy
6
1
Department of Business Administration, College of Business, Al Ain University, Al Ain P.O. Box 64141, United Arab Emirates
2
Faculty of Administrative and Financial Sciences, University of Petra, Amman P.O. Box 961343, Jordan
3
Jadara Research Center, Jadara University, Irbid 21110, Jordan
4
Executive Education, and Professional Development Center, Awang Had Salleh Graduate School, College of Art and Science, Universiti Utara Malaysia (UUM), Kedah Darul Aman 06010, Malaysia
5
Department of Accounting and Auditing, Palestine Technical University-Kadoorie, Tulkarm P.O. Box 7, Palestine
6
Accounting and Financial Science Department, College of Administrative and Financial Science, Gulf University, Sanad 26489, Bahrain
*
Author to whom correspondence should be addressed.
Risks 2025, 13(3), 56; https://doi.org/10.3390/risks13030056
Submission received: 11 January 2025 / Revised: 25 February 2025 / Accepted: 6 March 2025 / Published: 18 March 2025

Abstract

:
This study endeavors to explore the shock-transmission mechanism between Trade Policy Uncertainty (TPU) and the volatility inherent in the Gulf Cooperation Council (GCC) Islamic stock markets by employing the novel Quantile Vector Auto Regression (QVAR) with “Extended Joint” and “Frequency” domain connectedness technique. Overall findings indicated a U-shaped pattern in the shock-transmission mechanism with the higher TPU shocks transmitted towards Islamic stock market volatility at the extreme quantiles and in the long term. The “Extended Joint” QVAR connectedness approach highlights that, in bearish and moderate-volatility conditions (τ = 0.05, 0.50), diversifying portfolios across less shock-prone equity markets like Qatar and UAE can mitigate risk exposure to TPU shocks. Specific economies receiving higher TPU shocks, like Bahrain, Kuwait, and Saudi Arabia, should implement strategic frameworks, including trade credit insurance and currency hedging, for risk reduction in trade policy shocks during the bearish and moderate-volatility conditions. Conversely, Qatar and Kuwait show the least transmission of error variance from TPU during higher-volatility conditions (τ = 0.95). Moreover, the application of the Frequency-domain QVAR technique underscores the need for short-term speculators to exercise increased vigilance during bearish and bullish volatile periods, as TPU shocks can exert a more substantial influence on the Islamic equity market volatility of Bahrain, Oman, Kuwait, and Saudi Arabia. Long-term investors may need to tailor their asset-allocation strategies by increasing allocations to more stable assets that are less susceptible to TPU shocks, such as Qatar, during bearish (τ = 0.05), moderate (τ = 0.50), and bullish (τ = 0.95) volatility.

1. Introduction

The United States finds itself entangled in numerous trade conflicts involving both allies and adversaries. Simultaneously, it is actively engaged in negotiations or terminations of trade agreements with a multitude of trading counterparts (Nantembelele et al. 2023). The influence of the trade war shock on U.S. equity markets can be delineated through two primary mechanisms. Firstly, the growth news channel, influencing shareholders’ growth prospects, and secondly, the mechanism of risk premium, which adjusts risk appetite amid economic uncertainty (Chen et al. 2023). Trade wars, as observed, are marked by the U.S. implementing tariffs and quotas on imports, provoking retaliatory measures from affected nations, and holding the potential for future TPU escalations (Suwanprasert 2022). Noteworthy findings suggest that 2019 witnessed the slowest global growth since the 2008 global financial crisis, attributed to the surge in Trade Policy Uncertainty within the United States (Caldara et al. 2020).
In May 2019, the United States augmented tariffs on Chinese commodities valued at $200 billion, escalating the rates from 10% to 25%. This adjustment was a response to the escalating trade tensions, as reported in the “World Economic Outlook” news release by the International Monetary Fund (IMF) (International Monetary Fund 2019). Subsequently, China’s reaction resulted in a downgrade of growth projections for both China and developing Asian countries. This development aligns with expectations regarding the global economic repercussions stemming from heightened trade tensions and the associated confidence effects (Bonga-Bonga and Mpoha 2024; Lea 2019). Remarkably, extant scholarly literature has not delved into the intricate dynamics of the shock-transmission mechanism that interconnects the volatility of Islamic stock markets within the GCC nations with the uncertainty shocks emanating from U.S. trade policy.
The impetus to scrutinize the transmission of shocks between GCC financial market volatility and U.S. trade policy uncertainties is substantiated in various instances. In 2015, the “Joint Comprehensive Plan of Action” regarding Iran’s nuclear program had repercussions on the economic connections between the United States and the GCC (Khodadadi 2018). From 2014 to 2016, considerable oil price oscillations influenced both trade policies (Song et al. 2023) and the oil-dependent economies of Gulf nations. In the year 2017, a diplomatic discord unfolded when numerous Gulf countries, such as Bahrain, Egypt, Saudi Arabia, and the UAE, terminated their connections with Qatar (Selmi and Bouoiyour 2020). Simultaneously, the Trump administration imposed global-scale trade regulations in the same year, including tariffs on steel and aluminum (Caldara et al. 2020). The Abraham Accords, facilitating the normalization of relations between Israel, the UAE, and Bahrain, exert indirect impacts on regional trade dynamics within the Gulf Cooperation Council. The global pandemic, starting its impact in late 2019, led to far-reaching economic consequences (Suleman et al. 2023b). Against this backdrop, the articulation of U.S. politicians’ prospective trade policies during the presidential election campaign added complexity to potential alterations in Trade Policy Uncertainty (TPU), exacerbating existing uncertainties (Noland 2018). In reaction to Saudi Arabia’s current resolution to reduce its oil production, legislators affiliated with the Democratic Party have purposed for a cessation of armaments relocations and military support to the country. This decision is seen as a diplomatic rebuff to the United States and is anticipated to result in increased expenses for Western countries (Mueller 2022).
A contraction in the export market results in a diminished pool of exporters, leading to a decrease in capital accumulation (Caldara et al. 2020). The TPU shocks can alter demand dynamics, favoring domestically produced items and disrupting imports to the U.S. from other nations (Yu et al. 2023). The expectation of heightened TPU, manifested as anticipated future tariff increases, affects various economic indicators, including inflationary pressure, fluctuations in currency rates (Byrne et al. 2008), and instability in equity markets (He et al. 2021). Caldara et al. (2019) argue that elevated TPU shocks result in enduring adverse consequences on financial investments and global economic activity. Bloom (2014) posits that increased TPU may prompt businesses to postpone investments, reduce employment, and undermine investor confidence and expenditure, ultimately slowing down global economic activity. Additionally, Nantembelele et al. (2023) demonstrated how tariff increases led to trade diversion and creation for emerging economies, concurrently exerting a detrimental impact on trade volume and economic development in both the U.S. and China.
Motivated by the previously mentioned discoveries, the first objective is to reconnoiter the dynamic process of shock propagation between Trade Policy Uncertainty (TPU) shocks originating from the United States and the fluctuation in Sharia-compliant stock markets within Gulf Cooperation Council (GCC) member nations. This examination encompasses various quantiles, specifically assessing the TPU shock transmission towards bullish, moderate, and bearish stock volatility conditions, alongside varying degrees of TPU intensity. A second objective is to explore the dynamic shock-transmission mechanism between TPU and the conditional volatility of Islamic stock markets in the GCC region across different quantiles and frequency wavelengths, considering both short- and long-term time periods. This research holds significance in guiding financial market participants in the GCC region in strategic asset allocation. Analyzing the impact of TPU shocks on stock market volatility under diverse conditions and time frames provides valuable insights for both short-term speculators and long-term shareholders to adjust their investment strategies judiciously. In the prevailing context of unpredictable international trade dynamics, confirming the connection between trade uncertainty and volatility within Islamic stock markets takes on heightened significance. This is particularly crucial, given the context of the bilateral trade association between the GCC and the U.S. The comprehension of the dynamic interplay between Islamic stock return volatility and TPU is particularly advantageous for exporters, importers, speculators, and long-term shareholders in making well-informed investment decisions across a spectrum of stock market volatility conditions and investment time horizons.
This study advances the existing literature in different manners. Firstly, in the existing literature, previous studies have predominantly focused on the symmetrical shock-transmission mechanisms between equity market returns and U.S. economic policy uncertainty (Smales 2020; Hu et al. 2024; Shi and Wang 2023), as well as the transmission of shocks between emerging and developed financial markets and U.S. financial system stress (Altınkeski et al. 2024). However, a notable gap exists in the exploration of the dynamic shock-transmission mechanism between TPU and the volatility of Islamic financial markets in GCC member economies. Previous investigations have predominantly concerted on the symmetrical shock propagation mechanisms between TPU shocks originating from the U.S. and the equity returns of either the U.S. or China. Notably, certain studies have highlighted the deleterious repercussions of TPU on the U.S. stock market equity premium (Li et al. 2022) and its capacity to significantly impact stock liquidity and increase the stock price crash risk in China, thereby diminishing the risk-taking initiative of financial institutions (Hu et al. 2024). More recently, He et al. (2021) employed the symmetrical TYP-VAR and found that U.S. trade policy shocks have favorable effects on U.S. stock market returns while negatively affecting China’s equity market indices. Similarly, according to Crowley et al. (2018), Chinese companies exhibit a reduced likelihood of entering new markets in the presence of elevated TPU shocks. Additionally, Bianconi et al. (2021) observed that, despite the absence of evidence indicating compensation for undertaking such risk, recent studies have demonstrated significant tangible consequences of TPU shocks on trade, employment, and investment. Secondly, this study employs Quantile Vector Auto Regression (QVAR) with the “Extended Joint” connectedness framework by Cunado et al. (2023) to explore the extreme shock transmission between TPU and conditional volatility in GCC Sharia-compliant financial markets. An enhanced standardization strategy improves the precision of results in this upgraded connectedness method (Cunado et al. 2023). This sets it apart from GVAR-based “joint” connectedness (Lastrapes and Wiesen 2021), traditional GVAR connectedness (Diebold and Yilmaz 2009, 2012), and TYP-VAR connectedness methods (Antonakakis et al. 2020), incorporating a normalization method based on R 2 . In contrast to “joint” connectedness approach of Lastrapes and Wiesen (2021), the “Extended Joint” approach captures the network of “net pairwise dynamic connectedness”, estimating a graphical representation of shock transmitters and absorbers across quantiles. However, QVAR with “Extended Joint” connectivity does not investigate shock transmission over different frequency wavelengths (higher and lower). In order to tackle this, we combine the frequency-domain connectedness technique developed by Baruník and Křehlík (2018) with the conventional QVAR methodology of Ando et al. (2022) and Chatziantoniou et al. (2021), adhering to the methodological criteria provided by Chatziantoniou et al. (2022). Given divergent results over short- and long-term periods, strategic portfolio diversification benefits both long-term investors and short-term speculators. Under various volatility scenarios (quantiles) and time durations (higher and lower frequencies), diversification helps distribute risk, potentially mitigating negative effects of trade policy uncertainty.
The choice to employ quantile domain connectedness approaches is grounded in the recognition that relying solely on conditional mean model results and the informational content of low-frequency variables provides inadequate support for exploring robust and credible connectedness patterns among financial variables (Iacopini et al. 2023). Considering the potential for substantial fluctuations in the cause-and-effect connection between the tails of the distribution and its central region, it is crucial to acknowledge that the conditional mean signifies just a single element of the conditional distribution across various quantiles (Benkraiem et al. 2018; Suleman et al. 2022). This acknowledgment aligns with the understanding that structural breakdowns are now widely acknowledged as an integral aspect of time series in the economy (Demirer et al. 2018). Such breakdowns are frequently associated with significant international events, such as TPU (Hau et al. 2022). The identification of an asymmetric or uneven shock-transmission mechanism between TPU and conditional risk in financial markets (Hau et al. 2022) may be attributed to the ensuing nonlinearities in the dynamics of time series data.
The findings based upon the Extended Joint QVAR connectedness approach suggested that during the bearish and moderate conditional volatility conditions ( τ = 0.05 , 0.50 ) , investors should consider diversifying their portfolios by spreading investments across different asset classes and financial markets of different geographic region that showed lower shock-reception capability from TPU shocks. This includes the financial markets of Qatar and U.A.E. to reduce risk exposure to TPU as these markets received lower error variances from TPU. The specific economies like Kuwait, Bahrain, and Saudi Arabia should establish policy guidelines and a strategic framework for businesses to access risk-mitigation tools such as trade credit insurance and currency hedging to reduce exposure to trade policy shocks during the bearish and moderate-equity market conditional risk. However, during the bullish conditional risk conditions ( τ = 0.95 ), economies receiving the higher TPU shocks, such as UAE, Bahrain, and Saudi Arabia, should develop and maintain real-time monitoring systems to promptly detect and respond to shifts in trade policy uncertainty, enabling proactive risk-mitigation measures. Moreover, ethical investment strategies adhering to Sharia principles should be crafted considering the specific volatility conditions in Islamic financial markets. To illustrate, during periods of lower volatility (quantiles), the conditional volatility in the Islamic financial markets of Qatar and U.A.E exhibited the smallest error variances resulting from TPU shocks. Conversely, in times of higher volatility (bullish conditions), TPU shocks led to the least transmission of error variance in the conditional volatility of Qatar and Kuwait. Therefore, GCC investors should consider the bearish, bullish, and moderate fluctuations in equity market conditional volatility when developing hedging strategies to mitigate the impact of heightened TPU shocks. Meanwhile, speculators in the GCC region should evaluate investment opportunities based on bearish, bullish, and moderate-equity market volatility trends and integrate quantile-based hedging techniques into their forecasting models to better predict the adverse effects of TPU shocks.
The justification for an intensified transmission of TPU shocks to the GCC stock markets stems from the substantial influence of global economic expansion on the profitability of companies and government revenue within these nations. The financial outcomes in question are primarily shaped by variables such as oil prices and exports. A myriad of international macroeconomic linkages, encompassing cross-border trade, foreign direct investments, and monetary policies, collectively contribute to the dissemination of information, as delineated by scholarly works (Crowley et al. 2018; Bao et al. 2022). Given the GCC economies’ fixed exchange rates to the US dollar, necessitating spillover of shocks from US trade policies, a consequential relationship emerges with the potential shocks in US market. As a result, various mechanisms come into operation, and fluctuations in U.S. and other global stock markets may exert an influence on the volatility of the GCC Sharia-compliant stock market, as articulated in academic research. This underscores the imperative for a nuanced comprehension of the intricate dynamics at play and their implications for the transmission of TPU shocks in GCC stock markets.
Furthermore, the Extended Joint QVAR connectedness approach indicates that the TPU shocks from the U.S. at higher quantiles ( τ = 0.95 ) affected the conditional volatility in Bahrain, Oman, U.A.E, and Saudi Arabia more adversely as compared with median ( τ = 0.95 ) and bearish quantiles ( τ = 0.05 ) . In 2018, Trump imposed international tariffs on aluminum and steel, which saw a reduction towards the end of his presidency (Sachdev and Rao 2025). However, Biden reinstated them in February 2021 due to concerns about their adverse effects on American sectors and trade clarity1. Despite strong U.S.-U.A.E. diplomatic ties and the crucial role of steel and aluminum trade for both economies and national security, the U.S.-U.A.E. Business Council opposed the imposed levies (U.S.-U.A.E. Business Council 2024). Moreover, trade conflicts notably affect Arab nations’ economies, evident in the decline of oil prices since March 2018 despite supply shocks from oil embargoes with Venezuela and Iran. Oil prices fell from approx. $68 per barrel in May 2018 to approx. $55 per barrel in August 2019.
Moreover, our findings, which relied on the frequency-based QVAR technique, also purpose several applied insinuations. In the short term, especially at extreme higher and lower quantiles ( τ = 0.95 ,   0.05 ) , TPU shocks result in the most substantial propagations of shocks in the conditional volatility of Bahrain, Oman, Kuwait, and Saudi Arabia. For instance, at lower (higher) quantiles, TPU shocks led to the highest forecast error variances of 0.28%, 0.20%, 0.18%, and 0.28% (0.89%, 0.81%, 0.82%, and 0.80%) in the conditional volatility of Bahrain, Oman, Kuwait, and Saudi Arabia’s Sharia-compliant financial markets, respectively. This underlines the necessity for risk managers and short-term speculators to exercise increased vigilance during bearish and bullish conditional risk periods, as TPU shocks can exert a more substantial and immediate influence on the financial market volatility in Bahrain, Oman, Kuwait, and Saudi Arabia. It may necessitate adjustments in their risk-management and portfolio strategies accordingly. Whereas long-term investors should incorporate periodic portfolio rebalancing into their investment strategy. Rebalancing can help maintain a desired risk-return profile by adjusting portfolio allocations and investing in Sharia-compliant financial markets of Qatar as the conditional risk of the financial market of Qatar received the lowest spillover of shocks from TPU during the bearish, bullish, and moderate conditional risk conditions. Furthermore, during the bullish volatility conditions, the equity market of Qatar also received the lowest error variances from the TPU shocks in the short term. Long-term investors may need to adjust their asset-allocation strategies by reducing exposure to Sharia-compliant financial markets in Bahrain, Oman, and Saudi Arabia during periods of bearish volatility, as well as limit their investments in Bahrain and the UAE’s equity markets during phases of heightened conditional risk (higher quantiles). Conversely, they may consider increasing their allocations to more stable assets, such as Qatar’s Sharia-compliant financial market, to enhance portfolio resilience. These findings highlight the critical role of strategic asset allocation, a fundamental principle in modern portfolio theory.
The paper’s structure is as follows: Section 2 explores the economic rationale for extreme shock transmission between TPU and financial markets. Section 3 and Section 4 cover data aspects and the chosen research methodology. Section 5 discusses research findings and their practical implications, and Section 6 concludes with remarks and proposes future research directions.

2. Literature Review

Transmission Mechanism Between Trade Policy Uncertainty (TPU) Shocks and Financial Markets

The fortification of global financial sector integration is facilitated through the establishment of free trade zones, which possess the capacity to diffuse trade shocks emanating from a specific region to other global regions (Bloom 2009). The indeterminate decisions and fluctuations arising from U.S. economic policy, particularly within the domain of trade, exert a profound influence on the global economic landscape (Caldara et al. 2020; Li et al. 2022). Dées and Saint-Guilhem (2011) affirm that, relative to other developed nations, shocks originating in the United States yield more pronounced spillover effects towards emerging economies. Owing to their interconnections with the United States via international trade, a majority of the world’s economies are highly vulnerable to trade-related uncertainties (Nantembelele et al. 2023). For instance, Fink and Schüler (2015) have emphasized that financial stress shocks emanating from the United States may adversely affect the structured economic dynamics of developing nations. Moreover, when financial stress shocks transpire, emerging economies endure consequences akin to those witnessed in the actual economy of the United States. However, no effort is made to explore the dynamic shock propagation between TPU and GCC financial market volatility.
The TPU (Trade Policy Uncertainty) has the potential to exert adverse effects on financial markets through various channels. The initial avenue involves exporters’ or importers’ perspectives, as elucidated by Li et al. (2022). Taking the instance of a GCC-listed firm primarily engaged in exports, an escalation in tariffs by a foreign nation, such as the United States, could result in a downturn in performance for the company. This downturn is attributable to increased prices and the loss of a pricing advantage. The second channel pertains to investor sentiment, wherein heightened TPU levels prompt market participants to lower their expectations, possibly inducing a state of panic (Li et al. 2022). Bianconi et al. (2021) posit that industries more susceptible to TPU experience more pronounced declines in stock values during periods of uncertainty, with greater variability in returns observed at significant policy announcement dates. According to Brennan (1991), stock prices, guided by the rational asset-pricing theory, are determined by the discounted value of the stream of future dividends. Consequently, adjustments to discount parameters or future return expectations resulting from TPU shocks lead to increased variances, amplifying the excess volatility of the equity market.
Research by Li et al. (2023) utilizing an ordinary least squares regression framework reveals an inverse correlation between TPU and financial investment by businesses in the Chinese environment. This suggests that firms tend to decrease financial investment in periods of heightened trade policy uncertainty. Additionally, Hu et al. (2024) delve into the exploration of diverse shock-transmission channels through which TPU impacts the risk-taking initiatives of the banking industry in China. The overall findings suggest that TPU shocks diminish the bank’s capacity to assume additional risk, influencing liquidity, stock market risk, and equity market indicators. Increased credit spreads and risk premiums, business investment delays, and consumer postponement of durable goods purchases due to the trade uncertainty can all contribute to a decline in economic activity (Baker et al. 2022). Furthermore, Baker et al. (2016) discover that changes in U.S. economic policy are linked to increased stock market volatility as well as decreased investment and employment in industries like infrastructure and finance that are sensitive to policy. According to Handley and Limão (2017), the reduction of ambiguity over future trade policy enhances economic development, and TPU restricts export investment. In a similar vein, Caldara et al. (2020) contend that higher TPU lowers economic activity and investment. According to Crowley et al. (2018), a rise in TPU increases the risk that businesses would leave export markets and decreases their likelihood of entering new international markets. Therefore, there is a tendency for trade policy shocks to increase the volatility of the equities market.
Trade Policy Uncertainty (TPU) exerts a notable influence on the macroeconomic landscape and the market economy, introducing challenges for financial institutions in accurately forecasting market dynamics and policy landscapes. The imprecise nature of TPU hampers the ability of enterprises to anticipate and plan for market fluctuations and navigate policy environments effectively (Handley and Limão 2017; Caldara et al. 2020). Notably, research by Hu et al. (2024) suggests that the impact of TPU shocks in the United States may exacerbate the financial vulnerabilities of micro-entities, thereby contributing to heightened volatility in financial markets. This underscores a diminishing predictability in U.S. trade policy over recent years. This decrease in predictability is attributed to the Trump administration’s departure from the multilateral norms established by the World Trade Organization (WTO) to advance its own policy objectives in trade relations with its partners (Hopewell 2021). Consequently, the economy is exposed to frequent and novel TPU shocks, stemming from the WTO’s inability to enforce its regulations and its diminishing commitment to the global trading system (Hopewell 2021). In light of these circumstances, this study represents the inaugural attempt to investigate the correlation between financial market volatility and the transmission of severe shocks originating from U.S. TPU disruptions.

3. Data with Descriptive Statistics

3.1. Data

We analyze the aggregated daily conditional volatility series of Islamic stock markets to investigate the transmission dynamics of trade policy uncertainty shocks in both the temporal and frequency domains toward the stock markets governed by Sharia law in the Gulf Cooperation Council (GCC) nations. The conditional volatility series of GCC stock markets are extracted through GARCH (1,1) approach with the Generalized Error Distribution (GED) term. The appropriate model in-between GARCH (1,1) with a student’s t and GED term is selected according to the log-likelihood, AIC, SC, and HQ values. The data-collection period spans from 1 February 2015 to 1 January 2025, aligning with the temporal parameters specified in the study conducted by Li et al. (2022). The selection of this time frame is contingent upon the availability of data pertaining to Sharia-compliant equities markets in the GCC region, encompassing Saudi Arabia, Bahrain, Kuwait, Qatar, the UAE, and Oman, accessible through https://www.spglobal.com.
The daily Sharia-compliant equity market index data for Bahrain (https://www.spglobal.com/spdji/en/indices/equity/sp-bahrain-bmi-shariah/, accessed on 5 January 2025), Kuwait (https://www.spglobal.com/spdji/en/indices/equity/sp-kuwait-bmi-shariah/#overview, accessed on 5 January 2025), Qatar (https://www.spglobal.com/spdji/en/indices/equity/sp-qatar-bmi-shariah/#overview, accessed on 5 January 2025), the UAE (https://www.spglobal.com/spdji/en/indices/equity/sp-united-arab-emirates-bmi-shariah/#overview, accessed on 5 January 2025), and Saudi Arabia (https://www.spglobal.com/spdji/en/indices/equity/sp-saudi-arabia-largemidcap-shariah-index/#overview, accessed on 5 January 2025) are first converted into their natural logarithmic returns before estimating the Generalized Autoregressive Conditional Heteroscedasticity (GARCH (1,1)) model, incorporating both a student’s t-distribution and the Generalized Error Distribution (GED). Additionally, the GARCH (1,1) estimates under both distributional assumptions are compared, and the most suitable model is selected based on the highest log-likelihood value and the lowest Akaike Information Criterion (AIC), Schwarz Criterion (SC), and Hannan–Quinn (HQ) values. An extensive daily data set covering a decade (2015 towards 2025) encapsulates significant global trade incidents. These encompass the Brexit referendum, the November 2016 U.S. presidential election, and the trade intimidation against Mexico in 2017 following President Trump’s induction. Additionally, in this day-to-day data set covering 2014 to 2022, vital international trade incidents are integrated. These involve U.S. government discussions on heightened import tariffs in middle of 2017, the imposition of U.S. tariffs on the importation of industrial metals, i.e., aluminum and steel in March 2018, the imposition of taxes on Chinese goods starting 1 July 2018, and the U.S. equity market crash by the end of 2018. Furthermore, noteworthy events such as increased tariff intimidations against Mexico in mid-2019, the systematic distortion in global supply chain network due to the outbreak of COVID-19 virus (Suleman et al. 2023b), and the Russian invasion of Ukraine in early 2022 are also included in this expanded time frame, spanning from 2015 to 2025.
In order to explore the time- and frequency-domain shock spillovers between Trade Policy Uncertainty (TPU) and GCC stock market conditional volatility, we utilize the TPU metric calculated by Caldara et al. (2020). By monitoring the frequency of trade policy and uncertainty phrases in major newspapers, Caldara et al. (2020) create a daily aggregated U.S. Trade Policy Uncertainty (TPU) Index. The TPU indices hits elevated levels after 2016 during U.S. trade conflicts, particularly with China and Mexico. It first spiked following Nixon and Ford’s reforms to trade regulations, then it rose again due to tensions with Japan and NAFTA negotiations during 1990s. Three TPU metrics are constructed by Caldara et al. (2020) using tariff data, company earnings call, and press publicity. Firm-level and aggregate statistics support the conclusion that growing TPU lowers the capital expenditure, investing activities and thereby adversely affecting the economic development. These impacts are explained using a two-country general equilibrium model, which demonstrates how investing activities and economic growth are dampened by trade policy shifts and uncertainty about future trade tariffs (Sheikh et al. 2024). Several world-renowned newspapers, such as The Boston Globe, Chicago Tribune, The Guardian, Los Angeles Times, The New York Times, The Wall Street Journal, and The Washington Post, are incorporated for the estimation of TPU index through computerized phrase searching (Tabash et al. 2024). Normalization to 100 for a one-percent share, the metric represents the daily percentage of publications highlighting TPU (see Caldara et al. 2019; Caldara et al. 2020). In the existing literature, Sheikh et al. (2024) also utilized the similar metric of TPU by Caldara et al. (2020) for the shock-transmission mechanism between uncertainties in trade policies and Australian Islamic, Sustainable, and conventional financial system.
For this research article regarding the impact of TPU shocks on the GCC Islamic stock market conditional volatility, the daily TPU Index covers the period from 1 February 2015 to 1 January 2025 in order to assess the TPU effect on the volatility of the GCC stock market. The daily data on TPU is downloaded from https://www.matteoiacoviello.com/tpu.htm, accessed on 5 January 2025. Incorporating daily data on TPU index estimated by Caldara et al. (2020) provides an additional rationale for constraining the data range to the specific period from 1 February 2015 to 1 January 2025. On the other hand, international financial markets were impacted due to the trade policy instability resulting from the trade conflict between the U.S. and other countries (Yu et al. 2023). According to Nantembelele et al. (2023), changes in U.S. trade policy with China have presented difficulties for emerging Sub-Saharan nations. Moreover, the US Federal Reserve Department emphasizes the negative impact of TPU on international markets, citing economic contraction as a primary factor. Taking cues from this insight, we have chosen to incorporate TPU measure of Caldara et al. (2020) into our analysis. This decision is driven by the acknowledgment of the measure’s relevance in assessing the adverse effects of Trade Policy Uncertainty (TPU) on global economic conditions (see Caldara et al. 2019).
In order to extract the conditional variance series of Sharia-compliant equity market indices of Bahrain, Kuwait, Oman, U.A.E, Saudi Arabia, and Qatar, we utilized the equation ( r t = L n P t P t 1 ) for the naturally logarithmically returns of the equity market indices. Whereas, r t and Ln are the return of the Islamic equity markets of the GCC region and the naturally logarithmic transformation. Whereas, P t and P t 1 are the prices at a time t and t 1 . Furthermore, in order to extract the conditional variance series of Sharia-compliant equity market returns of Bahrain, Kuwait, Oman, U.A.E, Saudi Arabia, and Qatar, we utilize the Generalized Autoregressive Conditional Heteroscedastic approach (GARCH (1,1)) by Bollerslev (1986) with a student’s t and Generalized Error Distribution (). The GARCH (1,1) framework with a student’s t distribution is best suited for capturing fat-tailed behavior in stock market data and is used when financial returns show heavy tails, or more extreme returns than a normal distribution. The student’s t GARCH (1,1) technique works best when returns exhibit even more substantial shocks. However, GARCH (1,1) with the GED term, on the other hand, incorporates both fat-tailed and thin-tailed behavior based on its form parameter. In cases when the return distribution is not too fat-tailed but nevertheless deviates from normality, the GARCH (1,1) technique with the GED term can offer a suitable fit. Therefore, if the GARCH model with a student’s t distribution performs worse, it suggests that the data does not exhibit extreme tail behavior as strongly as expected. In cases where shocks or severe returns are less frequent but still occur, the GED distribution is more effective in capturing volatility than a student’s t. The mean (Equation (1)) and variance (Equation (2)) equations of the GARCH (1,1) model with a student’s t and GED distributions can be expressed as follows:
r t = μ + ϕ r t 1 + ϵ t
In the above equation, r t and μ are the return series of GCC Islamic stock markets and constant term. Whereas, ϕ is the autoregressive coefficient and estimates the lag effects of 1 day prior effect of returns ( r t 1 ) on the present-day dynamics. ϵ t is characterized as error term.
σ t 2 = ω + α ϵ t 1 2 + β σ t 1 2
In the above equation, σ t 2 is the variance series of Sharia-compliant equity market returns GCC economies at a time t and ω is the constant term. Whereas, α captures past squared error affect and characterized as ARCH effect. Furthermore, β captures the prior day variance effect and characterized as GARCH parameter. ϵ t 1 2 is the lagged innovation term and β is the GARCH parameter and estimates the effect of one period lagged variances (past variance effect). The σ t 1 2 in Equation (2) captures the one period lag effect of the conditional variances on the present dynamics of conditional variance of the individual GCC member economies (Bahrain, Oman, Qatar, UAE, Saudi Arabia, and Kuwait). Therefore, the GARCH (1,1) model captures long-term persistence through the GARCH term ( β σ t 1 2 ) , and short-term volatility clustering is captured through the ARCH effect ( α ϵ t 1 2 ) .

3.2. Descriptive Statistics

Table 1a presents the descriptive statistics of the natural logarithms of equity market indices for the Gulf Cooperation Council (GCC) member economies, namely Bahrain, Kuwait, Oman, Qatar, and the United Arab Emirates (UAE). Additionally, Table 1a provides the descriptive statistics of Trade Policy Uncertainty (TPU), which is incorporated in this study to analyze the impact of quantile-domain TPU-driven shocks on GCC Sharia-compliant equity markets across different frequency horizons (long-term and short-term). Table 1b reports the descriptive statistics of the natural logarithms of the return series for GCC member economies. According to Table 1a, the equity market indices of Qatar, Oman, and Kuwait exhibit the highest average values of 7.43, 6.55, and 6.54, respectively, compared to the remaining GCC Sharia-compliant stock market indices. Furthermore, the Islamic stock market indices of Kuwait, Bahrain, and Saudi Arabia display the highest standard deviation values of 0.277, 0.271, and 0.263, respectively, indicating greater volatility with frequent upward and downward fluctuations in market prices compared to the other GCC economies. Moreover, Table 1b reveals that the Sharia-compliant equity market returns of Bahrain and Kuwait exhibit the highest average values of 0.00016 and 0.00015, respectively, exceeding those of the other GCC member economies, including Saudi Arabia (0.00014), Qatar (−0.00009), Oman (−0.00026), and the UAE (0.00006). Additionally, Table 1b highlights that the logarithmically transformed return series of Bahrain and the UAE exhibit the highest standard deviation values (SD) of 0.0124 and 0.0103, respectively, followed by Saudi Arabia (0.0096) and Qatar (0.0094). This indicates frequent fluctuations in Sharia-compliant equity market returns due to deviations from the mean return values. Lastly, Table 1b also demonstrates that the Sharia-compliant equity market returns of Kuwait and the UAE exhibit higher excess kurtosis values, reflecting a leptokurtic distribution of returns, which suggests the presence of extreme outliers in the data.
The student’s t distribution is therefore ideally suited for simulating severe occurrences and significant equity market disruptions as it explicitly takes these hefty tails into consideration. When financial returns exhibit excessive kurtosis (see Table 1b), fat tails are present, indicating that extreme returns—both positive and negative—occur more frequently than they would under a normal distribution. Table 1b also shows that the excess kurtosis values of Kuwait (137.37) and UAE (36.41) are exponentially higher as compared with the excess kurtosis values of Bahrain (13.19), Oman (9.87), and Saudi Arabia (14.57). Therefore, GARCH (1,1) with the Generalized Error Distribution (GED) term can handle both thicker and lighter tails, the GED distribution is more adaptable than the normal distribution. GED’s shape parameter enables it to adapt to varying tail thickness levels, which makes it useful for capturing return distribution fluctuations. GARCH models with a student’s t and GED aid in more precisely modeling times of high and low volatility since financial returns frequently show volatility clustering.
Table 2 demonstrates that the GARCH (1,1) model with a Generalized Error Distribution (GED) is more suitable for estimating the conditional volatility series of Sharia-compliant equity market returns in Bahrain, Kuwait, Oman, Qatar, the UAE, and Saudi Arabia compared to the GARCH (1,1) model with a student’s t-distribution. The appropriateness of the GARCH (1,1) model with GED is determined based on its lower Akaike Information Criterion (AIC), Schwarz Information Criterion (SIC), and Hannan–Quinn Criterion (HQ) values, as well as its higher log-likelihood values relative to the GARCH (1,1) model with a student’s t-distribution (see Table 2). Thus, even though the Islamic stock market returns of GCC member economies exhibit fat-tailed distributions, the GARCH (1,1) model with GED remains the more appropriate choice when AIC and SIC values are lower and the log-likelihood is higher than that of the GARCH (1,1) model with a student’s t-distribution. This superiority is due to the model’s ability to effectively accommodate both thicker and thinner tails and its greater adaptability to varying tail densities. Additionally, Table 2 indicates that both the ARCH and GARCH terms in the GARCH (1,1) model with GED are statistically significant and positive, with their combined sum remaining below 1. This suggests that the GARCH (1,1) model with GED term satisfies covariance stationarity conditions, exhibits stable dynamics, and ensures that conditional variances revert to their long-term mean, reinforcing the mean-reverting nature of volatility with no evidence of indefinite persistence. Furthermore, the significance of the ARCH and GARCH terms confirms the presence of volatility clustering, where small changes are likely to be followed by small changes and large changes by large changes.
Table 2 also indicates that the ARCH term ( α ϵ t 1 2 ) for Sharia-compliant equity market returns in Bahrain (0.12) and Saudi Arabia (0.10), as estimated using the GARCH (1,1) model with a Generalized Error Distribution (GED), is higher than that of the other GCC member economies. This suggests a strong impact of past squared shocks on current volatility dynamics, as past squared return shocks contribute to greater short-term volatility spikes. Conversely, the significantly higher GARCH parameter ( β σ t 1 2 ) value of 0.9136 for Qatari equity market returns as compared with rest of the GCC member economies’ stock returns highlights the pronounced influence of past variances on the present-day dynamics of conditional variance in Qatar’s Sharia-compliant equity market (see Table 2). Moreover, the higher GARCH coefficient values of 0.82, 0.85, 0.91, 0.86, 0.87, and 0.84 for Bahrain, Oman, Qatar, Kuwait, the UAE, and Saudi Arabia, respectively, compared to the corresponding ARCH coefficients, indicate that the one-period lagged effect of conditional variances exerts a stronger influence on present-day conditional variances than past squared return shocks. This suggests that volatility takes a longer time to stabilize following a shock, potentially leading to lower mean reversion. Furthermore, across all GCC equity markets, the ARCH effect is significantly weaker than the GARCH effect, implying that volatility exhibits a smoother pattern and does not spike sharply in response to short-term shocks.
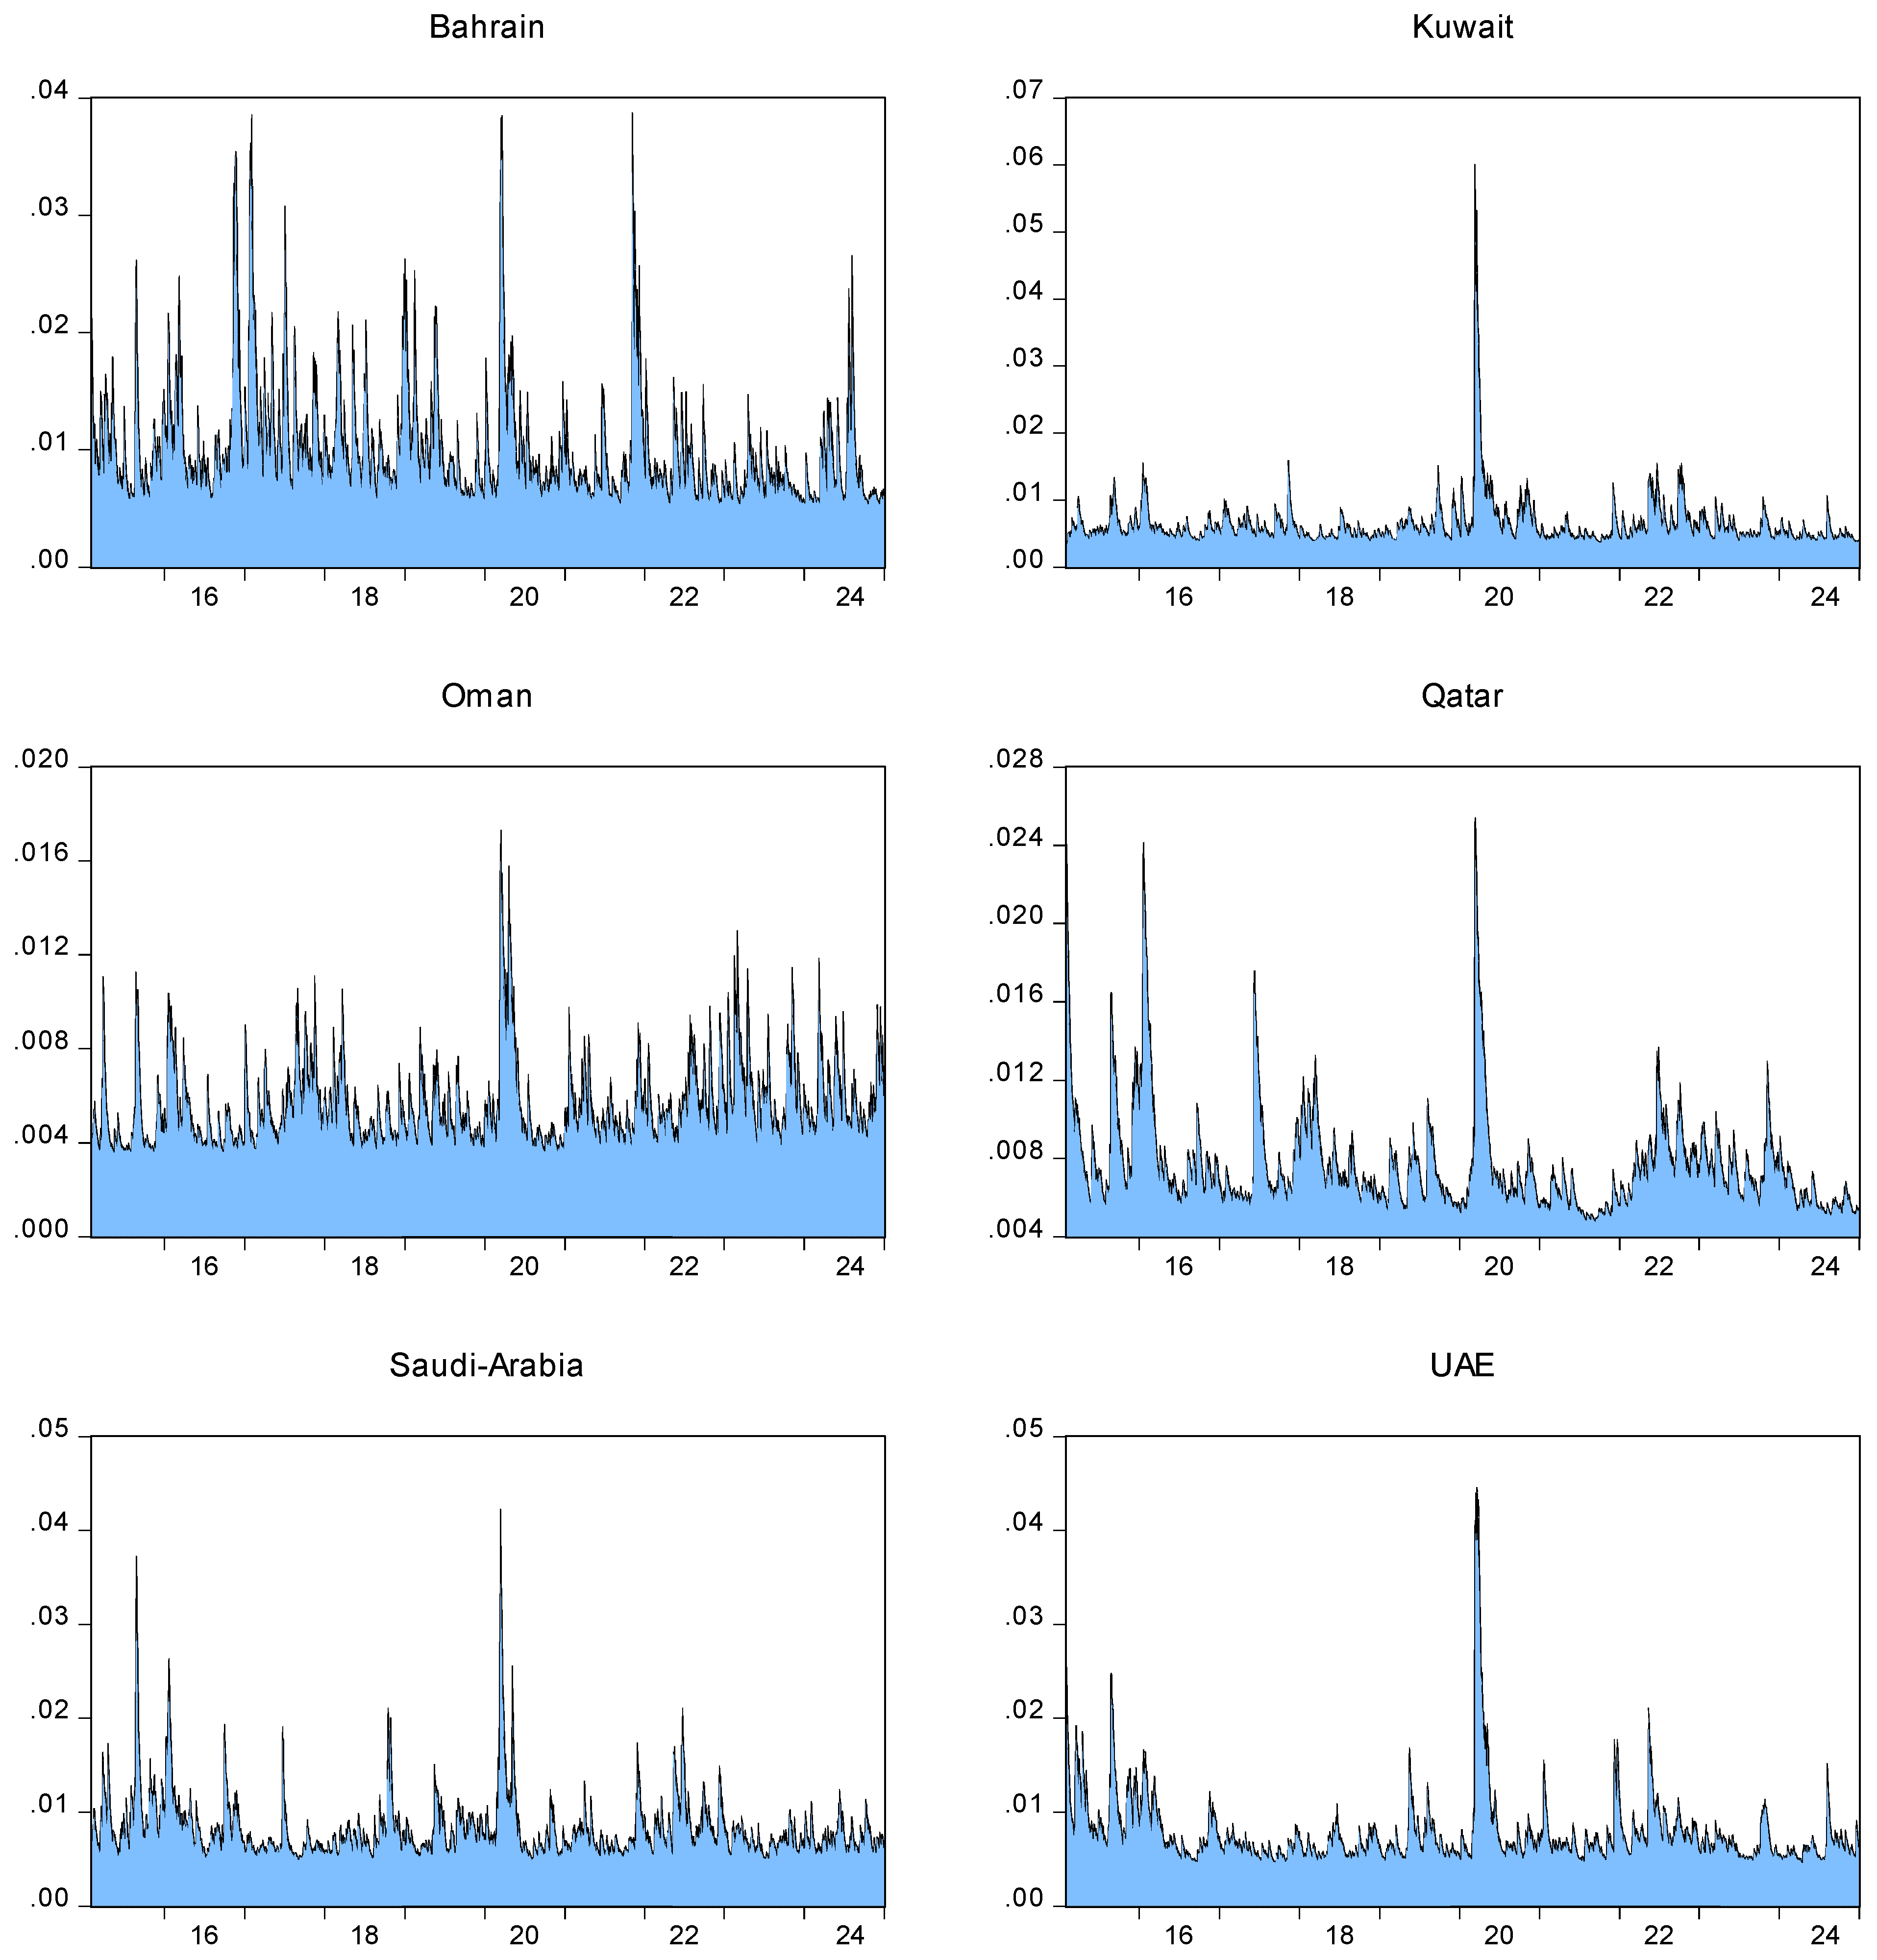
Table 3 provides an overview of the descriptive statistical characteristics of the conditional volatility in Sharia-compliant equity markets of GCC member economies (specifically, Bahrain, Kuwait, Oman, Qatar, Saudi Arabia, and the UAE). Furthermore, Table 3 also highlights that the average Trade Policy Uncertainty (TPU) remains elevated at 86.39, with a substantial standard deviation (SD) value of 79.39. Figure 1 illustrates a continuous escalation in TPU from 2015 through the end of 2017, with an additional rise in uncertainty indices related to trade policy observed in 2018. Figure 1 also illustrates that the conditional risk in Islamic stock markets across all member economies of the GCC experienced frequent increments during the corresponding time intervals. This phenomenon can be ascribed to diverse factors, including oscillations in oil prices from 2015 to 2016 and the diplomatic rift within the GCC in 2017. During this event, multiple GCC member economies severed diplomatic relations with Qatar, potentially affecting regional trade dynamics. Another factor that played a role is the Joint Comprehensive Plan of Action agreement, which removed specific economic sanctions on Iran. This, in turn, had an impact on trade dynamics and geopolitical situations within the GCC concerning the United States.
Figure 1 also discloses that TPU experienced a sharp increase during the COVID-19 epidemic, and a similar pattern of heightened variability is noticeable in the conditional volatility sequences of all GCC Islamic financial markets during the COVID-19. According to Table 3, the highest mean conditional volatility of 0.016 is exhibited by Bahrain followed by Saudi Arabia, UAE, and Qatar with the average conditional volatility values of 0.0085, 0.0084, and 0.0082, respectively. Whereas, Figure 1 also shows that these economies (Bahrain, Saudi Arabia, UAE, and Qatar) experienced the higher conditional risk as compared with Kuwait and Oman with the upside variation in volatilities increases during the COVID-19 time. Shareholders should manage risk by diversifying investment portfolio across countries with relatively lower volatility, such as Kuwait and Oman. This approach can help spread risk and reduce exposure to extreme market movements in specific Islamic countries.
Table 3 also shows that all the Sharia-compliant GCC financial markets possess higher excess kurtosis due to the presence of extreme outliers, and this may signify the presence of extreme risk for faith-based investors of GCC region. Additionally, the utilization of a quantile-centric methodology to explore the dynamic shock-transmission process between TPU and conditional risk in financial markets is supported by the presence of a leptokurtic scattering in the conditional volatility series of Islamic stock markets of all GCC member economies. This is further reinforced by the dismissal of the null hypothesis in the Jacque–Berra (JB) test statistics (refer to Table 3) concerning data normality. We also utilize the BDS test of Brock et al. (1996) to assess whether time series data demonstrate non-linearity and non-randomness. The results, outlined in Table 4, offer proof contradicting the null hypothesis that conditional volatility series estimated through GARCH (1,1) with GED term of all Islamic stock markets are distributed independently and uniformly. The BDS test statistics validate this assertion, as the associated p-values are below the 1% significance threshold. As a result, the BDS test estimates in Table 4 discloses the presence of non-linearity or deviations from randomness.
This suggests that conventional connectedness methods based upon traditional symmetrical VAR approaches for shock-transmission mechanism between TPU and GCC Islamic financial market risk would not be suitable for analysis (Kayani et al. 2024; Sheikh et al. 2024). Accordingly, Suleman et al. (2022) have also suggested that the null hypothesis of the BDS test, which presumes independence and identical distribution of data points, be rejected due to the prevalence of non-linearly trend in financial time series data (see Table 4). As a result, using quantile-based VAR connectedness is more suited in these situations. This serves as a compelling impetus to reconnoiter the mechanism of extreme dynamic shock propagation between TPU and the volatility associated with Sharia-compliant financial markets of all GCC-member economies.

4. Methodology

We examine the recently formulated “Extended Joint” framework for quantile-based vector auto-regression (QVAR) developed by Cunado et al. (2023) to uncover the dynamic shock-transmission mechanism between TPU and the GCC Islamic financial market’s conditional risk. This Extended Joint QVAR connectedness approach produces more precise results by utilizing an enhanced normalization strategy (Cunado et al. 2023). The incorporation of a normalization technique based on the well-established goodness-of-fit metric R 2 distinguishes this unique feature from both the joint-connectedness (Lastrapes and Wiesen 2021) and the initial-connectedness measures (Diebold and Yilmaz 2009, 2012). Although Markov regime switching vector auto-regression (MS-VAR) and Threshold vector auto-regression (T-VAR) approaches are intended to identify nonlinearity through threshold effects or regime flips, they frequently need substantial assumptions on the quantity and kind of thresholds or regimes. Choosing the right threshold value or the right number of regimes may often be difficult and result in the model’s correct specification. By looking at impacts at various quantiles, the QVAR technique naturally takes nonlinearity into account without specifying regimes, which lowers the possibility of misspecification and produces a more reliable analysis. Clustering of volatility and fat-tailed distributions are characteristics of financial markets. The QVAR approach is ideally suited to capture the tail dependencies and diverse consequences of shocks, especially when paired with an Extended Joint spillover technique. Because it sheds light on how severe market moves spread across several markets, this is essential for risk management and policymaking. In severe quantile behavior, MS-VAR and TVAR may not provide the same degree of granularity, although being helpful in capturing some nonlinear aspects. Additionally, Nawaz et al. (2020) highlighted that lower quantiles, such as τ = 0.05, indicate bearish circumstances in stock market returns, whereas higher quantiles (τ = 0.95) and median quantiles (τ = 0.50) indicate bullish and moderate market conditions, respectively. Our selection of quantiles, τ = 0.05, τ = 0.95, and τ = 0.50, to denote bearish, bullish, and moderate circumstances in the volatility of the Islamic financial market, respectively, is in line with research conducted by Cunado et al. (2023), Pal and Mitra (2016), and Iacopini et al. (2023).
Apart from QVAR with “Extended Joint” connectedness approach of Cunado et al. (2023), which only explore the shock transmission between TPU and GCC stock market risk across the overall time horizon, we also employ the connectedness between TPU and GCC stock markets’ conditional volatility by using the Quantile Vector Auto-Regression (QVAR) with the “frequency domain” connectedness technique, originally developed by Chatziantoniou et al. (2022). Our objective is to examine the propagation patterns of severe TPU shocks across various quantiles and investment horizons, encompassing both short and long time frames. To establish the Frequency-domain QVAR connectedness method, Chatziantoniou et al. (2022) integrated the frequency connectedness methodology presented by Baruník and Křehlík (2018) with the classical quantile-based VAR strategy outlined by Chatziantoniou et al. (2021) and Ando et al. (2022). This amalgamation of methodologies allows for a comprehensive analysis of the interconnectedness of severe TPU shocks, offering insights into their dynamics across different quantiles and time horizons. However, it is crucial to emphasize that the foundational frequency connectivity method developed by Baruník and Křehlík (2018) demonstrates sensitivity to unusual outcomes and fails to account for the transmission of shocks at different quantiles, as underscored by Chatziantoniou et al. (2022). Additionally, it lacks the capability to address the transmission of bearish, moderate, and bullish extreme shocks between TPU and GCC Islamic stock market risk across various frequency levels, encompassing both short- and long-term investment periods. Hence, to thoroughly capture the interconnection measures between TPU and the risk in the Islamic financial market at diverse frequencies and quantiles, we also employ the Frequency-domain QVAR approach proposed by Chatziantoniou et al. (2022).
Additionally, unlike MS-VAR or TVAR, which typically partition data into discrete regimes, QVAR with the Frequency-domain connectedness approach provides a continuous view of the dynamics from the center to the tails of the distribution across varied investment horizon (long- and short-term). This enables a more nuanced understanding of how extreme events (e.g., market crashes or booms) impact volatility spillovers across varied quantiles ( τ = 0.05 ,   0.50 ,   0.95 ) and investment horizons (long- and short-term). Therefore, returns on GCC equity markets frequently show asymmetry and large tails. Since QVAR does not rely on the normalcy assumption and may adjust to different tail densities, its quantile-based estimate makes it inherently resistant to such traits. On the other hand, even while MS-VAR and TVAR can simulate nonlinear behavior, they can have trouble capturing the entire spectrum of tail behaviors without the need for complicated model structures or further modifications. Moreover, by estimating effects at various quantiles, QVAR with “Extended Joint” and “Frequency”-domain-connectedness models are intended to study relationships over the whole conditional distribution and across different investment horizons. Unlike the MS-VAR and TVAR approaches, this implies that without imposing the data into arbitrary regimes, they may show how extreme events (tail behaviors) vary from more normal (central) settings. The continuous character of financial market dynamics may be oversimplified by MS-VAR or TVAR approaches, which divide the data into discrete regimes or segments based on threshold values.
The Frequency-domain QVAR framework proves to be resilient against outliers when compared to the conventional connectedness approach (Diebold and Yilmaz 2012; Lastrapes and Wiesen 2021; Asadi et al. 2023). Thus, the Frequency-domain QVAR technique allows for the identification of temporal-frequency patterns in both the positive and negative extremes of the data distribution. As noted by Londono (2019), significant insights into both favorable and unfavorable occurrences can be extracted by examining the lower quantile (τ = 0.10) and upper quantile (τ = 0.90). Essentially, concentrating on these extreme quantiles enables a more sophisticated comprehension of the variety of results and possible equity market volatility conditions in the context under study (Suleman et al. 2022). Baruník and Křehlík (2018) define high-frequency connectivity as a condition where shocks have a momentary and transient impact on network variables. In contrast, low-frequency connectivity results from shocks that profoundly alter the network’s structure and have a lasting effect on the variables (Suleman et al. 2023b).

4.1. QVAR Model

As stated in White et al. (2015), we first evaluate a quantile vector auto-regression, or QVAR(p), that may be written up as below:
y t =   μ τ + j = 1 p Φ j τ y t j + μ t ( τ )
In the given equation, the variables y t and y t j refer to vectors representing endogenous variables, each having dimensions of K × 1. τ is a symbol used to represent a specific quantile in a statistical distribution, and it can take on values between 0 and 100 to indicate the percentage position of that quantile within the data set. The lag length of the QVAR model is denoted by p. The coefficient matrix of the QVAR model, denoted as Φ j τ , has dimensions K × K, and the conditional mean vector, denoted as μ(τ), has dimensions K × 1. The error vector μ t ( τ ) is a K × 1 matrix and is linked to a variance-covariance matrix Σ(τ) with dimensions K × K. The temporal breadth is represented by the letter T. When transitioning from QVAR (p) to QVAR (∞), the global theorem is applied as follows: y t = μ τ + j = 1 p Φ j τ y t j + μ t ( τ ) = μ τ + i = 0 A i ( τ ) μ t i ( τ ) .
The computation of the “Generalized Forecast Error Variance Decomposition” (GFEVD)2 is carried out for an impending time horizon consisting of H steps. The progenitors of this decomposition methodology, namely Koop et al. (1996) and Pesaran and Shin (1998), employed it to demonstrate the transmission of a shock in series j towards series i (see Cunado et al. 2023). Concurrently, a vector comprised of zeros, with a solitary value of one at the i th position, is denoted as e i .
ψ i j g e n H = ( τ ) i i 1 h = 0 H 1 ( e A h ( τ ) ( τ ) e j ) 2 h = 0 H 1 ( e i A h ( τ ) ( τ ) A h ( τ ) e i )
g S O T i j ( H ) = ψ i j g e n H j = 1 K ψ i j g e n H
Furthermore, the comprehensive directional “FROM” connectivity, encompassing the error variance (shocks) propagations from all other markets j to a market i. Therefore, the directional “FROM” spillover of error variances gauges the extent to which the network influences market i; and the directional “TO” aspect, addressing the degree to which market i influences the pre-established network of variables j , can be ascertained in the following manner:
S a l l i g e n , F R O M H = j = 1 , i j K g S O T i j ( H )
S i a l l g e n , T O H = j = 1 , i j K g S O T j i ( H )
Moreover, the assessment of NET directional connectedness can be derived using the formula: S i g e n , N E T H = S i a l l g e n , T O H S a l l i g e n , F R O M H . In this context, a positive value for S i g e n , N E T H signifies that series i exerts a stronger influence on other series than it is influenced by them (Asadi et al. 2023). Conversely, a negative value S i g e n , N E T H suggests that series i is more impacted by other series than it influences them. Consequently, series i is labeled as a net receiver of shocks when S i g e n , N E T H < 0 and as a net transmitter of shocks when S i g e n , N E T H > 0.

4.2. QVAR with “Extended Joint” Connectedness Measure of Cunado et al. (2023)

We utilize an integrated approach of Cunado et al. (2023) that combines the “Extended Joint” connectedness method developed by Balcilar et al. (2021) and the standard QVAR approach introduced by Chatziantoniou et al. (2021) and Ando et al. (2022) into an “Extended Joint” based QVAR connectedness framework. This extension involves the use of an improved normalization method, which enhances the accuracy and precision of connectedness measurements. Specifically, S a l l i J o i n t , F r o m H is introduced as a mathematical representation of the impact that each variable in the network has on series i . This helps to quantify the influence of all variables in the network on a specific series i , providing insights into the interconnectedness and shock propagation dynamics within the structured QVAR system. This is mathematically expressed as follows,
ξ 1 H = y t + H E y t + H y t , y t 1 , . = h = 0 H 1 A h ϵ t + H h
S a l l i J o i n t , F r o m H = E ( ξ 2 i , t H ) E [ ξ i , t H E ( ξ i , t H ) | ϵ i , t + 1 , ϵ i , t + H ] 2 E ( ξ 2 i , t H )
E ( ξ 1 H ( ξ 1 H ) = A h A h
Within this framework, M i takes the form of a rectangular matrix sized K × (K − 1), originating from the adjustment of an identity matrix through the exclusion of its i th column. The vector ϵ∀ ≠ i, t + 1 represents a collection of unexpected developments at time t + 1 across all series except i, forming a vector with dimensions K − 1. Following this, we progress to calculate the joint interconnectedness index, using the ensuing formula:
J S O I H = 1 K i = 1 k S a l l i J o i n t , F r o m ( H )
This falls between zero and one, which is different from the Total Connectedness Index (TCI) in the original technique, as noted by Gabauer (2021) and Chatziantoniou et al. (2021). As an important continuation of the work of Balcilar et al. (2021) and Cunado et al. (2023), on the other hand, uses numerous scale factors to determine correlations between gSOT and jSOT.
λ i H = S a l l i J o i n t , F r o m ( H ) S a l l i g e n , F r o m ( H )
j S O T i j H = λ i H g S O T i j ( H )
The determination of the aggregate “NET” directional impact, the net pairwise directional connectedness (NPDC) indices utilized for network visualization, and the comprehensive directional transmission of perturbations emanating from variable i to all other variables is facilitated through the application of Equations (14), (15), and (16), correspondingly.
S i a l l J o i n t , T O H = j = 1 , i j K j S O T j i ( H )
S j J o i n t , N E T H = S i a l l J o i n t , T O H S a l l i J o i n t , F R O M H
S i j J o i n t , N E T H = j S O T j i J o i n t , T O ( H ) j S O T i j J o i n t , F R O M ( H )

4.3. Frequency-Domain QVAR of Chatziantoniou et al. (2022) for Short- and Long-Term Connectedness Under Extreme and Medium Market Conditions

The combination of the VAR methodology based on quantiles, as introduced by Chatziantoniou et al. (2021), and the frequency-connectedness approach suggested by Baruník and Křehlík (2018), was accomplished by Chatziantoniou et al. (2022). This led to the development of the approach known as frequency-based quantile connectedness. Stiassny (1996) formulated the spectral decomposition method, establishing a framework for exploring connectivity in this field. The analysis initiates with the examination of the frequency response function, represented as Ψ( e i ω ) = h = 0 e i ω h Ψ h , where i denotes the imaginary unit (√−1), and ω signifies the frequency. Subsequently, focus is shifted to the spectral density of x t at a specific frequency, ω. The Fourier transformation of the QVMA (∞) representation is then applied to describe this spectral density.
S x ω = h = E x t x t h e i ω h = Ψ ( e i ω h ) Σ t Ψ ( e + i ω h )
Crucially, the Frequency-based Generalized Forecast Error Variance Decomposition (GFEVD) arises from combining spectral density with the GFEVD. Similar to the temporal domain, there is a need to normalize the frequency-based GFEVD, which can be articulated as follows:
θ i j ω = ( ( τ ) ) j j 1 | h = 0 ( Ψ τ e i ω h τ ) i j | 2 h = 0 ( Ψ e i ω h τ Ψ τ e i ω h ) i i
θ ~ i j ω = θ i j ω k = 1 N θ i j ( ω )
The segment of the spectrum of series i at a specific frequency ω that can be linked to a shock in series j is denoted by the symbol θ ~ i j ω . This serves as a unique indicator for that frequency band. Instead of evaluating connectedness at an individual frequency, Chatziantoniou et al. (2022) aggregate all frequencies within a specified range, denoted as d = (a, b), where both a and b fall within the range of (−π, π), and a is less than b (d = (a, b): a, b ∈ (−π, π), a < b).
θ ~ i j d = a b θ ~ i j ω d ( ω )
From this juncture, we have the capability to calculate the same connectedness metrics outlined in Diebold and Yılmaz (2012). However, it is crucial to note that in this particular context, these metrics are associated with frequency-connectedness measures. These metrics offer valuable perspectives on the transmission of impacts within specific frequency ranges identified as d.
N P D C i j d =   θ ~ i j d θ ~ j i d
T O i d = i = 1 , i j N θ ~ j i d
F R O M i d = i = 1 , i j N θ ~ i j d
N E T i d = T O i d F R O M i d
T C I i d = N 1 i = 1 N T O i d = N 1 i = 1 N F R O M i d
In this instance, we examine two frequency intervals (d1 and d2) signifying short-term and long-term investment time frames. The initial span covers 1 to 5 days, defined as d1 = (π∕5, π), while the subsequent range extends from 5 days onwards, designated as d2 = (0, π∕5]. Consequently, we compute the directional (TO, FROM, and NET) frequency-based connectedness approach for both short-term and long-term periods within the quantile-based VAR system. Therefore, T O i d 1 , F R O M i d 1 , and N E T i d 1 depict directional connectedness in the short term, while T O i d 2 , F R O M i d 2 , and N E T i d 2 illustrate directional connectedness in the long term. The directional transmissions denoted as T O i illustrate the propagation of shocks towards all other markets “ j ” while F R O M i signifies the transmission of shocks received by market “ i ” due to innovations in market “ j ”. The NET is expressed as the discrepancy between “ T O i ” and “ F R O M i ”. Ultimately, Chatziantoniou et al. (2022) demonstrate the integration of the frequency domain connectedness approach, as introduced by Baruník and Křehlík (2018), with the metrics in the time domain quantile connectedness purposed by (Ando et al. 2022).
N P D C i j H = d N P D C i j ( d )
T O i H = d T O i ( d )
F R O M i H = d F R O M i ( d )
N E T i H = d N E T i ( d )
T C I i H = d T C I i ( d )
The total connectedness metrics are equivalent to the summation of the corresponding frequency-connectedness metrics. It is important to note that all these connectedness measures are reliant on a particular quantile, denoted as τ.

5. Results with Practical Implications

5.1. Analysis of Overall Time Domain QVAR Extended Joint Connectedness Between TPU and GCC Islamic Financial Market Volatility

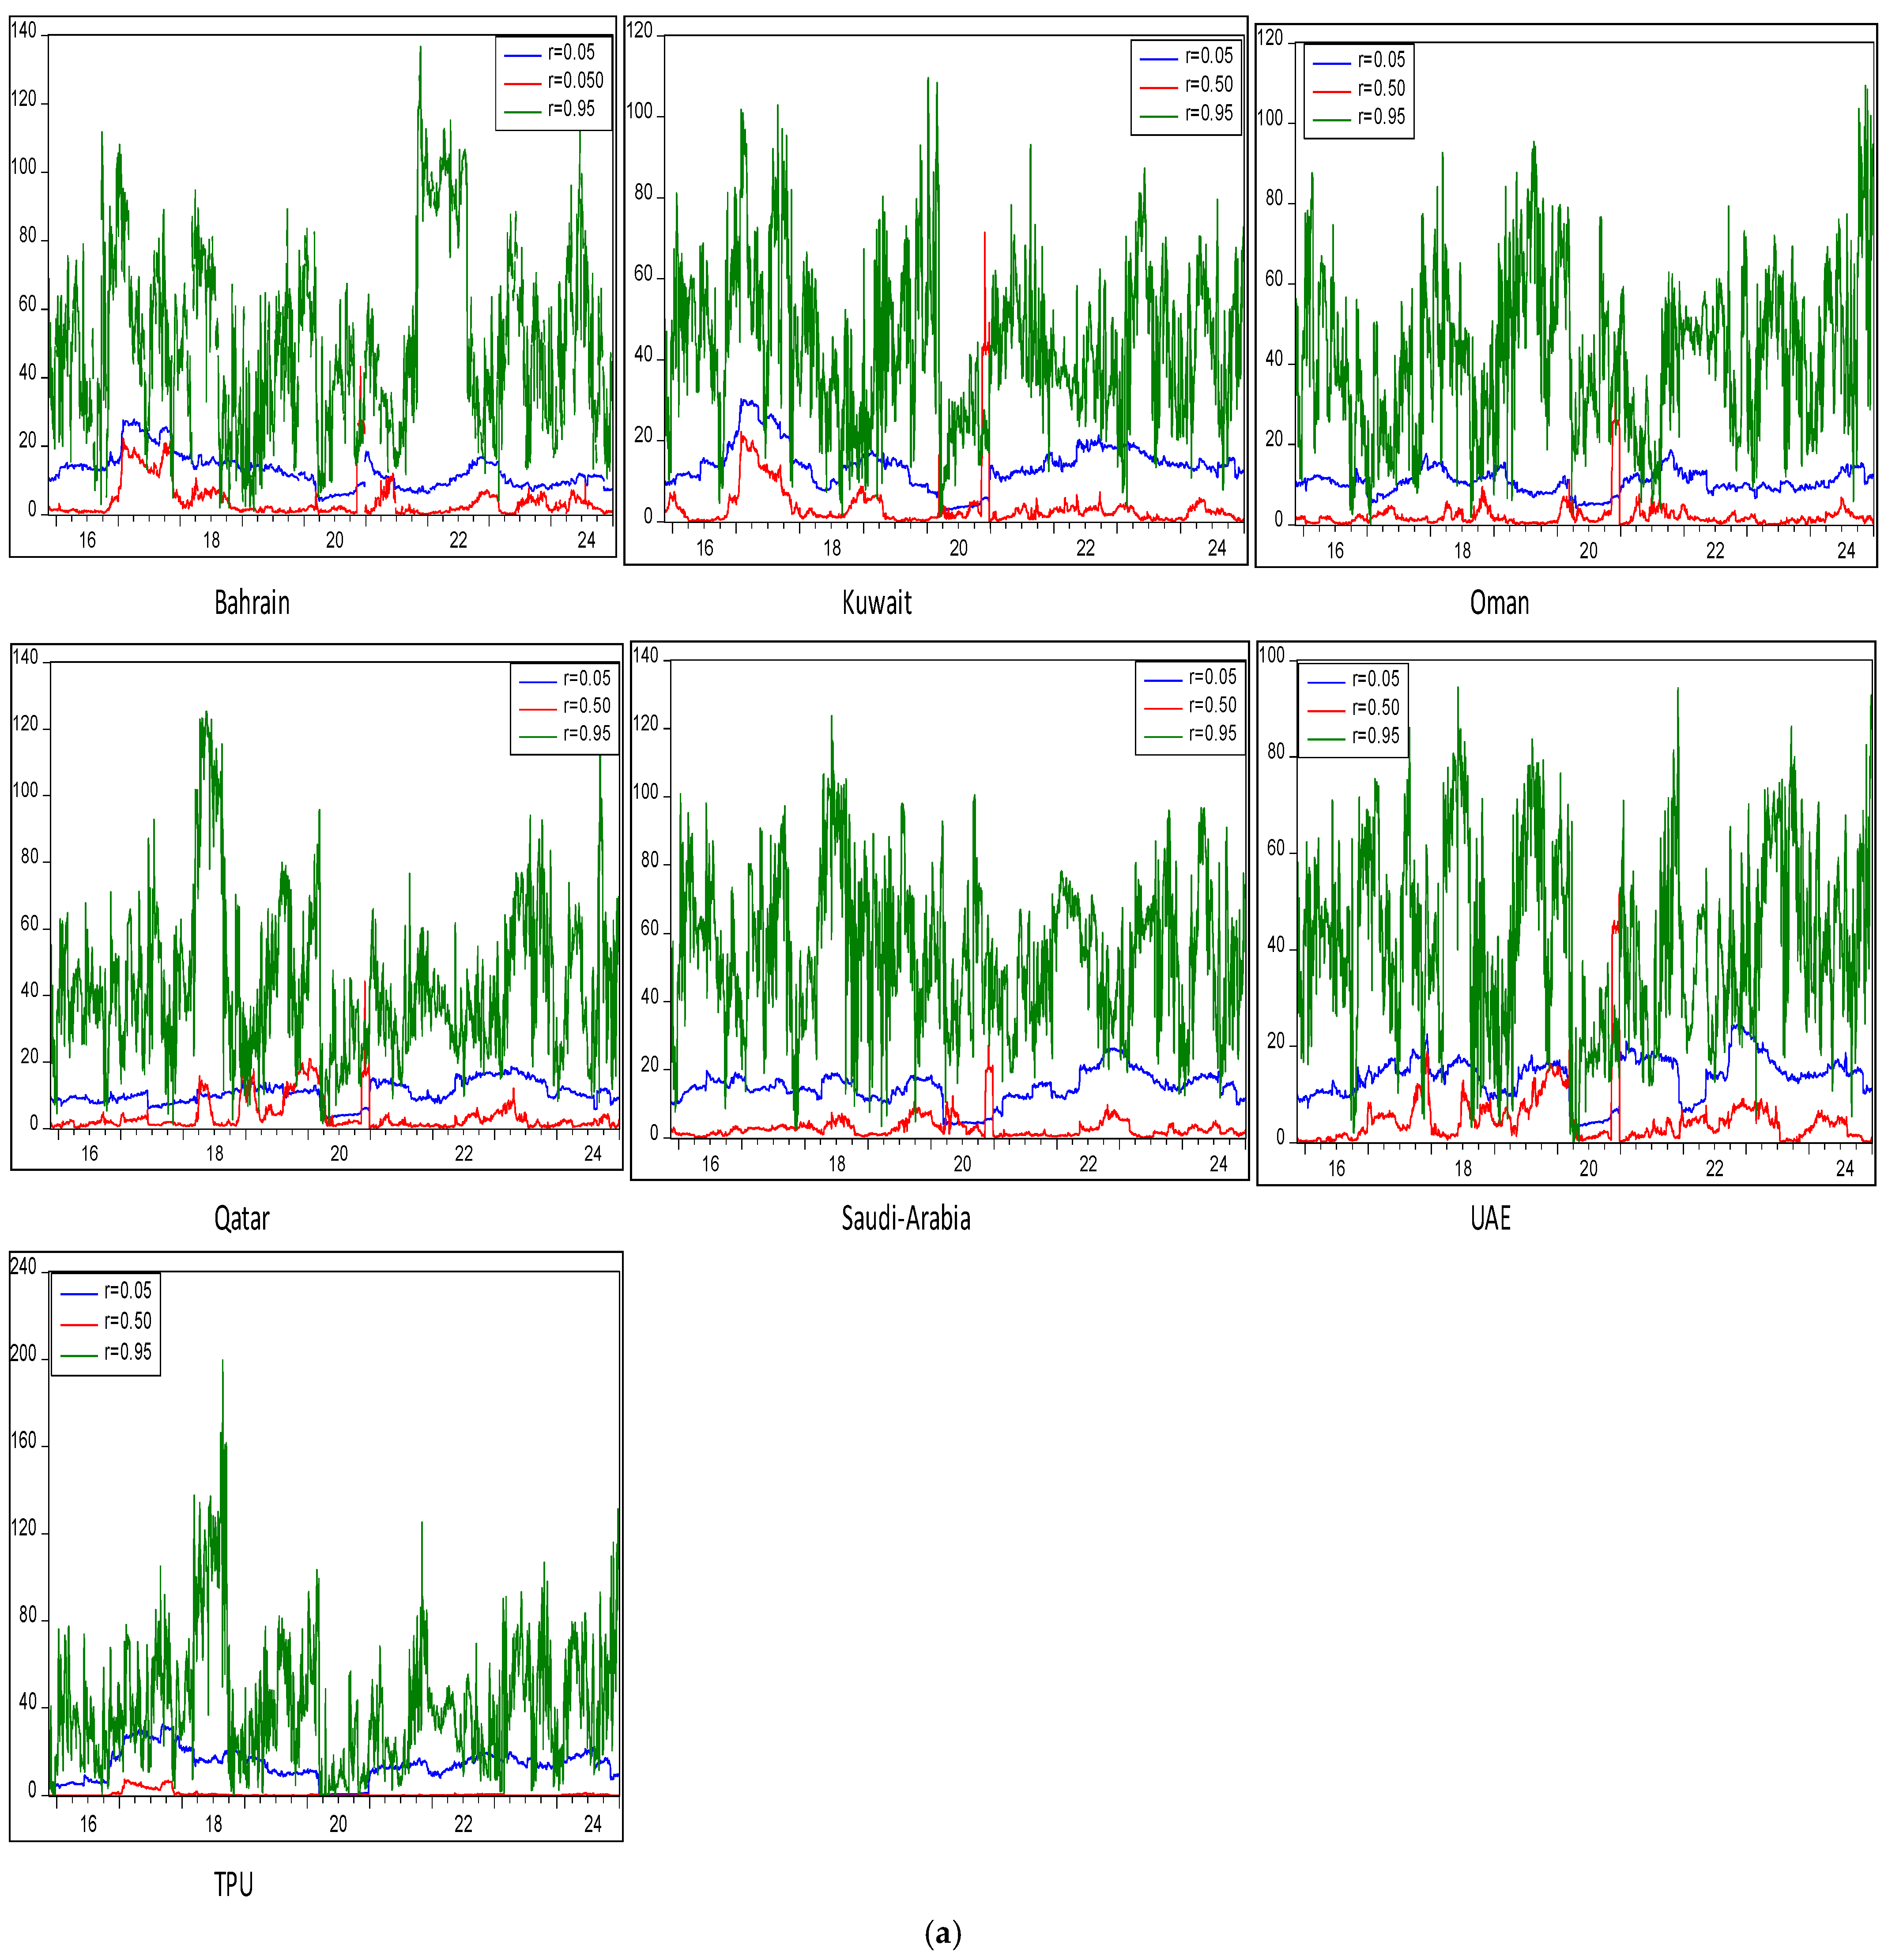
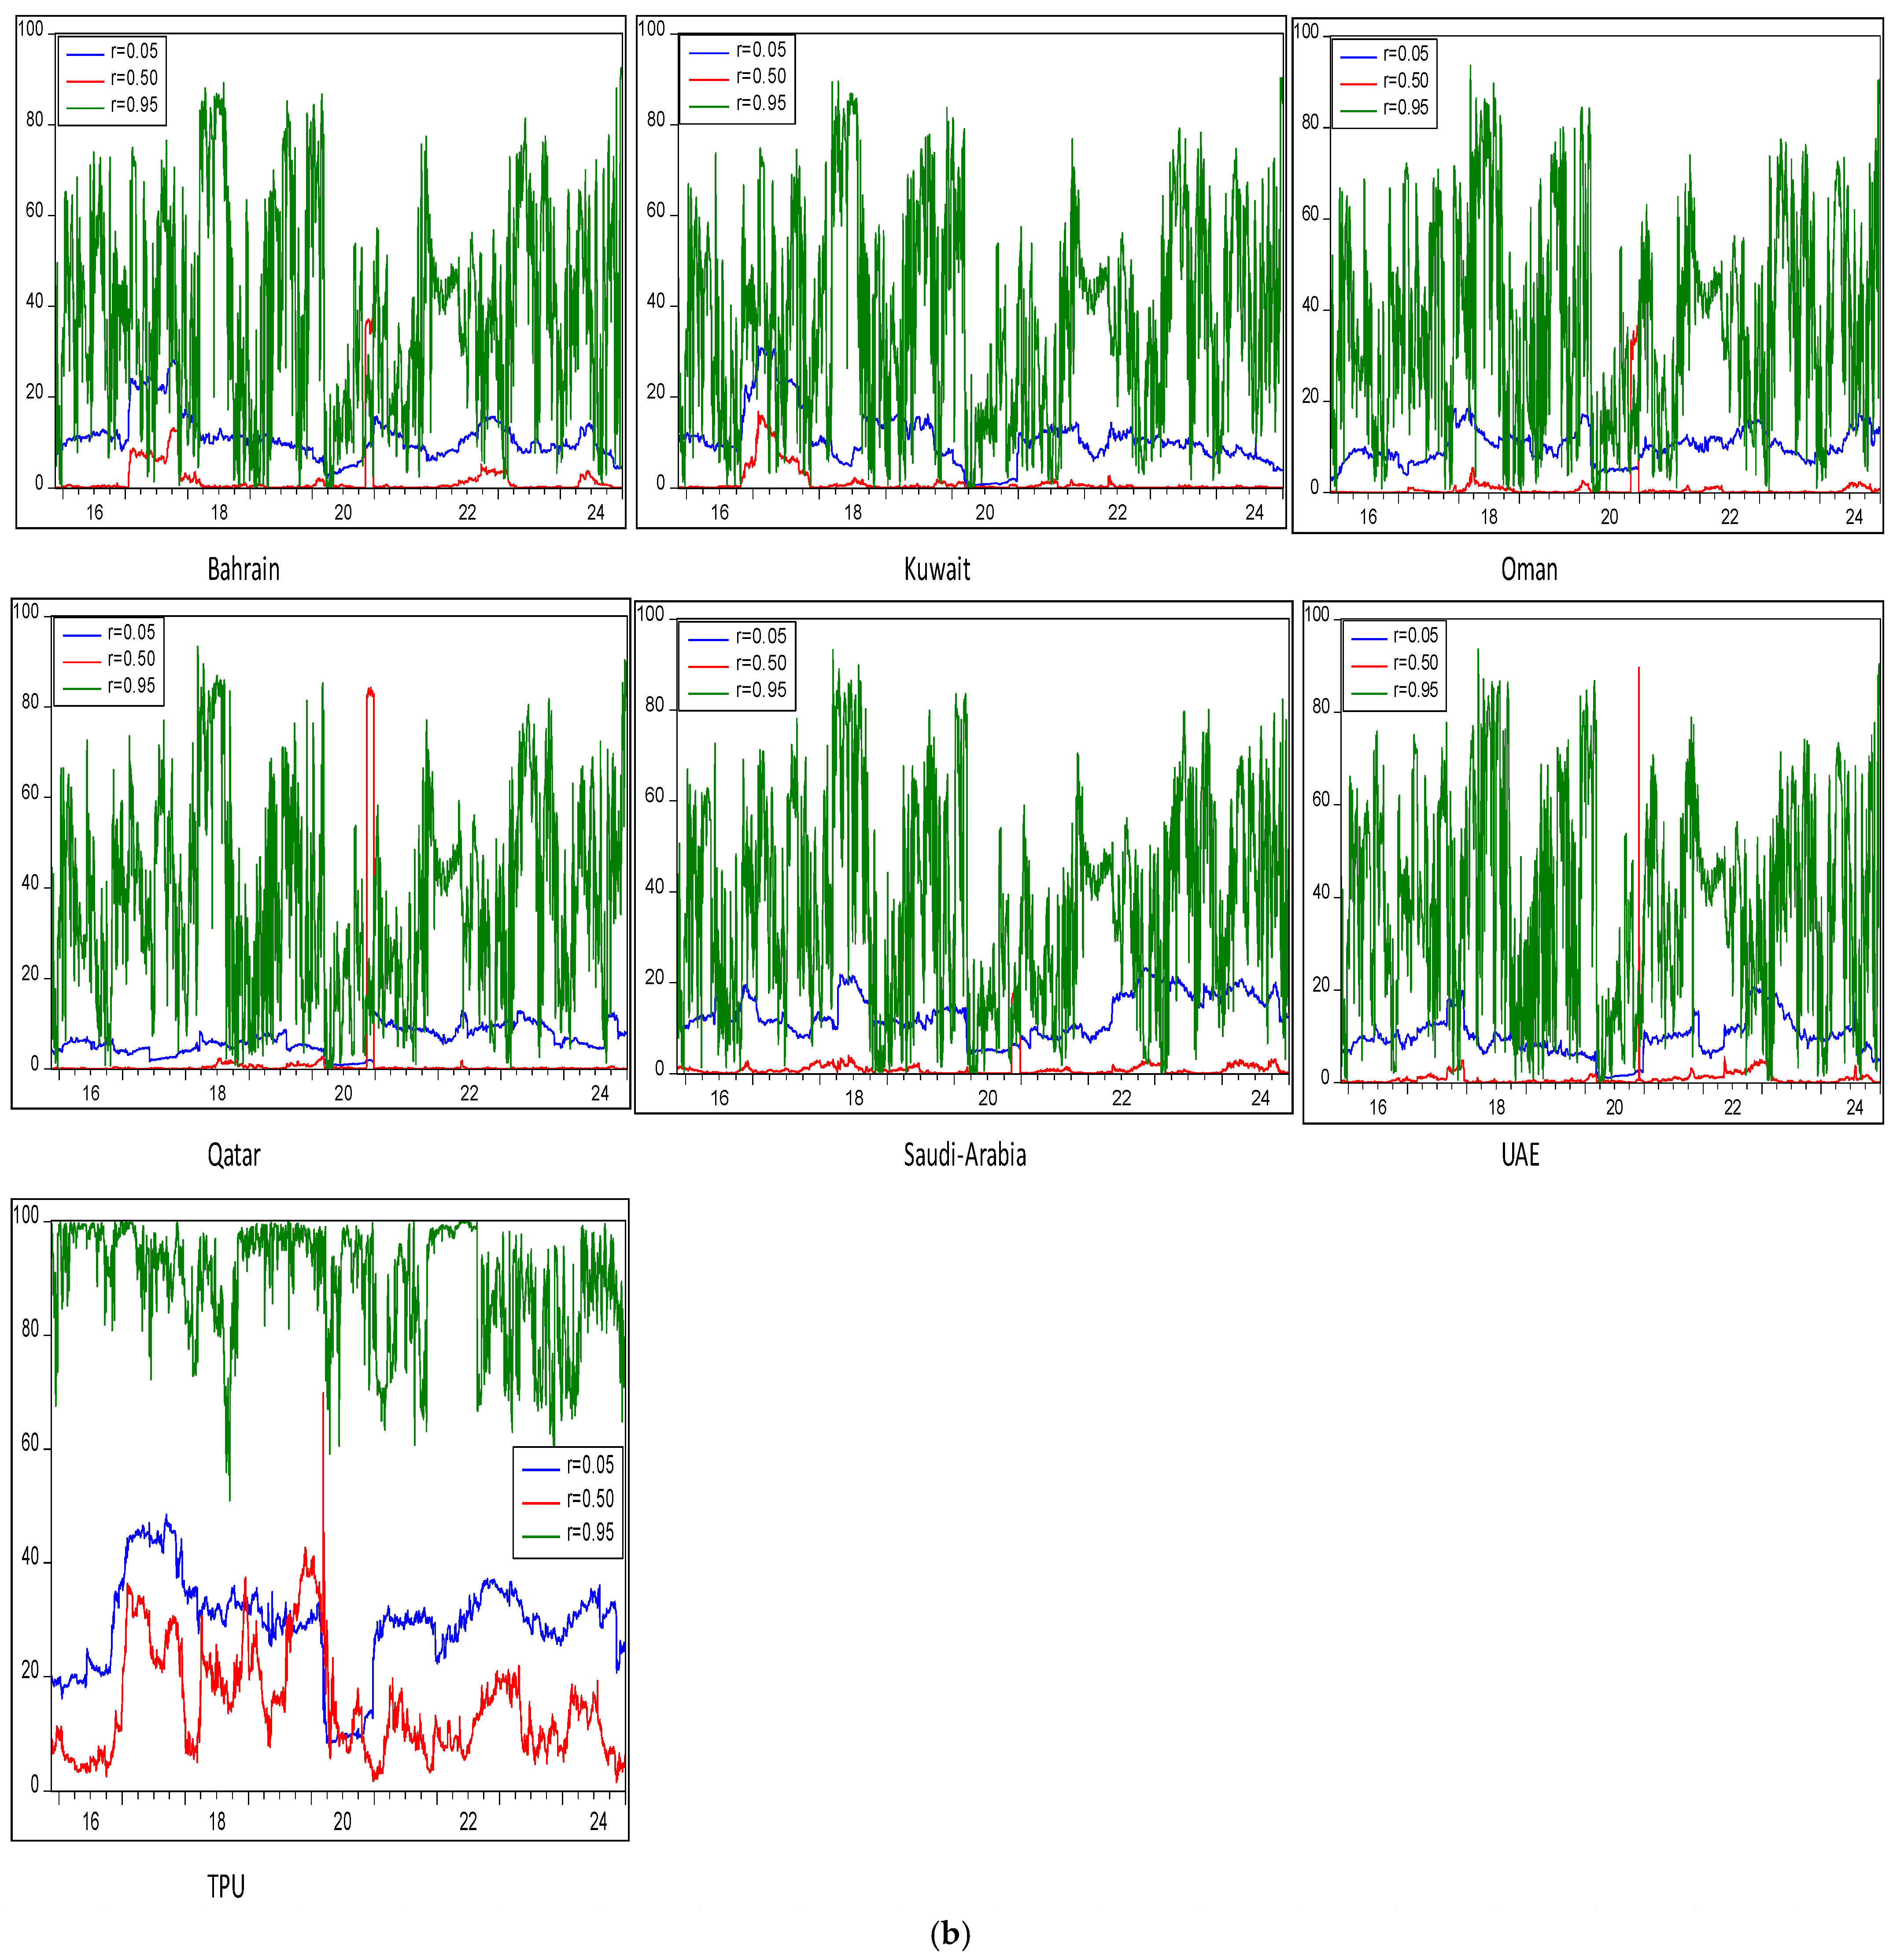
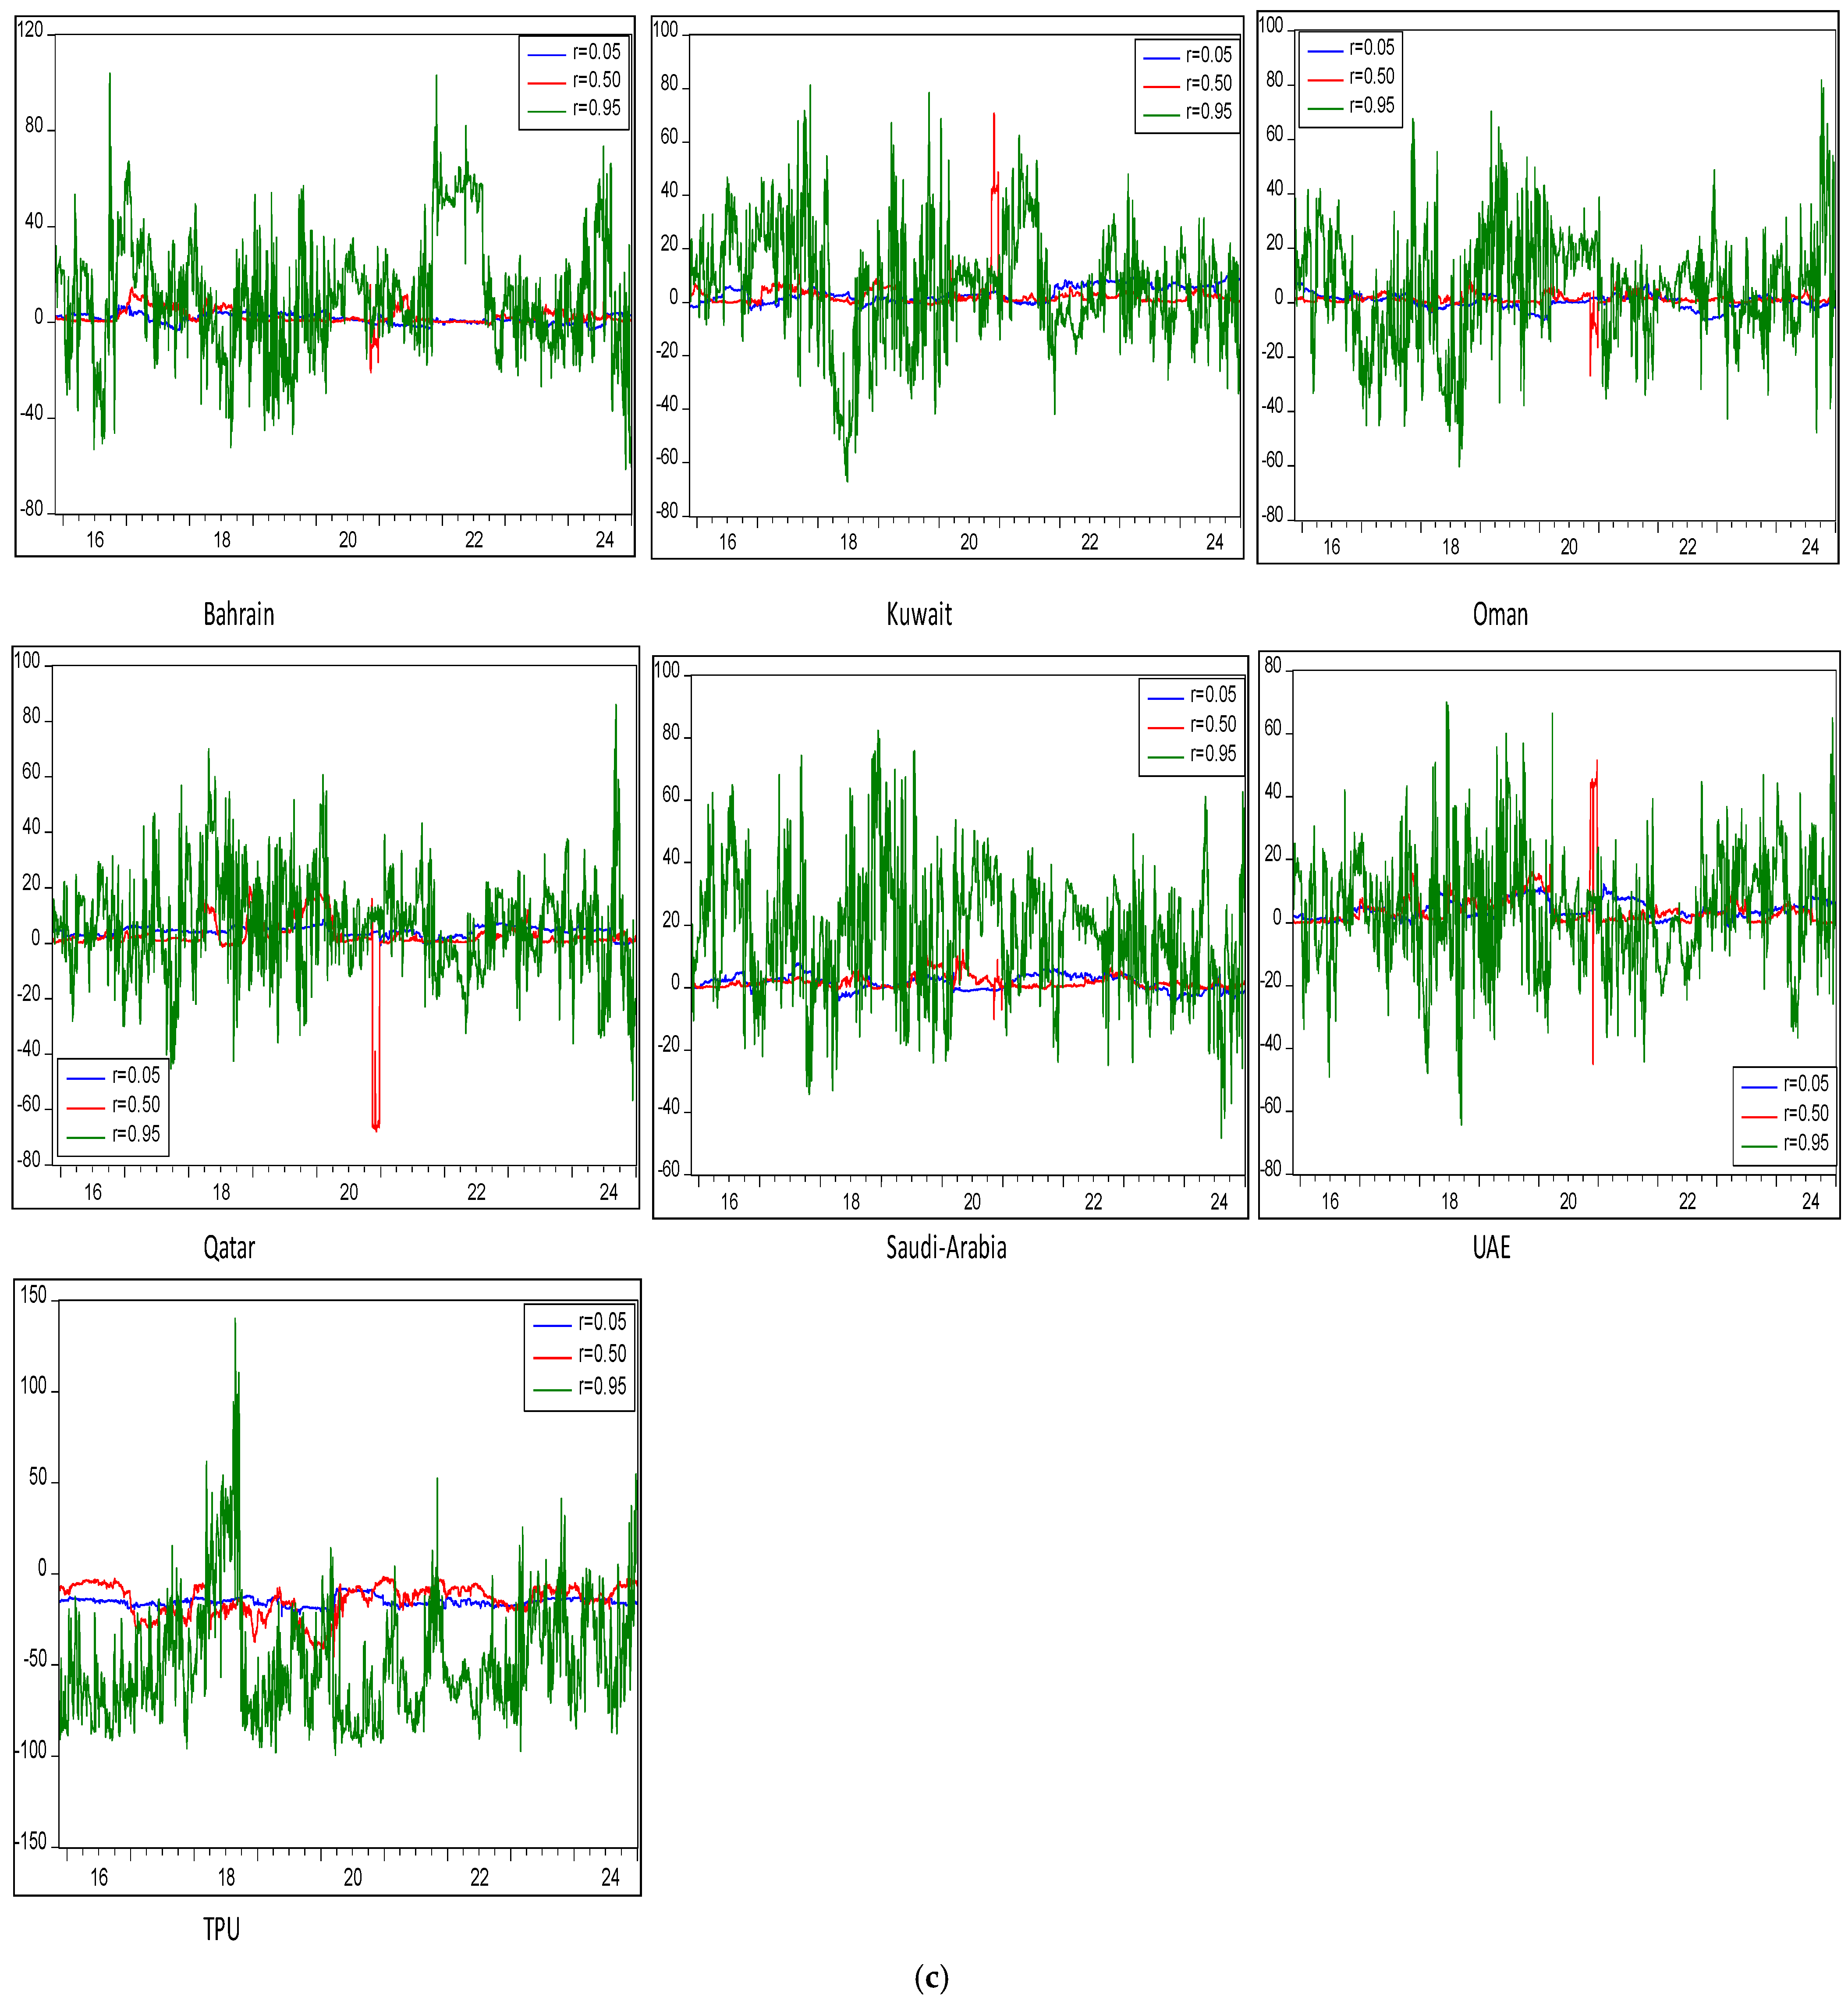
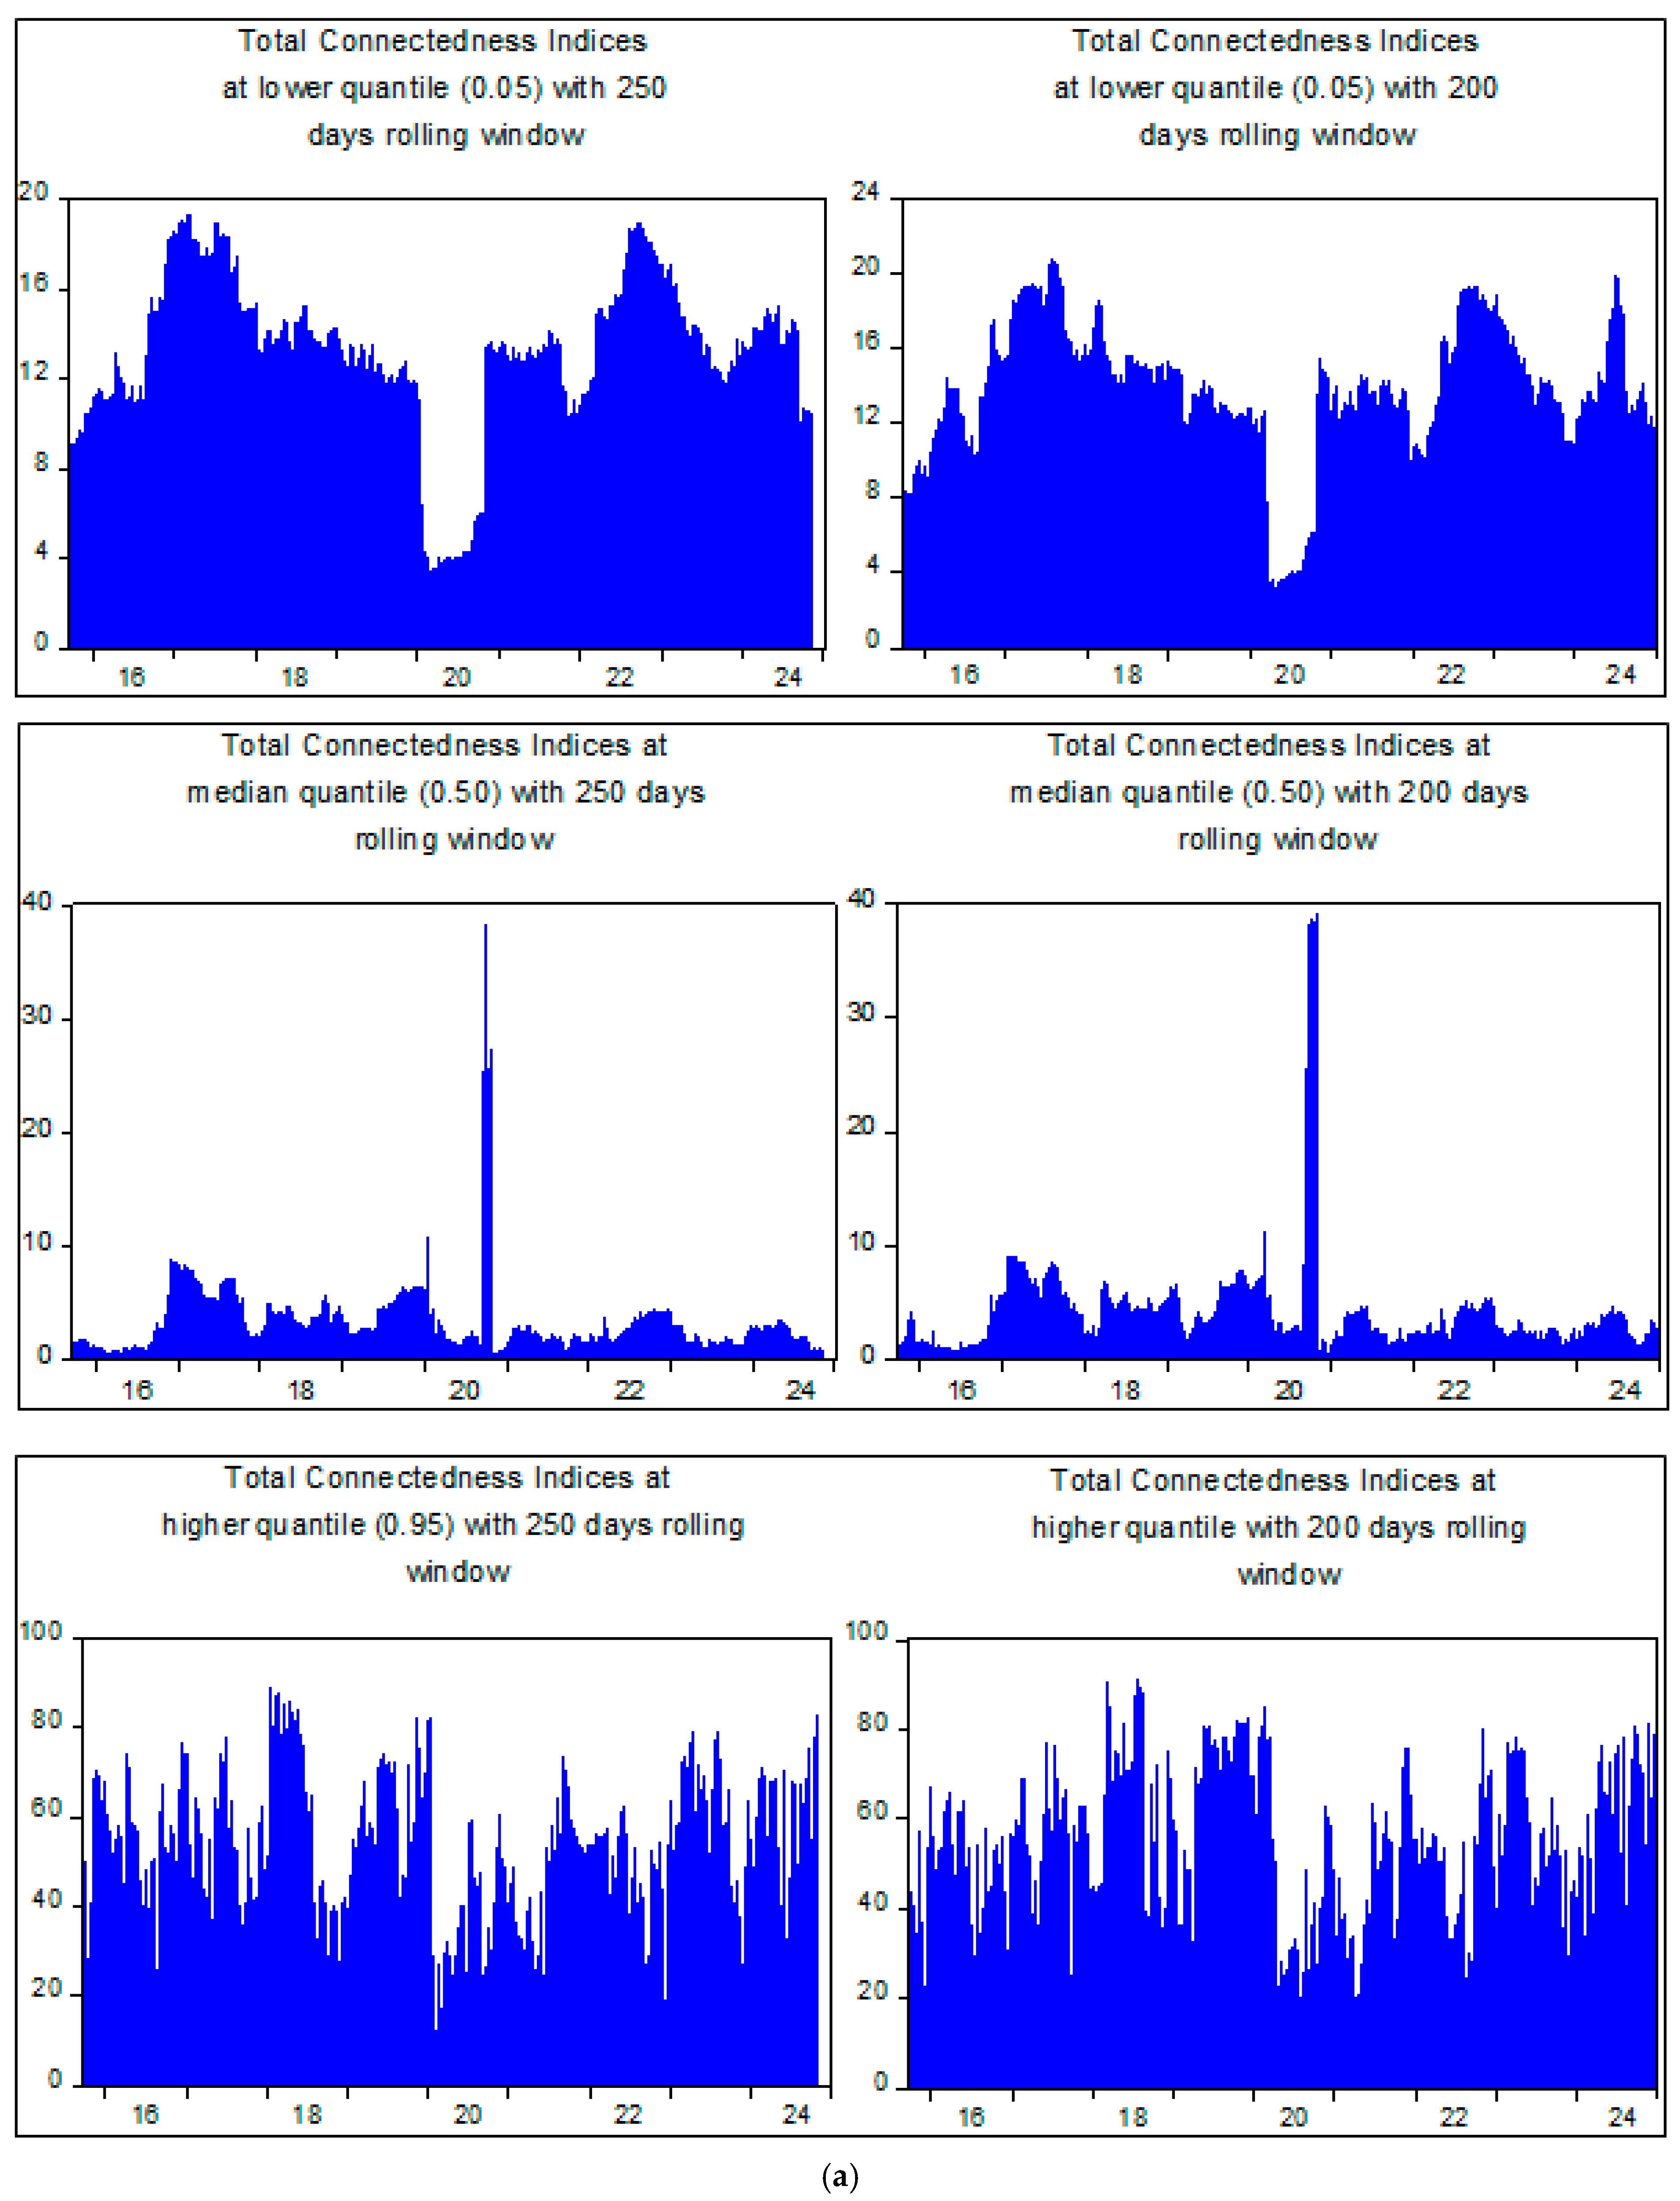
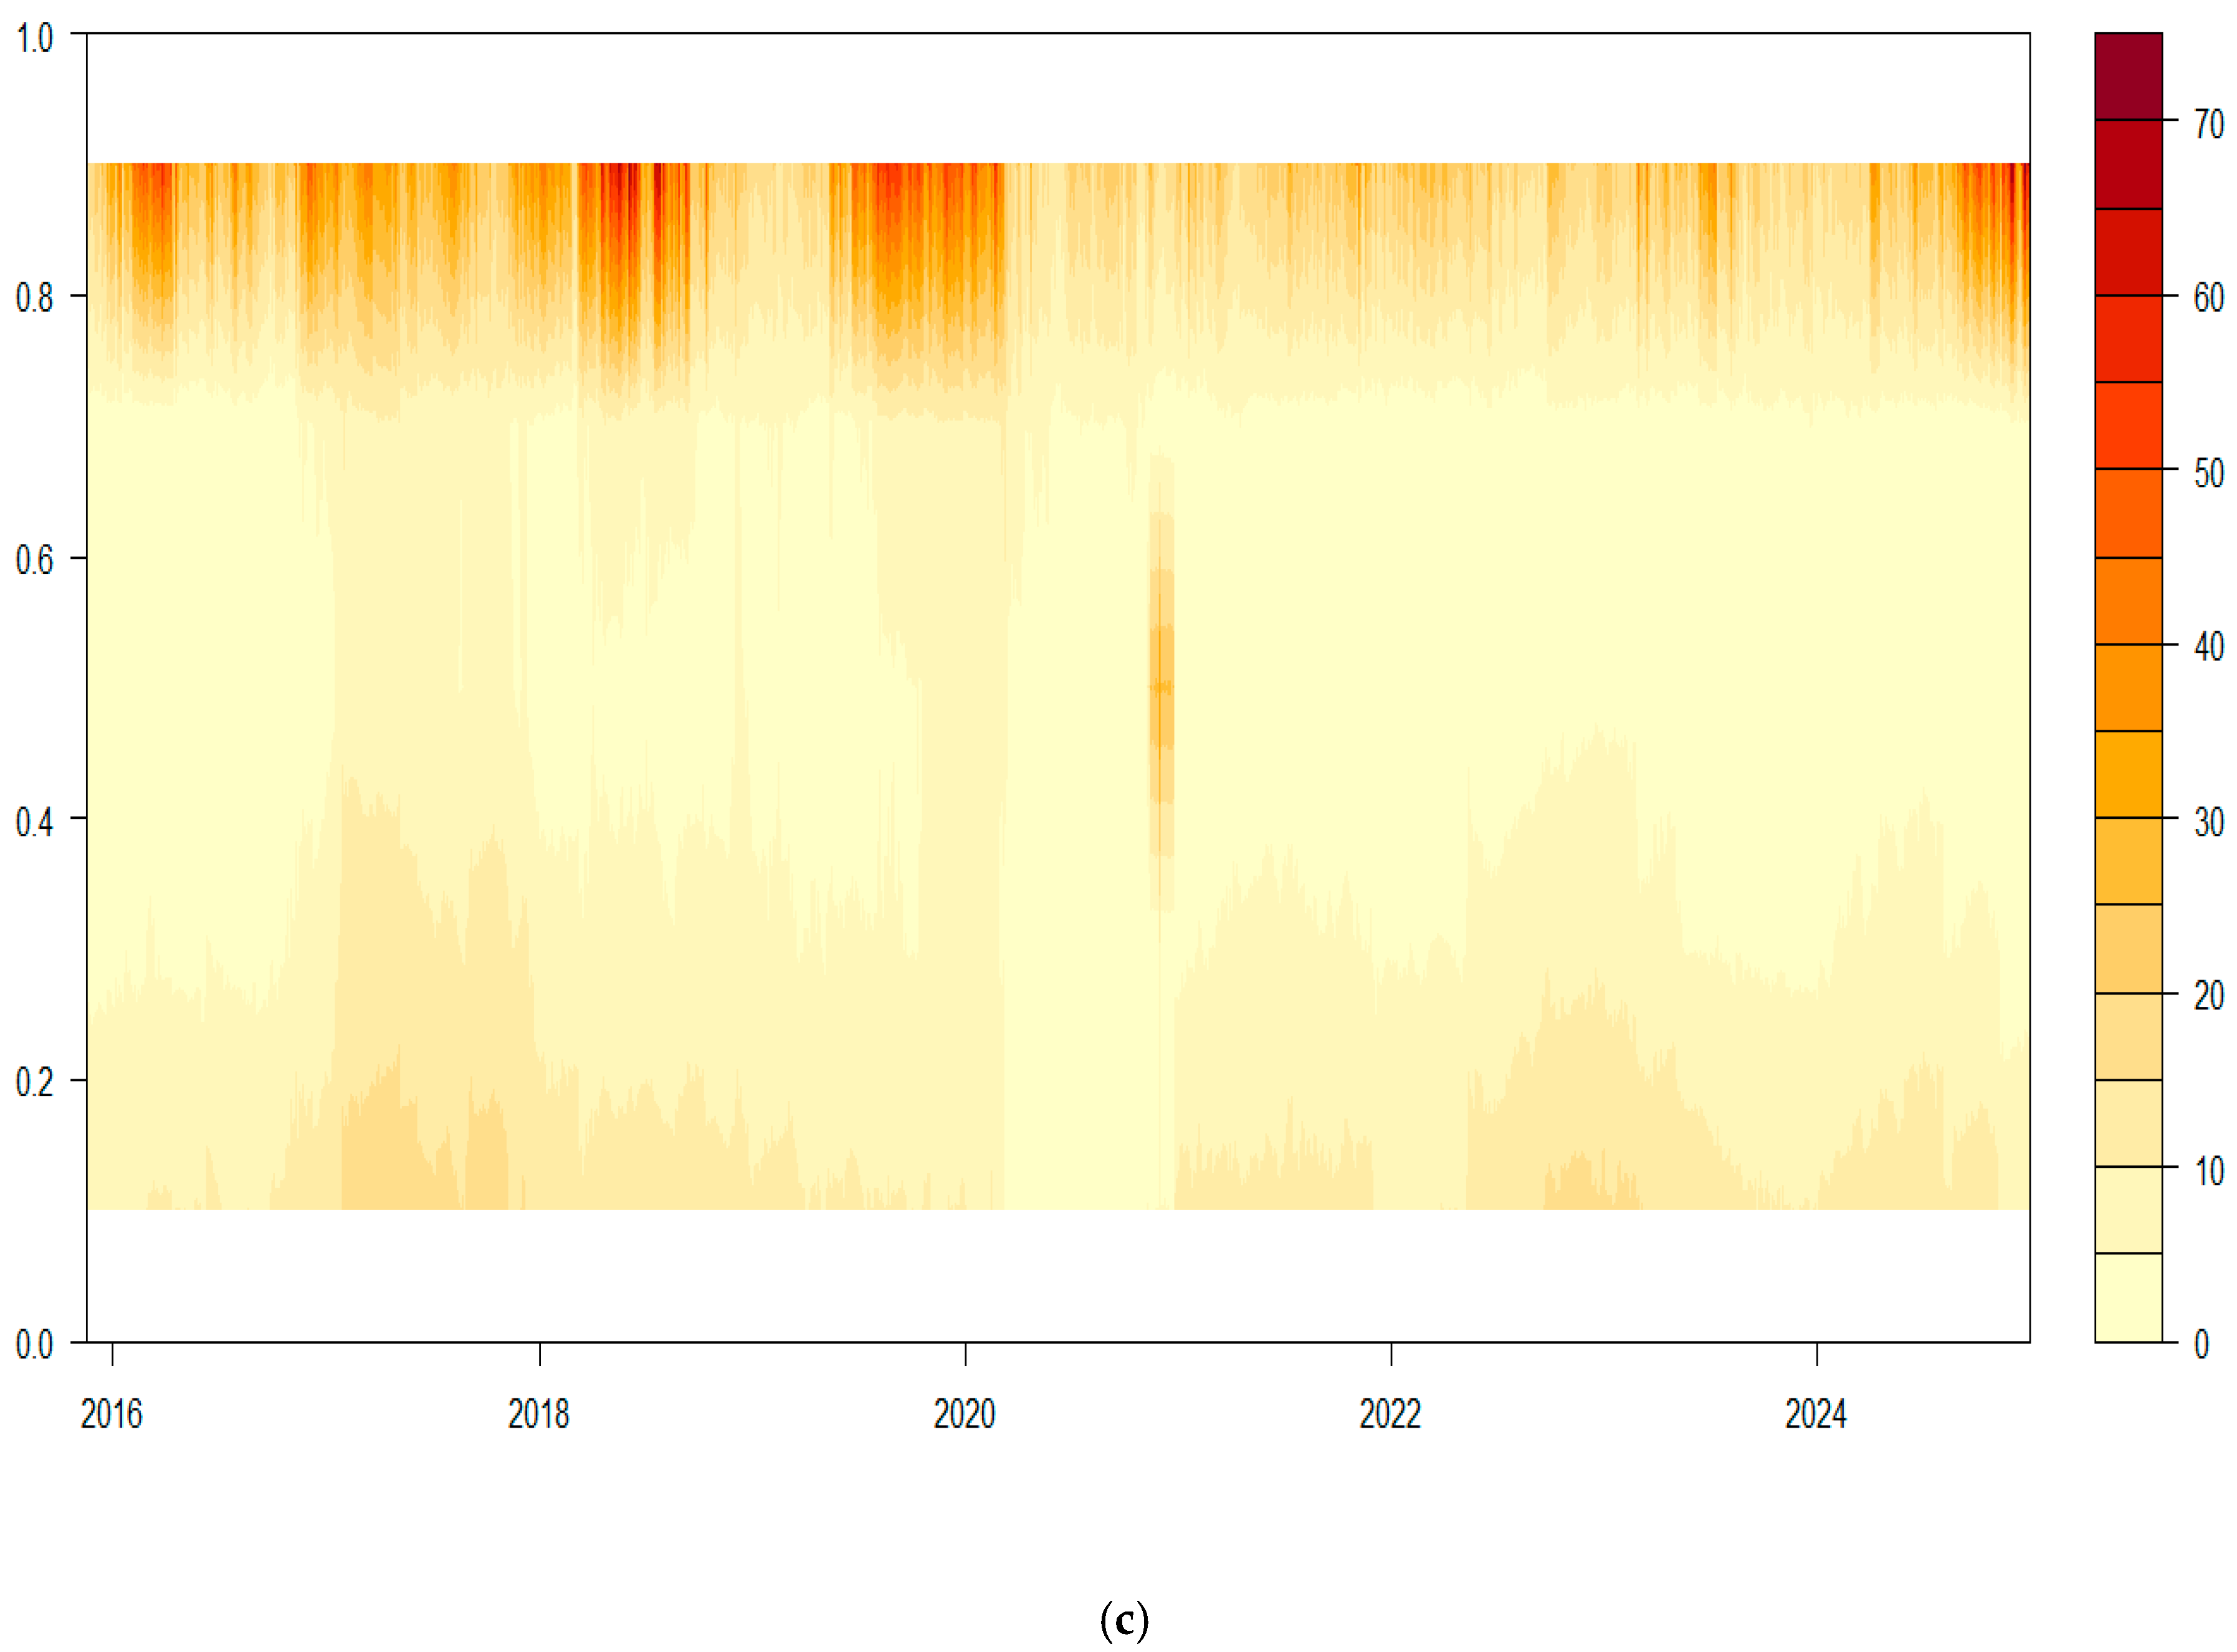
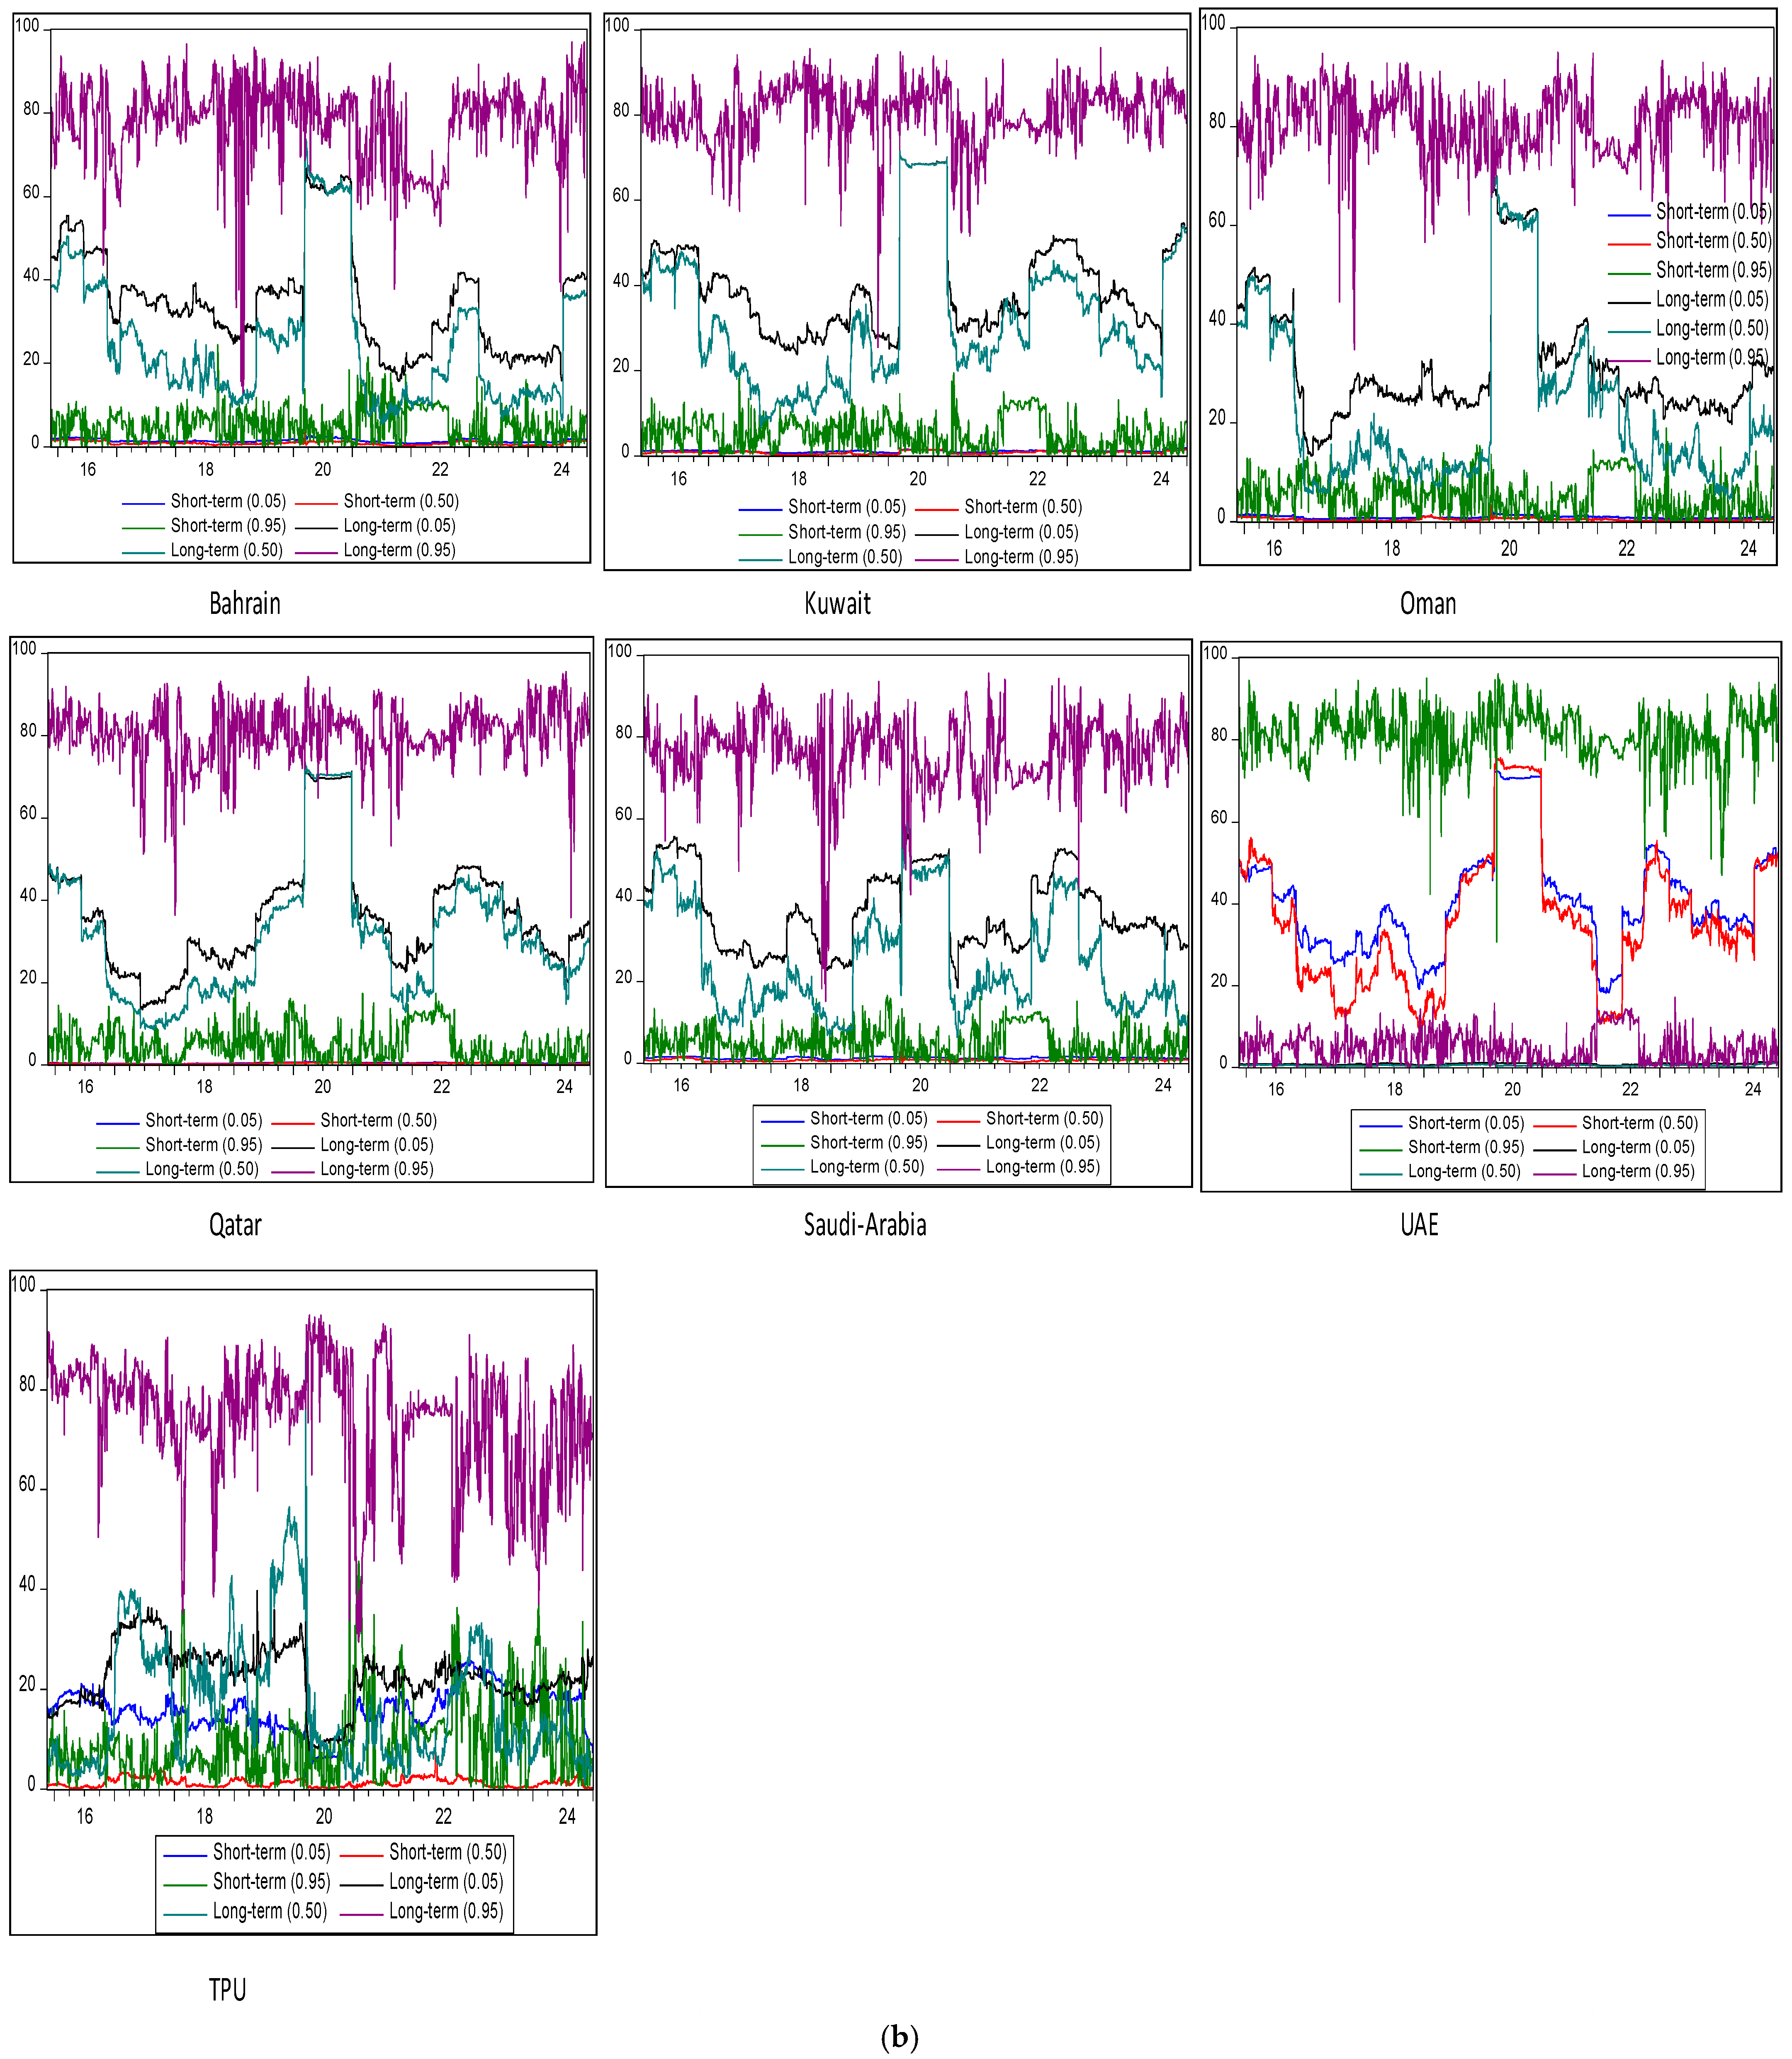
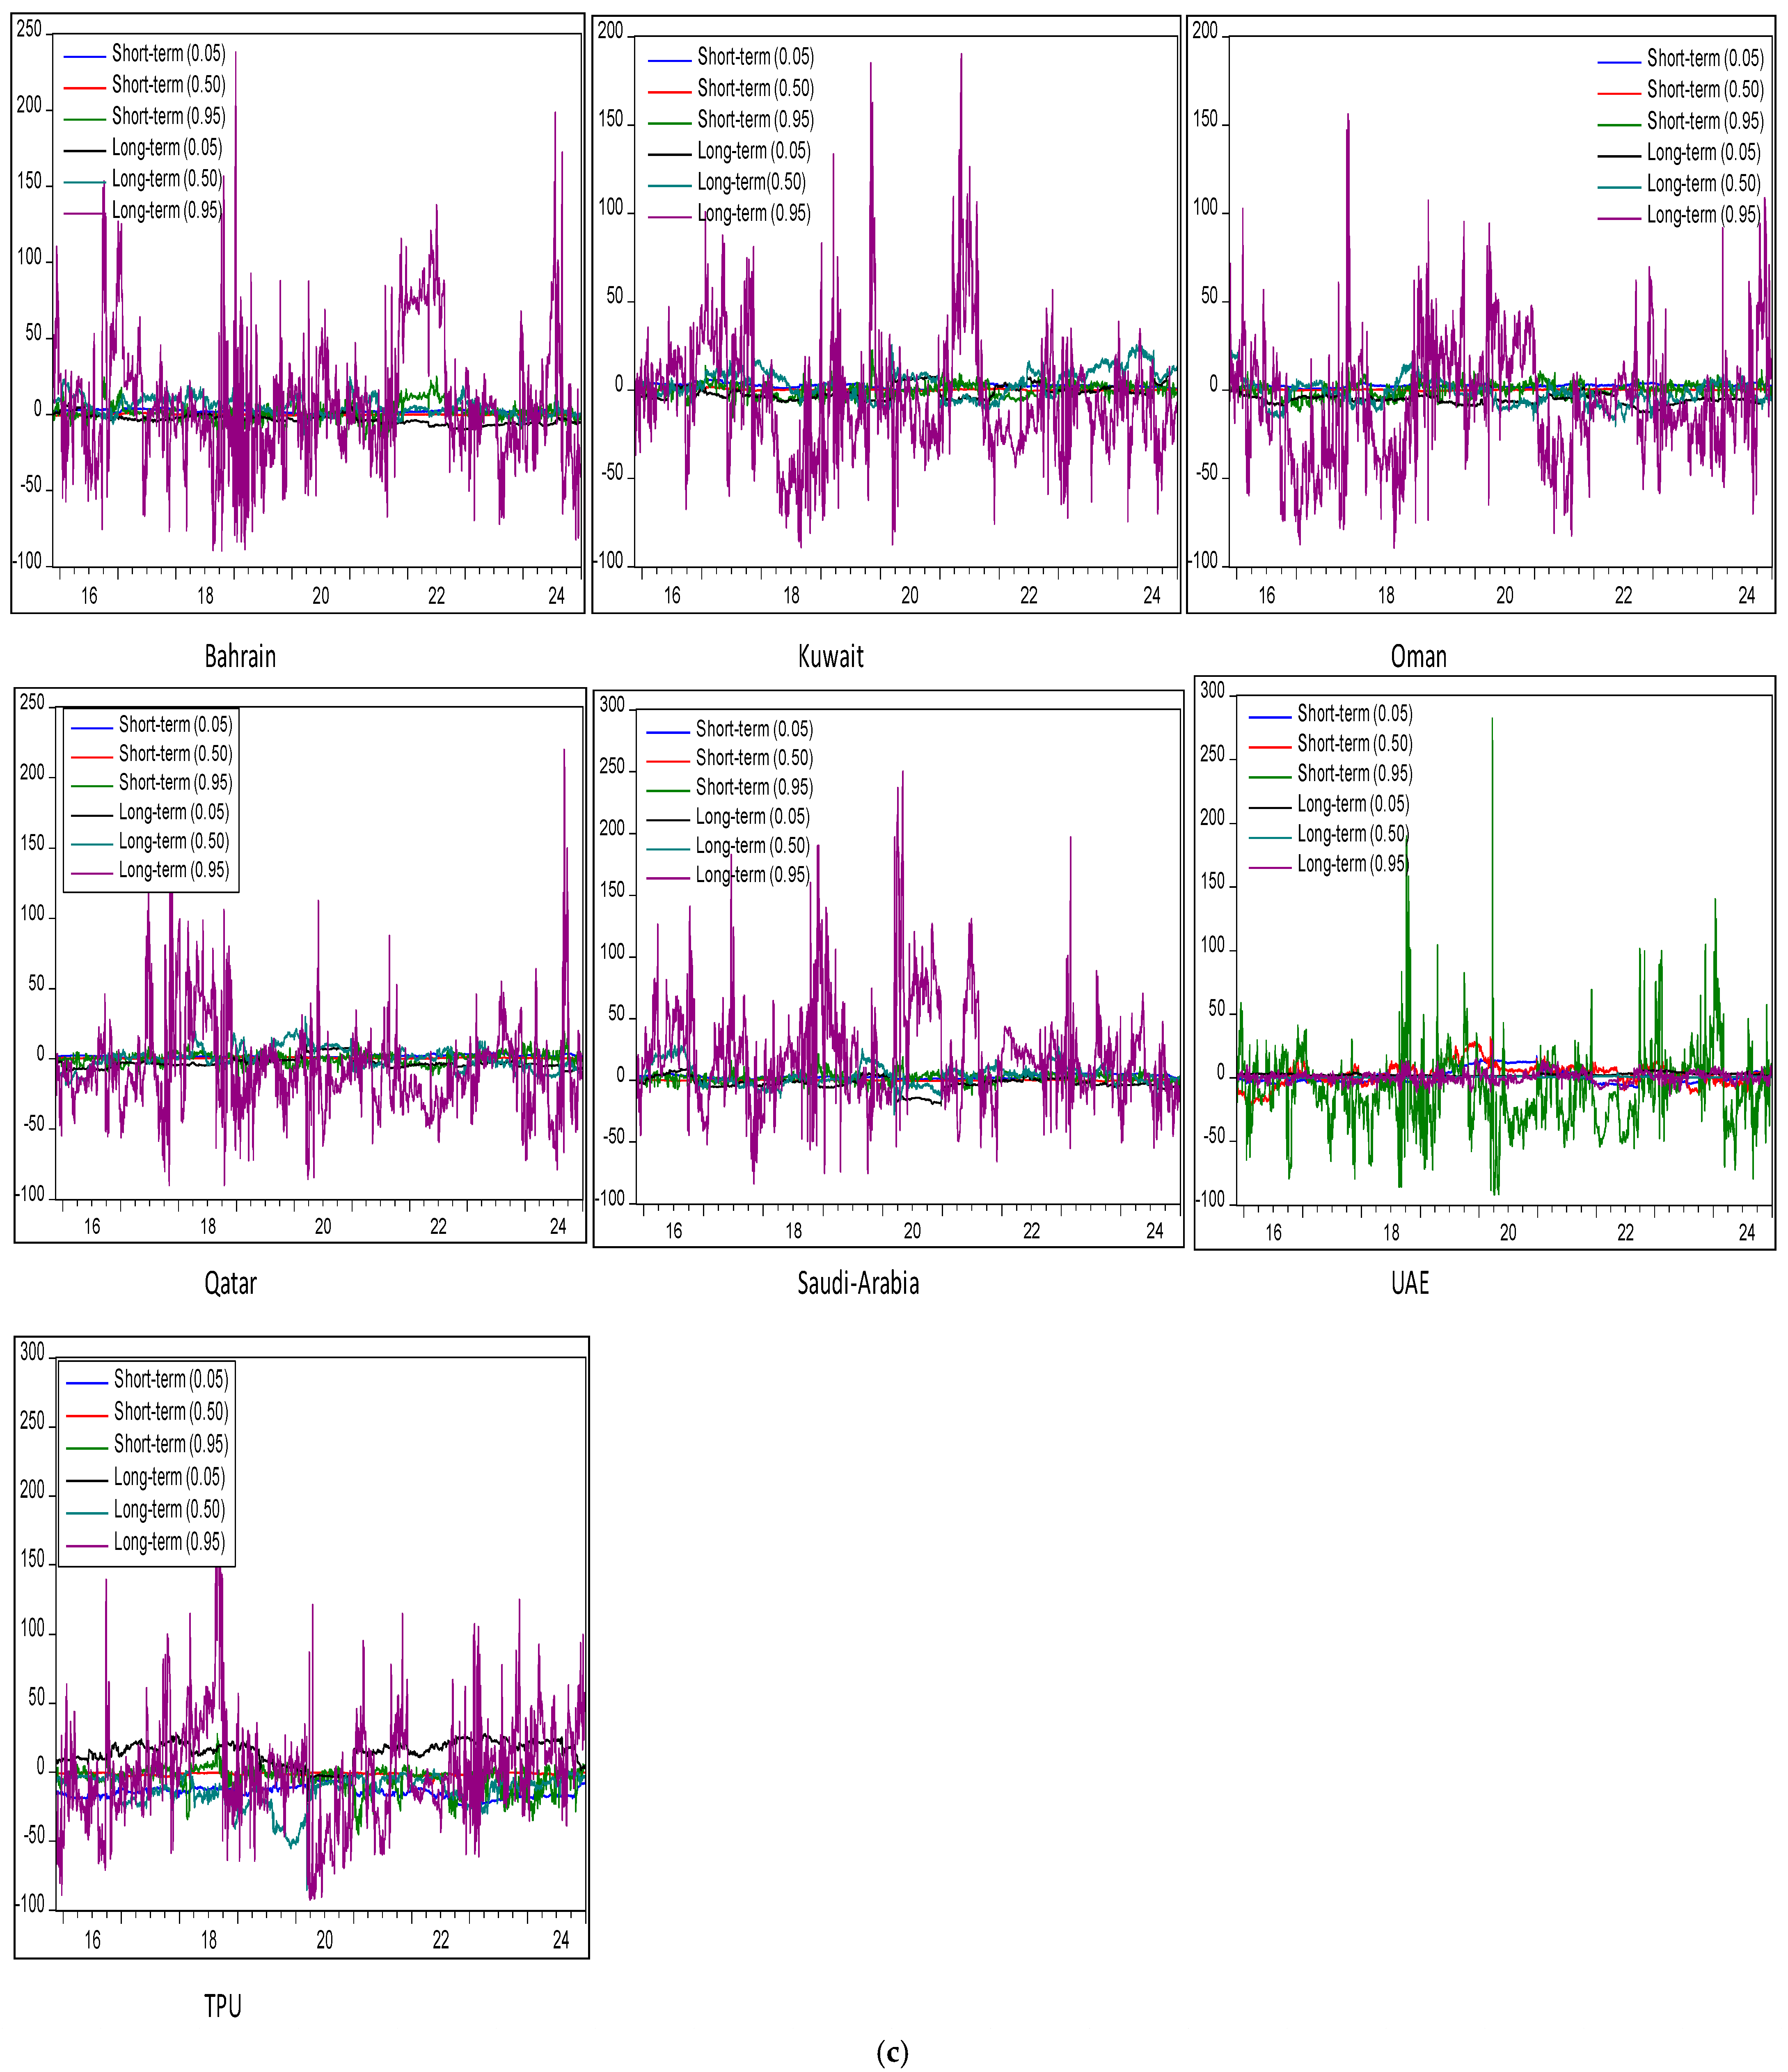
This study sheds light on the complex interplay between TPU and conditional volatility within the GCC’s Islamic financial markets at various quantiles ( τ = 0.05 ,   τ = 0.50 ,   τ = 0.95 ) by using the QVAR-based “Extended Joint” connectedness approach by Cunado et al. (2023). The findings presented in Table 5 and Figure 2 reveal an average and time-varying Total Connectedness Index (TCI), respectively varying in intensity depending on financial market volatility and TPU quantiles ( τ = 0.05 ,   τ = 0.50 ,   τ = 0.95 ) . Table 5 also delves into the specifics, quantifying the average directional (TO, FROM, and NET) spillovers between TPU and conditional volatility at different points on the volatility spectrum—bearish, moderate, and bullish. Figure 3a–c, on the other hand, offers a visual representation of time varying directional TO, FROM, and NET spillover of shocks between TPU and GCC Islamic financial markets’ volatility fluctuations over time, highlighting the dynamic nature and interconnectedness. On the contrary, our findings are consistent with results reported by Bouri et al. (2021), as they have highlighted that the connectedness between conventional financial assets remain heterogeneous across quantiles and overall aggregated forecast error variance propagation is intensified at higher quantiles. Ando et al. (2022) also examined the quantile domain shock propagation mechanism between credit risk and explore that the shock propagation between credit risk is higher in magnitude at extreme quantiles as compared with median quantile.
As per the QVAR “Extended Joint connectedness” estimates in Table 5, the propagation of total forecast error variances from Trade Policy Uncertainty (TPU) to the conditional volatility of GCC Islamic financial markets amounts to 14.03% at lower quantiles (τ = 0.05). However, during periods of bullish financial market volatility (τ = 0.95), TPU uncertainty contributes significantly more, transmitting 40.87% of error variances to the conditional risk of all GCC Islamic markets. These findings highlight the heterogeneity in the transmission of forecast error variances from TPU to GCC conditional risk across bearish and bullish quantiles. Recognizing the varying impact of TPU across quantiles suggests that investors should develop tailored investment strategies that align with different market scenarios, ensuring their portfolios are resilient in the face of shifting trade policies and Islamic financial market volatility conditions. On the contrary, our findings are consistent with results reported by Bouri et al. (2021), as they have highlighted that the connectedness between conventional financial assets remain heterogeneous across quantiles and overall aggregated forecast error variance propagation is intensified at higher quantiles. Ando et al. (2022) also examined the quantile domain shock propagation mechanism between credit risk and explored that the shock propagation between credit risk is higher in magnitude at extreme quantiles as compared with the median quantile.
Additionally, Figure 2 visually illustrates that the cumulative forecast error variances resulting from the complete transmission of shocks within the QVAR system exhibit an escalating pattern at significantly higher quantiles in contrast to lower and median quantiles. The rise in the degree of interdependence and the uneven propagation of shocks between Trade Policy Uncertainty (TPU) and financial market volatility contradicts the results of Chatziantoniou et al. (2021). Their use of the conventional time domain QVAR approach revealed consistent interconnectedness between sustainable financial assets at both higher and lower quantiles, leading them to assert that the connectedness is symmetrical.
Investors and portfolio managers may need to reconsider traditional diversification strategies, as the nature of interconnectedness and shock transmission between TPU and GCC Islamic financial market risk appears to vary across different quantiles. Depending on the asymmetry observed, portfolio diversification may need to be adjusted to account for potential heterogeneous effects of TPU on Islamic assets within GCC region. Investors may need to focus on tail risk management to protect their portfolios against extreme TPU events that could lead to intensified GCC Sharia-compliant financial market volatility. Moreover, at the higher quantiles, trade policy uncertainty contributes to heightened investor uncertainty and risk aversion. Investors may exhibit increased prudence and a diminished inclination to expose themselves to high-risk assets, particularly those prevalent in the financial markets of the Gulf Cooperation Council (GCC). Such caution could potentially lead to capital outflows, declining asset valuations, and the propagation of additional shocks affecting the conditional risk (volatility) of the Islamic equity markets.
The economies of GCC nations are highly sensitive to fluctuations in commodity prices, especially oil (Cheikh et al. 2021). Trade policy uncertainty can contribute to increased volatility in global commodity markets (Mei and Xie 2022). If trade policies create uncertainty about future oil demand or supply conditions, it can lead to fluctuations in oil prices, directly impacting the financial markets of GCC countries. Moreover, trade policy uncertainty can influence foreign direct investment decisions. GCC countries have attracted substantial foreign investment, and any uncertainty in trade policies may deter investors. The GCC economies are closely tied to global economic conditions. If major trading partners experience economic slowdowns due to trade policy shifts, it can negatively impact demand for GCC exports and overall economic activity, affecting Islamic financial market volatility. Moreover, trade policy uncertainty can lead to fluctuations in currency rates (Yu et al. 2023). GCC economies often peg their currencies to the U.S. dollar, and any significant vacillations in global trade policies can influence the value of the U.S. dollar. Currency volatility can impact trade balances, inflation, and interest rates, influencing financial market performance (Suleman et al. 2022). Therefore, central banks of respective economies should adjust fiscal and monetary policies to mitigate the TPU shocks on their Islamic financial system at the time of bullish financial market conditional volatility and TPU.
Table 5 also reveals that a shock in TPU has the most pronounced impact, accounting for 3.18% of error variances in forecasting 20-day ahead conditional volatility in Saudi Arabia. Following this, we observe contributions of 2.9% and 2.78% of error variances in the conditional equity market risk for Bahrain and Oman, respectively, particularly at lower quantiles (τ = 0.05). In contrast, during higher quantiles (τ = 0.95) or when the market experiences bullish volatility conditions, a TPU shock yields a more significant impact, contributing 7.28%, 6.86%, and 6.85% of error variances to the conditional risk in the Sharia-complaint equity markets of Bahrain, Saudi Arabia, and UAE, respectively, surpassing the influence on the rest of the GCC Sharia-compliant financial market. The findings indicate that TPU transmits error variances differently to the conditional risk of all GCC Islamic financial markets during both bearish and bullish conditional volatility conditions, with a more intense and substantial impact at higher extreme quantiles (see Table 5). Moreover, the transmission of error variances from TPU to the conditional risk of GCC Sharia-compliant financial markets is notably reduced at moderate quantiles (τ = 0.50) in comparison to both lower (τ = 0.05) and higher (τ = 0.95) quantiles. This not only suggests asymmetry but also supports the adoption of the QVAR approach, carrying practical implications for investors in the GCC Islamic financial markets.
Firstly, during the bearish conditional volatility conditions ( τ = 0.05 ) , investors should consider diversifying their portfolios by spreading investments across different asset classes and financial markets of different geographic regions that showed lower shock-reception capability from TPU shocks. This includes the financial markets of Qatar and UAE to reduce risk exposure to trade policy uncertainty, as these markets received lower error variances from TPU during bearish Islamic equity market volatility trend. Secondly, specific economies like Oman, Kuwait, Bahrain, and Saudi Arabia should establish policy guidelines and a strategic framework for businesses to access risk-mitigation tools such as trade credit insurance and currency hedging to reduce exposure to trade policy shocks during the bearish market conditional risk. This is generally due to the fact that conditional risk of the equity market returns of these economies experienced the highest contributions of shocks from TPU during bearish volatility conditions. However, during the bullish conditional risk conditions ( τ = 0.95 ), economies receiving the higher TPU shocks such as UAE, Bahrain, and Saudi Arabia should develop and maintain real-time monitoring systems to promptly detect and respond to shifts in trade policy uncertainty, enabling proactive risk-mitigation measures. Moreover, these economies should also encourage collaboration between governments and businesses to formulate policies that support economic stability in the face of trade policy shocks. This includes open communication channels and coordinated efforts in order to maintain resilience against adverse trade policy shocks at times of higher financial market risk and bearish equity market returns. Thirdly, ethical investment strategies adhering to Sharia principles should be crafted considering the specific volatility conditions in Islamic financial markets. To illustrate, during periods of lower volatility (quantiles), the conditional volatility in the Islamic financial markets of Qatar and UAE exhibited the smallest error variances resulting from TPU shocks. Conversely, in times of higher volatility (bullish conditions), TPU shocks led to the least transmission of error variance in the conditional volatility of Qatar and Kuwait. Therefore, financial market conditional volatility of Qatar experienced the lowest TPU shocks during the bearish, bullish, and moderate volatility conditions, and GCC fund managers should include the Sharia-complaint Qatari stocks in their portfolio to hedge against the fluctuating TPU shocks across varied quantiles.
In accordance with Figure 2, aligning with the aforementioned observations, the Total Connectedness Index (TCI) at the extreme quantiles—specifically, lower (τ = 0.05) and higher (τ = 0.95)—exhibit a comparable trend, markedly surpassing the median quantile (τ = 0.50) in a statistically significant manner. Additionally, Table 5 presents that the cumulative forecast error variances arising from shock transmission across the entirety of the system at lower and higher quantiles amount to 12.87% and 40.90%, respectively. In contrast, the total aggregated forecast error variances at the median quantile stand at 3.14%. This underscores the asymmetrical connectedness arising from the differing transmission of shocks during extreme conditions of conditional risk and trade uncertainty, in contrast to the conditions of moderate financial market volatility and trade uncertainty shocks. Furthermore, Figure 3a, Figure 3b, and Figure 3c highlight the directional “TO”, “FROM”, and “NET” directional spillover of shocks at multiple quantiles, respectively.
Figure 3a demonstrates that at the tails of the distribution, encompassing both lower and upper quantiles, a shock in TPU exhibits a noticeable increase in the transmission of error variances compared to the median quantile, influencing GCC Islamic financial market volatility. This suggests potential asymmetry in the transmission of TPU shocks across different quantiles. The heightened transmission of TPU shocks affecting the volatility in all GCC Islamic financial markets was observed in the early stages of 2015 and 2016 at higher quantiles (see Figure 3a). This trend persisted consistently throughout 2016, intensified toward the end of 2017, and became particularly pronounced during the period impacted by the COVID-19 pandemic, especially at higher quantiles (see Figure 3a). Figure 3b visually depicts that the conditional volatility in all GCC Islamic financial markets experienced the most substantial forecast error variances from both each other and TPU shocks during bearish conditional risk conditions (lower quantiles represented in blue) compared to median quantiles (red-colored line). This pattern held true within the 2015–2018 period and throughout the COVID-19 era. Conversely, the volatility of all GCC Islamic financial markets also exhibited heightened susceptibility to volatility shocks originating within these markets and from TPU in the higher quantiles (represented by the green-colored line) during the intermediate period between 2015 and 2016, the latter half of 2017, and the entire duration of the COVID-19 crisis. Moreover, mirroring the observed directional TO (Figure 3a) and FROM (Figure 3b) spillover patterns, Figure 2 illustrates that the overall time varying interconnection measures, referred to as TCI, between the conditional risk of GCC Islamic equity markets and TPU remained elevated from 2015 through 2017, as well as in the middle of 2018 and throughout the COVID-19 period, particularly at higher quantile levels compared to lower and median levels.
The substantial amplification of shock propagation can be attributed to the heightened trade uncertainty in 2016, marked by active U.S. participation in discussions concerning the Trans-Pacific Partnership (TPP), a substantial trade agreement (Chodor 2019). A pivotal shift in trade policy materialized with the formal withdrawal of the United States from the Trans-Pacific Partnership (TPP) in January 2017 (ALJAZEERA 2017). Concurrently, U.S. trade tensions with China were escalating, marked by disputes over intellectual property rights and taxes (Bown 2019). The passing of Justice Antonin Scalia in February 2016 (Liptak et al. 2016) resulted in a vacancy on the Supreme Court, raising concerns about its potential impact on trade-related cases and laws (Carmon 2016). The uncertainty intensified as candidates outlined future trade policies during the U.S. presidential election campaign (Noland 2018), further complicating the outlook for potential TPU changes. The initiation of the North American Free Trade Agreement (NAFTA) renegotiation in May 2017 introduced additional trade uncertainty, as the outcome became less predictable (Alschner et al. 2018). Moreover, the disruption within the global supply chain network due to the COVID-19 pandemic (Ding et al. 2021) further compounded the impact of TPU, potentially exacerbating volatility in Islamic financial markets. In the midst of the heightened uncertainty brought about by the pandemic, investors found themselves responding to rapidly changing conditions, attempting to analyze risks (Ftiti et al. 2021). This complex environment could contribute to abrupt market volatility, driven by ambiguity surrounding trade policy, tariffs, and international relations. Consequently, the heightened Trade Policy Uncertainty (TPU) had a more pronounced impact, leading to increased error variances to the conditional risk of Sharia-compliant financial markets during COVID-19. The global impact of the COVID-19 pandemic is expected to result in a substantial and enduring decline in worldwide economic output, exhibiting varied outcomes across countries and regions (Chudik et al. 2021).
The different responses of shareholders during diverse volatility conditions in the GCC contribute to an uneven connectedness between TPU and GCC Islamic financial markets’ volatility. The impact of TPU shocks on market volatility is not uniform across different volatility conditions, and the reactions of shareholders play a significant role in this asymmetric connectedness (Bouri et al. 2021). Volatility tends to shift more frequently between financial markets when rational traders grapple with insufficient information (Ahmed 2021). This issue is compounded, as expected, during periods of heightened conditional risk and increasing policy uncertainty related to trade issues. Consequently, the level of interdependence between TPU and GCC Islamic financial markets in these situations may not be equivalent to that observed in normal conditions. The asymmetrical transmission of shocks between TPU and stock market conditional volatility may undergo changes when the underlying financial market volatility series follow non-elliptical or fat-tailed distributions (Suleman et al. 2022).
It is crucial to acknowledge that the conditional distribution across quantiles exhibits multiple facets, with the conditional mean representing just one aspect (Benkraiem et al. 2018). This is because causality in the distribution tails may deviate significantly from that in the central region (Ando et al. 2022). The recognition that structural breakdowns are now widely accepted as a characteristic feature of economic time series (Demirer et al. 2018). Major global events, such as uncertainties surrounding trade policy, are often associated with these interruptions. The resulting nonlinearities in the dynamics of time series data could contribute to the unequal connections observed between Trading Policy Uncertainty (TPU) and conditional risk in GCC Islamic financial markets. Furthermore, fluctuations in diverse market volatility conditions—bearish, bullish, and moderate—can exert distinct influences on investment decisions across various investment horizons (Chatziantoniou et al. 2022). Therefore, we also consider the quantile-based shock-transmission mechanism between TPU and GCC Islamic financial market conditional volatility across short and long-term investment horizons (multiple frequency wavelengths) as compared with Markov Regime Switching VAR and Threshold-based VAR approaches.

5.2. Sensitivity and Robustness Analysis for the QVAR with “Extended Joint” Connectedness Approach

Figure 1 presents the conditional volatility series of Sharia-compliant equity market returns for the Gulf Cooperation Council (GCC) member economies—Bahrain, Oman, Kuwait, Saudi Arabia, Qatar, and the UAE—estimated using the GARCH (1,1) model with a Generalized Error Distribution (GED). The GARCH (1,1) model with GED was chosen over the GARCH (1,1) model with a student’s t distribution due to its higher log-likelihood values and lower Akaike Information Criterion (AIC), Schwarz Criterion (SC), and Hannan–Quinn (HQ) values (see Table 2). Figure A1 also illustrates the conditional volatility series of Islamic stock returns for GCC member economies estimated using the GARCH (1,1) model with a student’s t distribution, revealing only negligible differences with the conditional volatility series estimated through GARCH (1,1) with GED (see Figure 1). Consequently, the estimation of shock spillovers from Trade Policy Uncertainty (TPU) to the conditional volatility of GCC equity markets remains robust regardless of the choice of distribution used in the GARCH (1,1) model for estimating conditional volatility series in GCC member economies.
Figure 4a shows that the overall quantile domain Total Connectedness Index (TCI) between GCC stock market volatility and TPU due to the aggregated value of the spillover of shocks within the entire QVAR system across bearish, bullish, and moderate quantiles remain stable at different rolling windows (250 and 200). Rolling windows in QVAR with “Extended Joint” are used in this article and in the domain of financial economies to record dynamic quantile domain interactions between TPU and GCC stock market conditional volatility across time. The calculation of shock transmission and connectedness metrics between the variables, however, could be impacted by selecting a different window length (Suleman et al. 2023a). Although it may miss abrupt structural changes, a longer rolling window (e.g., 250) smooths out short-term variations and produces more stable estimates. More localized dynamics are captured with a shorter rolling window (e.g., 200), but because sample sizes are lower, noise may be introduced. The transmission mechanism between TPU and GCC volatility across bearish, bullish, and moderate quantiles exhibit similarity and consistency across both shorter and longer rolling windows (200 and 250), as shown in Figure 4a. This demonstrates that the quantile domain connectedness link between GCC stock markets and TPU is a structural dynamic in the data rather than an artifact of the window size that was selected.
Figure 4b shows that the aggregated value of the Total Connectedness Index (TCI) between GCC stock market volatility and TPU, driven by the spillover of shocks within the entire QVAR system across bearish, bullish, and moderate quantiles, remains stable at different H-step-ahead forecasting horizons (20 and 25). This stability of the TCI across different forecasting horizons suggests that the quantile-domain shock-transmission mechanism between TPU and GCC stock volatility is fundamentally stable rather than a transient anomaly. Moreover, it underscores the accuracy of shock-spillover forecasts. The stability of the TCI provides important insights for investors and policymakers, indicating that trade policy uncertainty continuously and asymmetrically transmits volatility shocks to GCC stock markets over various time periods. This implies that rather than treating TPU as a short-lived market shock, long-term investing and hedging strategies should consider it a persistent risk factor. TPU shocks likely exert a consistent influence on GCC stock markets under different market conditions and across various forecasting horizons. This finding is significant because it suggests that, given TPU’s consistent impact, policy decisions and risk-management strategies do not need to be closely tailored to specific forecasting horizons. However, investors should consider bearish, bullish, and moderate equity market volatility conditions when hedging TPU-related risks in the GCC financial system. Lastly, the interconnectivity estimations remain robust and are not unduly affected by the choice of forecasting horizon (H = 20 or H = 25), further reinforcing the stability of the TCI.
In the existing literature, Chatziantoniou et al. (2021) explored quantile-domain interactions between global developed forex markets and interest rate swaps, focusing only on bearish (τ = 0.05), bullish (τ = 0.95), and moderate (τ = 0.5) quantiles using the quantile-domain VAR approach. Similarly, Sheikh et al. (2024) examined extreme quantile-domain interactions between conventional, sustainable, and Sharia-compliant financial market returns in Australia and global uncertainties, also considering bearish (τ = 0.05), moderate (τ = 0.5), and bullish (τ = 0.95) quantiles through the QVAR approach. Moreover, Cunado et al. (2023) analyzed the quantile-domain shock-transmission mechanism between the energy market and precious metals, selecting only three quantiles—bearish (τ = 0.05), bullish (τ = 0.95), and moderate (τ = 0.5)—using the QVAR-based connectedness approach. Building upon these studies, we also investigate the extreme quantile-domain shock-transmission mechanism between GCC stock market volatility and TPU across bearish (τ = 0.05), bullish (τ = 0.95), and moderate (τ = 0.5) quantiles using the QVAR approach. Moreover, our selection of only three quantiles, i.e., bearish (τ = 0.05), bullish (τ = 0.95), and moderate (τ = 0.5) is in line with Iacopini et al. (2023).
Table 5 and Figure 2 show that overall shock transmission between TPU and GCC stock market conditional volatility series is higher at extreme upper and lower quantiles (τ = 0.05, 0.95) compared to the median quantile (τ = 0.5). Furthermore, we explore the overall quantile domain shock transmission between TPU and GCC stock market conditional volatility across bullish (τ = 0.80, 0.85, and 0.90), bearish (τ = 0.20, 0.15, and 0.10), and moderate (τ = 0.55, 0.60, and 0.45) quantiles (see Figure 3c). Figure 4c represents a heat map illustrating the quantile domain shock transmission, where intensified heat at the extreme higher quantiles (τ = 0.80, 0.85, and 0.90) indicates stronger shock transmission and connectedness between TPU and GCC stock market conditional volatility. Furthermore, Table 5 and Figure 2 also show that overall shock transmission and connectedness between TPU and GCC stock market conditional volatility is weaker at the moderate quantile (τ = 0.5) compared to bearish and bullish quantiles (τ = 0.95). Additionally, Figure 4c shows lighter and faded heat waves at the median quantiles (τ = 0.55, 0.60, and 0.45), indicating very low intensity and weak shock-transmission mechanisms at median quantiles compared to the intensified heat waves at the bullish quantiles (τ = 0.80, 0.85, and 0.90). Furthermore, Table 5 and Figure 2 show that overall shock transmission between TPU and GCC stock market conditional volatility is lower at the bearish quantile (τ = 0.05) compared to the bullish quantile (τ = 0.95), but stronger than at the moderate quantile (τ = 0.5). Meanwhile, Figure 3c shows that the heat waves observed at the lower quantiles (τ = 0.20, 0.15, and 0.10) are denser compared to the faded heat waves at the median quantiles (τ = 0.55, 0.60, and 0.45). This suggests that overall shock transmission from TPU to the GCC stock market conditional volatility remains higher at the upper quantiles compared to bearish and median quantiles and is not sensitive to the selection of quantile levels.

5.3. Analysis of Frequency-Domain QVAR Connectedness Between TPU and Islamic Financial Market’s Conditional Volatility of GCC Member Economies

In economic terms, instances where interconnections between TPU and financial markets occur at higher frequencies indicate moments when stock markets rapidly and seamlessly integrate information (Baruník and Křehlík 2018). During these periods, a disturbance to one financial asset primarily affects other assets in the short term. Conversely, when interconnection occurs at minor frequencies, it suggests that shocks are enduring and persistently influence the system for extended periods (Suleman et al. 2023b). We use the QVAR Frequency-domain connectivity technique, which was developed by Chatziantoniou et al. (2022), to provide applicable consequences for both long-term stockholders and short-term speculators under various TPU circumstances and financial market volatility. Table 6 furnishes brief and extended details regarding the average total connectedness indices and the transmission of shocks in specific quantiles: lower (Panel A), median (Panel B), and higher (Panel C). Simultaneously, visual representations of the time-varying Total Connectedness Index (TCI) for short- and long-term intervals related to the interplay between TPU and financial market volatility are depicted in Figure 5a and Figure 5b, correspondingly.
Table 6 indicates that, at the lower quantiles, the overall average connectedness indices resulting from the combined spillover effects of shocks between TPU and financial market volatility are 34.86% for the long term and 3.10% for the short term. Conversely, at the higher quantiles, the total average connectedness indices, due to the combined impact of spillover shocks between TPU and stock market volatility in GCC member economies within the entire QVAR system, rise to 76.70% for the long-term and 5.68% for the short-term investment periods. This suggests that not only is the average transmission of shocks from TPU to GCC Sharia-compliant financial market volatility greater at higher quantiles, but the degree of connectedness between the two is also more pronounced in the long term compared to the short term. For instance, in the long term and at lower quantiles, a shock in TPU results in the most substantial contribution of 37.3% to error variances when forecasting the 20-day ahead conditional volatility in all other GCC Sharia-compliant financial markets, in contrast to a mere 1.13% contribution in the short term. Similarly, at the higher quantiles, TPU shocks lead to the most significant contribution of 75.75% to the conditional volatility of financial markets in GCC member economies in the long term, compared to a transmission of shocks of only 4.86% in the short term. Upon examining Figure 5a,b, it becomes apparent that the fluctuating interdependence over time between TPU and GCC Islamic financial market volatility is not only more intensified at higher quantiles, but the degree of this interdependence escalates more significantly in the long term as compared to the short-term investment period.
These findings diverge from existing research on the transmission of shocks between TPU and financial markets, as prior studies predominantly focused on the symmetrical impact of TPU on the risk-taking behavior of financial institutions through the indirect channel of capital market performance (Hu et al. 2024). Similarly, Chen et al. (2023) noted that energy-intensive firms, particularly those facing less competition and operating in more marketed areas, are more inclined to reduce financial investment in response to an increase in trade policy uncertainty. In a similar vein, Yu et al. (2023) discovered that heightened trade policy uncertainty negatively affected the importation of Chinese products to the U.S. However, the impact of this adverse TPU shock surpassed that of exchange rate factors, as trade policy uncertainty positively influenced China’s propensity to import agricultural products from other economies. In contrast, the heightened interconnectedness between TPU and the volatility of Islamic financial markets in GCC member economies can be rationalized by considering the transmission channel of investor sentiment (Li et al. 2022). Our findings purpose several practical implications for shareholders.
Our findings suggest that it is advisable for market participants to strengthen their risk-management practices, especially in the context of long-term investments. The heightened transmission of shocks from trade policy developments underscores the importance of robust volatility assessment and long-term contingency planning to effectively navigate potential fluctuations and TPU uncertainties in Islamic financial markets. This awareness can guide the development of policies that are adaptable to evolving GCC Islamic financial market volatility conditions over an extended time frame. Maintaining a diversified portfolio that takes into account the long-term implications of trade policy uncertainties can serve as a protective measure against adverse effects on overall Sharia-compliant investment performance. Additionally, investors are encouraged to make adjustments to risk exposure, diversify their portfolios, and implement hedging strategies to mitigate the impact of increased Trade Policy Uncertainty (TPU) during periods of heightened volatility in the Gulf Cooperation Council (GCC) Islamic financial markets. For Sharia-compliant investors and fund managers, it is crucial to assess the resilience of their portfolios in the face of shocks stemming from TPU, particularly during phases of heightened financial market volatility. This assessment aids in identifying vulnerabilities and implementing proactive measures to safeguard against potential risks. Furthermore, a reevaluation of asset-allocation strategies is recommended, taking into consideration the asymmetrical impact of TPU on market volatility during both bullish and bearish market phases. This may involve adjusting the allocation of assets based on the prevailing market sentiment, aiming to enhance portfolio resilience and optimize returns in relation to the associated risks.

5.3.1. Shock-Transmission Mechanism Between TPU and Islamic Financial Market’s Conditional Volatility in the Short Term (ST)

In the short run, especially at lower quantiles (indicating lower conditional risk and trade policy uncertainty), a disturbance in TPU results in the most substantial contribution, accounting for 0.28%, 0.20%, and 0.28% of shocks in predicting the 20-day ahead conditional risk in Bahrain, Oman, and Saudi Arabia, respectively. Conversely, at higher quantiles (representing bullish equity market volatility and heightened trade policy uncertainty), TPU shocks lead to the highest error variances of 0.89%, 0.81%, 0.82%, and 0.80% in the conditional risk of Bahrain, Oman, Kuwait, and Saudi Arabia’s Sharia-compliant financial markets. This highlights the necessity for risk managers and investors to exercise increased vigilance during bullish conditional risk periods, as TPU shocks can exert a more substantial and immediate influence. It may necessitate adjustments in their risk-management and portfolio strategies accordingly. Nonetheless, Table 6 also reveals that the magnitude of short-term directional spillovers (FROM, TO, and NET) resulting from shocks are more pronounced at the higher quantiles in comparison to the median and lower quantiles. Figure 6a–c graphically illustrates the time varying directional TO, FROM, and NET spillover of shocks, respectively, in the short term (ST) and long term (LT), respectively across different quantiles. Figure 6a illustrates that, when contrasted with the middle (depicted by the red line) and lower (indicated by the blue line) quantiles, trade policy uncertainty conveyed the greatest error variances to all other GCC Sharia-compliant Islamic financial market volatilities in the short term (ST) at the elevated quantiles (denoted by the green color).
Based on the above findings, it is advisable for short-term speculators to customize their trading strategies according to the prevailing volatility market conditions in the GCC Islamic financial markets. This approach is more likely to yield positive results compared to a one-size-fits-all approach. Additionally, speculators should implement well-defined risk-management plans and consider investments in the Islamic financial markets of Qatar and UAE during the lower conditional risk. This is especially important during bearish Islamic financial market conditions characterized by lower susceptibility to error variances by Qatar and UAE’s equity market conditional volatility resulting from Trade Policy Uncertainty (TPU) shocks in the short term. However, the conditional volatility within the equity markets of Saudi Arabia, Bahrain, and Oman received the highest TPU shocks at lower quantiles, and fund managers should take into account measures such as setting stop-loss orders and carefully managing that the size of their positions are essential to safeguard their investments. Furthermore, when confronted with higher quantiles, indicating strong conditional volatility episodes, Qatar and UAE exhibit lower error variances reception capability as compared with Bahrain, Oman, Kuwait, and Saudi Arabia stemming from TPU shocks. On the other hand, portfolio managers and asset allocators operating in the financial markets of Bahrain, Oman, Kuwait, and Saudi Arabia should take TPU into account as a significant factor in their investment strategies. Depending on their risk tolerance, short-term investors may need to make adjustments to their asset allocations to accommodate the increased volatility that accompanies periods of TPU disturbances. Therefore, during the bearish and bullish volatility, short-term speculators should consider investing in the Islamic stock markets of UAE and Qatar due to their lower resilience to the TPU shocks. This is due to the fact that the conditional volatility in these stock markets received lower TPU shocks at the lower and higher quantiles.
The role of investor emotions significantly impacts financial markets, contributing to the extensive transmission of Trade Policy Uncertainty (TPU) shocks into the volatility of the GCC’s Sharia-compliant Islamic financial markets. When uncertainty about trade policies increases, investors often become more risk-averse, leading to changes in investment behavior and asset prices (Li et al. 2022). As TPU rises, investors in the GCC Islamic financial market may experience heightened uncertainty regarding the future trade environment. This uncertainty can influence their sentiment, leading to shifts in investment decisions and portfolio allocations and thereby lead towards the highest susceptibility of financial market volatility of Oman, Kuwait, Saudi Arabia, and Bahrain to these TPU shocks. Moreover, TPU can disrupt international trade flows and impact economic conditions in the GCC region (Bianconi et al. 2021; Caldara et al. 2020). The Islamic financial market, being part of the broader financial system, is susceptible to these global economic changes, influencing investor behavior and market dynamics (Akbar et al. 2024). More importantly, in the context of the GCC Islamic financial market, rising TPU can lead investors to reevaluate the risks associated with various assets. They may adjust their portfolios by reallocating resources, potentially causing fluctuations in Islamic financial instruments and GCC Islamic financial markets. Moreover, our results diverge from previous research on the link between Trade Policy Uncertainty (TPU) and financial markets. Unlike earlier studies that concentrated on conventional financial market returns outside the GCC region, employed symmetrical methodologies to investigate this correlation, and did not consider varying volatility conditions and investment time frames, our findings present a distinct perspective (Bianconi et al. 2021; He et al. 2021; Hoque et al. 2023; Hu et al. 2024; Li et al. 2022).

5.3.2. Shock-Transmission Mechanism Between TPU and Islamic Financial Market’s Conditional Volatility in the Long Term (LT)

For long-term investors, Table 6 reveals that a shock in Trade Policy Uncertainty (TPU) results in a more substantial transmission of error variances to the conditional risk of Sharia-compliant financial markets in Bahrain, Kuwait, Oman, and the Saudi Arabia. These error variance contributions are 6.89%, 6.38%, 6.73%, and 7.73%, respectively, during periods of bearish conditional volatility (lower quantiles) in the equity markets. In contrast, at the higher quantiles, corresponding to bullish conditional risk in the equity market, a TPU shock leads to even higher contributions. Specifically, it contributes 12.9%, 12.61%, 12.53%, and 12.72% of error variances in forecasting the 20-days-ahead conditional volatility for Bahrain, the UAE, Oman, Kuwait, and UAE, respectively.
Long-term investors should incorporate periodic portfolio rebalancing into their investment strategy. Rebalancing can help maintain a desired risk-return profile by adjusting portfolio allocations and investing in Sharia-compliant financial markets of UAE and Qatar as these markets received the lowest spillover of shocks from TPU during the bearish conditional risk conditions (lower quantiles). These findings underscore the significance of strategic asset allocation, a key concept in modern portfolio theory (Asadi et al. 2023). Long-term investors may need to adapt their asset-allocation strategies by reducing exposure to Sharia-compliant financial markets in Bahrain, UAE, Oman, and Kuwait during periods of higher conditional risk (higher quantiles) while increasing allocations to more stable assets like Sharia-financial market of Qatar. This is because of the fact that conditional volatility in the Sharia-complaint financial market of Qatar received the lower spillover of shocks from TPU at higher and lower quantiles and in the long term.
Trade policy uncertainty serves as a significant transmitter of substantial shocks, particularly evident over prolonged durations and at extreme upper quantiles as depicted in Figure 6c. Figure 6a,b provides graphical representations illustrating the directional spillover of shocks “TO” and “FROM” between TPU and Islamic stock market conditional volatility in the GCC member economies. Based on Figure 6a, it is evident that there is a greater magnitude of long-term shock transmission from TPU to all other GCC Islamic stock markets’ volatility compared to the short-term dynamics. Nevertheless, Figure 6a clearly indicates that TPU transmitted higher forecast error variances during the long term, especially during the initial quarters of 2015, 2016, and 2017. An increased level of upward variations in TPU shocks toward all other GCC markets is also noticeable during 2018 and at the end of the 2019. Furthermore, at higher quantiles in the long term, TPU also exhibited a greater propensity to transmit heightened shocks to the GCC conditional risk during the period of the COVID-19 pandemic, Russian Ukraine conflict during 2022, and in-between 2023 and 2024. On the other hand, Figure 6b reveals that the GCC equity markets’ conditional risk experiences the most significant forecast error variances in the long term and at higher quantiles, in contrast to the short term and at lower quantiles. Because of these facts, it is evident that the forecast error variances received by the GCC financial markets were notably higher during the early months of 2015, as well as between 2016 and 2019 (see Figure 6b). This trend continued during the COVID-19 period, 2022, and in-between 2023 and 2024, both in the long term and across lower, median, and higher quantiles.
This issue is intricately connected to a serious economic challenge that emerged in the midst of 2014, triggered by a sharp and sudden decline in oil prices that significantly impacted the economies of the Gulf Cooperation Council (GCC) member countries (Grigoli et al. 2019). The situation was further complicated by the influence of United States trade policies, exposing GCC financial markets to a myriad of risks. These risks encompassed their involvement in the Yemeni crisis and the looming possibility of military confrontations between the United States and Iran (Nuruzzaman 2020), which had the potential to disrupt the crucial oil supply chains in the region (Ruiz Estrada et al. 2020). Adding to the complexities, the United States implemented tariffs on imports of steel and aluminum in March 2018 (Lee 2019), which included goods originating from GCC nations. This move raised concerns regarding the status of commercial relations between the United States and the GCC countries, and there were apprehensions about potential retaliatory measures. Additionally, the United States withdrew from the Iran Nuclear Agreement in May 2018 and subsequently imposed sanctions on Iran (Landler 2018). This had a direct impact on trade and financial transactions between Iran and the GCC countries, further amplifying the economic and diplomatic challenges in the region. The intricate nature of the situation is also heightened by ongoing discussions and disputes over defense contracts and the supply of weapons to GCC nations (Kelly et al. 2023). These conflicts are deeply entwined with the terms and conditions stipulated in these contracts, creating a complex web of economic and geopolitical challenges for the involved parties (Page 2022). The multifaceted interplay of these factors underscores the delicate balance that needs to be maintained to navigate through this intricate landscape successfully.

5.3.3. Sensitivity and Robustness Analysis for the QVAR with the “Frequency” Domain Connectedness Approach

Figure 7a shows that Total Connectedness Index (TCI) due spillover of shocks between TPU and GCC stock market conditional volatility estimated through QVAR with the “Frequency”-domain connectedness approach remains stable across different rolling windows (200 and 250). This implies that TPU-induced volatility spillovers across different quantiles do not vary significantly over different investment horizons (short- and long-term) due to the use of different rolling windows, ensuring that the findings are not driven by sample bias or short-term fluctuations. This consistency supports the idea that volatility spillovers are durable by indicating that market participants consistently respond to TPU shocks in a comparable way across time. According to stable estimates, TPU-driven spillovers to GCC volatility are structural rather than transient, which means that they do not significantly change depending on the rolling window. Future volatility patterns can be more accurately predicted if QVAR with Frequency-domain connectivity estimates stay constant across several rolling windows since the transmission mechanism will not change.
This helps investors and policymakers more confidently predict how the market will respond to TPU shocks, which is beneficial for risk management, portfolio allocation, and policymaking.
Figure 7b shows that the quantile domain short- and long-term shock spillovers between TPU and GCC stock market conditional volatility does not significantly change across different forecasting horizons (20 and 25) and suggests that the underlying relationship is not sensitive to the choice of forecasting window. This strengthens confidence in QVAR with Frequency domain model’s findings and indicates that the spillover effect of TPU is not transitory but continues to shape Sharia-compliant GCC stock market volatility over time. Furthermore, the consistency of TPU’s quantile domain shock spillovers towards the volatility of the GCC stock market across various forecasting horizons demonstrates how enduring and reliable this link is. Market players, risk managers, and legislators can use this information to help them create effective plans for dealing with TPU. QVAR with “Frequency” domain model’s instability or misspecification may be indicated if estimates show considerable fluctuations with changes in predicting horizons (20 and 25). Therefore, the quantile-based VAR with “Frequency” domain connectedness approach’s correctness and dependability are supported by the fact that time varying quantile domain shock spillovers stay constant across different H-step ahead forecasting horizons in both the short and long term.

6. Conclusions with Practical Implications and Future Research Directions

Prior studies have mainly addressed the adverse effects of Trade Policy Uncertainty (TPU) on the trading patterns of economies. However, there has been a lack of investigation into the dynamic asymmetric shock-transmission mechanism between TPU shocks and the volatility of Sharia-compliant financial markets in Gulf Cooperation Council (GCC) member economies across diverse volatility conditions (quantiles) and investment horizons (frequency wavelengths). To address this gap, we employ the recently developed “Extended Joint” Quantile-based Vector Auto Regression (QVAR) methodology introduced by Cunado et al. (2023) and “Frequency” domain QVAR approach proposed by Chatziantoniou et al. (2022). Unlike the “Extended Joint” QVAR approach, which only estimate the shock spillovers for the overall time period, the “Frequency”-domain QVAR approach can estimate the shock spillovers from TPU toward the Sharia-compliant GCC economies’ stock market conditional volatility across short- and long-term investment horizons. To extract the conditional variance series of Sharia-compliant equity market returns in Bahrain, Kuwait, Oman, U.A.E, Saudi Arabia, and Qatar, we use the GARCH (1,1) model (Bollerslev 1986) with a student’s t and generalized error distribution (GED). The student’s t GARCH (1,1) captures fat-tailed behavior, making it suitable for financial returns with extreme values. In contrast, GARCH (1,1) with GED accounts for both fat-tailed and thin-tailed behavior based on its form parameter. If the student’s t model underperforms, it indicates weaker extreme tail behavior. When severe shocks are less frequent but still present, the GED distribution better captures volatility. However, we have taken into account the GARCH (1,1) approach with GED term due to its higher log-likelihood values and lower AIC, SC, and HQ values as compared with GARCH (1,1) with a student’s t distribution.
Unlike Markov regime Switching Vector Auto-Regression (MS-VAR) and Threshold Vector Auto-regression (T-VAR), which segment data into discrete regimes, QVAR with “Frequency” domain connectedness provides a continuous view of dynamics across investment horizons (short and long term) and quantiles (τ = 0.05, 0.50, 0.95). This allows for a clearer understanding of how extreme events (e.g., market crashes or booms) impact volatility spillovers. GCC equity market returns often exhibit asymmetry and fat tails. QVAR, free from normality assumptions, adapts to varying tail densities, making it more robust. While MS-VAR and T-VAR capture nonlinearity, MS-VAR and T-VAR struggle to fully model tail behaviors. By estimating effects across quantiles, QVAR with “Extended Joint” and “Frequency” domain connectedness examines relationships across the entire conditional distribution. Unlike MS-VAR and T-VAR, it does so without imposing arbitrary regimes, preserving the continuous nature of financial market dynamics. Similarly, the novel Extended Joint QVAR connectedness approach enhances precision using an improved normalization strategy (Cunado et al. 2023). Its normalization, based on the R² goodness-of-fit metric, differentiates it from joint connectedness (Lastrapes and Wiesen 2021) and initial connectedness measures (Diebold and Yilmaz 2009, 2012). Unlike MS-VAR and T-VAR, which require assumptions about thresholds or regimes, QVAR naturally captures nonlinearity by analyzing effects across quantiles, reducing misspecification risks. Financial markets exhibit volatility clustering and fat-tailed distributions, making QVAR well-suited for capturing tail dependencies and shock effects. This is crucial for risk management and policymaking, as MS-VAR and T-VAR may lack granularity in extreme quantile behavior.
As per the QVAR Extended Joint connectedness, a shock in Trade Policy Uncertainty (TPU) has the most pronounced impact, accounting for higher shocks in conditional volatility of Oman, Bahrain, and Saudi Arabia, particularly at lower quantiles (τ = 0.05). In contrast, during higher quantiles (τ = 0.95), a TPU shock yields a more significant impact, contributing higher shocks to the conditional volatility in the UAE, Bahrain, and Saudi Arabia’s financial market, surpassing the influence on the Qatar’s Sharia-compliant financial market conditional volatility. The findings indicate that TPU transmits error variances differently to the conditional risk of all GCC Islamic financial markets, with a more intense and substantial impact at higher extreme quantiles. This may not only imply asymmetry but also justifies the utilization of the QVAR approach.
The practical implications for investors are that, in bearish conditional volatility conditions (τ = 0.05), they should contemplate diversifying their portfolios. This can be achieved by distributing investments across various asset classes and financial markets in different geographic regions that have demonstrated lower susceptibility to shocks originating from TPU. This includes the financial markets of Qatar and UAE to reduce risk exposure to trade policy uncertainty as these markets received lower error variances from TPU during the bearish Islamic equity market volatility trend. Moreover, specific economies like Oman, Bahrain, and Saudi Arabia should establish a policy guidelines and strategy framework for businesses to access risk-mitigation tools such as trade credit insurance and currency hedging to reduce exposure to trade policy shocks during the bearish market conditional risk. However, during the bullish conditional risk conditions ( τ = 0.95 ), economies receiving the higher TPU shocks such as UAE, Bahrain, and Saudi Arabia should develop and maintain real-time monitoring systems to promptly detect and respond to shifts in TPU shocks, enabling proactive risk-mitigation measures. Moreover, ethical investment strategies adhering to Sharia principles should be crafted considering the specific volatility conditions in Islamic financial markets. To illustrate, in times of higher volatility (bullish conditions), TPU shocks led to the least transmission of error variance in the conditional volatility of Qatar and Kuwait. Therefore, at the time of portfolio optimization, investors need to consider the financial market volatility conditions and TPU intensity. Furthermore, the shock spillover between GCC member economies’ Sharia-complaint equity market conditional volatility estimated through QVAR with an “Extended Joint” connectedness approach are robust to different forecasting horizons, rolling window selection, and quantiles.
Besides the practical implications, the utilization of the Frequency-domain QVAR approach holds specific consequences for Sharia-compliant short-term speculators and long-term shareholders. In the short term, particularly at elevated quantiles (indicating heightened conditional risk and trade policy uncertainty), a disturbance in Trade Policy Uncertainty (TPU) results in the most significant contribution, representing 0.89%, 0.81%, 0.82%, and 0.80% of error variances in predicting the 20-day-ahead conditional risk in Bahrain, Oman, Kuwait, and Saudi Arabia, respectively. Conversely, at lower quantiles (indicative of bearish equity market volatility and trade policy uncertainty), TPU shocks lead to the highest forecast error variances of 0.31%, 0.27%, and 0.19% in the conditional risk of Bahrain, Oman, and Saudi Arabia’s Sharia-compliant financial markets. This underscores the need for risk managers and investors to exercise increased vigilance during bearish and bullish conditional risk periods, as TPU shocks can exert a more substantial and immediate influence on the financial market volatility in Bahrain, Oman, Kuwait, and Saudi Arabia. It may necessitate adjustments in their risk-management and portfolio strategies accordingly. In the short term and during the bearish and bullish equity market volatility conditions, short-term speculators should adopt investment positioning in the equity market of Qatar due to its lower susceptibility to TPU shocks.
For long-term investors, a shock in TPU results in a more substantial transmission of error variances to the conditional risk of Sharia-compliant financial markets in Bahrain, Oman, and Saudi Arabia during periods of bearish conditional volatility (lower quantiles). In contrast, during periods of bullish conditional risk in the equity market, a TPU shock leads to even higher contribution of shocks in the conditional volatility of Islamic financial markets of Bahrain, the UAE, Oman, and Kuwait, respectively. Long-term investors should incorporate periodic portfolio rebalancing into their investment strategy. Rebalancing can help maintain a desired risk-return profile by adjusting portfolio allocations and investing in Sharia-compliant financial markets of Qatar as the Sharia-complaint equity market of Qatar received the lowest spillover of shocks from TPU during the bearish and bullish conditional risk conditions. These findings underscore the significance of strategic asset allocation, a key concept in modern portfolio theory. Long-term investors may need to adapt their asset-allocation strategies by reducing exposure to Sharia-compliant financial markets in Bahrain, Oman, Kuwait, and UAE during periods of higher conditional risk (higher quantiles) while increasing allocations to more stable assets like Sharia-financial market of Qatar. This study further utilizes quantile-based vector autoregression (QVAR) incorporating “Extended Joint” and “Frequency” domain shock spillovers to examine the transmission of shocks from Trade Policy Uncertainty (TPU) to stock market volatility across different quantiles and investment horizons (both long and short term). Future research should integrate a back-testing approach to assess the robustness of the model’s predictions regarding volatility shifts under TPU shocks. This could involve testing the model against various historical periods, such as the 2008–2009 global financial crisis or the Silicon Valley Bank (SVB) default, as well as employing out-of-sample data, including intraday GCC stock market data.

Author Contributions

Conceptualization, M.I.T., M.R., S.S.I.; methodology, M.I.T., K.A., S.S.I., M.M.; validation, M.I.T., M.W.A.S., S.S.I., M.M., M.R., M.S.M.A.-A.; writing—original draft, M.I.T., M.W.A.S.; literature review, M.I.T., K.A., S.S.I., M.M., M.W.A.S., M.S.M.A.-A.; results, M.R.; supervision, K.A., M.S.M.A.-A.; resources, M.M., M.W.A.S., M.S.M.A.-A. All authors have read and agreed to the published version of the manuscript.

Funding

This research received no external funding.

Data Availability Statement

Data are available upon request.

Conflicts of Interest

There is no conflict of interest.

Abbreviations

GCCGulf Cooperation Council
GFEVDGeneralized Forecast Error Variance Decomposition
UAEUnited Arab Emirates
KPSSKwiatkowski Philips Schmidt Shin
LTLong Term
NPDCNet Pairwise Dynamic Connectedness
STShoShort Term
TCITotal Connectedness Index
TPUTrade Policy Uncertainty

Appendix A

Figure A1. Graphical representation of the conditional volatility series of GCC Sharia-compliant Islamic financial markets estimated through GARCH (1,1) with a Student’s t distribution.
Risks 13 00056 g0a1

Notes

1
2
The study measures the spillover effects of Trade Policy Uncertainty (TPU) using Generalized Forecast Error Variance Decomposition (GFEVD). The Diebold and Yilmaz (2012) framework’s GFEVD measures the proportion of a variable’s forecast error variance (like the volatility of the GCC Sharia-compliant stock markets) that is caused by another (like Trade Policy Uncertainty). The GFEVD offers a flexible spillover evaluation in contrast to orthogonalized variance decomposition, which depends on variable ordering and Cholesky decomposition. It assesses the effects of one variable’s fluctuations on another, but it does not prove direct causation because observed spillovers might be the result of latent components or shared shocks.

References

  1. Ahmed, Walid M. 2021. Stock market reactions to upside and downside volatility of Bitcoin: A quantile analysis. The North American Journal of Economics and Finance 57: 101379. [Google Scholar] [CrossRef]
  2. Akbar, Muhammad, Ihsan Ullah, Shahid Ali, and Naser Rehman. 2024. Adaptive market hypothesis: A comparison of Islamic and conventional stock indices. International Review of Economics & Finance 89: 460–77. [Google Scholar] [CrossRef]
  3. ALJAZEERA. 2017. Trump Withdraws US from Trans-Pacific Partnership Deal. Al Jazeera. Available online: https://www.aljazeera.com/economy/2017/1/24/trump-withdraws-us-from-trans-pacific-partnership-dea (accessed on 1 January 2025).
  4. Alschner, Wolfgang, Rama Panford-Walsh, and Dmitrity Skougarevskiy. 2018. What Can the Negotiations of NAFTA 1.0 Teach us About the Fate of NAFTA 2.0? Ottawa Faculty of Law Working Paper. Ottawa: Ottawa Faculty of Law. [Google Scholar]
  5. Altinkeski, Buket Kirci, Sel Dibooglu, Emrah Ismail Cevik, Yunus Kilic, and Mehmet Fatih Bugan. 2024. Quantile connectedness between VIX and global stock markets. Borsa Istanbul Review 24: 71–79. [Google Scholar] [CrossRef]
  6. Ando, Tomohiro, Matthew Greenwood-Nimmo, and Yongcheol Shin. 2022. Quantile Connectedness: Modeling Tail Behavior in the Topology of Financial Networks. Management Science 68: 2401–31. [Google Scholar] [CrossRef]
  7. Antonakakis, Nikolaos, Ioannis Chatziantoniou, and David Gabauer. 2020. Refined Measures of Dynamic Connectedness based on Time-Varying Parameter Vector Autoregressions. Journal of Risk and Financial Management 13: 84. [Google Scholar] [CrossRef]
  8. Asadi, Mehrad, Umaid A. Sheikh, M. Balcilar, David Roubaud, and H. R. Ghasemi. 2023. Are there inextricable connections among automobile stocks, crude oil, steel, and the US dollar? Energy Economics 128: 107176. [Google Scholar] [CrossRef]
  9. Balcilar, Mehmet, David Gabauer, and Zaghum Umar. 2021. Crude Oil futures contracts and commodity markets: New evidence from a TVP-VAR extended joint connectedness approach. Resources Policy 73: 102219. [Google Scholar] [CrossRef]
  10. Baker, Scott R., Nicholas Bloom, and Steven J. Davis. 2016. Measuring Economic Policy Uncertainty. The Quarterly Journal of Economics 131: 1593–636. [Google Scholar] [CrossRef]
  11. Baker, Scott R., Steven J. Davis, and Jeffrey A. Levy. 2022. State-level economic policy uncertainty. Journal of Monetary Economics 132: 81–99. [Google Scholar] [CrossRef]
  12. Bao, Xiaohua, Jianpeng Deng, Haoyu Sun, and Jin Sun. 2022. Trade policy uncertainty and foreign direct investment: Evidence from China’s WTO accession. Journal of International Money and Finance 125: 102642. [Google Scholar] [CrossRef]
  13. Baruník, Jozef, and Tomas Křehlík. 2018. Measuring the frequency dynamics of financial connectedness and systemic risk. Journal of Financial Econometrics 16: 271–96. [Google Scholar] [CrossRef]
  14. Ben Cheikh, Nidhaleddine Ben, Sami Ben Naceur, Oussama Kanaan, and Christophe Rault. 2021. Investigating the asymmetric impact of oil prices on cGCC stock markets. Economic Modelling 102: 105589. [Google Scholar] [CrossRef]
  15. Benkraiem, Ramzi, Amine Lahiani, Anthony Miloudi, and Muhammad Shahbaz. 2018. New insights into the US stock market reactions to energy price shocks. Journal of International Financial Markets, Institutions and Money 56: 169–87. [Google Scholar] [CrossRef]
  16. Bianconi, Marcelo, Federico Esposito, and Marco Sammon. 2021. Trade policy uncertainty and stock returns. Journal of International Money and Finance 119: 102492. [Google Scholar] [CrossRef]
  17. Bloom, Nicholas. 2009. The Impact of Uncertainty Shocks. Econometrica 77: 623–85. [Google Scholar] [CrossRef]
  18. Bloom, Nicholas. 2014. Fluctuations in uncertainty. Journal of Economic Perspectives 28: 153–76. [Google Scholar] [CrossRef]
  19. Bollerslev, Tim. 1986. Generalized autoregressive conditional heteroskedasticity. Journal of Econometrics 31: 307–27. [Google Scholar] [CrossRef]
  20. Bonga-Bonga, Lumengo, and Salifya Mpoha. 2024. Spillover effects from China and the United States to key regional emerging markets: A dynamic analysis. International Review of Financial Analysis 91: 103015. [Google Scholar] [CrossRef]
  21. Bouri, Elie, Oguzhan Cepni, David Gabauer, and Rangan Gupta. 2021. Return connectedness across asset classes around the COVID-19 outbreak. International Review of Financial Analysis 73: 101646. [Google Scholar] [CrossRef]
  22. Bown, Chad P. 2019. The 2018 US-China trade conflict after forty years of special protection. China Economic Journal 12: 109–36. [Google Scholar] [CrossRef]
  23. Brennan, Michael J. 1991. A perspective on accounting and stock prices. The Accounting Review 66: 67–79. [Google Scholar] [CrossRef]
  24. Brock, William A., W Dechert, J. A. Scheinkman, and B. LeBaron. 1996. A test for A test for independence based on the correlation dimension. Econometric Reviews 15: 197–235. [Google Scholar] [CrossRef]
  25. Byrne, Joseph, Julia Darby, and Ronald MacDonald. 2008. US trade and exchange rate volatility: A real sectoral bilateral analysis. Journal of Macroeconomics 30: 238–59. [Google Scholar] [CrossRef]
  26. Caldara, Dario, Matteo Iacoviello, Patrick Molligo, Andrea Prestipino, and Andrea Raffo. 2019. Does Trade Policy Uncertainty Affect Global Economic Activity? FEDS Notes, September 4. [Google Scholar]
  27. Caldara, Dario, Matteo Iacoviello, Patrick Molligo, Andrea Prestipino, and Andrea Raffo. 2020. The economic effects of trade policy uncertainty. Journal of Monetary Economics 109: 38–59. [Google Scholar] [CrossRef]
  28. Carmon, I. 2016. What Happens to the Big Supreme Court Cases after Scalia’s Death? NBC News. Available online: https://www.nbcnews.com/news/us-news/what-happens-big-supreme-court-cases-after-scalia-s-death-n518476 (accessed on 2 January 2025).
  29. Chatziantoniou, Ioannis, David Gabauer, and Alexis Stenfors. 2021. Interest rate swaps and the transmission mechanism of monetary policy: A quantile connectedness approach. Economics Letters 204: 109891. [Google Scholar] [CrossRef]
  30. Chatziantoniou, Ioannis, Emmanuel Joel Aikins Abakah, David Gabauer, and Aviral Kumar Tiwari. 2022. Quantile time–frequency price connectedness between green bond, green equity, sustainable investments and clean energy markets. Journal of Cleaner Production 361: 132088. [Google Scholar] [CrossRef]
  31. Chen, Zhang-HangJian, Fei Ren, Ming-Yuan Yang, Feng-Zhi Lu, and Sai-Ping Li. 2023. Dynamic lead–lag relationship between Chinese carbon emission trading and stock markets under exogenous shocks. International Review of Economics & Finance 85: 295–305. [Google Scholar] [CrossRef]
  32. Chodor, Tom. 2019. The rise and fall and rise of the trans-pacific partnership: 21st century trade politics through a new constitutionalist lens. Review of International Political Economy 26: 232–55. [Google Scholar] [CrossRef]
  33. Chudik, Alexander, Kamiar Mohaddes, M. Hashem Pesaran, Mehdi Raissi, and Alessandro Rebucci. 2021. A Counterfactual Economic Analysis of COVID-19 Using a Threshold Augmented Multi-Country Model. Journal of International Money and Finance 119: 102477. [Google Scholar] [CrossRef]
  34. Crowley, Meredith, Ning Meng, and Huasheng Song. 2018. Tariff scares: Trade policy uncertainty and foreign market entry by Chinese firms. Journal of International Economics 114: 96–115. [Google Scholar] [CrossRef]
  35. Cunado, Juncal, Ioannis Chatziantoniou, David Gabauer, de Fernando Perez Gracia, and Marfatia Hardik. 2023. Dynamic spillovers across precious metals and oil realized volatilities: Evidence from quantile extended joint connectedness measures. Journal of Commodity Markets 30: 100327. [Google Scholar] [CrossRef]
  36. Demirer, Riza, Ragan Gupta, Tahir Suleman, and Mark E. Wohar. 2018. Time-varying rare disaster risks, oil returns and volatility. Energy Economics 75: 239–48. [Google Scholar] [CrossRef]
  37. Dées, Stephane, and Arthur Saint-Guilhem. 2011. The role of the United States in the global economy and its evolution over time. Empirical Economics 41: 573–91. [Google Scholar] [CrossRef]
  38. Dickey, David A., and Wayne A. Fuller. 1981. Likelihood Ratio Statistics for Autoregressive Time Series with a Unit Root. Econometrica 49: 1057–72. [Google Scholar] [CrossRef]
  39. Diebold, Francis X., and Kamil Yilmaz. 2009. Measuring Financial Asset Return and Volatility Spillovers, with Application to Global Equity Markets. The Economic Journal 119: 158–71. [Google Scholar] [CrossRef]
  40. Diebold, Francis X., and Kamil Yilmaz. 2012. Better to give than to receive: Predictive directional measurement of volatility spillovers. International Journal of Forecasting 28: 57–66. [Google Scholar] [CrossRef]
  41. Ding, Wenzhi, Ross Levine, Chen Lin, and Wensi Xie. 2021. Corporate immunity to the COVID-19 pandemic. Journal of Financial Economics 141: 802–30. [Google Scholar] [CrossRef]
  42. Fink, Fabian, and Yves S. Schüler. 2015. The transmission of US systemic financial stress: Evidence for emerging market economies. Journal of International Money and Finance 55: 6–26. [Google Scholar] [CrossRef]
  43. Ftiti, Zied, Hachmi Ben Ameur, and Wael Louhichi. 2021. Does non-fundamental news related to COVID-19 matter for stock returns? Evidence from Shanghai stock market. Economic Modelling 99: 105484. [Google Scholar] [CrossRef]
  44. Gabauer, David. 2021. Dynamic measures of asymmetric & pairwise connectedness within an optimal currency area: Evidence from the ERM I system. Journal of Multinational Financial Management 60: 100680. [Google Scholar] [CrossRef]
  45. Grigoli, Francesco, Alexander Herman, and Andrew Swiston. 2019. A crude shock: Explaining the short-run impact of the 2014–16 oil price decline across exporters. Energy Economics 78: 481–93. [Google Scholar] [CrossRef]
  46. Handley, Kyle, and Nuno Limão. 2017. Policy Uncertainty, Trade, and Welfare: Theory and Evidence for China and the United States. American Economic Review 107: 2731–83. [Google Scholar] [CrossRef]
  47. Hau, Liya, Huiming Zhu, Yang Yu, and Dongwei Yu. 2022. Time-frequency coherence and quantile causality between trade policy uncertainty and rare earth prices: Evidence from China and the US. Resources Policy 75: 102529. [Google Scholar] [CrossRef]
  48. He, Feng, Brian Lucey, and Ziwei Wang. 2021. Trade policy uncertainty and its impact on the stock market -evidence from China-US trade conflict. Finance Research Letters 40: 101753. [Google Scholar] [CrossRef]
  49. Hopewell, Kristen. 2021. Trump & trade: The crisis in the multilateral trading system. New Political Economy 26: 271–82. [Google Scholar]
  50. Hoque, Mohammad Enamul, Low Soo-Wah, Md Akhter Uddin, and Ashiqur Rahman. 2023. International trade policy uncertainty spillover on stock market: Evidence from fragile five economies. The Journal of International Trade & Economic Development 32: 104–31. [Google Scholar]
  51. Hu, Debao, Jingming Lu, and Sibo Zhao. 2024. Does trade policy uncertainty increase commercial banks’ risk-taking? Evidence from China. International Review of Economics & Finance 89: 532–51. [Google Scholar] [CrossRef]
  52. Iacopini, Matteo, Aubrey Poon, Luca Rossini, and Dan Zhu. 2023. Bayesian mixed-frequency quantile vector autoregression: Eliciting tail risks of monthly US GDP. Journal of Economic Dynamics and Control 157: 104757. [Google Scholar] [CrossRef]
  53. International Monetary Fund. 2019. Still Sluggish Global Growth. Available online: https://www.imf.org/en/Publications/WEO/Issues/2019/07/18/WEOupdateJuly2019 (accessed on 1 January 2025).
  54. Kayani, Umar, Umaid A. Sheikh, Rabeh Khalfaoui, David Roubaud, and Shawkat Hammoudeh. 2024. Impact of Climate Policy Uncertainty (CPU) and global Energy Uncertainty (EU) news on U.S. sectors: The moderating role of CPU on the EU and U.S. sectoral stock nexus. Journal of Environmental Management 366: 121654. [Google Scholar] [CrossRef]
  55. Kelly, Kate, Edward Wong, and Vivian Nereim. 2023. U.S. Prepares to Lift Ban on Sales of Offensive Weapons to Saudi Arabia. The New York Times. Available online: https://www.nytimes.com/2023/12/21/us/politics/weapons-sales-saudi-arabia-yemen.html (accessed on 1 January 2025).
  56. Khodadadi, Masood. 2018. Donald Trump, US foreign policy and potential impacts on Iran’s tourism industry: Post-nuclear deal. Tourism Management Perspectives 26: 28–30. [Google Scholar] [CrossRef]
  57. Koop, Gary, M. Hashem Pesaran, and Simon M. Potter. 1996. Impulse response analysis in nonlinear multivariate models. Journal of Econometrics 74: 119–47. [Google Scholar] [CrossRef]
  58. Kwiatkowski, Denis, Peter C. B. Phillips, Peter Schmidt, and Yongcheol Shin. 1992. Testing the null hypothesis of stationarity against the alternative of a unit root: How sure are we that economic time series have a unit root? Journal of Econometrics 54: 159–78. [Google Scholar] [CrossRef]
  59. Landler, Mark. 2018. Trump Abandons Iran Nuclear Deal He Long Scorned. The New York Times. Available online: https://www.nytimes.com/2018/05/08/world/middleeast/trump-iran-nuclear-deal.html (accessed on 1 January 2025).
  60. Lastrapes, William D., and Thomas F. P. Wiesen. 2021. The joint spillover index. Economic Modelling 94: 681–91. [Google Scholar] [CrossRef]
  61. Lea, R. 2019. The IMF downgrades global growth again for 2019, slowest pace since the financial crisis. Growth 130: 1–21. [Google Scholar]
  62. Lee, Yong-Shik. 2019. Three wrongs do not make a right: The conundrum of the US steel and aluminum tariffs. World Trade Review 18: 481–501. [Google Scholar] [CrossRef]
  63. Li, Dakai, Fan Zhang, and Xuezhi Li. 2022. Can U.S. trade policy uncertainty help in predicting stock market excess return? Finance Research Letters 49: 103136. [Google Scholar] [CrossRef]
  64. Li, Mengzhe, Qianru Lin, Fei Lan, Zhimin Zhan, and Zhongshi He. 2023. Trade policy uncertainty and financial investment: Evidence from Chinese energy firms. Energy Economics 117: 106424. [Google Scholar] [CrossRef]
  65. Liptak, A., L. Buchanan, and A. Parlapiano. 2016. How a Vacancy on the Supreme Court Affected Cases in the 2015-16 Term. The New York Times. Available online: https://www.nytimes.com/interactive/2016/02/14/us/politics/how-scalias-death-could-affect-major-supreme-court-cases-in-the-2016-term.html (accessed on 1 January 2025).
  66. Londono, Juan M. 2019. Bad bad contagion. Journal of Banking & Finance 108: 105652. [Google Scholar] [CrossRef]
  67. Mei, Dexiang, and Yutang Xie. 2022. U.S. grain commodity futures price volatility: Does trade policy uncertainty matter? Finance Research Letters 48: 103028. [Google Scholar] [CrossRef]
  68. Mueller, Julia. 2022. Democratic Duo Proposes Banning Arms to Saudi Arabia Over OPEC Cuts. THE HILL. Available online: https://thehill.com/policy/energy-environment/3680496-democratic-duo-proposes-banning-arms-to-saudi-arabia-over-opec-cuts/ (accessed on 1 January 2025).
  69. Nantembelele, Fatuma Abdallah, Mustafa K. Yilmaz, and Ali Ari. 2023. The effects of a US-China trade war on Sub-Saharan Africa: Pro-active domestic policies make the difference. Journal of Policy Modeling 45: 1296–310. [Google Scholar] [CrossRef]
  70. Nawaz, Kishwar, Amine Lahiani, and David Roubaud. 2020. Do natural resources determine energy consumption in Pakistan? The importance of quantile asymmetries. The Quarterly Review of Economics and Finance 87: 200–11. [Google Scholar] [CrossRef]
  71. Noland, Marcus. 2018. US trade policy in the Trump administration. Asian Economic Policy Review 13: 262–78. [Google Scholar] [CrossRef]
  72. Nuruzzaman, Mohammed. 2020. President Trump’s ‘Maximum Pressure’Campaign and Iran’s Endgame. Strategic Analysis 44: 570–82. [Google Scholar] [CrossRef]
  73. Page, M. 2022. Biden Should not Renew Arms Sales to Saudi Arabia. Human Rights Watch. Available online: https://www.hrw.org/news/2022/07/14/biden-should-not-renew-arms-sales-saudi-arabia?gad_source=1 (accessed on 1 January 2025).
  74. Pal, Debdatta, and Subrata K. Mitra. 2016. Asymmetric oil product pricing in India: Evidence from a multiple threshold nonlinear ARDL model. Economic Modelling 59: 314–28. [Google Scholar] [CrossRef]
  75. Pesaran, H. Hashem, and Yongcheol Shin. 1998. Generalized impulse response analysis in linear multivariate models. Economics Letters 58: 17–29. [Google Scholar] [CrossRef]
  76. Phillips, Peter C. B., and Pierre Perron. 1988. Testing for a unit root in time series regression. Biometrika 75: 335–46. [Google Scholar] [CrossRef]
  77. Ruiz Estrada, Mario Arturo, Donghyun Park, Muhammad Tahir, and Alam Khan. 2020. Simulations of US-Iran war and its impact on global oil price behavior. Borsa Istanbul Review 20: 1–12. [Google Scholar] [CrossRef]
  78. Sachdev, Vineet, and Anurag Rao. 2025. What Happened the Last Time Trump Imposed Tariffs on Steel and Aluminum. Reuters. Available online: https://www.reuters.com/graphics/TRUMP-TARIFFS/STEEL/gdpznwgdzpw/ (accessed on 10 January 2025).
  79. Selmi, Refk, and Jamal Bouoiyour. 2020. Arab geopolitics in turmoil: Implications of Qatar-Gulf crisis for business. International Economics 161: 100–19. [Google Scholar] [CrossRef]
  80. Shi, Yujie, and Liming Wang. 2023. Comparing the impact of Chinese and U.S. economic policy uncertainty on the volatility of major global stock markets. Global Finance Journal 57: 100860. [Google Scholar] [CrossRef]
  81. Smales, Lee A. 2020. Examining the relationship between policy uncertainty and market uncertainty across the G7. International Review of Financial Analysis 71: 101540. [Google Scholar] [CrossRef]
  82. Stiassny, Alfred. 1996. A spectral decomposition for structural VAR models. Empirical Economics 21: 535–55. [Google Scholar] [CrossRef]
  83. Sheikh, Umaid A., Mehrad Asadi, David Roubaud, and Shawkat Hammoudeh. 2024. Global uncertainties and Australian financial markets: Quantile time-frequency connectedness. International Review of Financial Analysis 92: 103098. [Google Scholar] [CrossRef]
  84. Song, Yuegang, Xiaoyu Zhang, and Guoheng Hu. 2023. Relationships among geopolitical risk, trade policy uncertainty, and crude oil import prices: Evidence from China. Resources Policy 82: 103555. [Google Scholar] [CrossRef]
  85. Suleman, Muhammad Tahir, Mobeen Ur Rehman, Umaid A. Sheikh, and Sang Hoon Kang. 2023a. Dynamic time-frequency connectedness between European emissions trading system and sustainability markets. Energy Economics 123: 106726. [Google Scholar] [CrossRef]
  86. Suleman, Muhammad Tahir, Umaid A. Sheikh, Emilios C. Galariotis, and David Roubaud. 2023b. The impact of bitcoin fear and greed on good and bad network connectedness: The case of the US sectoral high frequency returns. Annals of Operations Research. [Google Scholar] [CrossRef]
  87. Suleman, Muhammad Tahir, Mosab I. Tabash, and Umaid A. Sheikh. 2022. Do stock market fluctuations lead to currency deflation in the South Asian region? Evidence beyond symmetry. International Journal of Finance & Economics 29: 1432–50. [Google Scholar] [CrossRef]
  88. Suwanprasert, Wisarut. 2022. The international spillover effects of US trade policy uncertainty. Economics Letters 212: 110286. [Google Scholar] [CrossRef]
  89. Tabash, Mosab I., Umaid A. Sheikh, Walid Mensi, and Sang Hoon Kang. 2024. Quantile-based extended joint connectedness between trade policy uncertainty and Gulf Cooperation Council Islamic sectoral volatility. Borsa Istanbul Review 24: 1146–65. [Google Scholar] [CrossRef]
  90. White, Halbert, Tae-Hwan Kim, and Simone Manganelli. 2015. VAR for VaR: Measuring tail dependence using multivariate regression quantiles. Journal of Econometrics 187: 169–88. [Google Scholar] [CrossRef]
  91. Yu, Mingzhe, Jiachuan Fan, Haijun Wang, and Jie Wang. 2023. US trade policy uncertainty on Chinese agricultural imports and exports: An aggregate and product-level analysis. International Review of Economics & Finance 84: 70–83. [Google Scholar] [CrossRef]
  92. U.S.-U.A.E. Business Council. 2024. Contesting Trade Barriers: Steel and Aluminum Tariffs. Available online: https://usuaebusiness.org/focusareas/contesting-trade-barriers-steel-and-aluminum-tariffs/ (accessed on 22 January 2025).
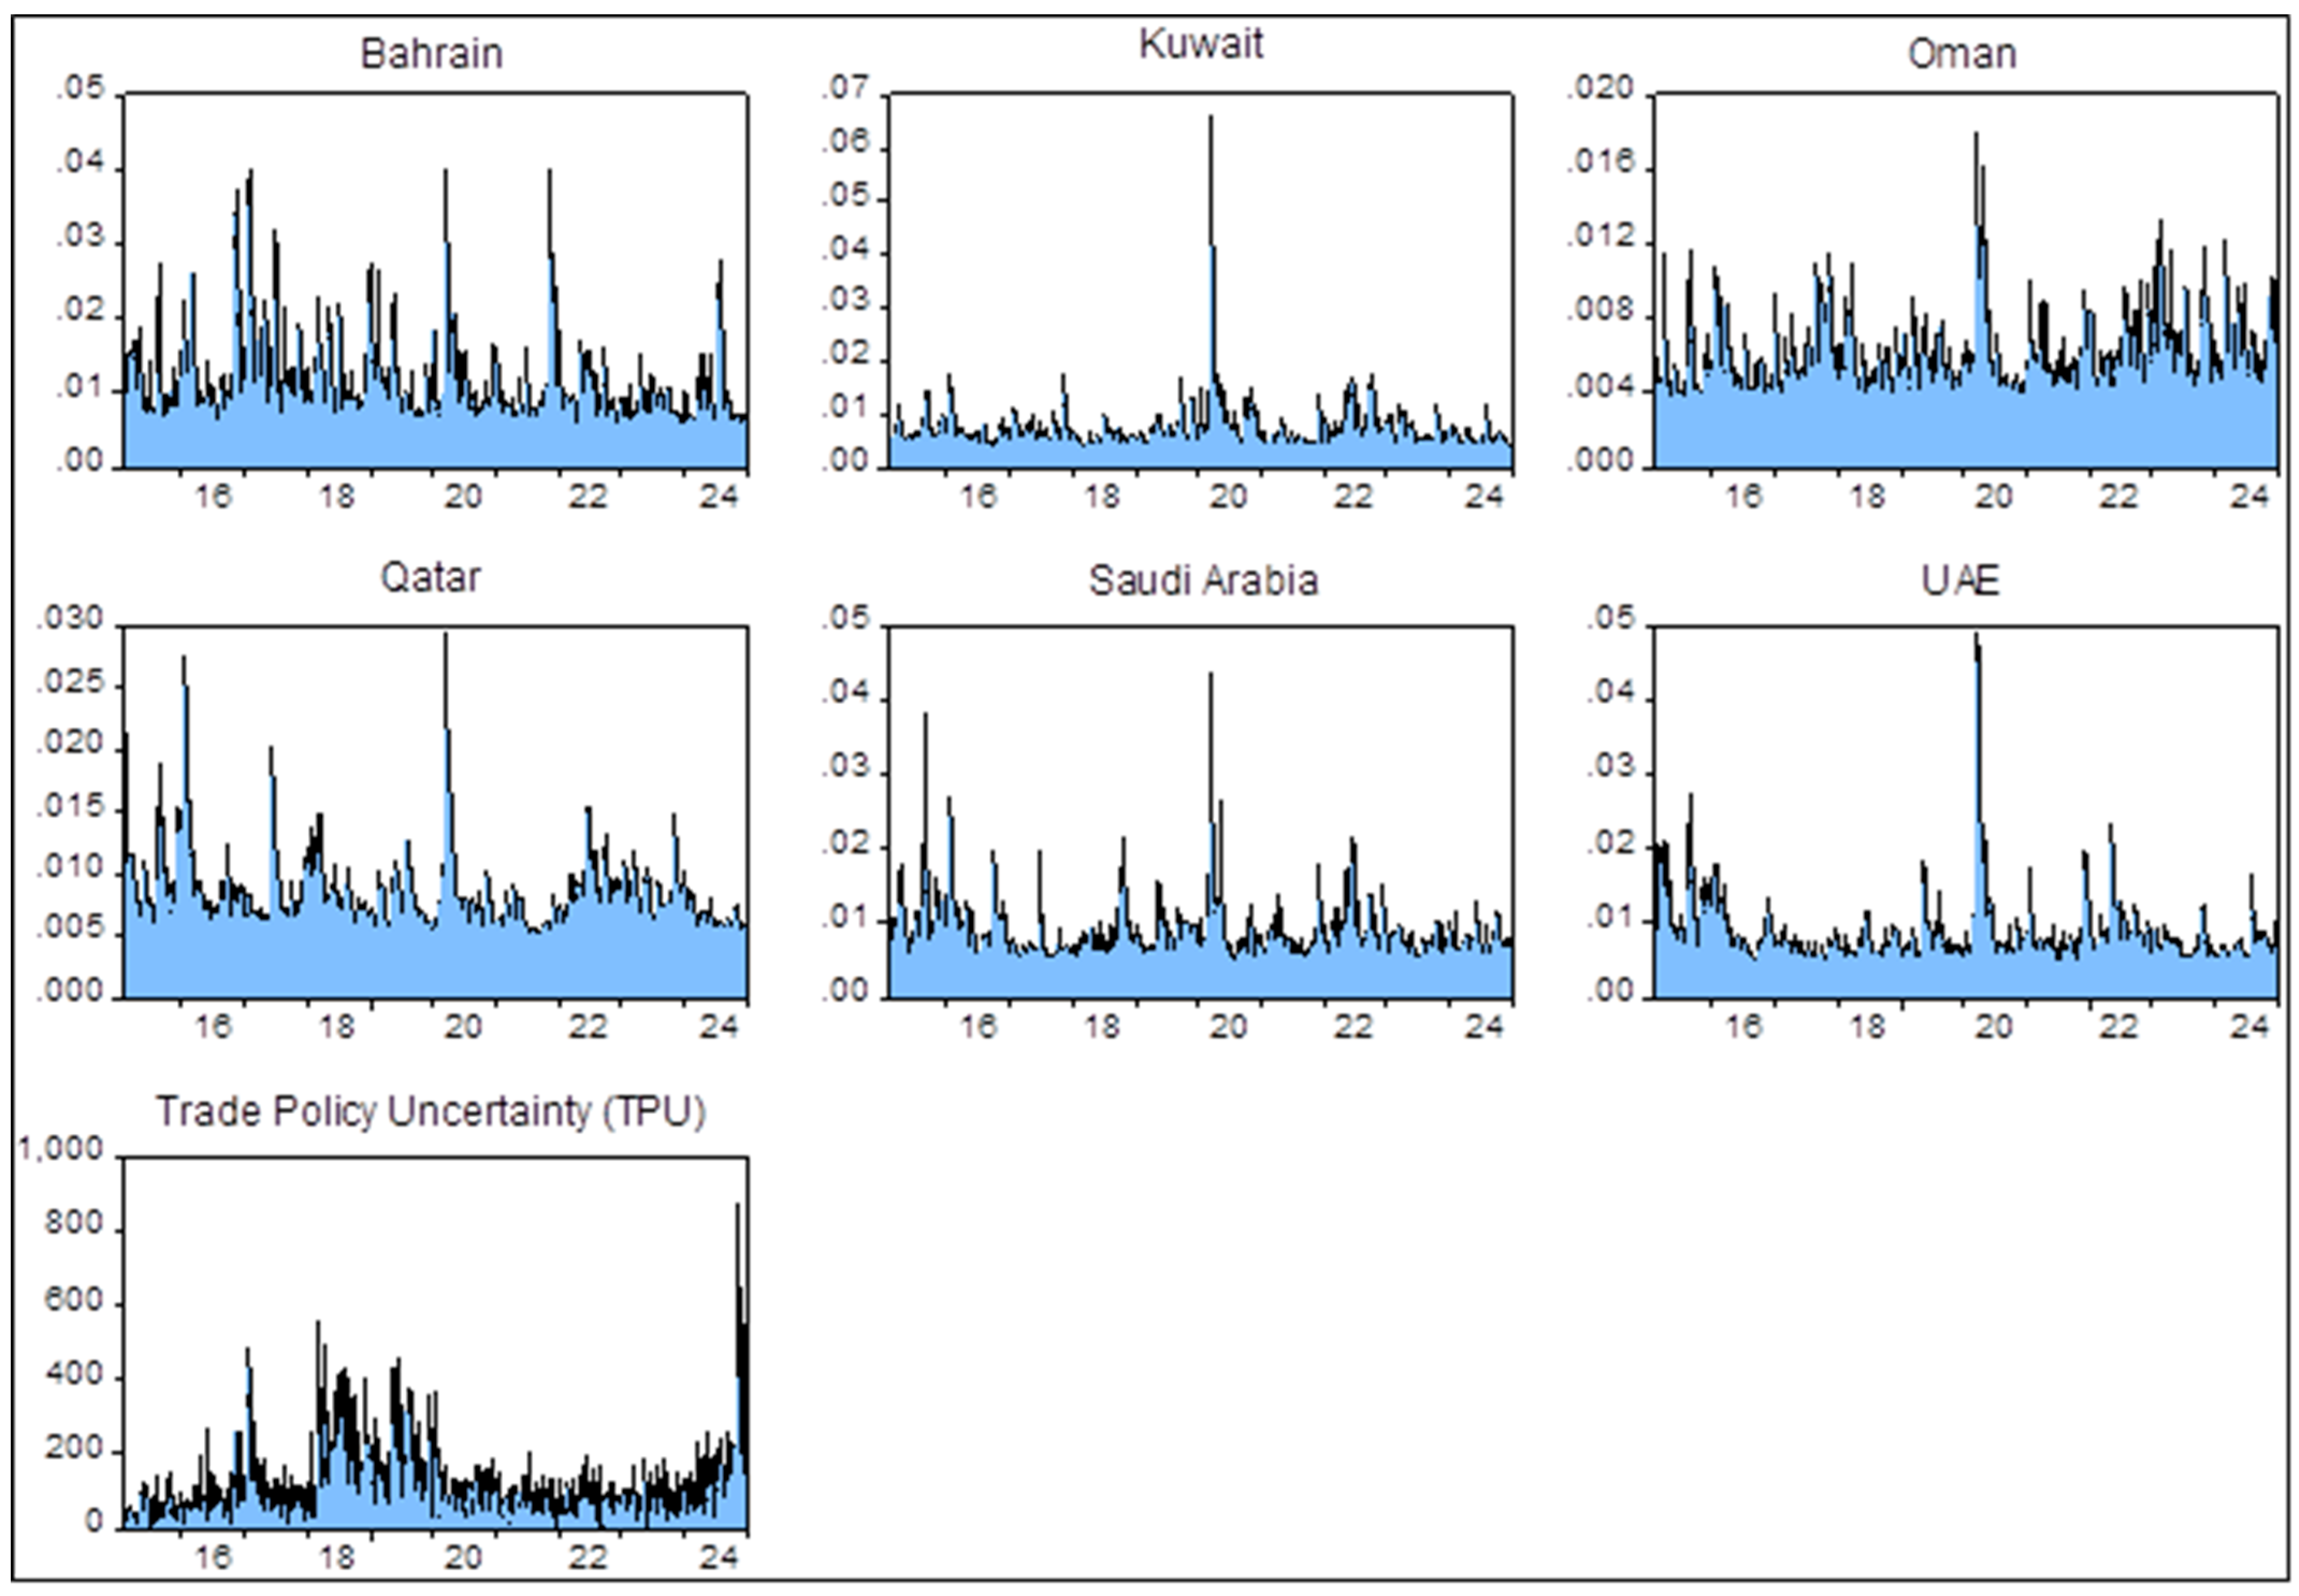
Figure 1. Graphical representation of Trade Policy Uncertainty (TPU) and conditional volatility series of GCC Sharia-compliant Islamic financial markets estimated through GARCH (1,1) with GED term.
Risks 13 00056 g001
Figure 2. Total connectedness index between GCC stock market conditional risk and trade policy uncertainty at lower (A), median (B), and higher (C) quantiles by utilizing the QVAR-based Extended Joint connectedness approach.
Risks 13 00056 g002
Figure 3. (a) Transmission of shocks from a variable “ i ” “TO” all other variables “ j ” due to the own shocks by utilizing the QVAR-based Extended Joint connectedness approach for GCC Islamic stock market conditional volatility and TPU shocks. (b) Transmission of shocks “FROM” all other variables “ j ” towards the variable “ i ” by utilizing the QVAR-based Extended Joint connectedness approach for GCC Islamic stock market conditional volatility and TPU. (c) “NET” transmission of shocks between Trade Policy Uncertainty (TPU) and GCC Islamic stock market risk by utilizing the QVAR-based Extended Joint connectedness approach for GCC stock market conditional volatility and TPU.
Risks 13 00056 g003aRisks 13 00056 g003bRisks 13 00056 g003c
Figure 4. (a) Total connectedness index between GCC stock market conditional risk and trade policy uncertainty across different rolling windows (250, 200) at lower, median, and higher quantiles by utilizing the QVAR-based Extended Joint-connectedness approach by Cunado et al. (2023). (b) Total connectedness index between GCC stock market conditional risk and trade policy uncertainty across different H-step ahead forecasting horizons (25, 20 days) at lower, median, and higher quantiles by utilizing the QVAR-based Extended Joint-connectedness approach by Cunado et al. (2023). (c) Total connectedness index between GCC stock market conditional risk and trade policy uncertainty across different quantiles.
Risks 13 00056 g004aRisks 13 00056 g004bRisks 13 00056 g004c
Figure 5. (a) Total Connectedness Index (TCI) by using the QVAR-based frequency connectedness approach between GCC Islamic stock market risk and Trade Policy Uncertainty (TPU) in the short term (ST) across bearish, median, and bullish quantiles. (b) Total connectedness index by using the QVAR-based frequency connectedness approach between GCC Islamic stock market risk and Trade Policy Uncertainty (TPU) in the long term (LT) across bearish, median, and bullish quantiles.
Risks 13 00056 g005aRisks 13 00056 g005b
Figure 6. (a) Transmission of shocks from a variable “ i ” “TO” all other variables “ j ” in the short term (ST) and long term (LT) by utilizing the Frequency-domain QVAR-based connectedness approach for GCC Islamic stock market volatility and TPU. Note: This figure explains the transmission of shocks from a variable i towards all other variables within the QVAR system at lower ( τ = 0.05 ), median ( τ = 0.50 ), and higher ( τ = 0.95 ) quantiles in the ST (short term) and LT (long term). Moreover, blue, red, and green lines represent the transmission of shocks toward all others in the short term (ST) at lower, median, and higher quantiles, whereas black, dark teal, and purple lines represent the shock transmission at lower, median, and higher quantiles in the long term (LT), respectively. (b) Transmission of shocks “FROM” all other variables “ j ” to a variable “ i ” in the short term (ST) and long term (LT) by utilizing the Frequency-domain QVAR-based connectedness approach for GCC Islamic stock market volatility and TPU. Note: This figure explains the reception of shocks from all other variables j within the QVAR system toward a variable i at lower (τ = 0.05), median (τ = 0.50), and higher (τ = 0.95) quantiles in the ST (short term) and LT (long term). Moreover, blue, red, and green lines represent the reception of shocks in the short term (ST) at lower, median, and higher quantiles from all others, whereas black, dark teal, and purple lines represent the shock reception at lower, median, and higher quantiles in the long term (LT), respectively. (c) NET spillovers of shocks between GCC Islamic stock markets’ conditional volatility and Trade Policy Uncertainty (TPU) in the short term (ST) and long term (LT) and across bearish ( τ = 0.05 ), bullish ( τ = 0.95 ), and median ( τ = 0.50 ) quantiles.
Risks 13 00056 g006aRisks 13 00056 g006bRisks 13 00056 g006c
Figure 7. (a) Total connectedness index between GCC stock market conditional risk and trade policy uncertainty across different rolling windows (250, 200) at lower (A), median (B), and higher (C) quantiles by utilizing the QVAR-based frequency connectedness approach. (b) Total connectedness index between GCC stock market conditional risk and trade policy uncertainty across different H-step ahead forecasting horizons (25, 20) at lower (A), median (B), and higher (C) quantiles by utilizing the QVAR-based frequency connectedness approach.
Risks 13 00056 g007aRisks 13 00056 g007bRisks 13 00056 g007c
Table 1. (a) The descriptive statistics of the naturally logarithmically transformed stock market indices of GCC member economies. (b) The descriptive statistics of the naturally logarithmically transformed return series of the stock market indices of GCC member economies.
(a)
BahrainKuwaitOmanQatarSaudi ArabiaUAETPU
Mean5.6858326.546776.5542677.4339795.2928176.38876886.394
Median5.6452176.5190226.4133857.4140375.2394166.40889164.051
Maximum6.2623887.0753787.1053687.7336625.8144296.757281877.551
Minimum5.1136135.9652496.1946717.1313874.720555.7900210.000
Std. Dev.0.2712480.2778270.2632330.1167990.2634780.15131979.394
Skewness−0.024876−0.0600570.778540.5273810.11032−0.6859162.266
Kurtosis2.1757331.7384722.1067442.8502791.7067463.67546211.705
Jarque–Bera (JB)88.02082207.2924415.9585146.5017222.1768301.818912,434.290
Probability0.000000.000000.000000.000000.000000.000000.000
Sum17,614.7120,281.8920,305.1223,030.4716,397.1519,792.4267,649.900
Sum Sq. Dev.227.86239.05214.6042.25215.0070.9119,521,739.00
(b)
BahrainKuwaitOmanQatarSaudi ArabiaUAE
Mean0.000150.00016−0.00026−0.000090.000140.00006
Median0.000000.000000.000000.000000.000000.00000
Maximum0.088740.056730.037150.067090.080860.08153
Minimum−0.08270−0.21454−0.05111−0.12630−0.08026−0.16063
Std. Dev.0.012410.008820.006510.009490.009640.01039
Skewness0.35616−5.90093−0.36004−1.26435−0.63437−1.89114
Kurtosis13.19292137.375009.8740622.3218114.5737136.41283
Jarque–Bera13,472.3402,348,032.0006164.47849,000.54017,492.960145,910.400
Probability0.000000.000000.000000.000000.000000.00000
Sum0.475080.47911−0.80912−0.264850.446710.18192
Sum Sq. Dev.0.476850.240660.131370.278980.287560.33421
Observations3096.003096.003096.003096.003096.003096.00
Note: This table explains the descriptive statistics of naturally logarithmically transformed indices and return series of the Sharia complaint stock markets of Bahrain, Kuwait, Oman, Qatar, Saudi Arabia, and UAE. Furthermore, this table also explains the descriptive statistics of Trade Policy Uncertainty (TPU).
Table 2. The coefficients of GARCH (1,1) approach with student’s t and Generalized Error Distribution (GED).
Bahrain Oman
GARCH (1,1) with Student’s t GARCH (1,1) with GED GARCH (1,1) with Student’s t GARCH (1,1) with GED
VariableCoefficientStd. Errorz-StatisticProb. CoefficientStd. Errorz-StatisticProb. CoefficientStd. Errorz-StatisticProb. CoefficientStd. Errorz-StatisticProb.
μ 2.59 × 10−50.00020.16610.8681 9.07 × 10−60.00020.05610.9552 −0.00020.0001−2.05150.0402 −0.00010.0001−1.12400.2610
ϕ r t 1 −0.00470.0195−0.23840.8116 −0.00090.0200−0.04310.9656 0.04120.01862.21760.0266 0.02790.01881.48350.1379
Variance Equation Variance Equation Variance Equation Variance Equation
ω 4.86 × 10−60.00008.89280.0000 5.69 × 10−60.000010.06830.0000 0.0000020.00007.35800.0000 0.0000020.00008.17880.0000
α ϵ t 1 2 0.11130.008513.14290.0000 0.12110.008214.74710.0000 0.07760.007310.55720.0000 0.08160.007111.50980.0000
β σ t 1 2 0.81950.011571.06320.0000 0.82000.010577.92330.0000 0.85570.012568.57170.0000 0.85980.011177.76330.0000
Log likelihood9927.4220 9953.7770 11,636.1800 11,673.8200
Durbin–Watson stat1.9146 1.9222 1.9260 1.8983
Akaike Info criterion−6.4098 −6.4269 −7.5137 −7.5380
Schwarz criterion−6.4001 −6.4171 −7.5039 −7.5282
Hannan–Quinn criteria.−6.4063 −6.4234 −7.5102 −7.5345
Qatar Kuwait
GARCH (1,1) with Student’s t GARCH (1,1) with GED GARCH (1,1) with Student’s t GARCH (1,1) with GED
VariableCoefficientStd. Errorz-StatisticProb. CoefficientStd. Errorz-StatisticProb. CoefficientStd. Errorz-StatisticProb. CoefficientStd. Errorz-StatisticProb.
μ 0.00010.00010.79090.4290 1.67 × 10−50.00010.11970.9047 0.00030.00012.53240.0113 0.00010.00011.18300.2368
ϕ r t 1 0.08320.01674.96650.0000 0.05770.01823.17920.0015 0.06220.01833.40880.0007 0.06000.01933.10330.0019
Variance Equation Variance Equation Variance Equation Variance Equation
ω 1.50 × 10−62.10 × 10−77.13190.0000 1.91 × 10−62.31 × 10−78.23830.0000 0.0000020.00008.71230.0000 0.0000020.00009.73410.0000
α ϵ t 1 2 0.03500.003510.10920.0000 0.04970.003613.83960.0000 0.07570.006511.56630.0000 0.09260.005217.92350.0000
β σ t 1 2 0.92610.0065143.54110.0000 0.91360.0063145.98400.0000 0.85740.010482.11230.0000 0.85990.0081105.99110.0000
Log likelihood10,633.6600 10,650.1800 11,283.3700 11,272.0300
Durbin–Watson stat2.0942 2.0432 2.0314 2.0272
Akaike Info criterion−6.8661 −6.8767 −7.2858 −7.2784
Schwarz criterion−6.8563 −6.8670 −7.2760 −7.2687
Hannan–Quinn criter.−6.8626 −6.8732 −7.2823 −7.2749
UAE Saudi Arabia
GARCH (1,1) with Student’ t GARCH (1,1) with GED GARCH (1,1) with Student’s t GARCH (1,1) with GED
VariableCoefficientStd. Errorz-StatisticProb. CoefficientStd. Errorz-StatisticProb. CoefficientStd. Errorz-StatisticProb. CoefficientStd. Errorz-StatisticProb.
μ 0.00020.00011.42470.1543 0.00010.00010.58800.5566 0.0003820.0001342.8602480.00012 0.0002440.0001341.826050.0678
ϕ r t 1 0.03210.01761.82840.0675 0.02070.01861.11100.2666 0.1089770.0190855.7102150.0042 0.0727490.0191883.7914410.0001
Variance Equation Variance Equation Variance Equation Variance Equation
ω 0.0000020.00008.74380.0000 0.0000020.00009.82980.0000 3.51 × 10−65.12 × 10−76.8504790.00038 0.0000030.00006.98100.0000
α ϵ t 1 2 0.05990.005211.45340.0000 0.07500.004317.50300.0000 0.0994770.00971710.237420.000001 0.10710.009511.32810.0000
β σ t 1 2 0.88640.0082108.73130.0000 0.87960.0070125.79730.0000 0.8391540.01416459.244090.000032 0.84060.013462.95340.0000
Log likelihood10,680.3200 10,679.3700 10,557.57 10,585.64
Durbin–Watson stat2.0777 2.0561 2.11166 2.039992
Akaike Info criterion−6.8962 −6.8956 −6.816906 −6.835041
Schwarz criterion−6.8865 −6.8858 −6.807154 −6.82529
Hannan–Quinn criter.−6.8927 −6.8921 −6.813404 −6.83154
Note: This table explains the ARCH and GARCH parameters of the GARCH (1,1) approach with student’s t and Generalized Error distribution term (GED). Whereas, log-likelihood, Akaike Information Criterion (AIC), Schwarz Criterion (SIC), and Hannan–Quinn (HQ) are included as goodness of fit. Whereas, the Durbin–Watson (DW) test determines the presence of autocorrelation.
Table 3. Descriptive statistics of the Islamic stock market conditional volatility of GCC member economies.
BahrainKuwaitOmanQatarSaudi ArabiaUAETPU
Mean0.01060.00690.00580.00820.00850.008486.3944
Median0.00910.00590.00530.00750.00750.007164.0513
Maximum0.04030.06630.01790.02960.04370.0491877.5510
Minimum0.00580.00310.00380.00500.00490.00490.0000
Std. Dev.0.00490.00410.00180.00290.00350.004479.3942
Skewness2.48107.12881.97202.92343.68164.70112.2664
Kurtosis11.005377.03958.781315.123324.371234.676611.7053
Jarque–Bera11,443.170733,382.2006318.25423,369.50065,911.630140,843.70012,434.290
Probability0.0000.0000.0000.0000.0000.0000.000
Sum32.76121.47318.08625.42726.17625.925267,649.90
Sum Sq. Dev.0.0740.0520.0100.0270.0380.06019,521,739.00
Observations3096.0003096.0003096.0003096.0003096.0003096.0003098.000
unit root test at level
ADF−9.82 ***−9.20 ***−9.60 ***−8.30 ***−9.65 ***−8.20 ***−5.736 ***
PP−9.84 ***−8.96 ***−9.843 ***−8.22 ***−9.10 ***−8.072 ***−45.736 ***
KPSS0.1920.190.5670.70.430.350.53
Note: This table presents the statistical characteristics of conditional volatility series in GCC Islamic stock markets adhering to Sharia principles. The conditional volatility series of GCC member economies’ stock market returns are estimated through GARCH (1,1) with Generalized Error Distribution (GED) term and the natural logarithmically transformed Trade Policy Uncertainty. The final three rows display the results of unit root test statistics obtained from the Augmented Dickey Fuller test (ADF, developed by Dickey and Fuller (1981)), Philips Peron unit root test (PP, proposed by Phillips and Perron (1988)), and Kwiatkowski Philips Schmidt Shin test (KPSS, introduced by Kwiatkowski et al. (1992)). The level of significance at 1% is represented by the asterisk sign of ***.
Table 4. BDS test of non-linearity for Islamic stock market volatility of GCC-member economies.
Bahrain Kuwait Oman
DimensionBDS StatisticStd. Errorz-StatisticProb. DimensionBDS StatisticStd. Errorz-StatisticProb. DimensionBDS StatisticStd. Errorz-StatisticProb.
2.00000.16540.002081.78920.0000 2.00000.17400.002184.89600.0000 2.00000.16610.001794.96220.0000
3.00000.27560.003285.49660.0000 3.00000.29150.003389.29110.0000 3.00000.27700.002899.49570.0000
4.00000.34610.003989.81950.0000 4.00000.36850.003994.53270.0000 4.00000.34790.0033104.76980.0000
5.00000.38830.004096.30510.0000 5.00000.41680.0041102.30770.0000 5.00000.39120.0035112.80790.0000
6.00000.41110.0039105.28790.0000 6.00000.44540.0039113.02320.0000 6.00000.41510.0034123.86860.0000
Qatar Saudi Arabia UAE
DimensionBDS StatisticStd. Errorz-StatisticProb. DimensionBDS StatisticStd. Errorz-StatisticProb. DimensionBDS StatisticStd. Errorz-StatisticProb.
2.00000.18200.001994.46710.0000 2.00000.16600.001986.83100.0000 2.00000.17980.002282.33290.0000
3.00000.30570.003199.85570.0000 3.00000.27810.003091.26940.0000 3.00000.30230.003586.81990.0000
4.00000.38840.0036106.53510.0000 4.00000.35130.003696.52290.0000 4.00000.38470.004292.40110.0000
5.00000.44230.0038116.35200.0000 5.00000.39710.0038104.34640.0000 5.00000.43840.0044100.57920.0000
6.00000.47590.0037129.75560.0000 6.00000.42350.0037115.00170.0000 6.00000.47190.0042111.75190.0000
TPU
DimensionBDS StatisticStd. Errorz-StatisticProb.
2.00000.07640.001842.18660.0000
3.00000.13480.002946.88370.0000
4.00000.17340.003450.68810.0000
5.00000.19480.003654.69670.0000
Note: This table presents the outcome of BDS test of non-linearity by Brock et al. (1996) for GCC Islamic stock markets’ conditional volatility. If p-values fall below than the 1%, 5%, and 10% level of significance, then the null hypothesis of independence and identical distribution is rejected.
Table 5. QVAR-based Extended Joint connectedness between Islamic stock market volatility of GCC member economies and Trade Policy Uncertainty (TPU).
At Lower Quantile (r = 0.05)BahrainOmanKuwaitQatarUAESaudi ArabiaTPUFROM
Bahrain88.831.122.110.961.792.272.911.17
Oman1.2489.951.411.081.522.032.7810.05
Kuwait1.951.0889.261.741.641.852.4810.74
Qatar0.540.541.5693.741.870.860.96.26
UAE1.261.051.752.1990.51.471.799.5
Saudi Arabia2.291.892.171.52.1386.843.1813.16
TPU5.324.755.13.14.756.1870.7929.21
TO12.610.4414.110.5713.714.6614.0390.09
Inc.Own101.43100.39103.36104.31104.2101.584.82TCI
NET1.430.393.364.314.21.5−15.1812.87%
At Median Quantile (r = 0.50)
Bahrain98.180.180.530.190.350.320.251.82
Oman0.2199.140.150.160.160.150.030.86
Kuwait0.40.0898.840.10.160.190.231.16
Qatar0.170.180.3998.690.450.110.011.31
UAE0.170.10.190.1799.170.160.040.83
Saudi Arabia0.250.180.210.140.2298.950.051.05
TPU2.941.412.352.963.441.8785.0414.96
TO4.132.133.813.724.792.80.6121.99
Inc.Own102.31101.27102.65102.41103.96101.7585.65TCI
NET2.311.272.652.413.961.75−14.353.14%
At Higher Quantile (r = 0.95)
Bahrain61.185.86.176.155.977.457.2838.82
Oman6.4263.055.55.665.617.136.6336.95
Kuwait6.645.3462.895.825.617.096.6137.11
Qatar6.365.495.5963.175.627.146.6436.83
UAE6.885.765.955.9761.47.196.8538.6
Saudi Arabia6.795.645.8465.5663.36.8636.7
TPU16.5513.9414.3113.1913.417.9310.6989.31
TO49.6341.9743.3542.7941.7853.9440.87314.32
Inc.Own110.81105.03106.24105.95103.17117.2451.55TCI
NET10.815.036.245.953.1717.24−48.4544.90%
Note: This table elucidates the extreme quantile interconnectedness between GCC Islamic stock market volatility and trade policy uncertainty using the QVAR model employing the “Extended Joint connectedness” approach introduced by Cunado et al. (2023). Our methodology involves a rolling window spanning 250 days, a lag length of one (determined by AIC), and a forecast error variance decomposition with a horizon of 20 steps ahead. The selection of lower (0.05), median (0.50), and higher quantiles (0.95) aligns with the approach of Iacopini et al. (2023). The “FROM” values highlight how all other variables (denoted as j) influence variable i, whereas the “TO” measures indicate the influence of variable i on all other variables j. The disparity between the “TO” and “FROM” directional spillover values provides the NET spillover values, with a positive (negative) difference suggesting that variable i is a net transmitter (receiver) of shocks. The Total Connectedness Index (TCI) represents the cumulative value of forecast error variances resulting from spillovers of total volatility shocks across the entire system.
Table 6. QVAR-based Frequency-domain connectedness between GCC stock market risk and Trade Policy Uncertainty (TPU).
Panel AShort-Term Long-Term
r = 0.05BahrainOmanKuwaitQatarUAESaudi ArabiaTPUFrom BahrainOmanKuwaitQatarUAESaudi ArabiaTPUFrom
Bahrain2.570.180.250.130.250.310.281.41 61.034.426.423.46.257.66.8934.99
Oman0.131.990.140.10.150.180.20.91 4.8165.434.963.75.246.236.7331.67
Kuwait0.170.121.620.220.230.170.181.08 6.214.3657.118.398.566.316.3840.19
Qatar0.040.040.10.780.140.050.050.42 3.473.48.9862.6411.974.373.9736.16
UAE0.120.10.180.221.30.120.130.87 5.714.568.4710.9156.915.675.6140.92
Saudi Arabia0.240.20.220.150.22.110.281.28 7.425.766.394.265.8659.187.7337.42
TPU2.912.632.691.632.43.4827.3115.75 43.643.892.543.854.7534.2822.67
TO3.613.263.582.463.374.321.1321.73 31.6226.1339.133.2141.7334.9337.3244.02
Inc.Own6.185.245.23.244.676.4328.43TCI 92.6591.5696.2195.8598.6494.1171.58TCI
Net2.22.342.52.032.53.04−14.623.10% −3.37−5.54−1.09−2.950.81−2.4914.6334.86%
Panel B
r = 0.50Short-Term Long-Term
Bahrain2.630.110.180.10.180.220.030.82 71.493.735.622.855.816.080.9725.06
Oman0.072.150.10.080.090.10.010.45 4.475.114.323.424.745.090.3222.29
Kuwait0.130.091.750.220.20.110.020.76 5.823.765.517.867.845.910.8431.98
Qatar0.020.020.090.820.130.020.010.28 3.423.079.5367.5911.024.10.1831.31
UAE0.060.060.110.191.30.060.010.49 6.33.959.1510.3762.015.920.5136.2
Saudi Arabia0.150.130.160.120.122.110.020.7 6.954.144.923.285.2472.060.6125.14
TPU0.290.10.240.180.240.2232.451.27 3.081.462.483.574.061.9449.6816.59
TO0.720.510.880.880.950.730.094.76 29.9920.0536.0231.3538.729.043.44188.58
Inc.Own3.352.652.631.72.262.8432.54TCI 101.4895.16101.5398.94100.71101.0953.12TCI
Net−0.090.060.120.60.470.03−1.180.68% 4.92−2.244.040.042.53.9−13.1626.90%
Panel C
r = 0.95Short-Term Long-Term
Bahrain1.20.80.830.80.781.040.895.13 15.9811.9612.912.3611.9515.6212.977.69
Oman1.050.820.80.740.761.060.815.22 14.2813.3912.6912.1212.3916.4812.6180.57
Kuwait1.020.790.820.770.740.980.825.12 14.5411.9913.5412.5212.2516.6112.5980.51
Qatar0.990.730.710.80.730.970.784.91 14.0412.2612.7413.8512.3816.6412.3980.44
UAE0.950.760.740.70.730.980.764.89 14.7312.5512.7612.3913.0516.1812.7281.32
Saudi Arabia1.080.810.760.770.771.140.85 14.3212.2512.6612.3611.8517.8912.5375.97
TPU1.81.511.461.441.51.762.499.47 13.611.5411.9610.9411.0515.1313.8174.22
TO6.885.45.35.225.286.84.8639.74 85.5172.5675.7172.6971.8896.6575.75550.73
Inc.Own8.096.216.126.026.017.947.36TCI 101.4985.9489.2586.5484.92114.5489.56TCI
Net1.760.170.180.310.391.8−4.615.68% 7.82−8.02−4.81−7.75−9.4520.681.5276.70%
Note: This table expounds upon the profound quantile interdependency observed between the volatility of GCC Islamic stock markets and Trade Policy Uncertainty (TPU). The investigation employs the Frequency-domain Quantile-based Vector auto-Regression (QVAR) methodology advanced by Chatziantoniou et al. (2022), utilizing a rolling window encompassing 250 days, a lag length determined by Akaike Information Criterion (AIC), and a forecast error variance decomposition extending 20 steps into the future. Furthermore, the selection of lower (0.05), median (0.50), and higher (0.95) quantiles conforms to the methodology espoused by Iacopini et al. (2023). The “FROM” values delineate the influence of all other variables (denoted as j) on variable i, while the “TO” measures illustrate the influence of variable i on all other variables j. The Total Connectedness Index (TCI) are defined as the cumulative value of forecast error variances resulting from the transmission of total shocks throughout the entire system.
Disclaimer/Publisher’s Note: The statements, opinions and data contained in all publications are solely those of the individual author(s) and contributor(s) and not of MDPI and/or the editor(s). MDPI and/or the editor(s) disclaim responsibility for any injury to people or property resulting from any ideas, methods, instructions or products referred to in the content.