
Dynamic Shock-Transmission Mechanism Between U.S. Trade Policy Uncertainty and Sharia-Compliant Stock Market Volatility of GCC Economies

 ,
,  ,
,  , , , and
Abstract
1. Introduction
2. Literature Review
Transmission Mechanism Between Trade Policy Uncertainty (TPU) Shocks and Financial Markets
3. Data with Descriptive Statistics
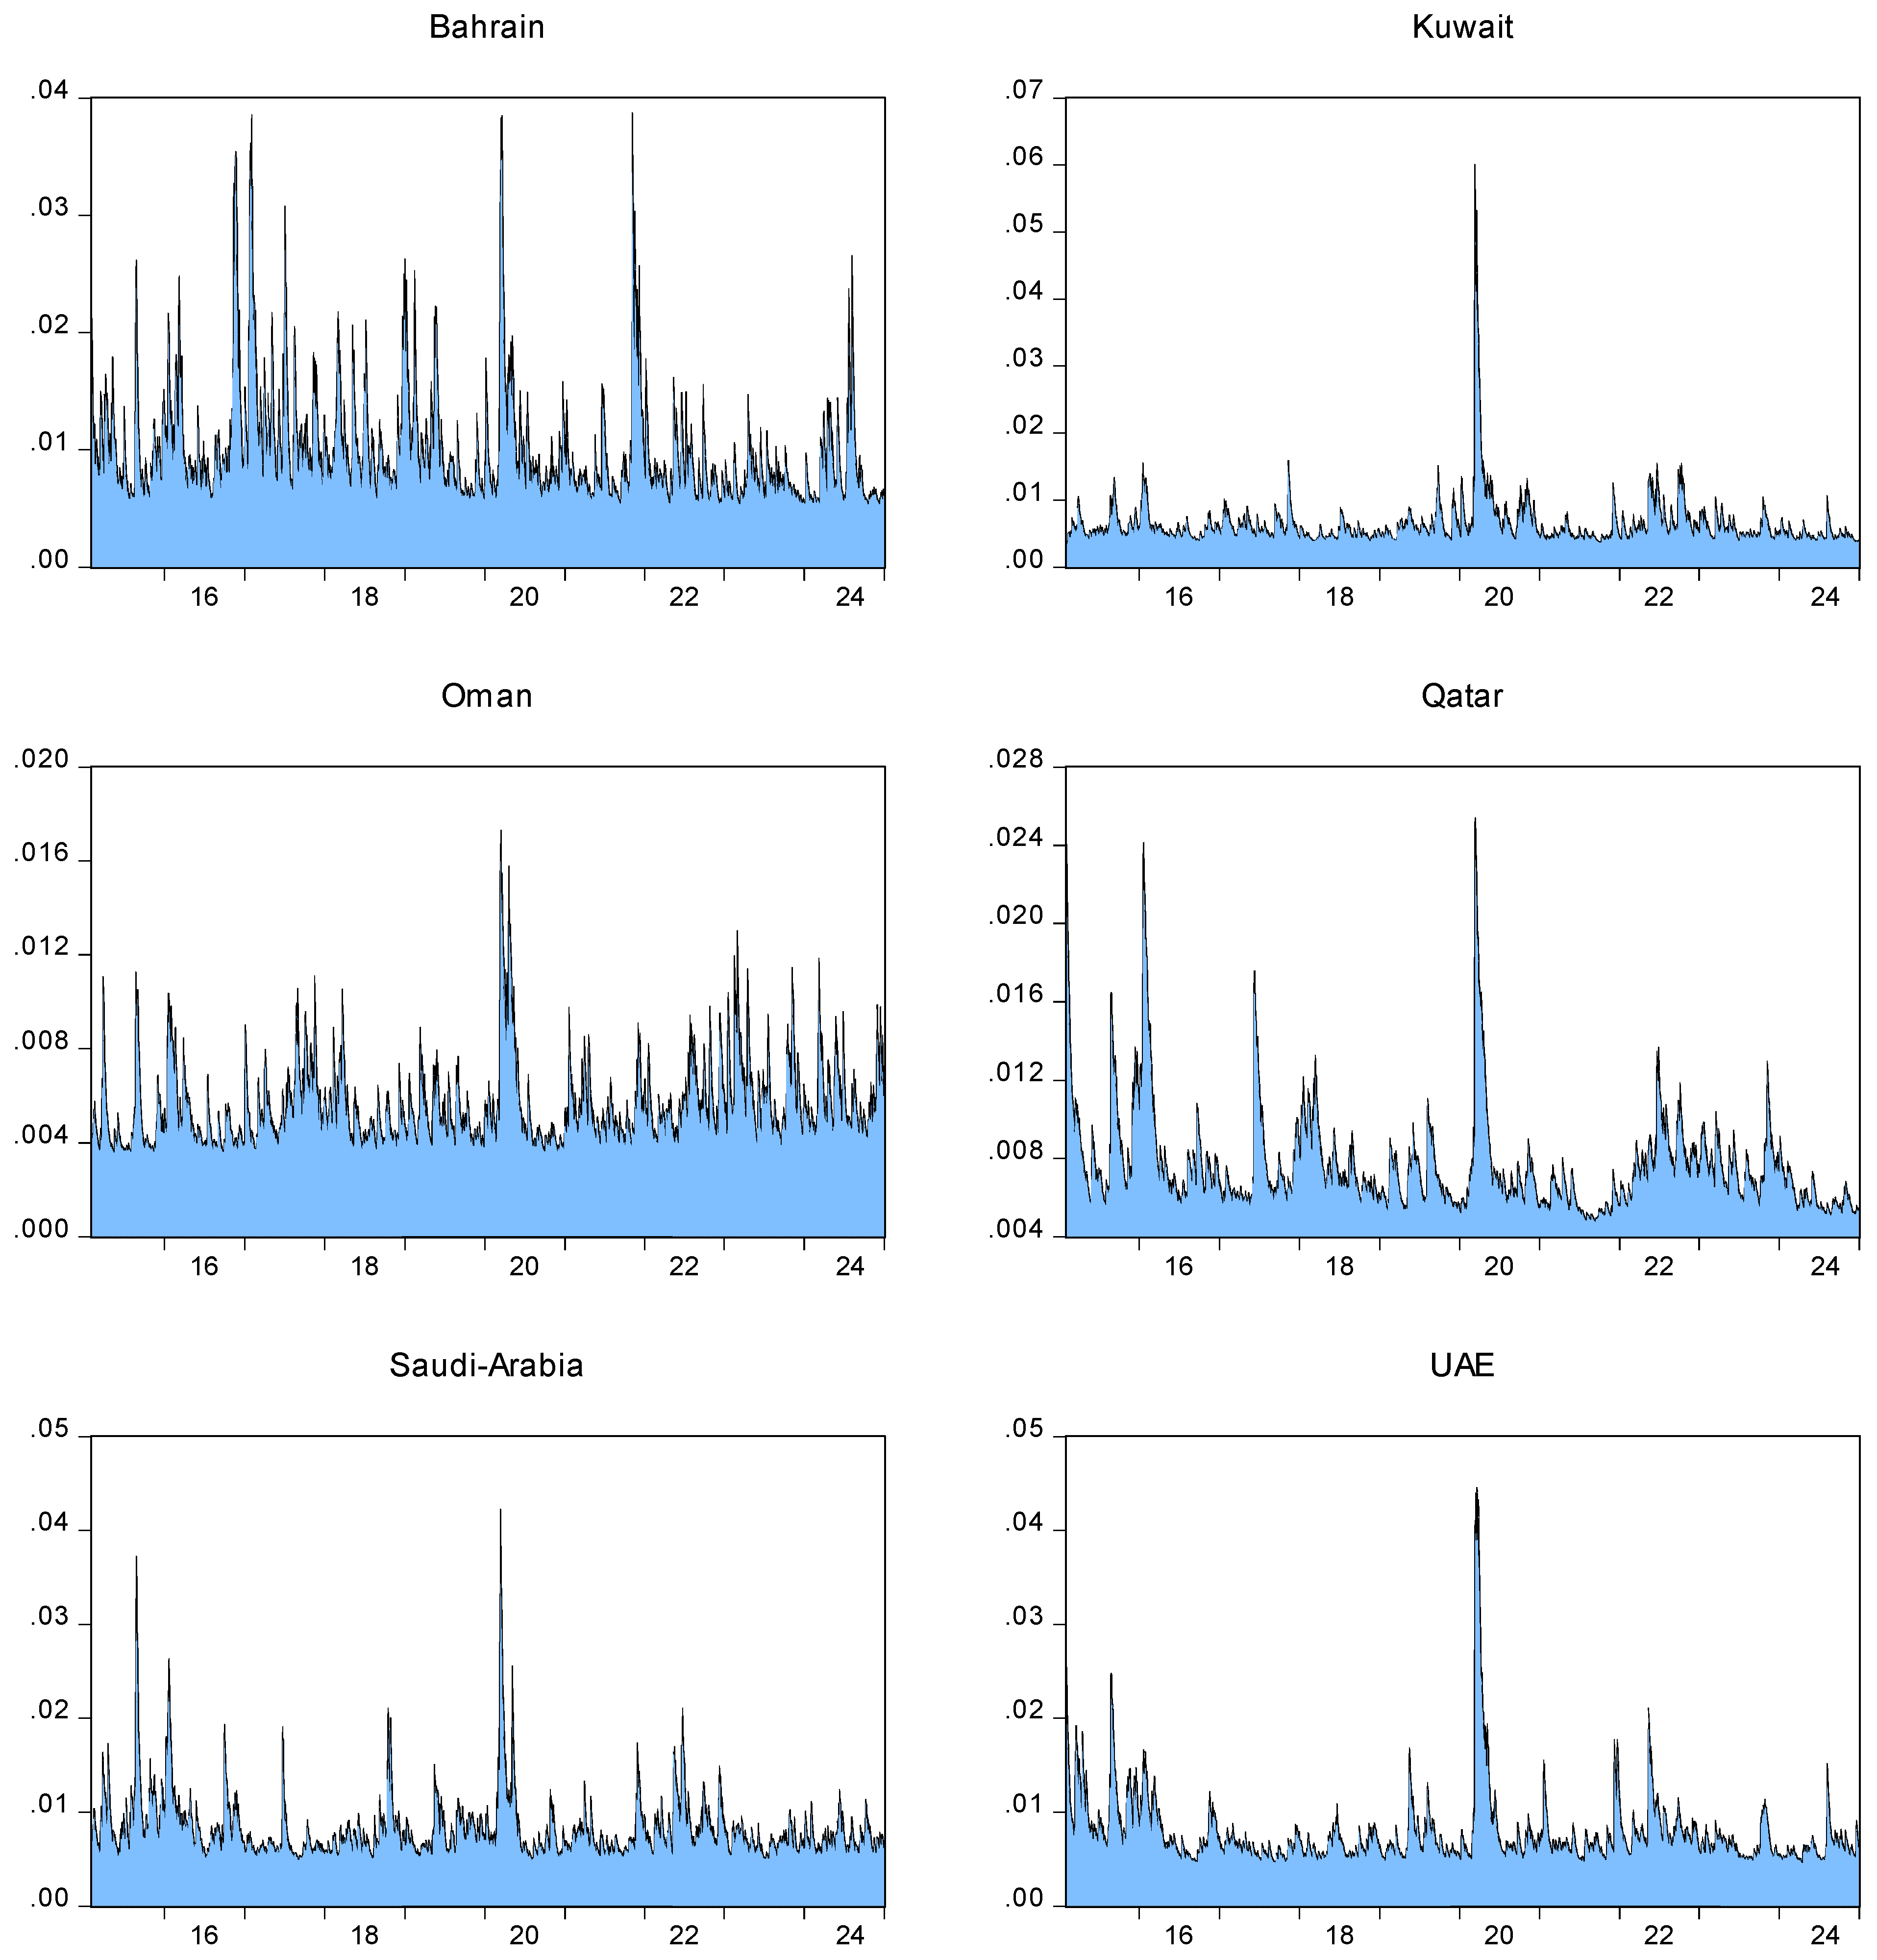
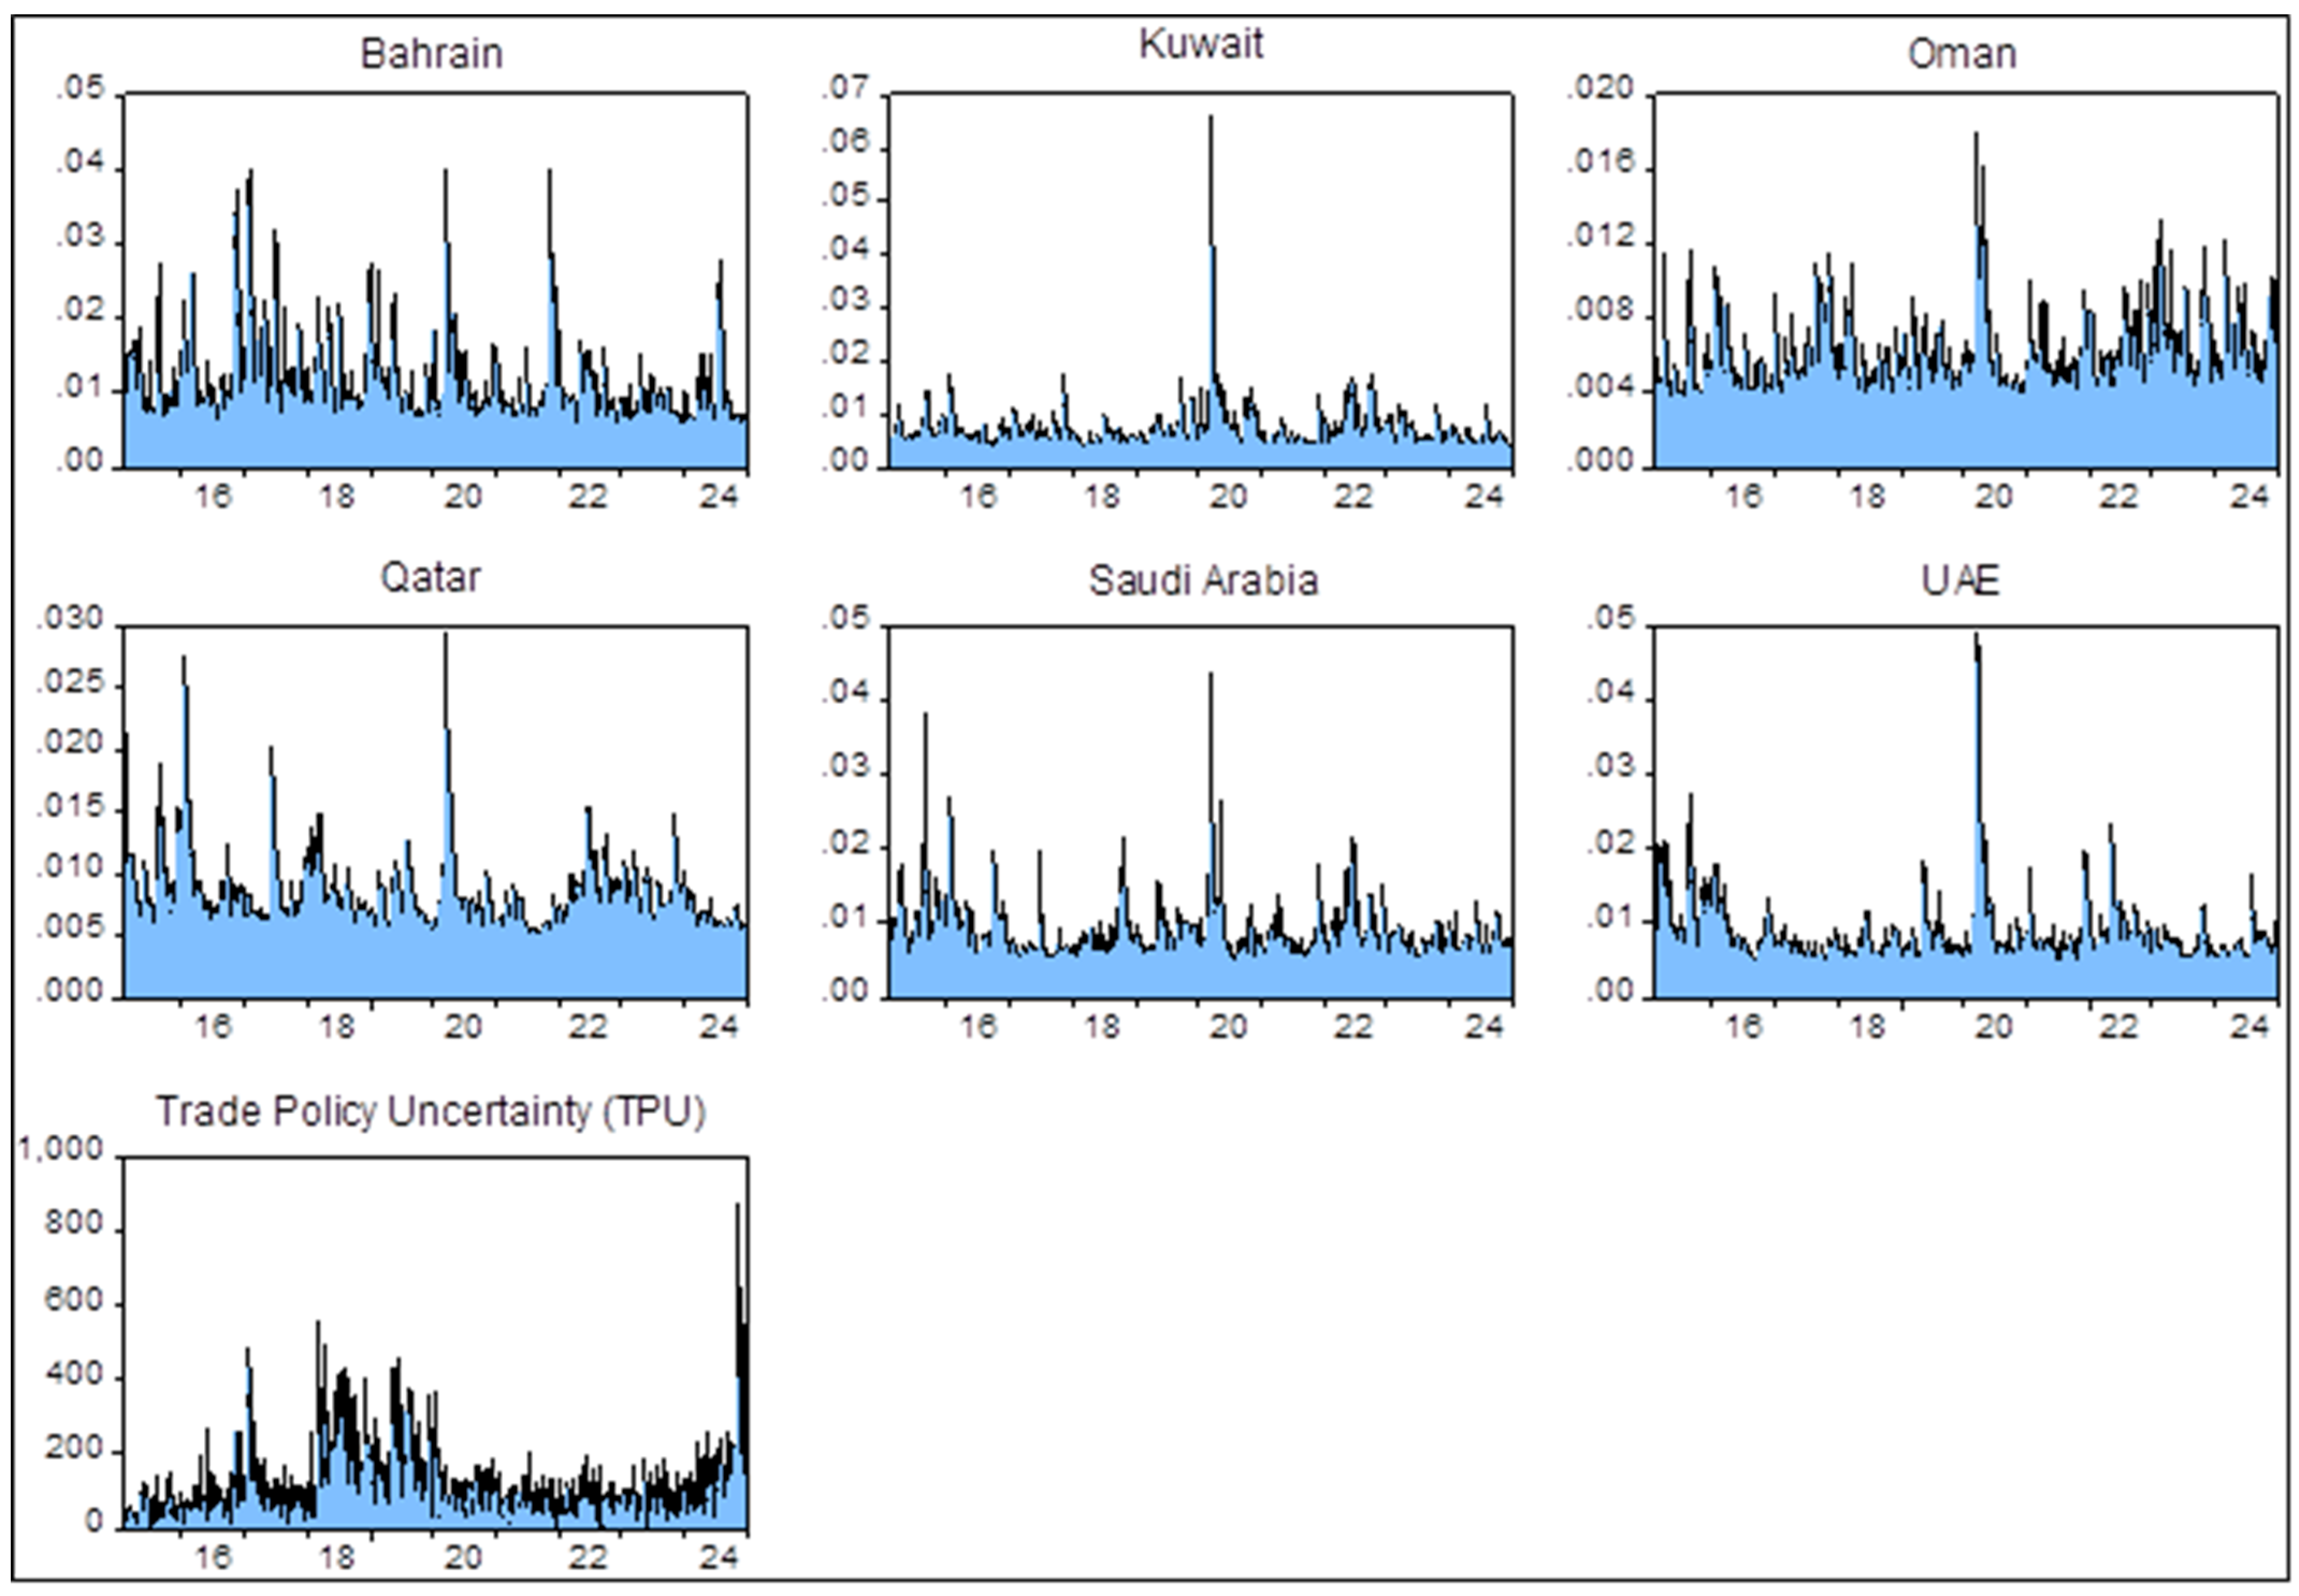
3.1. Data
3.2. Descriptive Statistics
4. Methodology
4.1. QVAR Model
4.2. QVAR with “Extended Joint” Connectedness Measure of Cunado et al. (2023)
4.3. Frequency-Domain QVAR of Chatziantoniou et al. (2022) for Short- and Long-Term Connectedness Under Extreme and Medium Market Conditions
5. Results with Practical Implications
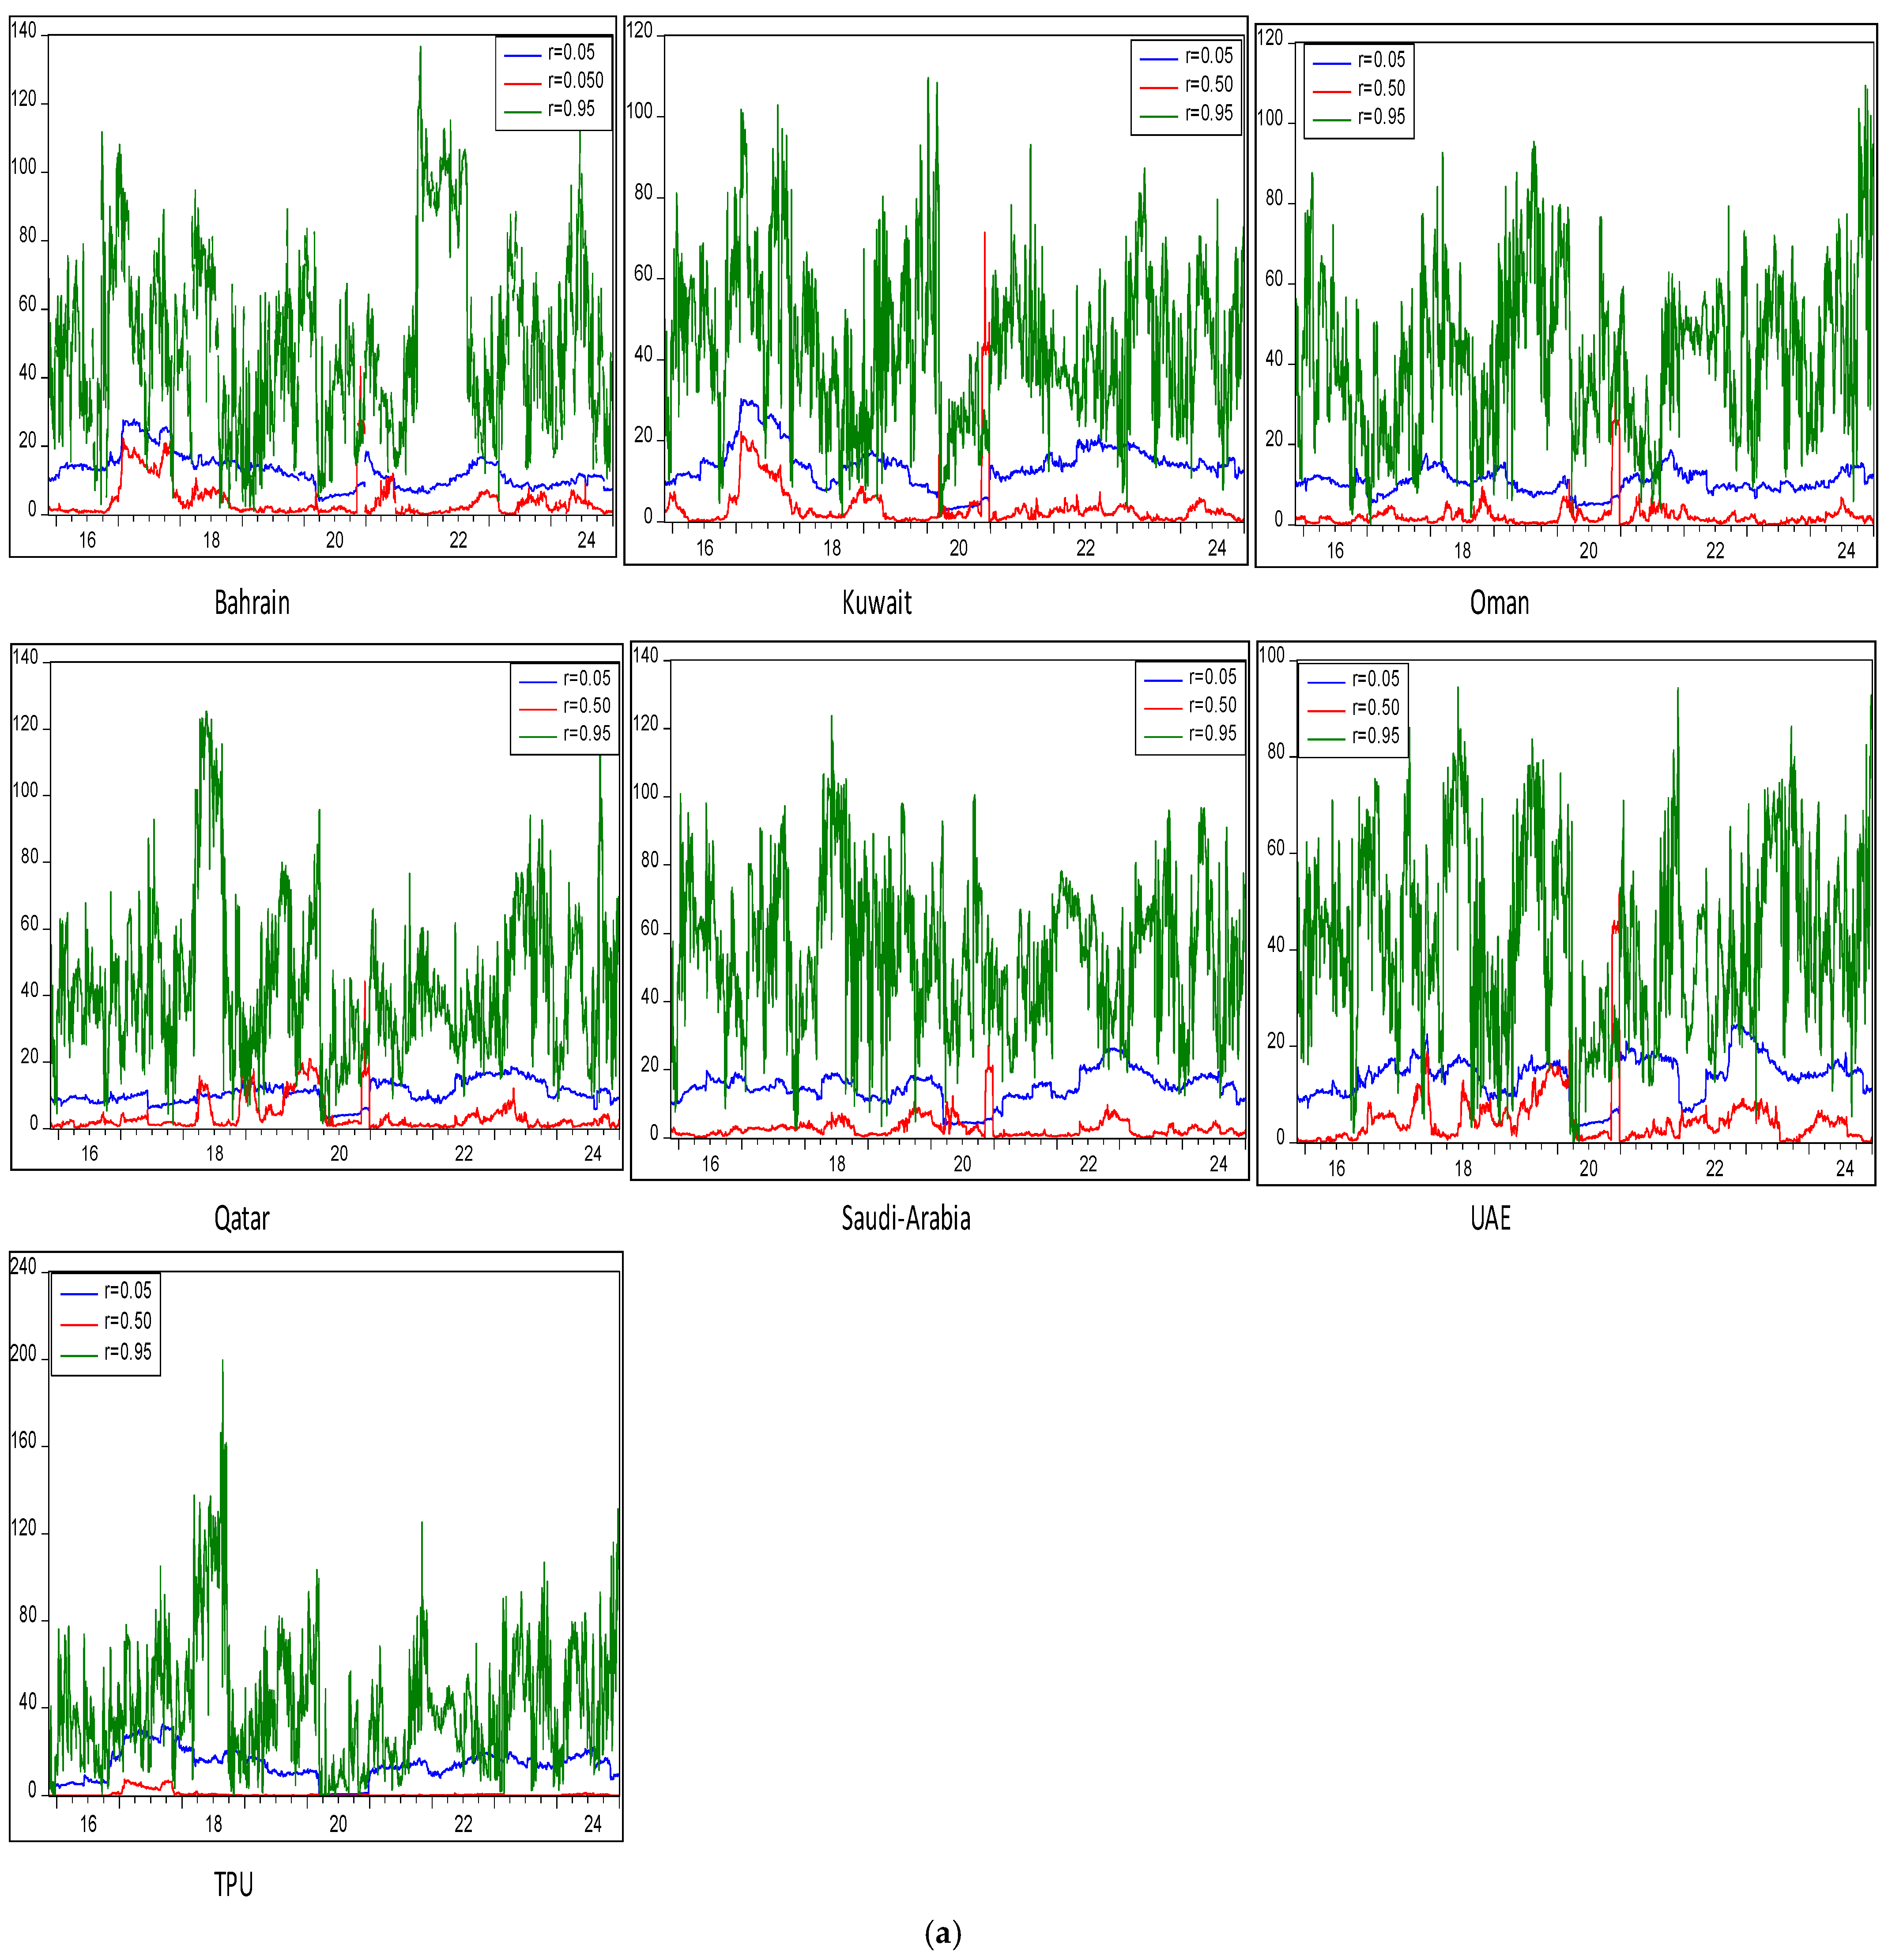
5.1. Analysis of Overall Time Domain QVAR Extended Joint Connectedness Between TPU and GCC Islamic Financial Market Volatility
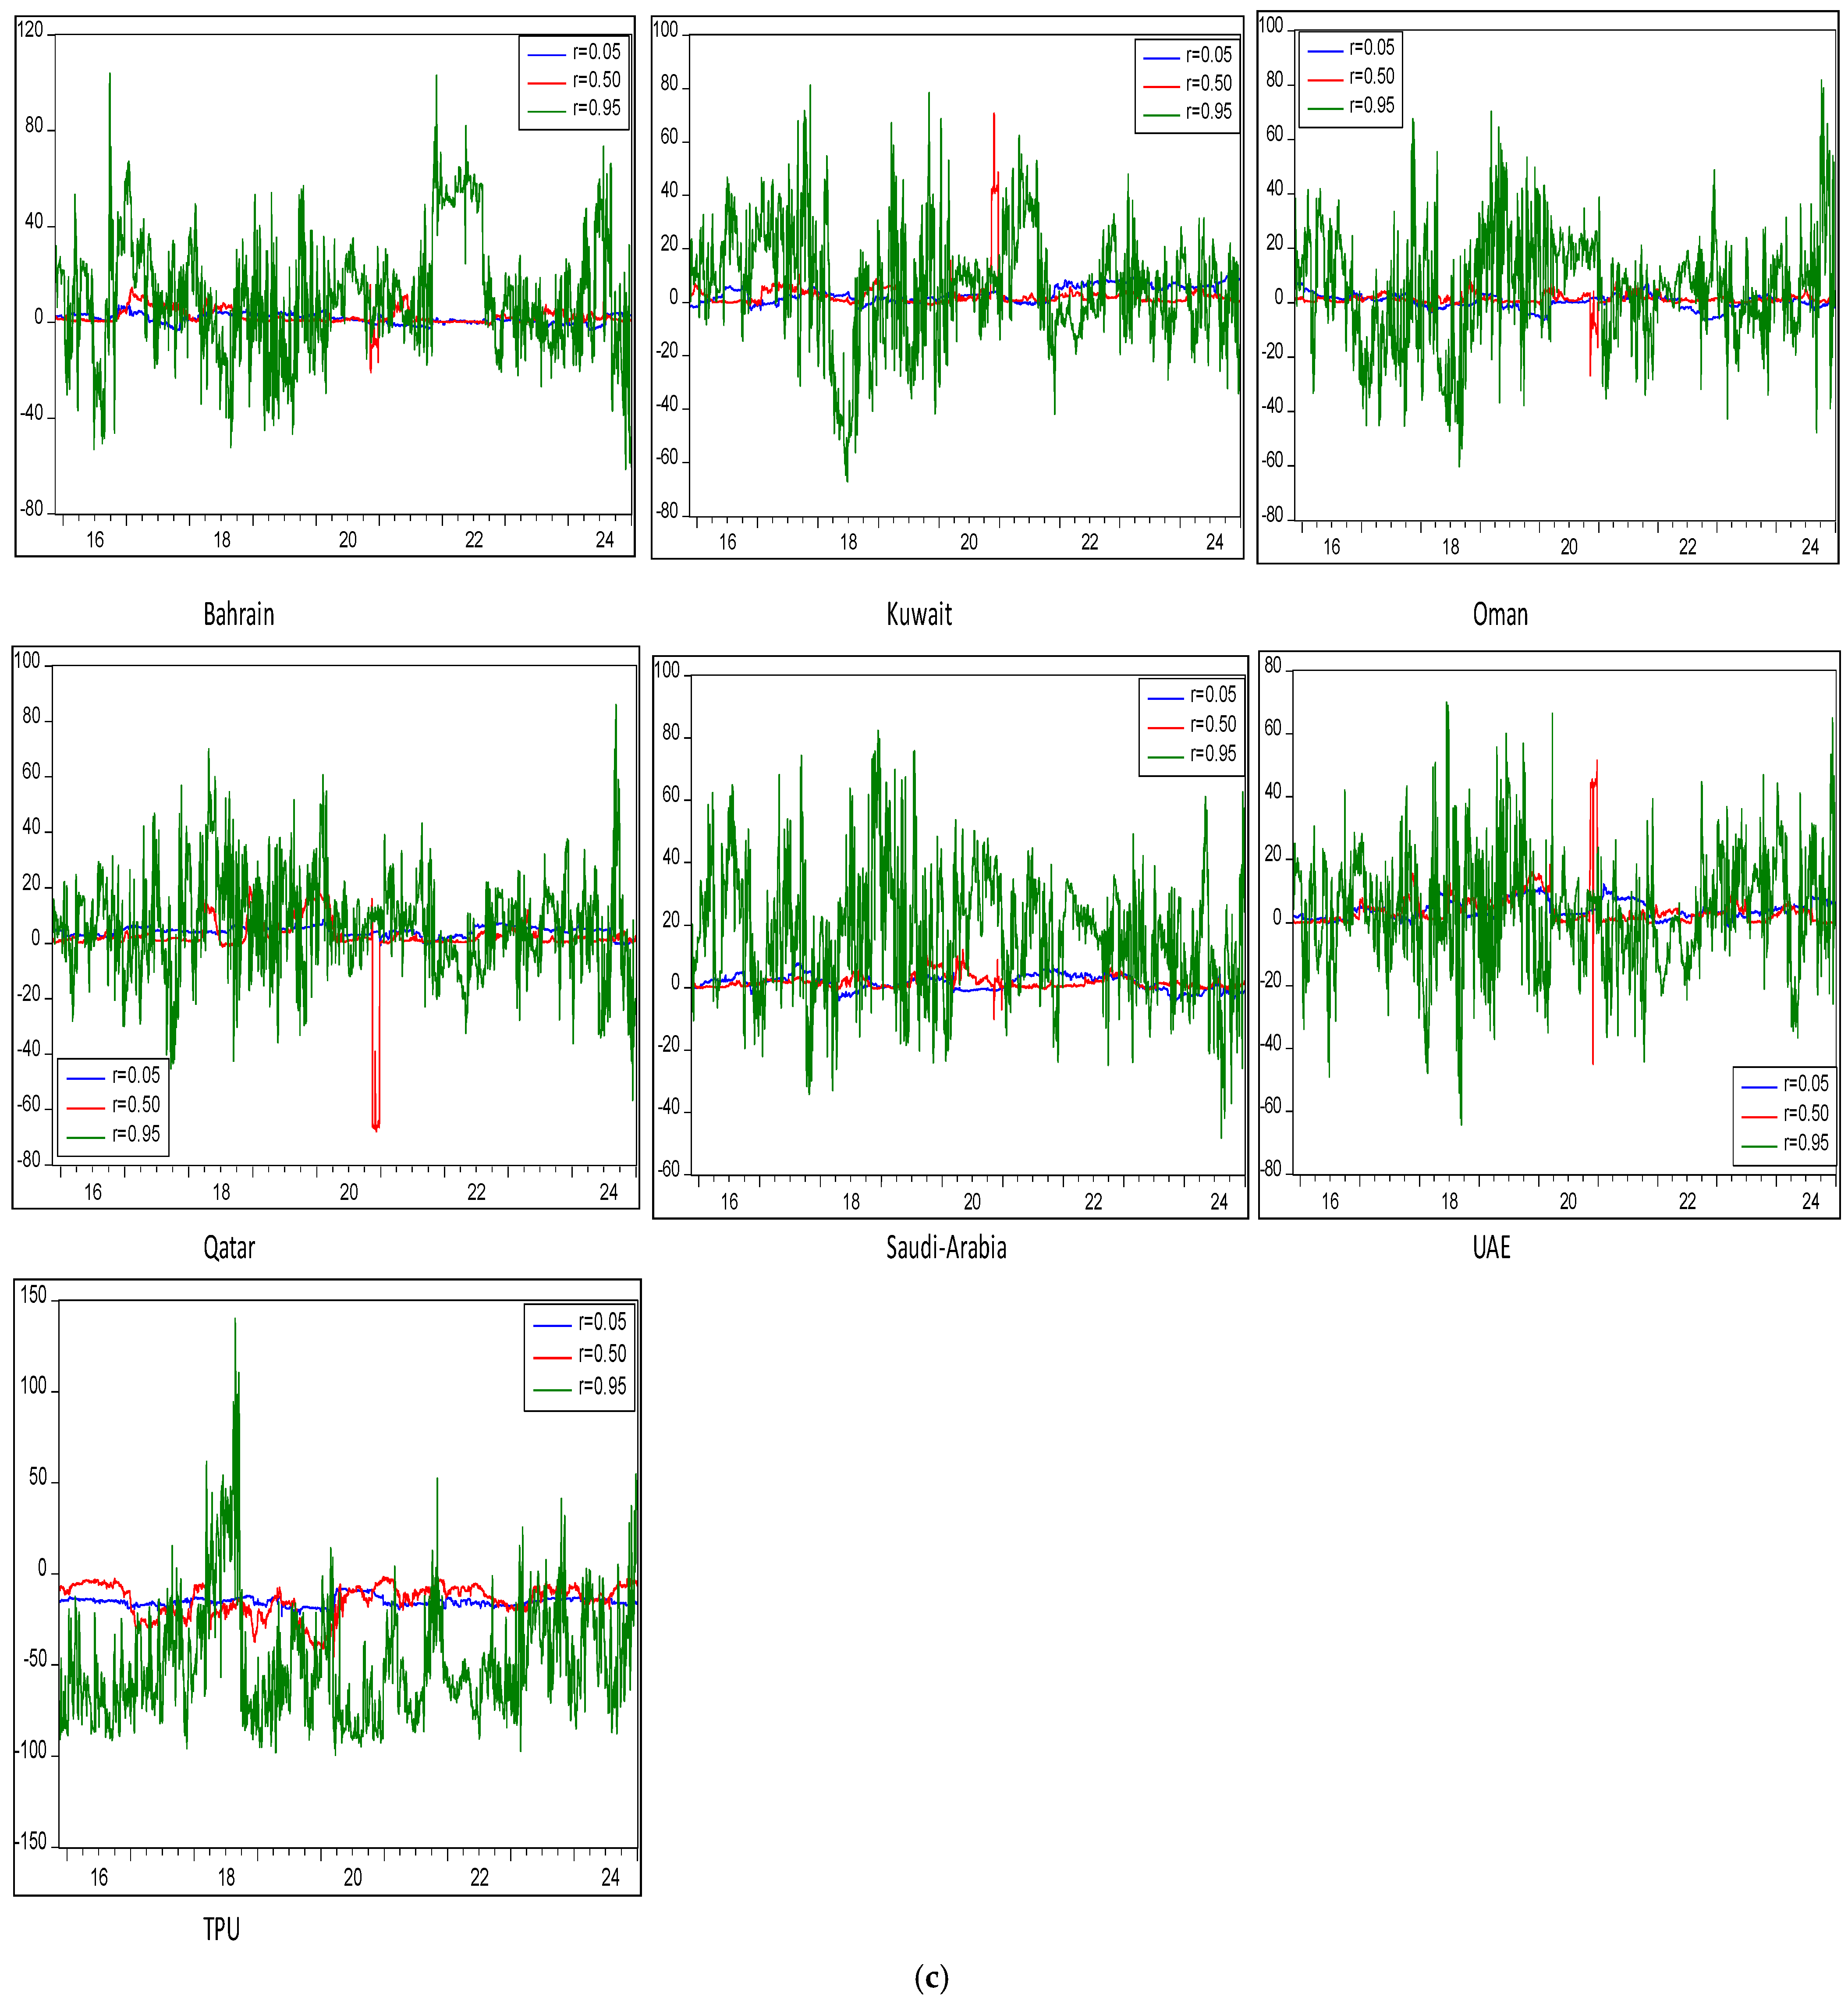
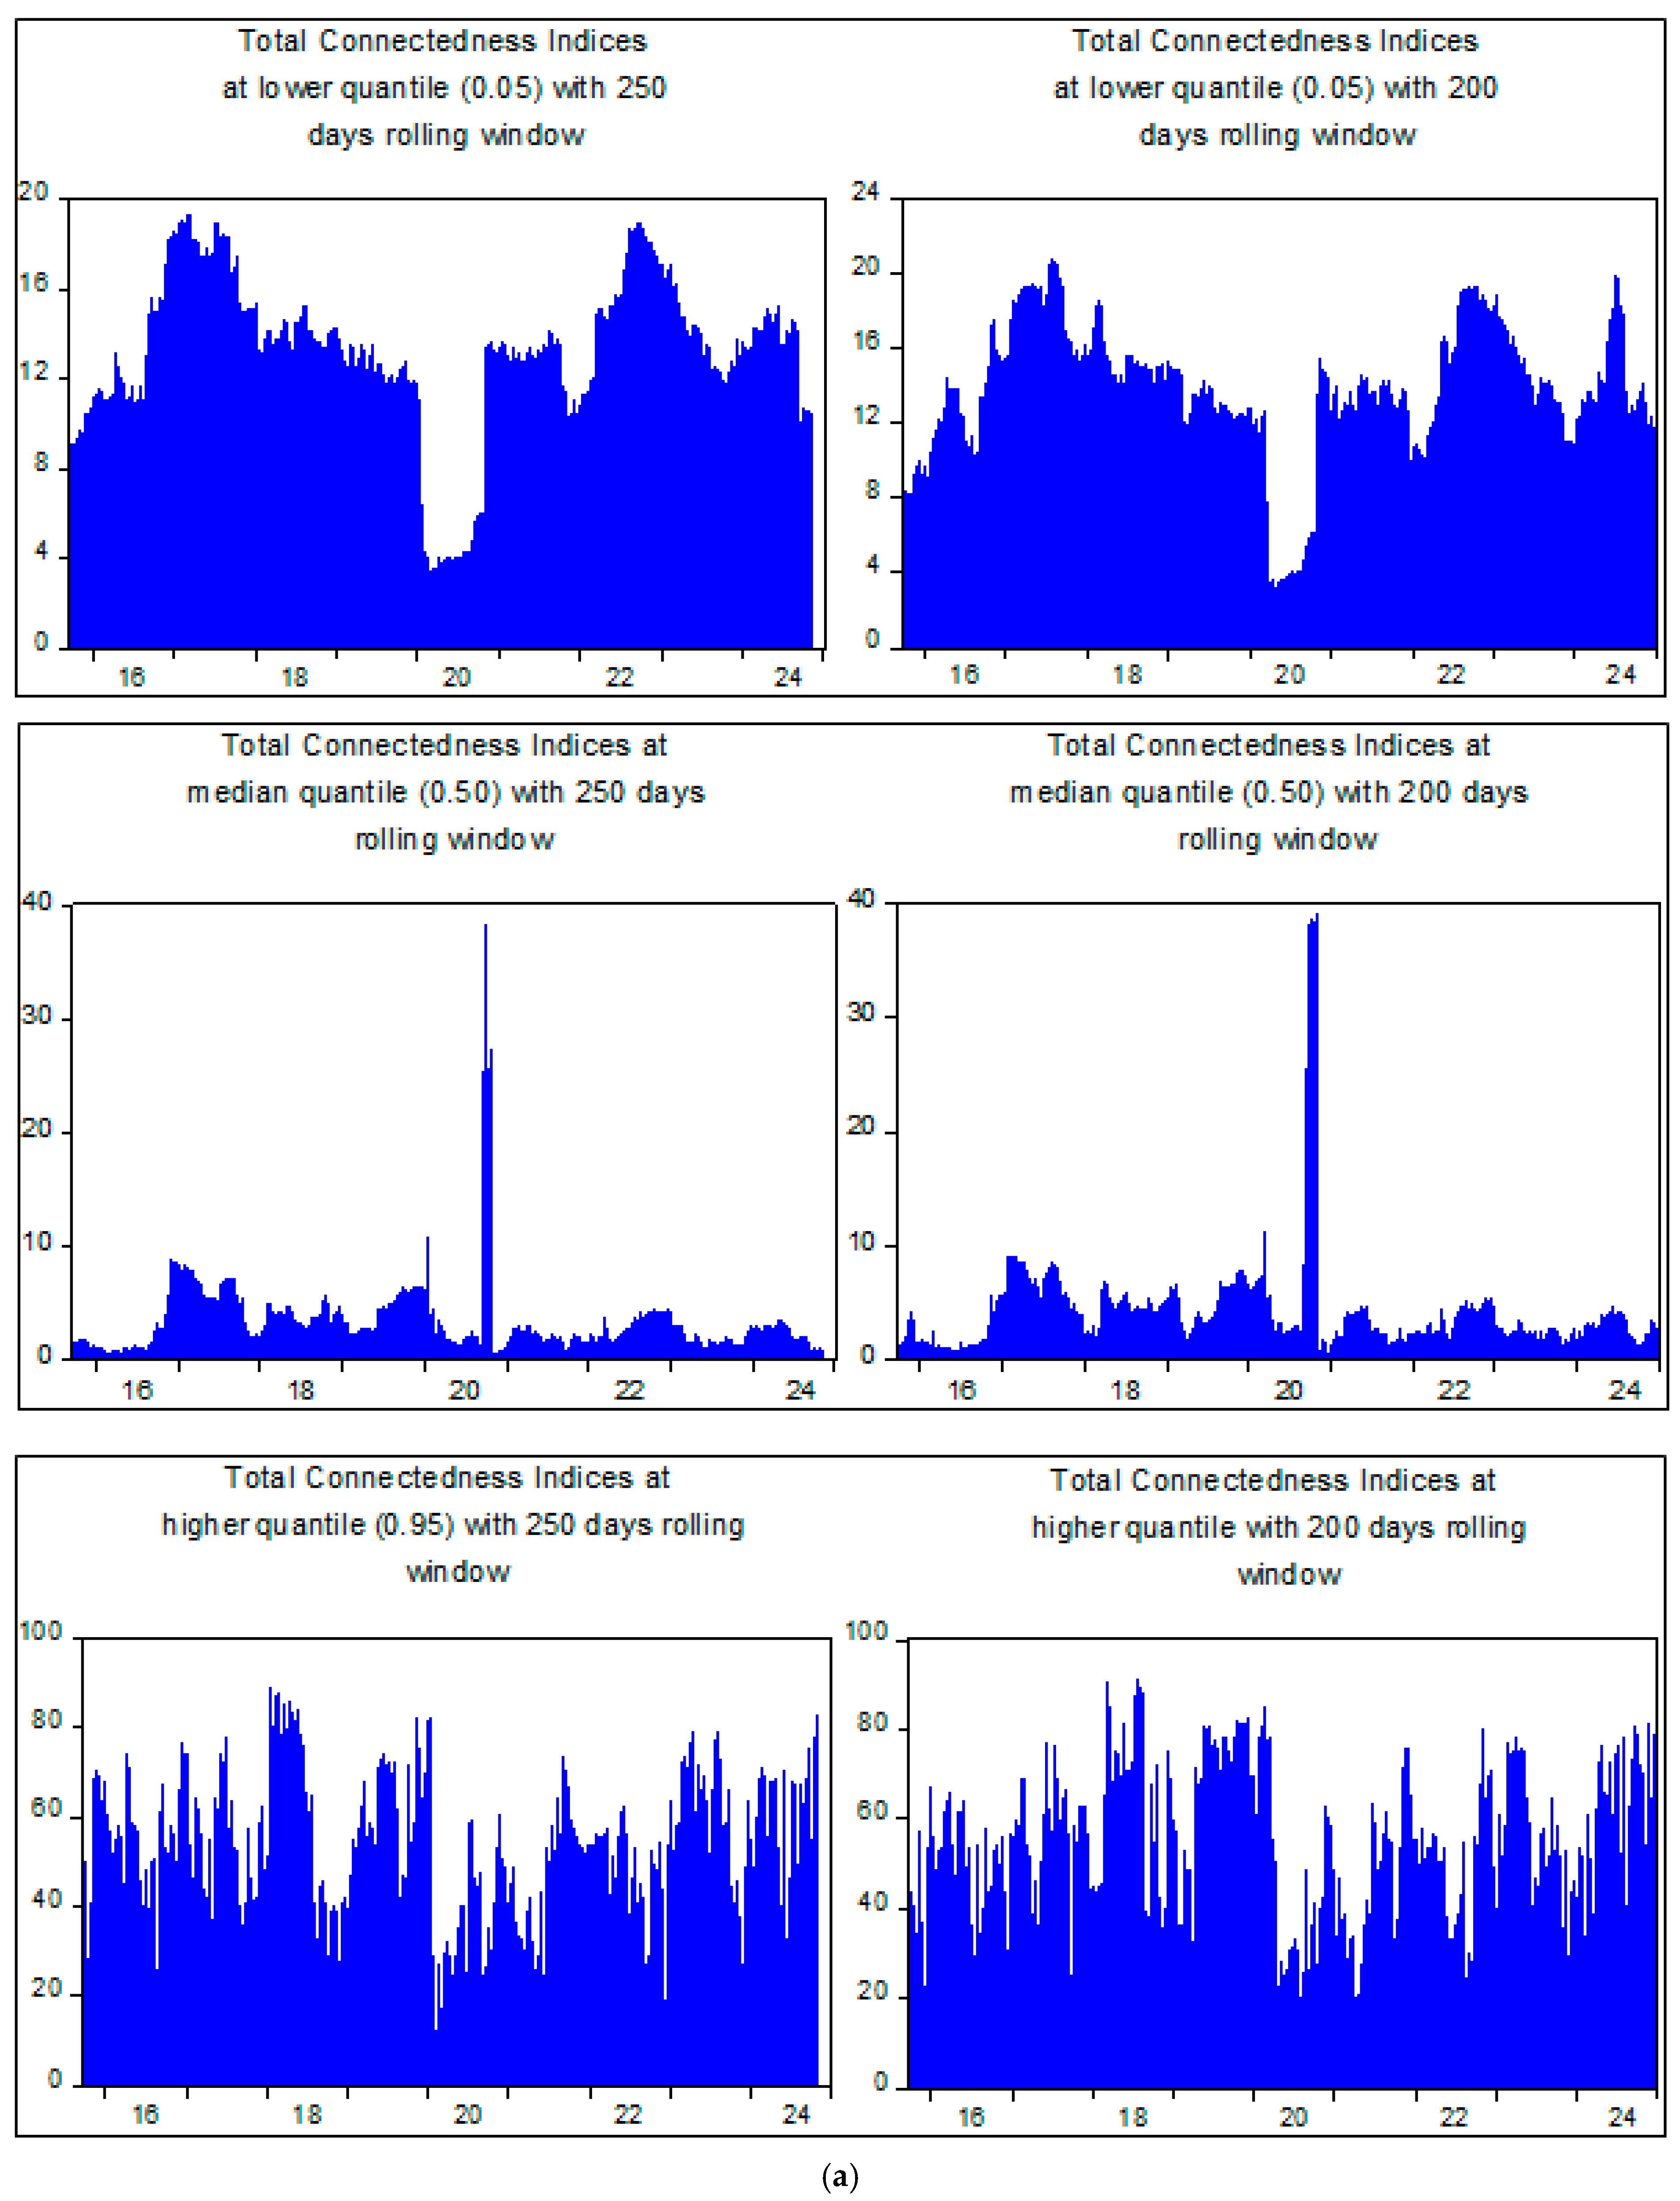
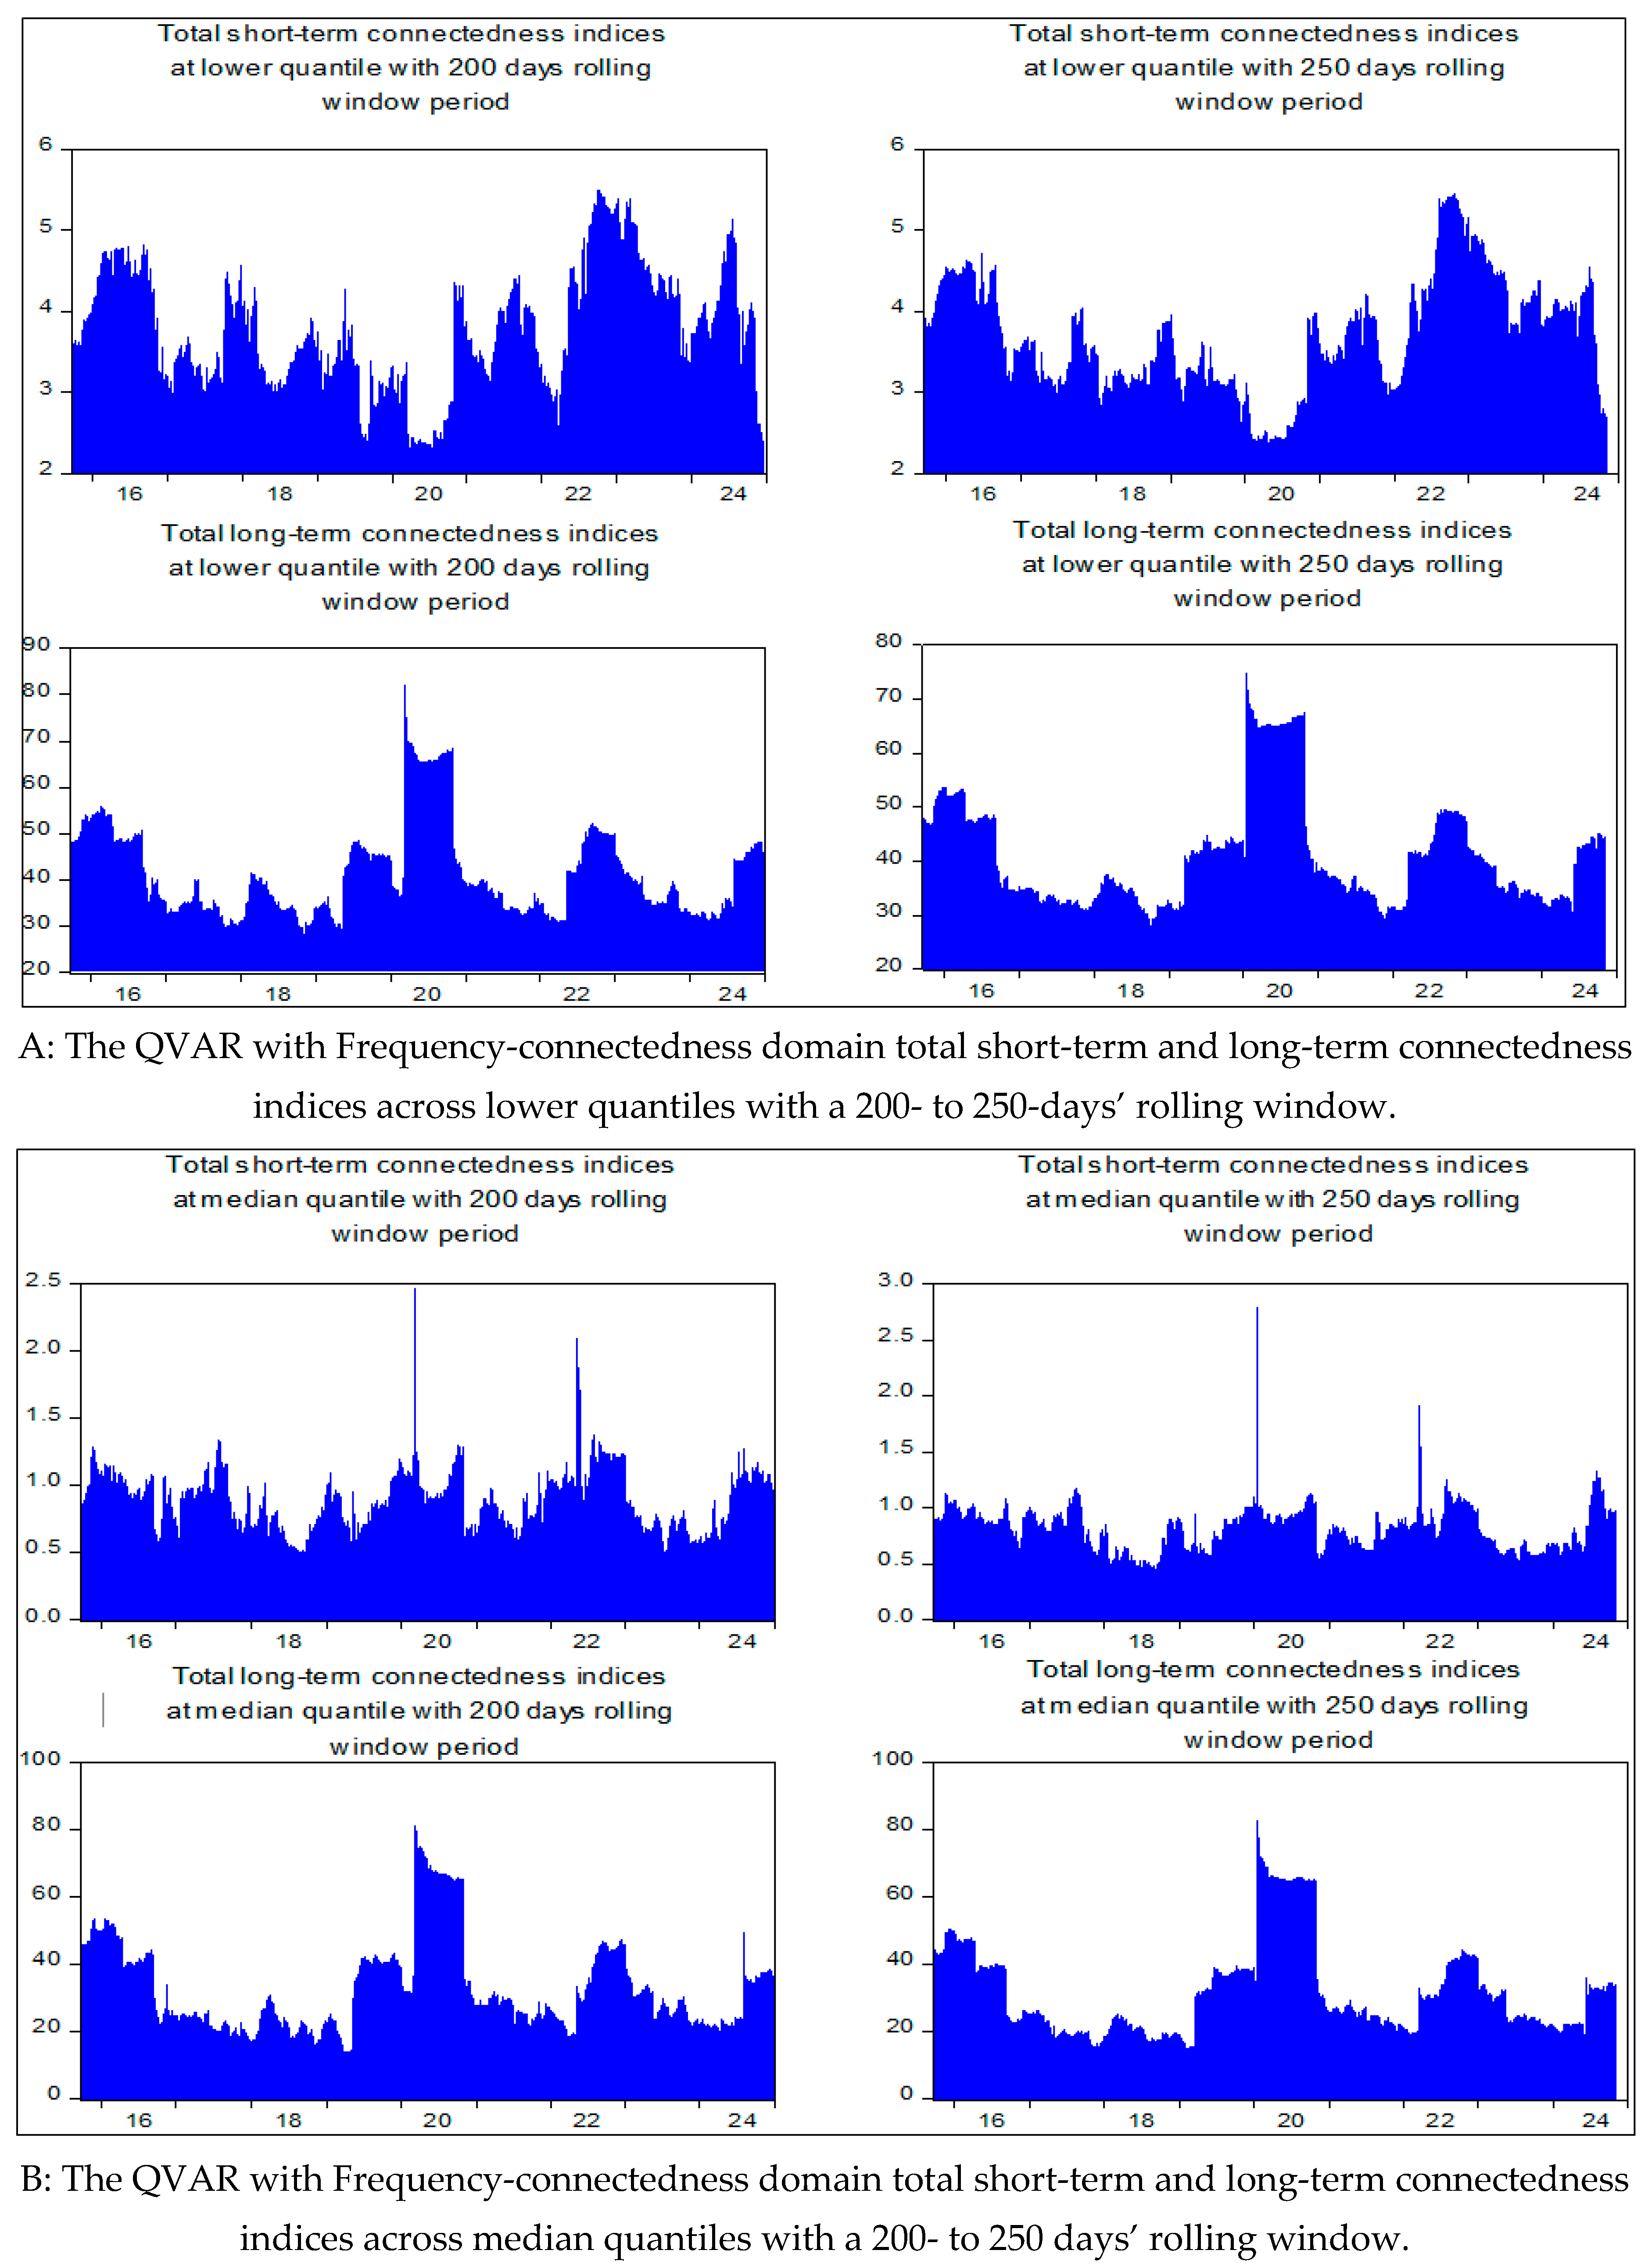
5.2. Sensitivity and Robustness Analysis for the QVAR with “Extended Joint” Connectedness Approach
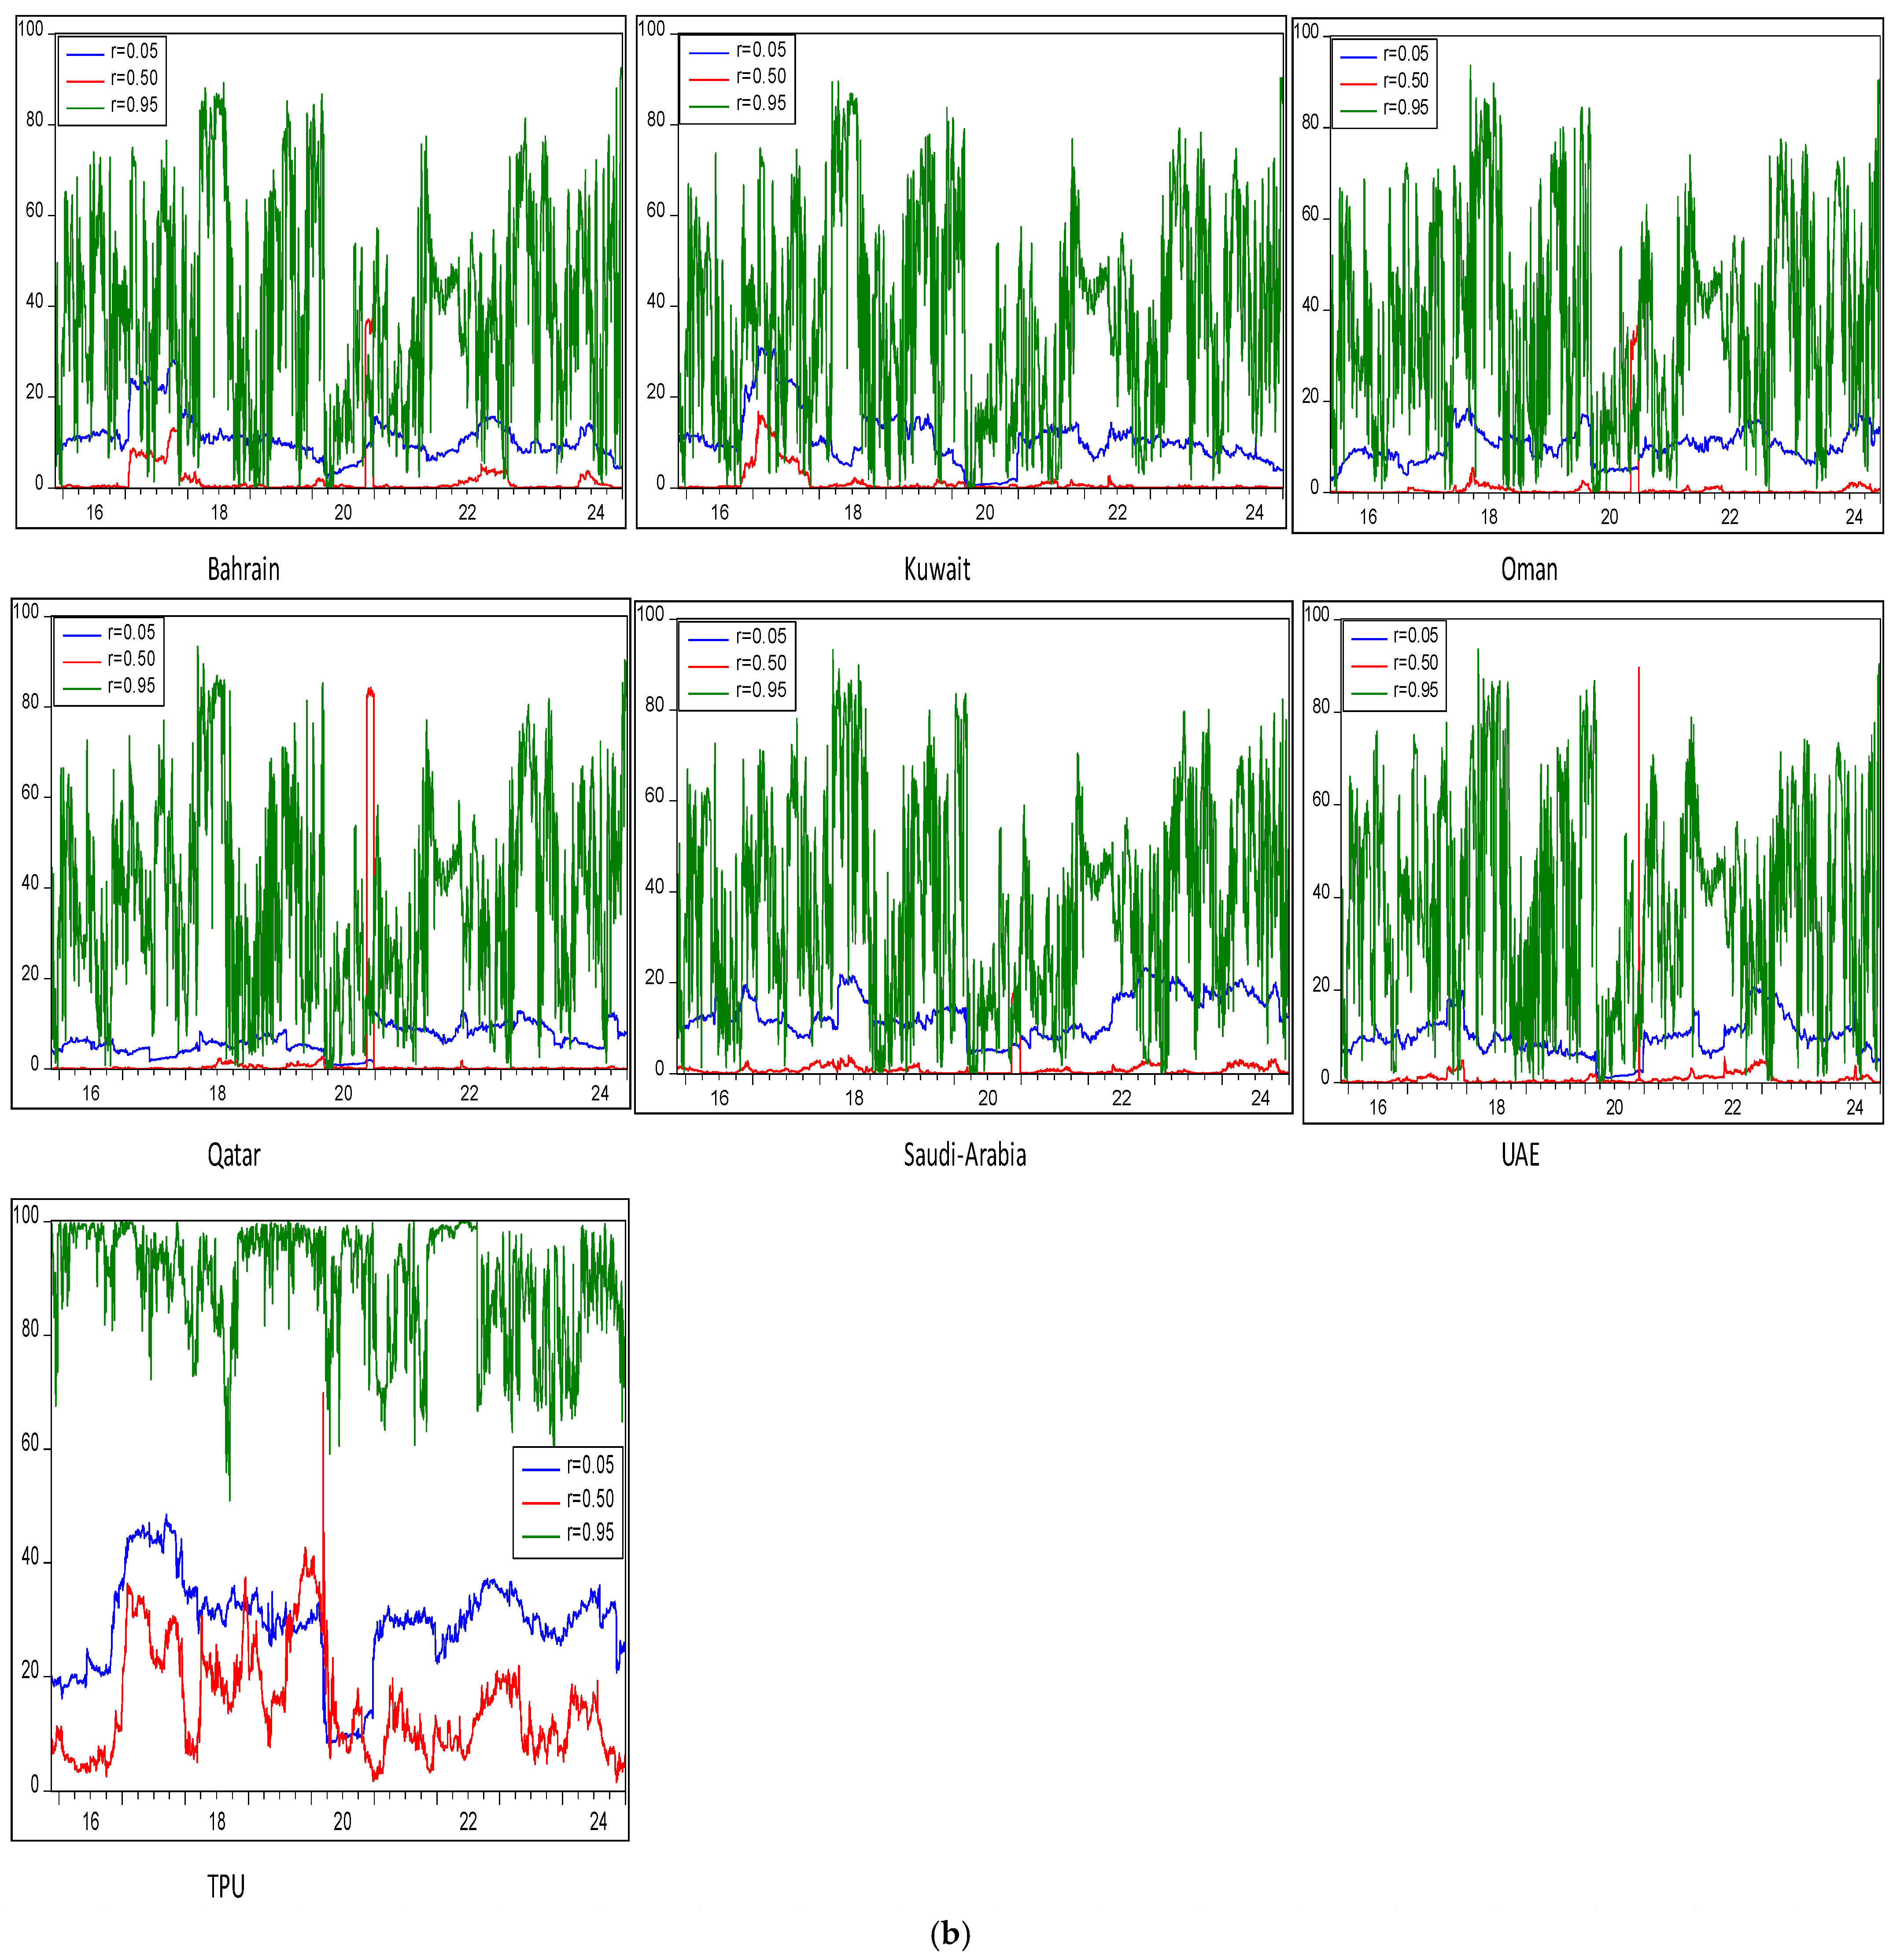
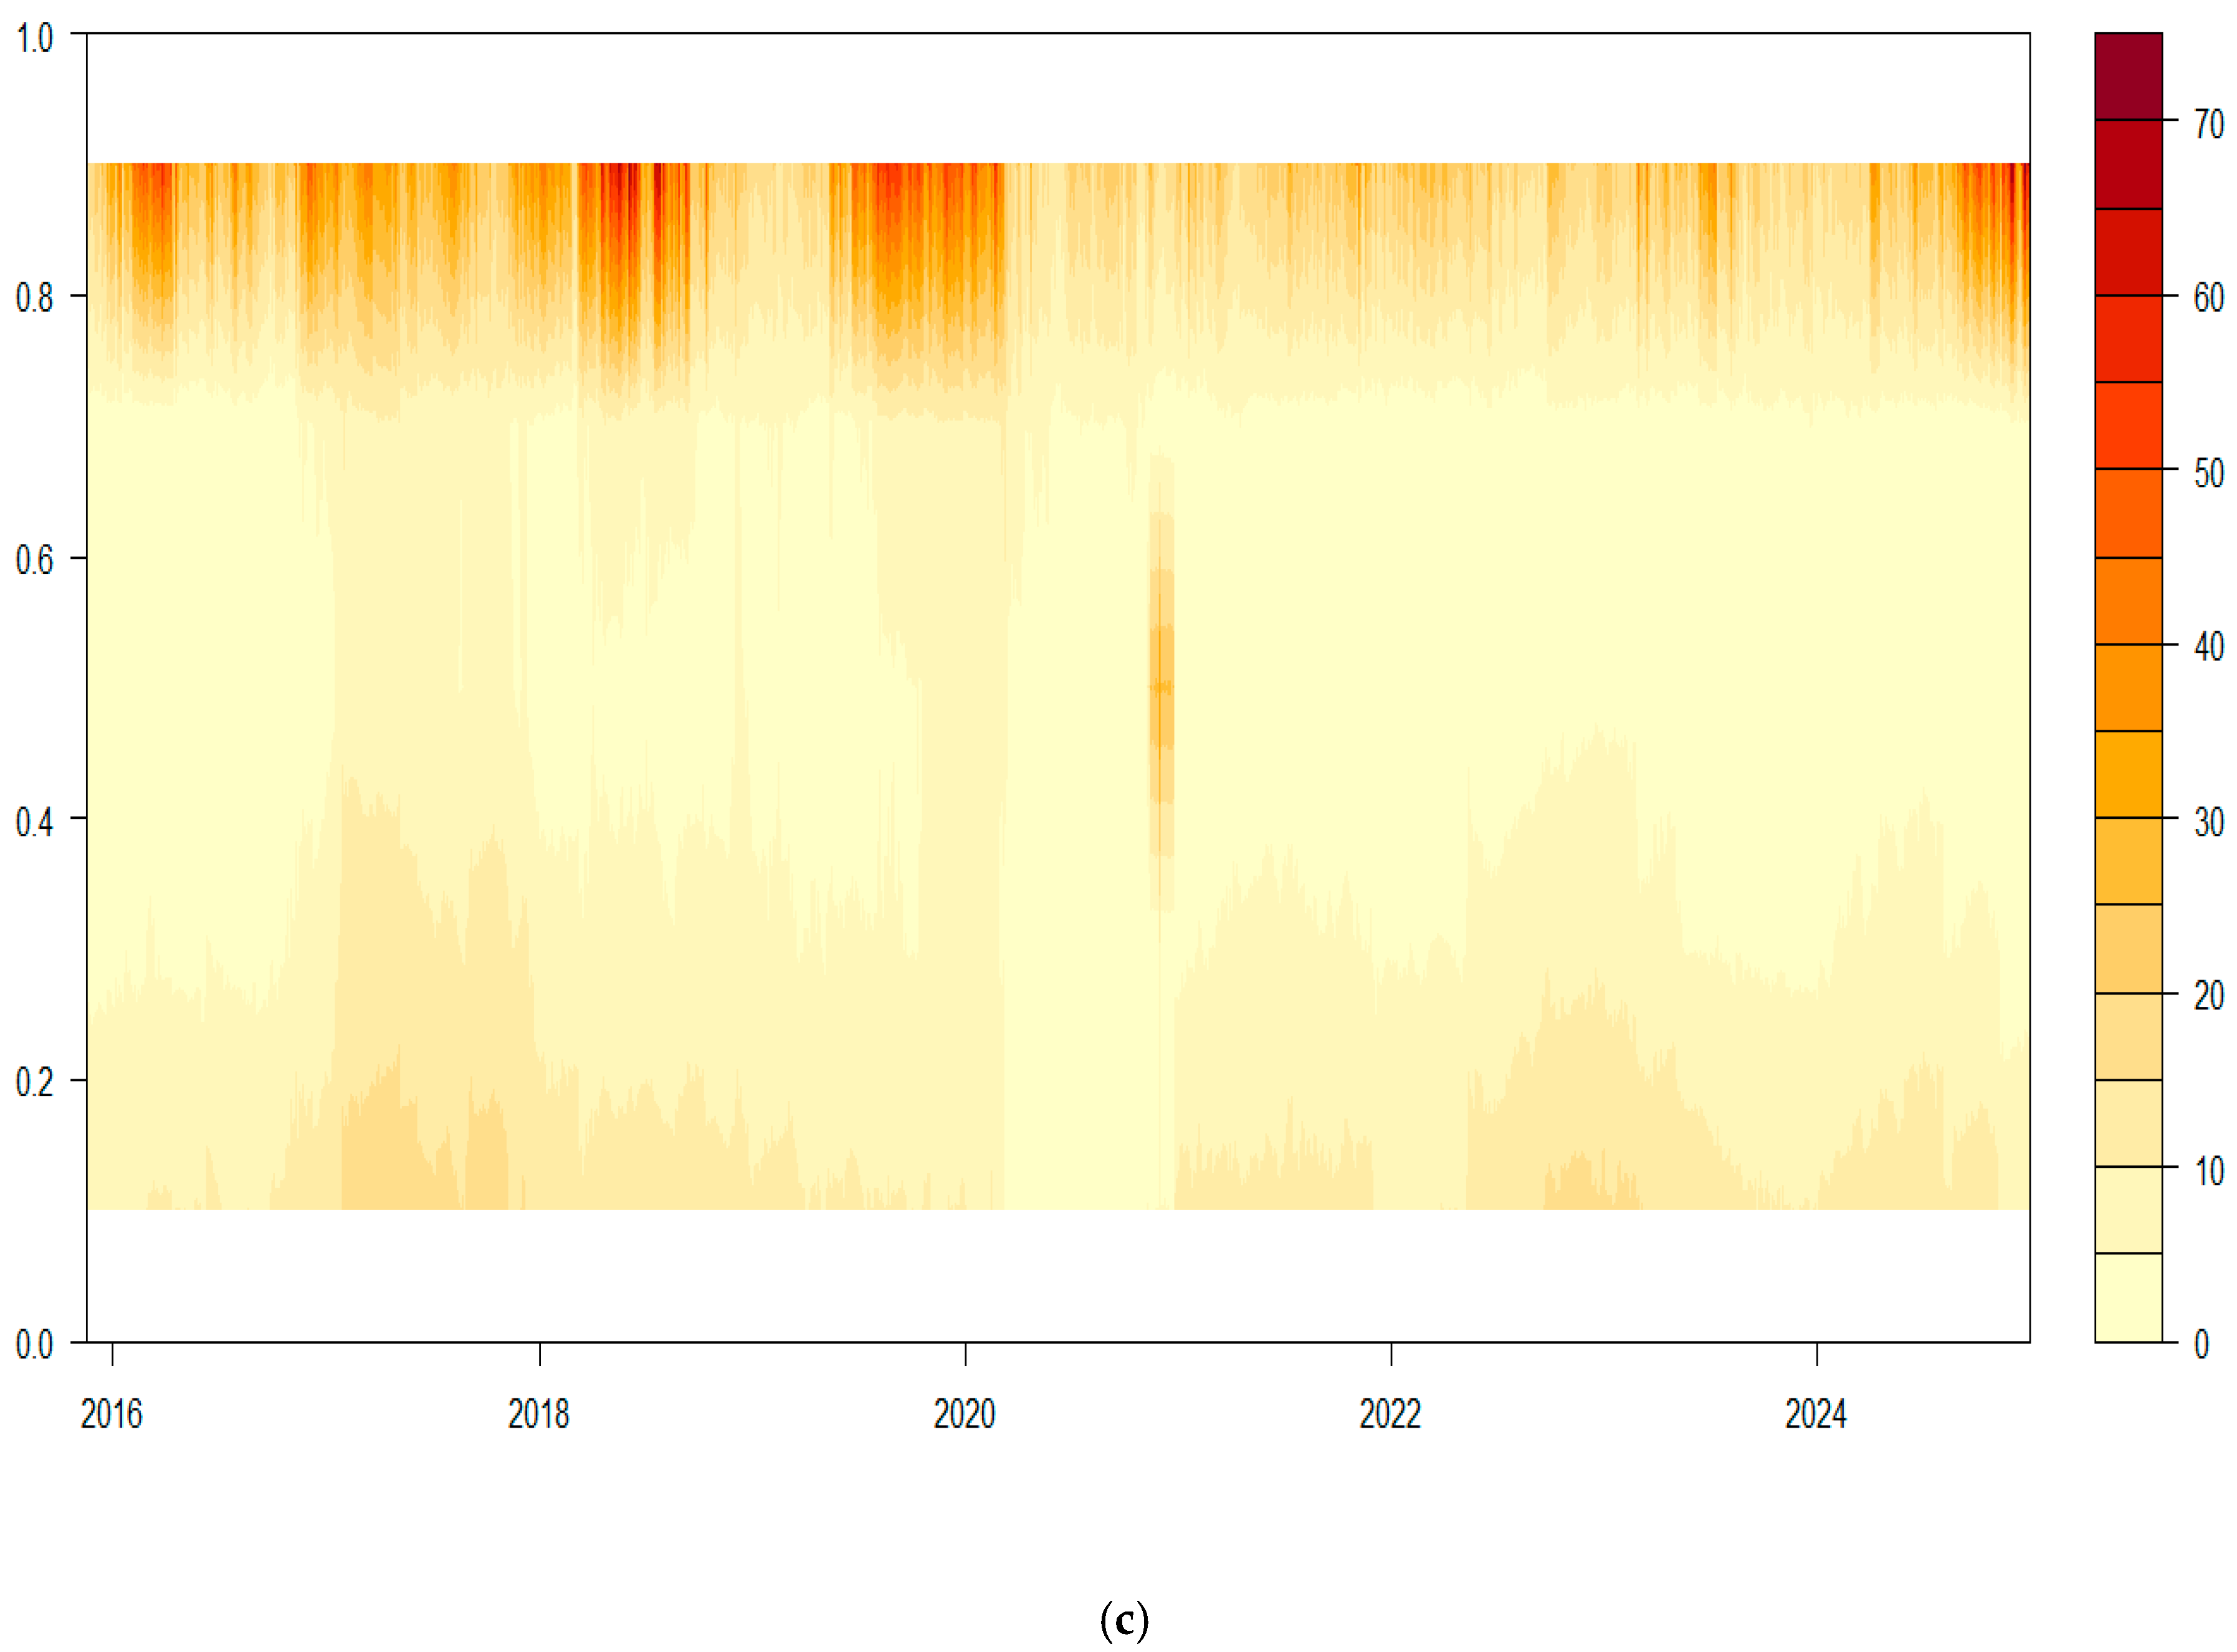
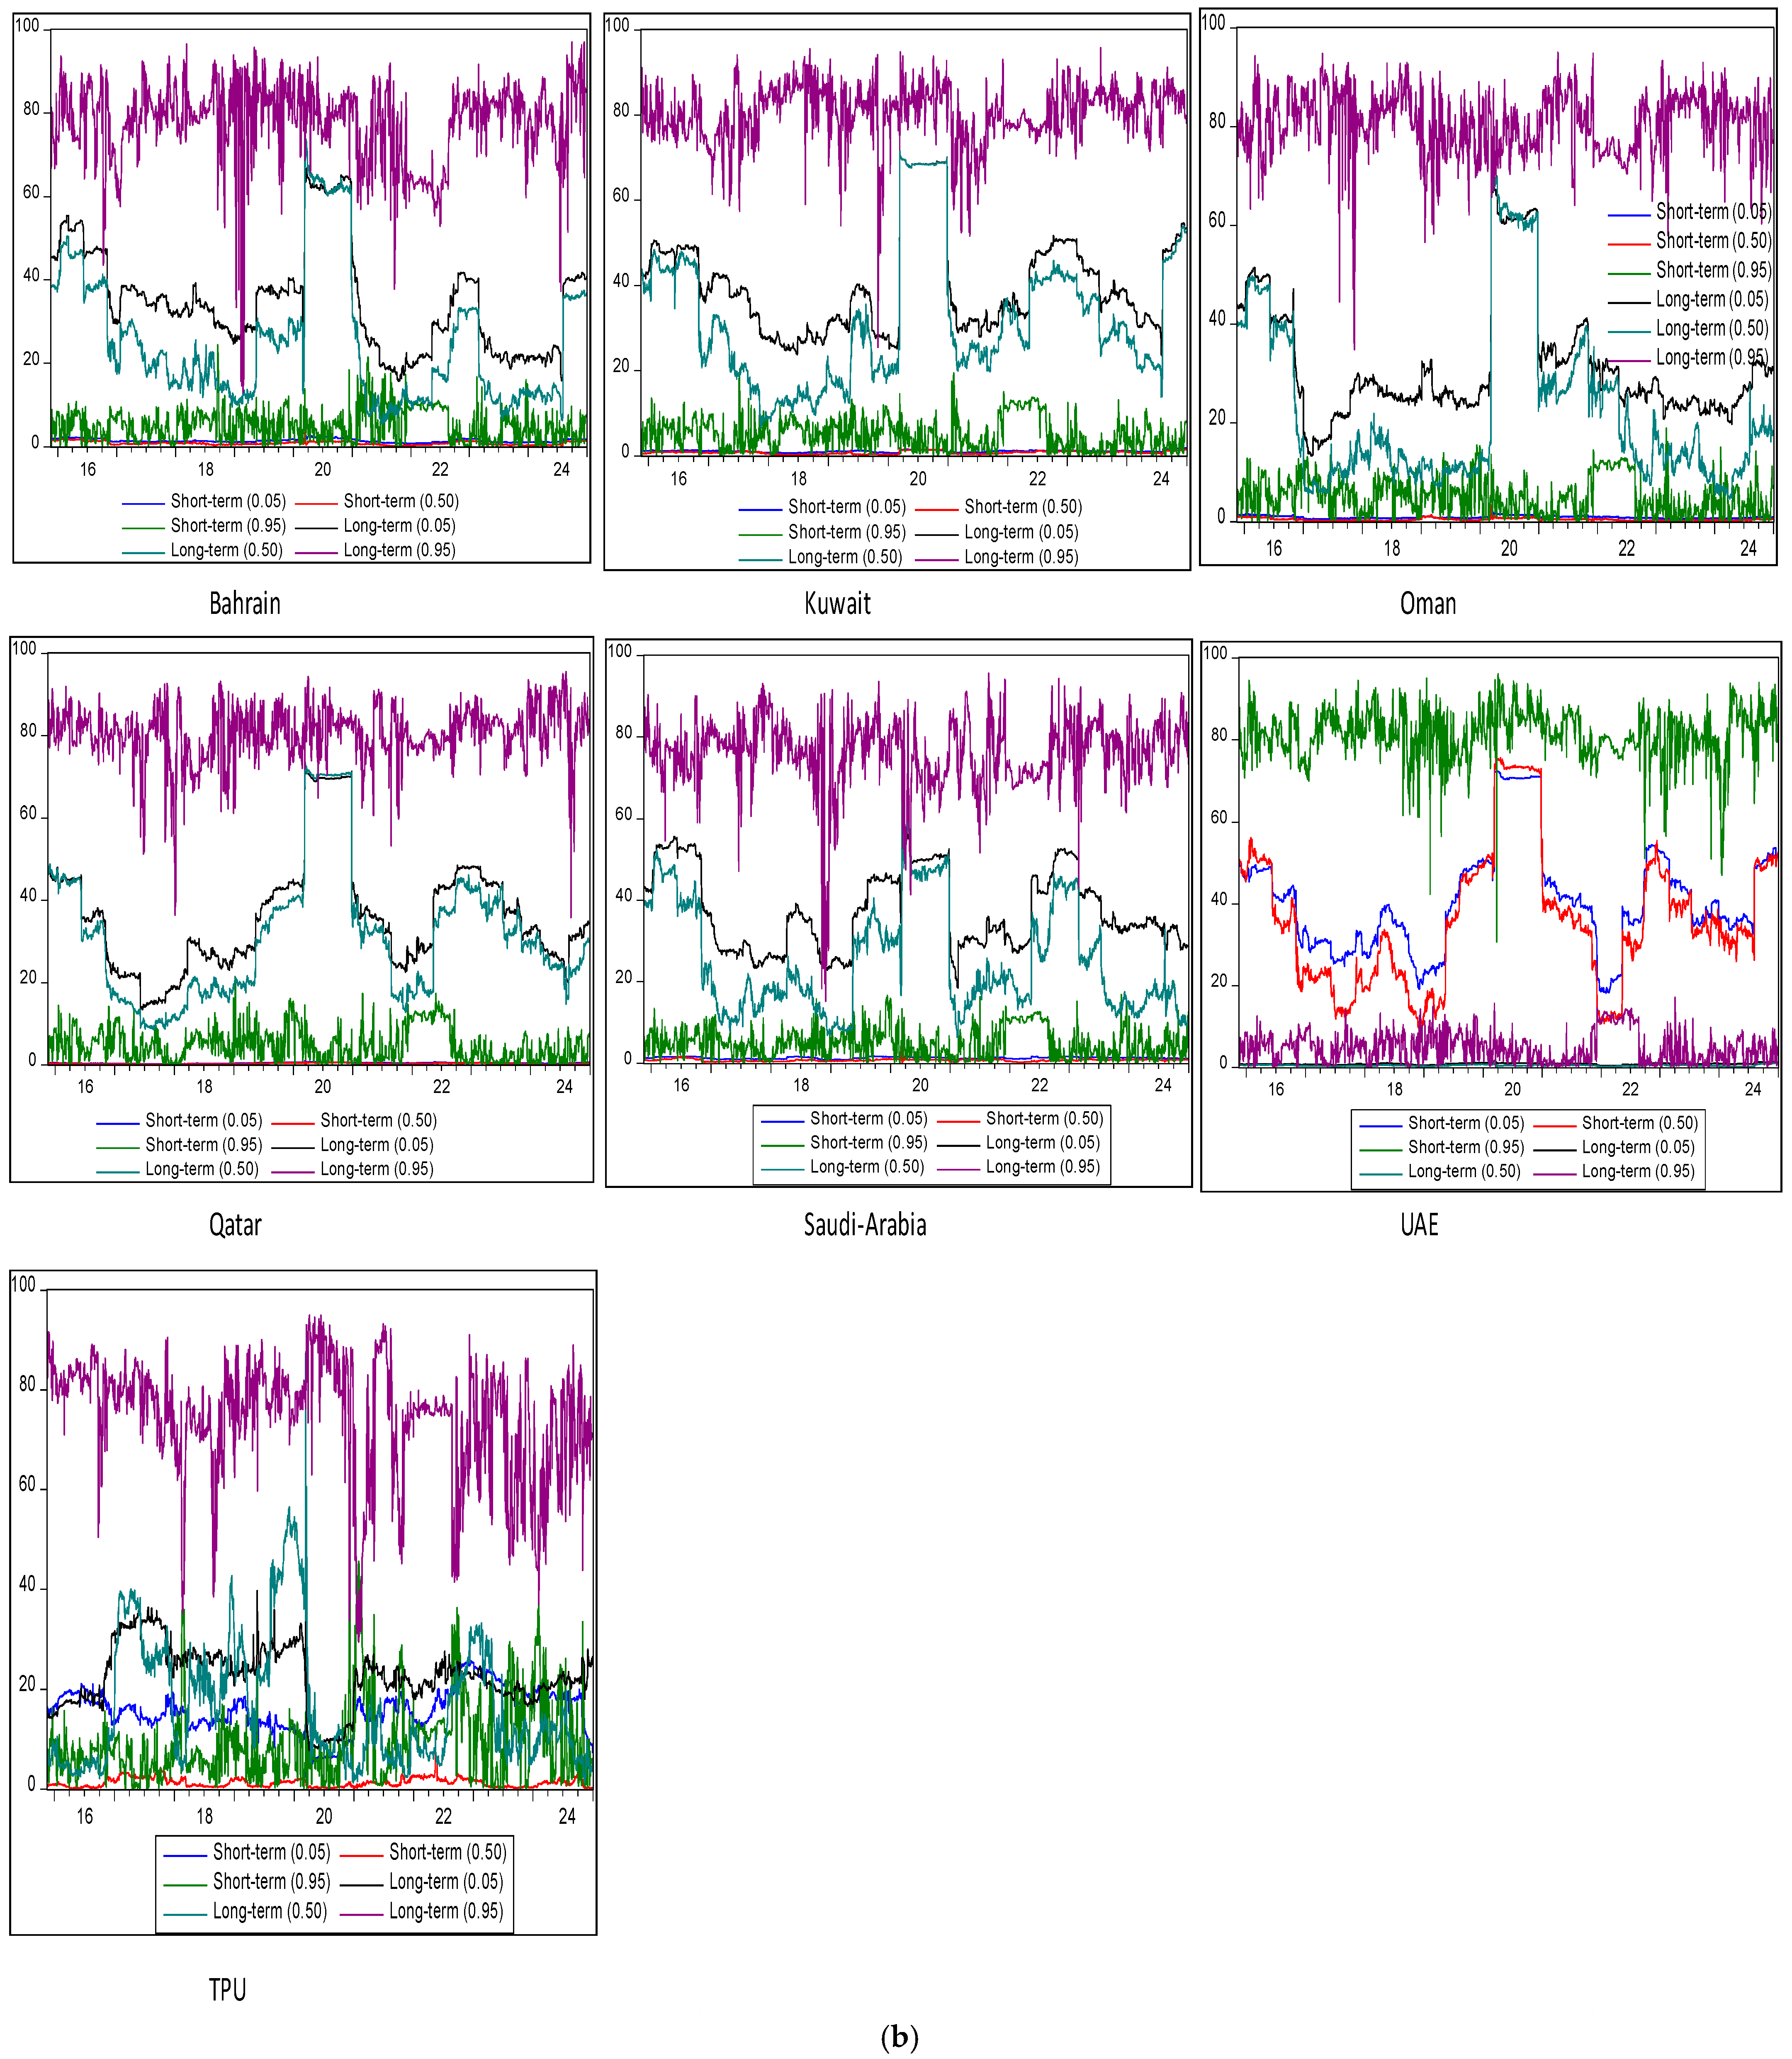
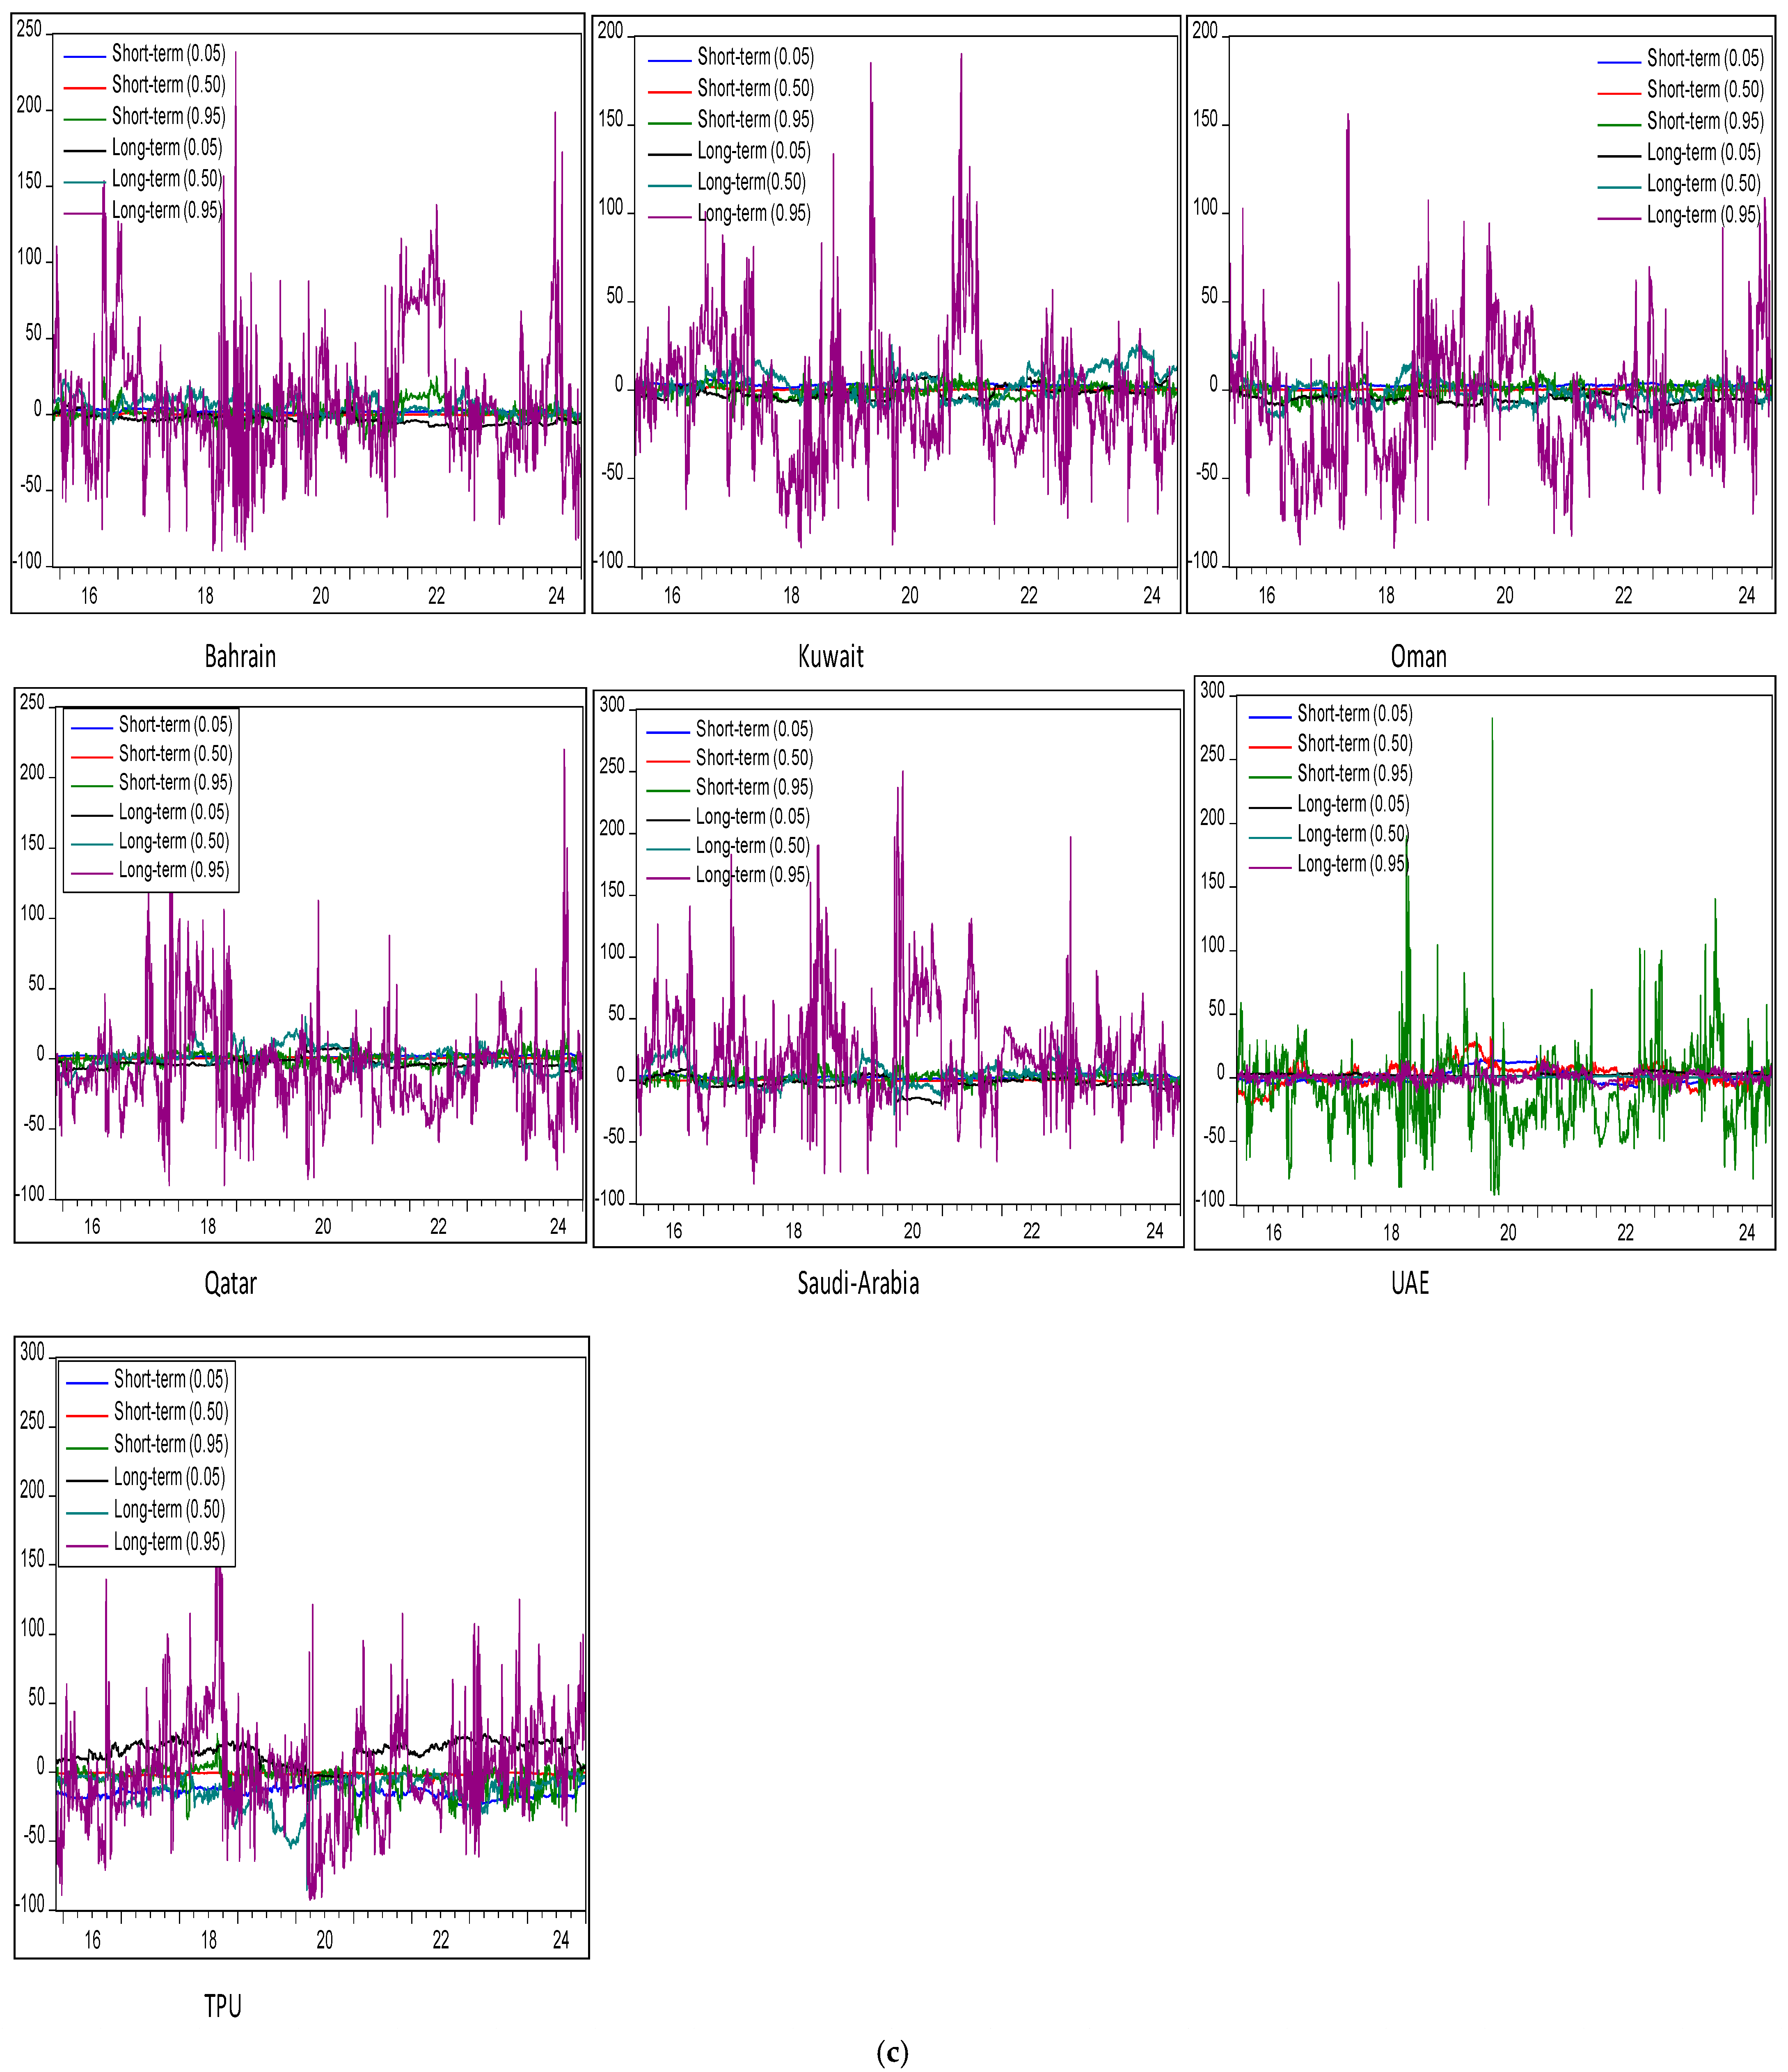
5.3. Analysis of Frequency-Domain QVAR Connectedness Between TPU and Islamic Financial Market’s Conditional Volatility of GCC Member Economies
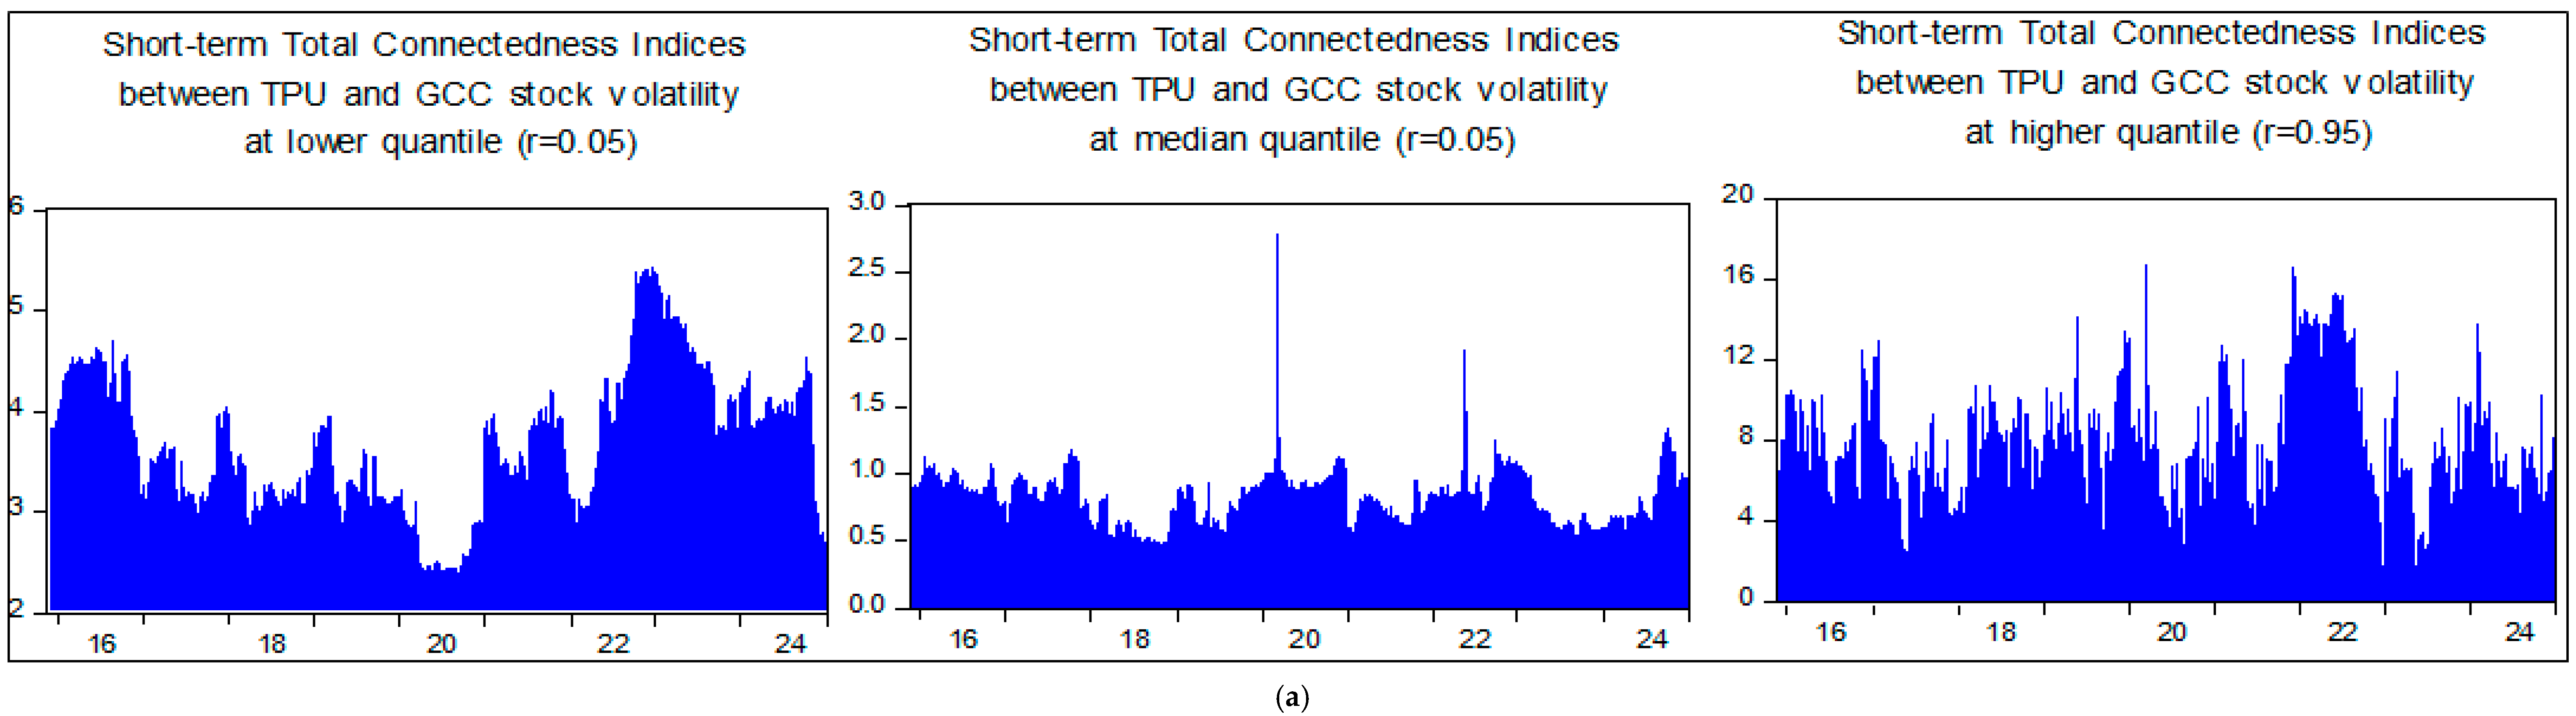
5.3.1. Shock-Transmission Mechanism Between TPU and Islamic Financial Market’s Conditional Volatility in the Short Term (ST)
5.3.2. Shock-Transmission Mechanism Between TPU and Islamic Financial Market’s Conditional Volatility in the Long Term (LT)
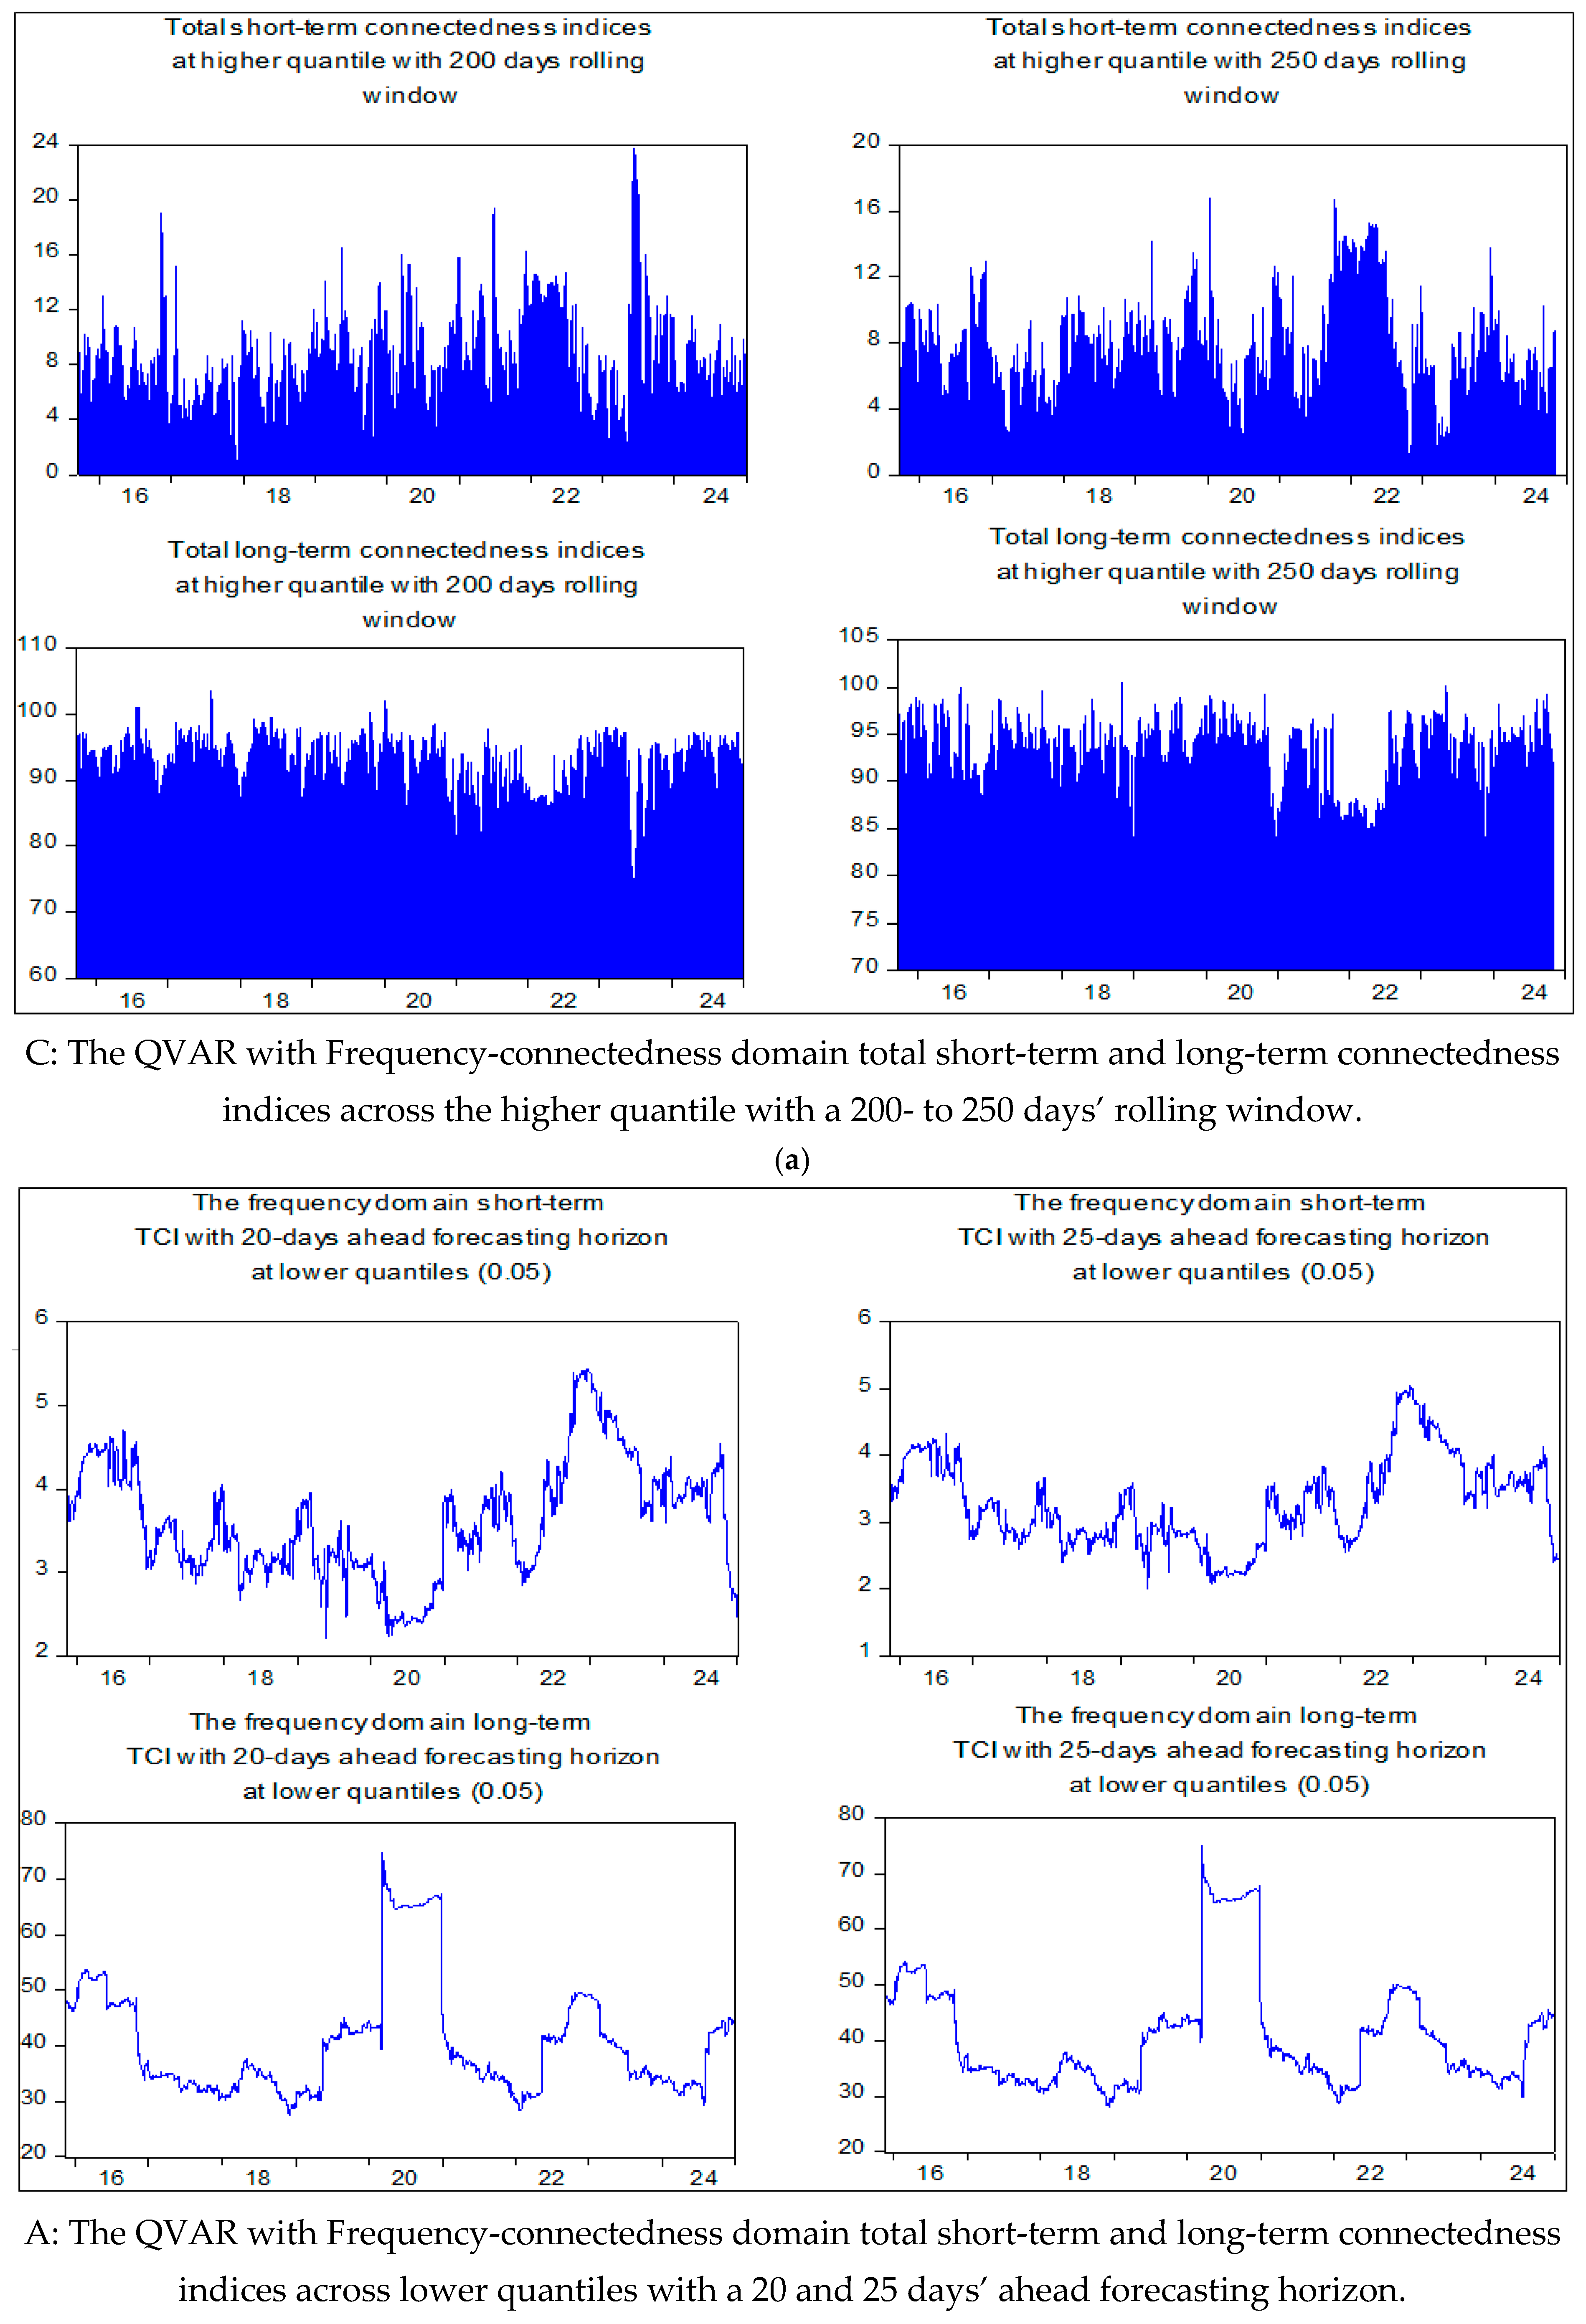
5.3.3. Sensitivity and Robustness Analysis for the QVAR with the “Frequency” Domain Connectedness Approach
6. Conclusions with Practical Implications and Future Research Directions
Author Contributions
Funding
Data Availability Statement
Conflicts of Interest
Abbreviations
| GCC | Gulf Cooperation Council |
| GFEVD | Generalized Forecast Error Variance Decomposition |
| UAE | United Arab Emirates |
| KPSS | Kwiatkowski Philips Schmidt Shin |
| LT | Long Term |
| NPDC | Net Pairwise Dynamic Connectedness |
| ST | ShoShort Term |
| TCI | Total Connectedness Index |
| TPU | Trade Policy Uncertainty |
Appendix A
| 1 | https://usuaebusiness.org/focusareas/contesting-trade-barriers-steel-and-aluminum-tariffs/ (accessed on 5 January 2025). |
| 2 | The study measures the spillover effects of Trade Policy Uncertainty (TPU) using Generalized Forecast Error Variance Decomposition (GFEVD). The Diebold and Yilmaz (2012) framework’s GFEVD measures the proportion of a variable’s forecast error variance (like the volatility of the GCC Sharia-compliant stock markets) that is caused by another (like Trade Policy Uncertainty). The GFEVD offers a flexible spillover evaluation in contrast to orthogonalized variance decomposition, which depends on variable ordering and Cholesky decomposition. It assesses the effects of one variable’s fluctuations on another, but it does not prove direct causation because observed spillovers might be the result of latent components or shared shocks. |
References
- Ahmed, Walid M. 2021. Stock market reactions to upside and downside volatility of Bitcoin: A quantile analysis. The North American Journal of Economics and Finance 57: 101379. [Google Scholar] [CrossRef]
- Akbar, Muhammad, Ihsan Ullah, Shahid Ali, and Naser Rehman. 2024. Adaptive market hypothesis: A comparison of Islamic and conventional stock indices. International Review of Economics & Finance 89: 460–77. [Google Scholar] [CrossRef]
- ALJAZEERA. 2017. Trump Withdraws US from Trans-Pacific Partnership Deal. Al Jazeera. Available online: https://www.aljazeera.com/economy/2017/1/24/trump-withdraws-us-from-trans-pacific-partnership-dea (accessed on 1 January 2025).
- Alschner, Wolfgang, Rama Panford-Walsh, and Dmitrity Skougarevskiy. 2018. What Can the Negotiations of NAFTA 1.0 Teach us About the Fate of NAFTA 2.0? Ottawa Faculty of Law Working Paper. Ottawa: Ottawa Faculty of Law. [Google Scholar]
- Altinkeski, Buket Kirci, Sel Dibooglu, Emrah Ismail Cevik, Yunus Kilic, and Mehmet Fatih Bugan. 2024. Quantile connectedness between VIX and global stock markets. Borsa Istanbul Review 24: 71–79. [Google Scholar] [CrossRef]
- Ando, Tomohiro, Matthew Greenwood-Nimmo, and Yongcheol Shin. 2022. Quantile Connectedness: Modeling Tail Behavior in the Topology of Financial Networks. Management Science 68: 2401–31. [Google Scholar] [CrossRef]
- Antonakakis, Nikolaos, Ioannis Chatziantoniou, and David Gabauer. 2020. Refined Measures of Dynamic Connectedness based on Time-Varying Parameter Vector Autoregressions. Journal of Risk and Financial Management 13: 84. [Google Scholar] [CrossRef]
- Asadi, Mehrad, Umaid A. Sheikh, M. Balcilar, David Roubaud, and H. R. Ghasemi. 2023. Are there inextricable connections among automobile stocks, crude oil, steel, and the US dollar? Energy Economics 128: 107176. [Google Scholar] [CrossRef]
- Balcilar, Mehmet, David Gabauer, and Zaghum Umar. 2021. Crude Oil futures contracts and commodity markets: New evidence from a TVP-VAR extended joint connectedness approach. Resources Policy 73: 102219. [Google Scholar] [CrossRef]
- Baker, Scott R., Nicholas Bloom, and Steven J. Davis. 2016. Measuring Economic Policy Uncertainty. The Quarterly Journal of Economics 131: 1593–636. [Google Scholar] [CrossRef]
- Baker, Scott R., Steven J. Davis, and Jeffrey A. Levy. 2022. State-level economic policy uncertainty. Journal of Monetary Economics 132: 81–99. [Google Scholar] [CrossRef]
- Bao, Xiaohua, Jianpeng Deng, Haoyu Sun, and Jin Sun. 2022. Trade policy uncertainty and foreign direct investment: Evidence from China’s WTO accession. Journal of International Money and Finance 125: 102642. [Google Scholar] [CrossRef]
- Baruník, Jozef, and Tomas Křehlík. 2018. Measuring the frequency dynamics of financial connectedness and systemic risk. Journal of Financial Econometrics 16: 271–96. [Google Scholar] [CrossRef]
- Ben Cheikh, Nidhaleddine Ben, Sami Ben Naceur, Oussama Kanaan, and Christophe Rault. 2021. Investigating the asymmetric impact of oil prices on cGCC stock markets. Economic Modelling 102: 105589. [Google Scholar] [CrossRef]
- Benkraiem, Ramzi, Amine Lahiani, Anthony Miloudi, and Muhammad Shahbaz. 2018. New insights into the US stock market reactions to energy price shocks. Journal of International Financial Markets, Institutions and Money 56: 169–87. [Google Scholar] [CrossRef]
- Bianconi, Marcelo, Federico Esposito, and Marco Sammon. 2021. Trade policy uncertainty and stock returns. Journal of International Money and Finance 119: 102492. [Google Scholar] [CrossRef]
- Bloom, Nicholas. 2009. The Impact of Uncertainty Shocks. Econometrica 77: 623–85. [Google Scholar] [CrossRef]
- Bloom, Nicholas. 2014. Fluctuations in uncertainty. Journal of Economic Perspectives 28: 153–76. [Google Scholar] [CrossRef]
- Bollerslev, Tim. 1986. Generalized autoregressive conditional heteroskedasticity. Journal of Econometrics 31: 307–27. [Google Scholar] [CrossRef]
- Bonga-Bonga, Lumengo, and Salifya Mpoha. 2024. Spillover effects from China and the United States to key regional emerging markets: A dynamic analysis. International Review of Financial Analysis 91: 103015. [Google Scholar] [CrossRef]
- Bouri, Elie, Oguzhan Cepni, David Gabauer, and Rangan Gupta. 2021. Return connectedness across asset classes around the COVID-19 outbreak. International Review of Financial Analysis 73: 101646. [Google Scholar] [CrossRef]
- Bown, Chad P. 2019. The 2018 US-China trade conflict after forty years of special protection. China Economic Journal 12: 109–36. [Google Scholar] [CrossRef]
- Brennan, Michael J. 1991. A perspective on accounting and stock prices. The Accounting Review 66: 67–79. [Google Scholar] [CrossRef]
- Brock, William A., W Dechert, J. A. Scheinkman, and B. LeBaron. 1996. A test for A test for independence based on the correlation dimension. Econometric Reviews 15: 197–235. [Google Scholar] [CrossRef]
- Byrne, Joseph, Julia Darby, and Ronald MacDonald. 2008. US trade and exchange rate volatility: A real sectoral bilateral analysis. Journal of Macroeconomics 30: 238–59. [Google Scholar] [CrossRef]
- Caldara, Dario, Matteo Iacoviello, Patrick Molligo, Andrea Prestipino, and Andrea Raffo. 2019. Does Trade Policy Uncertainty Affect Global Economic Activity? FEDS Notes, September 4. [Google Scholar]
- Caldara, Dario, Matteo Iacoviello, Patrick Molligo, Andrea Prestipino, and Andrea Raffo. 2020. The economic effects of trade policy uncertainty. Journal of Monetary Economics 109: 38–59. [Google Scholar] [CrossRef]
- Carmon, I. 2016. What Happens to the Big Supreme Court Cases after Scalia’s Death? NBC News. Available online: https://www.nbcnews.com/news/us-news/what-happens-big-supreme-court-cases-after-scalia-s-death-n518476 (accessed on 2 January 2025).
- Chatziantoniou, Ioannis, David Gabauer, and Alexis Stenfors. 2021. Interest rate swaps and the transmission mechanism of monetary policy: A quantile connectedness approach. Economics Letters 204: 109891. [Google Scholar] [CrossRef]
- Chatziantoniou, Ioannis, Emmanuel Joel Aikins Abakah, David Gabauer, and Aviral Kumar Tiwari. 2022. Quantile time–frequency price connectedness between green bond, green equity, sustainable investments and clean energy markets. Journal of Cleaner Production 361: 132088. [Google Scholar] [CrossRef]
- Chen, Zhang-HangJian, Fei Ren, Ming-Yuan Yang, Feng-Zhi Lu, and Sai-Ping Li. 2023. Dynamic lead–lag relationship between Chinese carbon emission trading and stock markets under exogenous shocks. International Review of Economics & Finance 85: 295–305. [Google Scholar] [CrossRef]
- Chodor, Tom. 2019. The rise and fall and rise of the trans-pacific partnership: 21st century trade politics through a new constitutionalist lens. Review of International Political Economy 26: 232–55. [Google Scholar] [CrossRef]
- Chudik, Alexander, Kamiar Mohaddes, M. Hashem Pesaran, Mehdi Raissi, and Alessandro Rebucci. 2021. A Counterfactual Economic Analysis of COVID-19 Using a Threshold Augmented Multi-Country Model. Journal of International Money and Finance 119: 102477. [Google Scholar] [CrossRef]
- Crowley, Meredith, Ning Meng, and Huasheng Song. 2018. Tariff scares: Trade policy uncertainty and foreign market entry by Chinese firms. Journal of International Economics 114: 96–115. [Google Scholar] [CrossRef]
- Cunado, Juncal, Ioannis Chatziantoniou, David Gabauer, de Fernando Perez Gracia, and Marfatia Hardik. 2023. Dynamic spillovers across precious metals and oil realized volatilities: Evidence from quantile extended joint connectedness measures. Journal of Commodity Markets 30: 100327. [Google Scholar] [CrossRef]
- Demirer, Riza, Ragan Gupta, Tahir Suleman, and Mark E. Wohar. 2018. Time-varying rare disaster risks, oil returns and volatility. Energy Economics 75: 239–48. [Google Scholar] [CrossRef]
- Dées, Stephane, and Arthur Saint-Guilhem. 2011. The role of the United States in the global economy and its evolution over time. Empirical Economics 41: 573–91. [Google Scholar] [CrossRef]
- Dickey, David A., and Wayne A. Fuller. 1981. Likelihood Ratio Statistics for Autoregressive Time Series with a Unit Root. Econometrica 49: 1057–72. [Google Scholar] [CrossRef]
- Diebold, Francis X., and Kamil Yilmaz. 2009. Measuring Financial Asset Return and Volatility Spillovers, with Application to Global Equity Markets. The Economic Journal 119: 158–71. [Google Scholar] [CrossRef]
- Diebold, Francis X., and Kamil Yilmaz. 2012. Better to give than to receive: Predictive directional measurement of volatility spillovers. International Journal of Forecasting 28: 57–66. [Google Scholar] [CrossRef]
- Ding, Wenzhi, Ross Levine, Chen Lin, and Wensi Xie. 2021. Corporate immunity to the COVID-19 pandemic. Journal of Financial Economics 141: 802–30. [Google Scholar] [CrossRef]
- Fink, Fabian, and Yves S. Schüler. 2015. The transmission of US systemic financial stress: Evidence for emerging market economies. Journal of International Money and Finance 55: 6–26. [Google Scholar] [CrossRef]
- Ftiti, Zied, Hachmi Ben Ameur, and Wael Louhichi. 2021. Does non-fundamental news related to COVID-19 matter for stock returns? Evidence from Shanghai stock market. Economic Modelling 99: 105484. [Google Scholar] [CrossRef]
- Gabauer, David. 2021. Dynamic measures of asymmetric & pairwise connectedness within an optimal currency area: Evidence from the ERM I system. Journal of Multinational Financial Management 60: 100680. [Google Scholar] [CrossRef]
- Grigoli, Francesco, Alexander Herman, and Andrew Swiston. 2019. A crude shock: Explaining the short-run impact of the 2014–16 oil price decline across exporters. Energy Economics 78: 481–93. [Google Scholar] [CrossRef]
- Handley, Kyle, and Nuno Limão. 2017. Policy Uncertainty, Trade, and Welfare: Theory and Evidence for China and the United States. American Economic Review 107: 2731–83. [Google Scholar] [CrossRef]
- Hau, Liya, Huiming Zhu, Yang Yu, and Dongwei Yu. 2022. Time-frequency coherence and quantile causality between trade policy uncertainty and rare earth prices: Evidence from China and the US. Resources Policy 75: 102529. [Google Scholar] [CrossRef]
- He, Feng, Brian Lucey, and Ziwei Wang. 2021. Trade policy uncertainty and its impact on the stock market -evidence from China-US trade conflict. Finance Research Letters 40: 101753. [Google Scholar] [CrossRef]
- Hopewell, Kristen. 2021. Trump & trade: The crisis in the multilateral trading system. New Political Economy 26: 271–82. [Google Scholar]
- Hoque, Mohammad Enamul, Low Soo-Wah, Md Akhter Uddin, and Ashiqur Rahman. 2023. International trade policy uncertainty spillover on stock market: Evidence from fragile five economies. The Journal of International Trade & Economic Development 32: 104–31. [Google Scholar]
- Hu, Debao, Jingming Lu, and Sibo Zhao. 2024. Does trade policy uncertainty increase commercial banks’ risk-taking? Evidence from China. International Review of Economics & Finance 89: 532–51. [Google Scholar] [CrossRef]
- Iacopini, Matteo, Aubrey Poon, Luca Rossini, and Dan Zhu. 2023. Bayesian mixed-frequency quantile vector autoregression: Eliciting tail risks of monthly US GDP. Journal of Economic Dynamics and Control 157: 104757. [Google Scholar] [CrossRef]
- International Monetary Fund. 2019. Still Sluggish Global Growth. Available online: https://www.imf.org/en/Publications/WEO/Issues/2019/07/18/WEOupdateJuly2019 (accessed on 1 January 2025).
- Kayani, Umar, Umaid A. Sheikh, Rabeh Khalfaoui, David Roubaud, and Shawkat Hammoudeh. 2024. Impact of Climate Policy Uncertainty (CPU) and global Energy Uncertainty (EU) news on U.S. sectors: The moderating role of CPU on the EU and U.S. sectoral stock nexus. Journal of Environmental Management 366: 121654. [Google Scholar] [CrossRef]
- Kelly, Kate, Edward Wong, and Vivian Nereim. 2023. U.S. Prepares to Lift Ban on Sales of Offensive Weapons to Saudi Arabia. The New York Times. Available online: https://www.nytimes.com/2023/12/21/us/politics/weapons-sales-saudi-arabia-yemen.html (accessed on 1 January 2025).
- Khodadadi, Masood. 2018. Donald Trump, US foreign policy and potential impacts on Iran’s tourism industry: Post-nuclear deal. Tourism Management Perspectives 26: 28–30. [Google Scholar] [CrossRef]
- Koop, Gary, M. Hashem Pesaran, and Simon M. Potter. 1996. Impulse response analysis in nonlinear multivariate models. Journal of Econometrics 74: 119–47. [Google Scholar] [CrossRef]
- Kwiatkowski, Denis, Peter C. B. Phillips, Peter Schmidt, and Yongcheol Shin. 1992. Testing the null hypothesis of stationarity against the alternative of a unit root: How sure are we that economic time series have a unit root? Journal of Econometrics 54: 159–78. [Google Scholar] [CrossRef]
- Landler, Mark. 2018. Trump Abandons Iran Nuclear Deal He Long Scorned. The New York Times. Available online: https://www.nytimes.com/2018/05/08/world/middleeast/trump-iran-nuclear-deal.html (accessed on 1 January 2025).
- Lastrapes, William D., and Thomas F. P. Wiesen. 2021. The joint spillover index. Economic Modelling 94: 681–91. [Google Scholar] [CrossRef]
- Lea, R. 2019. The IMF downgrades global growth again for 2019, slowest pace since the financial crisis. Growth 130: 1–21. [Google Scholar]
- Lee, Yong-Shik. 2019. Three wrongs do not make a right: The conundrum of the US steel and aluminum tariffs. World Trade Review 18: 481–501. [Google Scholar] [CrossRef]
- Li, Dakai, Fan Zhang, and Xuezhi Li. 2022. Can U.S. trade policy uncertainty help in predicting stock market excess return? Finance Research Letters 49: 103136. [Google Scholar] [CrossRef]
- Li, Mengzhe, Qianru Lin, Fei Lan, Zhimin Zhan, and Zhongshi He. 2023. Trade policy uncertainty and financial investment: Evidence from Chinese energy firms. Energy Economics 117: 106424. [Google Scholar] [CrossRef]
- Liptak, A., L. Buchanan, and A. Parlapiano. 2016. How a Vacancy on the Supreme Court Affected Cases in the 2015-16 Term. The New York Times. Available online: https://www.nytimes.com/interactive/2016/02/14/us/politics/how-scalias-death-could-affect-major-supreme-court-cases-in-the-2016-term.html (accessed on 1 January 2025).
- Londono, Juan M. 2019. Bad bad contagion. Journal of Banking & Finance 108: 105652. [Google Scholar] [CrossRef]
- Mei, Dexiang, and Yutang Xie. 2022. U.S. grain commodity futures price volatility: Does trade policy uncertainty matter? Finance Research Letters 48: 103028. [Google Scholar] [CrossRef]
- Mueller, Julia. 2022. Democratic Duo Proposes Banning Arms to Saudi Arabia Over OPEC Cuts. THE HILL. Available online: https://thehill.com/policy/energy-environment/3680496-democratic-duo-proposes-banning-arms-to-saudi-arabia-over-opec-cuts/ (accessed on 1 January 2025).
- Nantembelele, Fatuma Abdallah, Mustafa K. Yilmaz, and Ali Ari. 2023. The effects of a US-China trade war on Sub-Saharan Africa: Pro-active domestic policies make the difference. Journal of Policy Modeling 45: 1296–310. [Google Scholar] [CrossRef]
- Nawaz, Kishwar, Amine Lahiani, and David Roubaud. 2020. Do natural resources determine energy consumption in Pakistan? The importance of quantile asymmetries. The Quarterly Review of Economics and Finance 87: 200–11. [Google Scholar] [CrossRef]
- Noland, Marcus. 2018. US trade policy in the Trump administration. Asian Economic Policy Review 13: 262–78. [Google Scholar] [CrossRef]
- Nuruzzaman, Mohammed. 2020. President Trump’s ‘Maximum Pressure’Campaign and Iran’s Endgame. Strategic Analysis 44: 570–82. [Google Scholar] [CrossRef]
- Page, M. 2022. Biden Should not Renew Arms Sales to Saudi Arabia. Human Rights Watch. Available online: https://www.hrw.org/news/2022/07/14/biden-should-not-renew-arms-sales-saudi-arabia?gad_source=1 (accessed on 1 January 2025).
- Pal, Debdatta, and Subrata K. Mitra. 2016. Asymmetric oil product pricing in India: Evidence from a multiple threshold nonlinear ARDL model. Economic Modelling 59: 314–28. [Google Scholar] [CrossRef]
- Pesaran, H. Hashem, and Yongcheol Shin. 1998. Generalized impulse response analysis in linear multivariate models. Economics Letters 58: 17–29. [Google Scholar] [CrossRef]
- Phillips, Peter C. B., and Pierre Perron. 1988. Testing for a unit root in time series regression. Biometrika 75: 335–46. [Google Scholar] [CrossRef]
- Ruiz Estrada, Mario Arturo, Donghyun Park, Muhammad Tahir, and Alam Khan. 2020. Simulations of US-Iran war and its impact on global oil price behavior. Borsa Istanbul Review 20: 1–12. [Google Scholar] [CrossRef]
- Sachdev, Vineet, and Anurag Rao. 2025. What Happened the Last Time Trump Imposed Tariffs on Steel and Aluminum. Reuters. Available online: https://www.reuters.com/graphics/TRUMP-TARIFFS/STEEL/gdpznwgdzpw/ (accessed on 10 January 2025).
- Selmi, Refk, and Jamal Bouoiyour. 2020. Arab geopolitics in turmoil: Implications of Qatar-Gulf crisis for business. International Economics 161: 100–19. [Google Scholar] [CrossRef]
- Shi, Yujie, and Liming Wang. 2023. Comparing the impact of Chinese and U.S. economic policy uncertainty on the volatility of major global stock markets. Global Finance Journal 57: 100860. [Google Scholar] [CrossRef]
- Smales, Lee A. 2020. Examining the relationship between policy uncertainty and market uncertainty across the G7. International Review of Financial Analysis 71: 101540. [Google Scholar] [CrossRef]
- Stiassny, Alfred. 1996. A spectral decomposition for structural VAR models. Empirical Economics 21: 535–55. [Google Scholar] [CrossRef]
- Sheikh, Umaid A., Mehrad Asadi, David Roubaud, and Shawkat Hammoudeh. 2024. Global uncertainties and Australian financial markets: Quantile time-frequency connectedness. International Review of Financial Analysis 92: 103098. [Google Scholar] [CrossRef]
- Song, Yuegang, Xiaoyu Zhang, and Guoheng Hu. 2023. Relationships among geopolitical risk, trade policy uncertainty, and crude oil import prices: Evidence from China. Resources Policy 82: 103555. [Google Scholar] [CrossRef]
- Suleman, Muhammad Tahir, Mobeen Ur Rehman, Umaid A. Sheikh, and Sang Hoon Kang. 2023a. Dynamic time-frequency connectedness between European emissions trading system and sustainability markets. Energy Economics 123: 106726. [Google Scholar] [CrossRef]
- Suleman, Muhammad Tahir, Umaid A. Sheikh, Emilios C. Galariotis, and David Roubaud. 2023b. The impact of bitcoin fear and greed on good and bad network connectedness: The case of the US sectoral high frequency returns. Annals of Operations Research. [Google Scholar] [CrossRef]
- Suleman, Muhammad Tahir, Mosab I. Tabash, and Umaid A. Sheikh. 2022. Do stock market fluctuations lead to currency deflation in the South Asian region? Evidence beyond symmetry. International Journal of Finance & Economics 29: 1432–50. [Google Scholar] [CrossRef]
- Suwanprasert, Wisarut. 2022. The international spillover effects of US trade policy uncertainty. Economics Letters 212: 110286. [Google Scholar] [CrossRef]
- Tabash, Mosab I., Umaid A. Sheikh, Walid Mensi, and Sang Hoon Kang. 2024. Quantile-based extended joint connectedness between trade policy uncertainty and Gulf Cooperation Council Islamic sectoral volatility. Borsa Istanbul Review 24: 1146–65. [Google Scholar] [CrossRef]
- White, Halbert, Tae-Hwan Kim, and Simone Manganelli. 2015. VAR for VaR: Measuring tail dependence using multivariate regression quantiles. Journal of Econometrics 187: 169–88. [Google Scholar] [CrossRef]
- Yu, Mingzhe, Jiachuan Fan, Haijun Wang, and Jie Wang. 2023. US trade policy uncertainty on Chinese agricultural imports and exports: An aggregate and product-level analysis. International Review of Economics & Finance 84: 70–83. [Google Scholar] [CrossRef]
- U.S.-U.A.E. Business Council. 2024. Contesting Trade Barriers: Steel and Aluminum Tariffs. Available online: https://usuaebusiness.org/focusareas/contesting-trade-barriers-steel-and-aluminum-tariffs/ (accessed on 22 January 2025).


| (a) | |||||||||
| Bahrain | Kuwait | Oman | Qatar | Saudi Arabia | UAE | TPU | |||
| Mean | 5.685832 | 6.54677 | 6.554267 | 7.433979 | 5.292817 | 6.388768 | 86.394 | ||
| Median | 5.645217 | 6.519022 | 6.413385 | 7.414037 | 5.239416 | 6.408891 | 64.051 | ||
| Maximum | 6.262388 | 7.075378 | 7.105368 | 7.733662 | 5.814429 | 6.757281 | 877.551 | ||
| Minimum | 5.113613 | 5.965249 | 6.194671 | 7.131387 | 4.72055 | 5.790021 | 0.000 | ||
| Std. Dev. | 0.271248 | 0.277827 | 0.263233 | 0.116799 | 0.263478 | 0.151319 | 79.394 | ||
| Skewness | −0.024876 | −0.060057 | 0.77854 | 0.527381 | 0.11032 | −0.685916 | 2.266 | ||
| Kurtosis | 2.175733 | 1.738472 | 2.106744 | 2.850279 | 1.706746 | 3.675462 | 11.705 | ||
| Jarque–Bera (JB) | 88.02082 | 207.2924 | 415.9585 | 146.5017 | 222.1768 | 301.8189 | 12,434.290 | ||
| Probability | 0.00000 | 0.00000 | 0.00000 | 0.00000 | 0.00000 | 0.00000 | 0.000 | ||
| Sum | 17,614.71 | 20,281.89 | 20,305.12 | 23,030.47 | 16,397.15 | 19,792.4 | 267,649.900 | ||
| Sum Sq. Dev. | 227.86 | 239.05 | 214.60 | 42.25 | 215.00 | 70.91 | 19,521,739.00 | ||
| (b) | |||||||||
| Bahrain | Kuwait | Oman | Qatar | Saudi Arabia | UAE | ||||
| Mean | 0.00015 | 0.00016 | −0.00026 | −0.00009 | 0.00014 | 0.00006 | |||
| Median | 0.00000 | 0.00000 | 0.00000 | 0.00000 | 0.00000 | 0.00000 | |||
| Maximum | 0.08874 | 0.05673 | 0.03715 | 0.06709 | 0.08086 | 0.08153 | |||
| Minimum | −0.08270 | −0.21454 | −0.05111 | −0.12630 | −0.08026 | −0.16063 | |||
| Std. Dev. | 0.01241 | 0.00882 | 0.00651 | 0.00949 | 0.00964 | 0.01039 | |||
| Skewness | 0.35616 | −5.90093 | −0.36004 | −1.26435 | −0.63437 | −1.89114 | |||
| Kurtosis | 13.19292 | 137.37500 | 9.87406 | 22.32181 | 14.57371 | 36.41283 | |||
| Jarque–Bera | 13,472.340 | 2,348,032.000 | 6164.478 | 49,000.540 | 17,492.960 | 145,910.400 | |||
| Probability | 0.00000 | 0.00000 | 0.00000 | 0.00000 | 0.00000 | 0.00000 | |||
| Sum | 0.47508 | 0.47911 | −0.80912 | −0.26485 | 0.44671 | 0.18192 | |||
| Sum Sq. Dev. | 0.47685 | 0.24066 | 0.13137 | 0.27898 | 0.28756 | 0.33421 | |||
| Observations | 3096.00 | 3096.00 | 3096.00 | 3096.00 | 3096.00 | 3096.00 | |||
| Bahrain | Oman | ||||||||||||||||||
| GARCH (1,1) with Student’s t | GARCH (1,1) with GED | GARCH (1,1) with Student’s t | GARCH (1,1) with GED | ||||||||||||||||
| Variable | Coefficient | Std. Error | z-Statistic | Prob. | Coefficient | Std. Error | z-Statistic | Prob. | Coefficient | Std. Error | z-Statistic | Prob. | Coefficient | Std. Error | z-Statistic | Prob. | |||
| 2.59 × 10⁻⁵ | 0.0002 | 0.1661 | 0.8681 | 9.07 × 10⁻⁶ | 0.0002 | 0.0561 | 0.9552 | −0.0002 | 0.0001 | −2.0515 | 0.0402 | −0.0001 | 0.0001 | −1.1240 | 0.2610 | ||||
| −0.0047 | 0.0195 | −0.2384 | 0.8116 | −0.0009 | 0.0200 | −0.0431 | 0.9656 | 0.0412 | 0.0186 | 2.2176 | 0.0266 | 0.0279 | 0.0188 | 1.4835 | 0.1379 | ||||
| Variance Equation | Variance Equation | Variance Equation | Variance Equation | ||||||||||||||||
| 4.86 × 10⁻⁶ | 0.0000 | 8.8928 | 0.0000 | 5.69 × 10⁻⁶ | 0.0000 | 10.0683 | 0.0000 | 0.000002 | 0.0000 | 7.3580 | 0.0000 | 0.000002 | 0.0000 | 8.1788 | 0.0000 | ||||
| 0.1113 | 0.0085 | 13.1429 | 0.0000 | 0.1211 | 0.0082 | 14.7471 | 0.0000 | 0.0776 | 0.0073 | 10.5572 | 0.0000 | 0.0816 | 0.0071 | 11.5098 | 0.0000 | ||||
| 0.8195 | 0.0115 | 71.0632 | 0.0000 | 0.8200 | 0.0105 | 77.9233 | 0.0000 | 0.8557 | 0.0125 | 68.5717 | 0.0000 | 0.8598 | 0.0111 | 77.7633 | 0.0000 | ||||
| Log likelihood | 9927.4220 | 9953.7770 | 11,636.1800 | 11,673.8200 | |||||||||||||||
| Durbin–Watson stat | 1.9146 | 1.9222 | 1.9260 | 1.8983 | |||||||||||||||
| Akaike Info criterion | −6.4098 | −6.4269 | −7.5137 | −7.5380 | |||||||||||||||
| Schwarz criterion | −6.4001 | −6.4171 | −7.5039 | −7.5282 | |||||||||||||||
| Hannan–Quinn criteria. | −6.4063 | −6.4234 | −7.5102 | −7.5345 | |||||||||||||||
| Qatar | Kuwait | ||||||||||||||||||
| GARCH (1,1) with Student’s t | GARCH (1,1) with GED | GARCH (1,1) with Student’s t | GARCH (1,1) with GED | ||||||||||||||||
| Variable | Coefficient | Std. Error | z-Statistic | Prob. | Coefficient | Std. Error | z-Statistic | Prob. | Coefficient | Std. Error | z-Statistic | Prob. | Coefficient | Std. Error | z-Statistic | Prob. | |||
| 0.0001 | 0.0001 | 0.7909 | 0.4290 | 1.67 × 10⁻⁵ | 0.0001 | 0.1197 | 0.9047 | 0.0003 | 0.0001 | 2.5324 | 0.0113 | 0.0001 | 0.0001 | 1.1830 | 0.2368 | ||||
| 0.0832 | 0.0167 | 4.9665 | 0.0000 | 0.0577 | 0.0182 | 3.1792 | 0.0015 | 0.0622 | 0.0183 | 3.4088 | 0.0007 | 0.0600 | 0.0193 | 3.1033 | 0.0019 | ||||
| Variance Equation | Variance Equation | Variance Equation | Variance Equation | ||||||||||||||||
| 1.50 × 10⁻⁶ | 2.10 × 10⁻⁷ | 7.1319 | 0.0000 | 1.91 × 10⁻⁶ | 2.31 × 10⁻⁷ | 8.2383 | 0.0000 | 0.000002 | 0.0000 | 8.7123 | 0.0000 | 0.000002 | 0.0000 | 9.7341 | 0.0000 | ||||
| 0.0350 | 0.0035 | 10.1092 | 0.0000 | 0.0497 | 0.0036 | 13.8396 | 0.0000 | 0.0757 | 0.0065 | 11.5663 | 0.0000 | 0.0926 | 0.0052 | 17.9235 | 0.0000 | ||||
| 0.9261 | 0.0065 | 143.5411 | 0.0000 | 0.9136 | 0.0063 | 145.9840 | 0.0000 | 0.8574 | 0.0104 | 82.1123 | 0.0000 | 0.8599 | 0.0081 | 105.9911 | 0.0000 | ||||
| Log likelihood | 10,633.6600 | 10,650.1800 | 11,283.3700 | 11,272.0300 | |||||||||||||||
| Durbin–Watson stat | 2.0942 | 2.0432 | 2.0314 | 2.0272 | |||||||||||||||
| Akaike Info criterion | −6.8661 | −6.8767 | −7.2858 | −7.2784 | |||||||||||||||
| Schwarz criterion | −6.8563 | −6.8670 | −7.2760 | −7.2687 | |||||||||||||||
| Hannan–Quinn criter. | −6.8626 | −6.8732 | −7.2823 | −7.2749 | |||||||||||||||
| UAE | Saudi Arabia | ||||||||||||||||||
| GARCH (1,1) with Student’ t | GARCH (1,1) with GED | GARCH (1,1) with Student’s t | GARCH (1,1) with GED | ||||||||||||||||
| Variable | Coefficient | Std. Error | z-Statistic | Prob. | Coefficient | Std. Error | z-Statistic | Prob. | Coefficient | Std. Error | z-Statistic | Prob. | Coefficient | Std. Error | z-Statistic | Prob. | |||
| 0.0002 | 0.0001 | 1.4247 | 0.1543 | 0.0001 | 0.0001 | 0.5880 | 0.5566 | 0.000382 | 0.000134 | 2.860248 | 0.00012 | 0.000244 | 0.000134 | 1.82605 | 0.0678 | ||||
| 0.0321 | 0.0176 | 1.8284 | 0.0675 | 0.0207 | 0.0186 | 1.1110 | 0.2666 | 0.108977 | 0.019085 | 5.710215 | 0.0042 | 0.072749 | 0.019188 | 3.791441 | 0.0001 | ||||
| Variance Equation | Variance Equation | Variance Equation | Variance Equation | ||||||||||||||||
| 0.000002 | 0.0000 | 8.7438 | 0.0000 | 0.000002 | 0.0000 | 9.8298 | 0.0000 | 3.51 × 10⁻⁶ | 5.12 × 10⁻⁷ | 6.850479 | 0.00038 | 0.000003 | 0.0000 | 6.9810 | 0.0000 | ||||
| 0.0599 | 0.0052 | 11.4534 | 0.0000 | 0.0750 | 0.0043 | 17.5030 | 0.0000 | 0.099477 | 0.009717 | 10.23742 | 0.000001 | 0.1071 | 0.0095 | 11.3281 | 0.0000 | ||||
| 0.8864 | 0.0082 | 108.7313 | 0.0000 | 0.8796 | 0.0070 | 125.7973 | 0.0000 | 0.839154 | 0.014164 | 59.24409 | 0.000032 | 0.8406 | 0.0134 | 62.9534 | 0.0000 | ||||
| Log likelihood | 10,680.3200 | 10,679.3700 | 10,557.57 | 10,585.64 | |||||||||||||||
| Durbin–Watson stat | 2.0777 | 2.0561 | 2.11166 | 2.039992 | |||||||||||||||
| Akaike Info criterion | −6.8962 | −6.8956 | −6.816906 | −6.835041 | |||||||||||||||
| Schwarz criterion | −6.8865 | −6.8858 | −6.807154 | −6.82529 | |||||||||||||||
| Hannan–Quinn criter. | −6.8927 | −6.8921 | −6.813404 | −6.83154 | |||||||||||||||
| Bahrain | Kuwait | Oman | Qatar | Saudi Arabia | UAE | TPU | |
|---|---|---|---|---|---|---|---|
| Mean | 0.0106 | 0.0069 | 0.0058 | 0.0082 | 0.0085 | 0.0084 | 86.3944 |
| Median | 0.0091 | 0.0059 | 0.0053 | 0.0075 | 0.0075 | 0.0071 | 64.0513 |
| Maximum | 0.0403 | 0.0663 | 0.0179 | 0.0296 | 0.0437 | 0.0491 | 877.5510 |
| Minimum | 0.0058 | 0.0031 | 0.0038 | 0.0050 | 0.0049 | 0.0049 | 0.0000 |
| Std. Dev. | 0.0049 | 0.0041 | 0.0018 | 0.0029 | 0.0035 | 0.0044 | 79.3942 |
| Skewness | 2.4810 | 7.1288 | 1.9720 | 2.9234 | 3.6816 | 4.7011 | 2.2664 |
| Kurtosis | 11.0053 | 77.0395 | 8.7813 | 15.1233 | 24.3712 | 34.6766 | 11.7053 |
| Jarque–Bera | 11,443.170 | 733,382.200 | 6318.254 | 23,369.500 | 65,911.630 | 140,843.700 | 12,434.290 |
| Probability | 0.000 | 0.000 | 0.000 | 0.000 | 0.000 | 0.000 | 0.000 |
| Sum | 32.761 | 21.473 | 18.086 | 25.427 | 26.176 | 25.925 | 267,649.90 |
| Sum Sq. Dev. | 0.074 | 0.052 | 0.010 | 0.027 | 0.038 | 0.060 | 19,521,739.00 |
| Observations | 3096.000 | 3096.000 | 3096.000 | 3096.000 | 3096.000 | 3096.000 | 3098.000 |
| unit root test at level | |||||||
| ADF | −9.82 *** | −9.20 *** | −9.60 *** | −8.30 *** | −9.65 *** | −8.20 *** | −5.736 *** |
| PP | −9.84 *** | −8.96 *** | −9.843 *** | −8.22 *** | −9.10 *** | −8.072 *** | −45.736 *** |
| KPSS | 0.192 | 0.19 | 0.567 | 0.7 | 0.43 | 0.35 | 0.53 |
| Bahrain | Kuwait | Oman | ||||||||||||||
| Dimension | BDS Statistic | Std. Error | z-Statistic | Prob. | Dimension | BDS Statistic | Std. Error | z-Statistic | Prob. | Dimension | BDS Statistic | Std. Error | z-Statistic | Prob. | ||
| 2.0000 | 0.1654 | 0.0020 | 81.7892 | 0.0000 | 2.0000 | 0.1740 | 0.0021 | 84.8960 | 0.0000 | 2.0000 | 0.1661 | 0.0017 | 94.9622 | 0.0000 | ||
| 3.0000 | 0.2756 | 0.0032 | 85.4966 | 0.0000 | 3.0000 | 0.2915 | 0.0033 | 89.2911 | 0.0000 | 3.0000 | 0.2770 | 0.0028 | 99.4957 | 0.0000 | ||
| 4.0000 | 0.3461 | 0.0039 | 89.8195 | 0.0000 | 4.0000 | 0.3685 | 0.0039 | 94.5327 | 0.0000 | 4.0000 | 0.3479 | 0.0033 | 104.7698 | 0.0000 | ||
| 5.0000 | 0.3883 | 0.0040 | 96.3051 | 0.0000 | 5.0000 | 0.4168 | 0.0041 | 102.3077 | 0.0000 | 5.0000 | 0.3912 | 0.0035 | 112.8079 | 0.0000 | ||
| 6.0000 | 0.4111 | 0.0039 | 105.2879 | 0.0000 | 6.0000 | 0.4454 | 0.0039 | 113.0232 | 0.0000 | 6.0000 | 0.4151 | 0.0034 | 123.8686 | 0.0000 | ||
| Qatar | Saudi Arabia | UAE | ||||||||||||||
| Dimension | BDS Statistic | Std. Error | z-Statistic | Prob. | Dimension | BDS Statistic | Std. Error | z-Statistic | Prob. | Dimension | BDS Statistic | Std. Error | z-Statistic | Prob. | ||
| 2.0000 | 0.1820 | 0.0019 | 94.4671 | 0.0000 | 2.0000 | 0.1660 | 0.0019 | 86.8310 | 0.0000 | 2.0000 | 0.1798 | 0.0022 | 82.3329 | 0.0000 | ||
| 3.0000 | 0.3057 | 0.0031 | 99.8557 | 0.0000 | 3.0000 | 0.2781 | 0.0030 | 91.2694 | 0.0000 | 3.0000 | 0.3023 | 0.0035 | 86.8199 | 0.0000 | ||
| 4.0000 | 0.3884 | 0.0036 | 106.5351 | 0.0000 | 4.0000 | 0.3513 | 0.0036 | 96.5229 | 0.0000 | 4.0000 | 0.3847 | 0.0042 | 92.4011 | 0.0000 | ||
| 5.0000 | 0.4423 | 0.0038 | 116.3520 | 0.0000 | 5.0000 | 0.3971 | 0.0038 | 104.3464 | 0.0000 | 5.0000 | 0.4384 | 0.0044 | 100.5792 | 0.0000 | ||
| 6.0000 | 0.4759 | 0.0037 | 129.7556 | 0.0000 | 6.0000 | 0.4235 | 0.0037 | 115.0017 | 0.0000 | 6.0000 | 0.4719 | 0.0042 | 111.7519 | 0.0000 | ||
| TPU | ||||||||||||||||
| Dimension | BDS Statistic | Std. Error | z-Statistic | Prob. | ||||||||||||
| 2.0000 | 0.0764 | 0.0018 | 42.1866 | 0.0000 | ||||||||||||
| 3.0000 | 0.1348 | 0.0029 | 46.8837 | 0.0000 | ||||||||||||
| 4.0000 | 0.1734 | 0.0034 | 50.6881 | 0.0000 | ||||||||||||
| 5.0000 | 0.1948 | 0.0036 | 54.6967 | 0.0000 |
| At Lower Quantile (r = 0.05) | Bahrain | Oman | Kuwait | Qatar | UAE | Saudi Arabia | TPU | FROM |
|---|---|---|---|---|---|---|---|---|
| Bahrain | 88.83 | 1.12 | 2.11 | 0.96 | 1.79 | 2.27 | 2.9 | 11.17 |
| Oman | 1.24 | 89.95 | 1.41 | 1.08 | 1.52 | 2.03 | 2.78 | 10.05 |
| Kuwait | 1.95 | 1.08 | 89.26 | 1.74 | 1.64 | 1.85 | 2.48 | 10.74 |
| Qatar | 0.54 | 0.54 | 1.56 | 93.74 | 1.87 | 0.86 | 0.9 | 6.26 |
| UAE | 1.26 | 1.05 | 1.75 | 2.19 | 90.5 | 1.47 | 1.79 | 9.5 |
| Saudi Arabia | 2.29 | 1.89 | 2.17 | 1.5 | 2.13 | 86.84 | 3.18 | 13.16 |
| TPU | 5.32 | 4.75 | 5.1 | 3.1 | 4.75 | 6.18 | 70.79 | 29.21 |
| TO | 12.6 | 10.44 | 14.1 | 10.57 | 13.7 | 14.66 | 14.03 | 90.09 |
| Inc.Own | 101.43 | 100.39 | 103.36 | 104.31 | 104.2 | 101.5 | 84.82 | TCI |
| NET | 1.43 | 0.39 | 3.36 | 4.31 | 4.2 | 1.5 | −15.18 | 12.87% |
| At Median Quantile (r = 0.50) | ||||||||
| Bahrain | 98.18 | 0.18 | 0.53 | 0.19 | 0.35 | 0.32 | 0.25 | 1.82 |
| Oman | 0.21 | 99.14 | 0.15 | 0.16 | 0.16 | 0.15 | 0.03 | 0.86 |
| Kuwait | 0.4 | 0.08 | 98.84 | 0.1 | 0.16 | 0.19 | 0.23 | 1.16 |
| Qatar | 0.17 | 0.18 | 0.39 | 98.69 | 0.45 | 0.11 | 0.01 | 1.31 |
| UAE | 0.17 | 0.1 | 0.19 | 0.17 | 99.17 | 0.16 | 0.04 | 0.83 |
| Saudi Arabia | 0.25 | 0.18 | 0.21 | 0.14 | 0.22 | 98.95 | 0.05 | 1.05 |
| TPU | 2.94 | 1.41 | 2.35 | 2.96 | 3.44 | 1.87 | 85.04 | 14.96 |
| TO | 4.13 | 2.13 | 3.81 | 3.72 | 4.79 | 2.8 | 0.61 | 21.99 |
| Inc.Own | 102.31 | 101.27 | 102.65 | 102.41 | 103.96 | 101.75 | 85.65 | TCI |
| NET | 2.31 | 1.27 | 2.65 | 2.41 | 3.96 | 1.75 | −14.35 | 3.14% |
| At Higher Quantile (r = 0.95) | ||||||||
| Bahrain | 61.18 | 5.8 | 6.17 | 6.15 | 5.97 | 7.45 | 7.28 | 38.82 |
| Oman | 6.42 | 63.05 | 5.5 | 5.66 | 5.61 | 7.13 | 6.63 | 36.95 |
| Kuwait | 6.64 | 5.34 | 62.89 | 5.82 | 5.61 | 7.09 | 6.61 | 37.11 |
| Qatar | 6.36 | 5.49 | 5.59 | 63.17 | 5.62 | 7.14 | 6.64 | 36.83 |
| UAE | 6.88 | 5.76 | 5.95 | 5.97 | 61.4 | 7.19 | 6.85 | 38.6 |
| Saudi Arabia | 6.79 | 5.64 | 5.84 | 6 | 5.56 | 63.3 | 6.86 | 36.7 |
| TPU | 16.55 | 13.94 | 14.31 | 13.19 | 13.4 | 17.93 | 10.69 | 89.31 |
| TO | 49.63 | 41.97 | 43.35 | 42.79 | 41.78 | 53.94 | 40.87 | 314.32 |
| Inc.Own | 110.81 | 105.03 | 106.24 | 105.95 | 103.17 | 117.24 | 51.55 | TCI |
| NET | 10.81 | 5.03 | 6.24 | 5.95 | 3.17 | 17.24 | −48.45 | 44.90% |
| Panel A | Short-Term | Long-Term | |||||||||||||||
|---|---|---|---|---|---|---|---|---|---|---|---|---|---|---|---|---|---|
| r = 0.05 | Bahrain | Oman | Kuwait | Qatar | UAE | Saudi Arabia | TPU | From | Bahrain | Oman | Kuwait | Qatar | UAE | Saudi Arabia | TPU | From | |
| Bahrain | 2.57 | 0.18 | 0.25 | 0.13 | 0.25 | 0.31 | 0.28 | 1.41 | 61.03 | 4.42 | 6.42 | 3.4 | 6.25 | 7.6 | 6.89 | 34.99 | |
| Oman | 0.13 | 1.99 | 0.14 | 0.1 | 0.15 | 0.18 | 0.2 | 0.91 | 4.81 | 65.43 | 4.96 | 3.7 | 5.24 | 6.23 | 6.73 | 31.67 | |
| Kuwait | 0.17 | 0.12 | 1.62 | 0.22 | 0.23 | 0.17 | 0.18 | 1.08 | 6.21 | 4.36 | 57.11 | 8.39 | 8.56 | 6.31 | 6.38 | 40.19 | |
| Qatar | 0.04 | 0.04 | 0.1 | 0.78 | 0.14 | 0.05 | 0.05 | 0.42 | 3.47 | 3.4 | 8.98 | 62.64 | 11.97 | 4.37 | 3.97 | 36.16 | |
| UAE | 0.12 | 0.1 | 0.18 | 0.22 | 1.3 | 0.12 | 0.13 | 0.87 | 5.71 | 4.56 | 8.47 | 10.91 | 56.91 | 5.67 | 5.61 | 40.92 | |
| Saudi Arabia | 0.24 | 0.2 | 0.22 | 0.15 | 0.2 | 2.11 | 0.28 | 1.28 | 7.42 | 5.76 | 6.39 | 4.26 | 5.86 | 59.18 | 7.73 | 37.42 | |
| TPU | 2.91 | 2.63 | 2.69 | 1.63 | 2.4 | 3.48 | 27.31 | 15.75 | 4 | 3.64 | 3.89 | 2.54 | 3.85 | 4.75 | 34.28 | 22.67 | |
| TO | 3.61 | 3.26 | 3.58 | 2.46 | 3.37 | 4.32 | 1.13 | 21.73 | 31.62 | 26.13 | 39.1 | 33.21 | 41.73 | 34.93 | 37.3 | 244.02 | |
| Inc.Own | 6.18 | 5.24 | 5.2 | 3.24 | 4.67 | 6.43 | 28.43 | TCI | 92.65 | 91.56 | 96.21 | 95.85 | 98.64 | 94.11 | 71.58 | TCI | |
| Net | 2.2 | 2.34 | 2.5 | 2.03 | 2.5 | 3.04 | −14.62 | 3.10% | −3.37 | −5.54 | −1.09 | −2.95 | 0.81 | −2.49 | 14.63 | 34.86% | |
| Panel B | |||||||||||||||||
| r = 0.50 | Short-Term | Long-Term | |||||||||||||||
| Bahrain | 2.63 | 0.11 | 0.18 | 0.1 | 0.18 | 0.22 | 0.03 | 0.82 | 71.49 | 3.73 | 5.62 | 2.85 | 5.81 | 6.08 | 0.97 | 25.06 | |
| Oman | 0.07 | 2.15 | 0.1 | 0.08 | 0.09 | 0.1 | 0.01 | 0.45 | 4.4 | 75.11 | 4.32 | 3.42 | 4.74 | 5.09 | 0.32 | 22.29 | |
| Kuwait | 0.13 | 0.09 | 1.75 | 0.22 | 0.2 | 0.11 | 0.02 | 0.76 | 5.82 | 3.7 | 65.51 | 7.86 | 7.84 | 5.91 | 0.84 | 31.98 | |
| Qatar | 0.02 | 0.02 | 0.09 | 0.82 | 0.13 | 0.02 | 0.01 | 0.28 | 3.42 | 3.07 | 9.53 | 67.59 | 11.02 | 4.1 | 0.18 | 31.31 | |
| UAE | 0.06 | 0.06 | 0.11 | 0.19 | 1.3 | 0.06 | 0.01 | 0.49 | 6.3 | 3.95 | 9.15 | 10.37 | 62.01 | 5.92 | 0.51 | 36.2 | |
| Saudi Arabia | 0.15 | 0.13 | 0.16 | 0.12 | 0.12 | 2.11 | 0.02 | 0.7 | 6.95 | 4.14 | 4.92 | 3.28 | 5.24 | 72.06 | 0.61 | 25.14 | |
| TPU | 0.29 | 0.1 | 0.24 | 0.18 | 0.24 | 0.22 | 32.45 | 1.27 | 3.08 | 1.46 | 2.48 | 3.57 | 4.06 | 1.94 | 49.68 | 16.59 | |
| TO | 0.72 | 0.51 | 0.88 | 0.88 | 0.95 | 0.73 | 0.09 | 4.76 | 29.99 | 20.05 | 36.02 | 31.35 | 38.7 | 29.04 | 3.44 | 188.58 | |
| Inc.Own | 3.35 | 2.65 | 2.63 | 1.7 | 2.26 | 2.84 | 32.54 | TCI | 101.48 | 95.16 | 101.53 | 98.94 | 100.71 | 101.09 | 53.12 | TCI | |
| Net | −0.09 | 0.06 | 0.12 | 0.6 | 0.47 | 0.03 | −1.18 | 0.68% | 4.92 | −2.24 | 4.04 | 0.04 | 2.5 | 3.9 | −13.16 | 26.90% | |
| Panel C | |||||||||||||||||
| r = 0.95 | Short-Term | Long-Term | |||||||||||||||
| Bahrain | 1.2 | 0.8 | 0.83 | 0.8 | 0.78 | 1.04 | 0.89 | 5.13 | 15.98 | 11.96 | 12.9 | 12.36 | 11.95 | 15.62 | 12.9 | 77.69 | |
| Oman | 1.05 | 0.82 | 0.8 | 0.74 | 0.76 | 1.06 | 0.81 | 5.22 | 14.28 | 13.39 | 12.69 | 12.12 | 12.39 | 16.48 | 12.61 | 80.57 | |
| Kuwait | 1.02 | 0.79 | 0.82 | 0.77 | 0.74 | 0.98 | 0.82 | 5.12 | 14.54 | 11.99 | 13.54 | 12.52 | 12.25 | 16.61 | 12.59 | 80.51 | |
| Qatar | 0.99 | 0.73 | 0.71 | 0.8 | 0.73 | 0.97 | 0.78 | 4.91 | 14.04 | 12.26 | 12.74 | 13.85 | 12.38 | 16.64 | 12.39 | 80.44 | |
| UAE | 0.95 | 0.76 | 0.74 | 0.7 | 0.73 | 0.98 | 0.76 | 4.89 | 14.73 | 12.55 | 12.76 | 12.39 | 13.05 | 16.18 | 12.72 | 81.32 | |
| Saudi Arabia | 1.08 | 0.81 | 0.76 | 0.77 | 0.77 | 1.14 | 0.8 | 5 | 14.32 | 12.25 | 12.66 | 12.36 | 11.85 | 17.89 | 12.53 | 75.97 | |
| TPU | 1.8 | 1.51 | 1.46 | 1.44 | 1.5 | 1.76 | 2.49 | 9.47 | 13.6 | 11.54 | 11.96 | 10.94 | 11.05 | 15.13 | 13.81 | 74.22 | |
| TO | 6.88 | 5.4 | 5.3 | 5.22 | 5.28 | 6.8 | 4.86 | 39.74 | 85.51 | 72.56 | 75.71 | 72.69 | 71.88 | 96.65 | 75.75 | 550.73 | |
| Inc.Own | 8.09 | 6.21 | 6.12 | 6.02 | 6.01 | 7.94 | 7.36 | TCI | 101.49 | 85.94 | 89.25 | 86.54 | 84.92 | 114.54 | 89.56 | TCI | |
| Net | 1.76 | 0.17 | 0.18 | 0.31 | 0.39 | 1.8 | −4.61 | 5.68% | 7.82 | −8.02 | −4.81 | −7.75 | −9.45 | 20.68 | 1.52 | 76.70% | |
Disclaimer/Publisher’s Note: The statements, opinions and data contained in all publications are solely those of the individual author(s) and contributor(s) and not of MDPI and/or the editor(s). MDPI and/or the editor(s) disclaim responsibility for any injury to people or property resulting from any ideas, methods, instructions or products referred to in the content. |
© 2025 by the authors. Licensee MDPI, Basel, Switzerland. This article is an open access article distributed under the terms and conditions of the Creative Commons Attribution (CC BY) license (https://creativecommons.org/licenses/by/4.0/).
Share and Cite
Tabash, M.I.; Issa, S.S.; Mansour, M.; Saleh, M.W.A.; Rahrouh, M.; AlQeisi, K.; Al-Absy, M.S.M. Dynamic Shock-Transmission Mechanism Between U.S. Trade Policy Uncertainty and Sharia-Compliant Stock Market Volatility of GCC Economies. Risks 2025, 13, 56. https://doi.org/10.3390/risks13030056
Tabash MI, Issa SS, Mansour M, Saleh MWA, Rahrouh M, AlQeisi K, Al-Absy MSM. Dynamic Shock-Transmission Mechanism Between U.S. Trade Policy Uncertainty and Sharia-Compliant Stock Market Volatility of GCC Economies. Risks. 2025; 13(3):56. https://doi.org/10.3390/risks13030056
Chicago/Turabian StyleTabash, Mosab I., Suzan Sameer Issa, Marwan Mansour, Mohammed W. A. Saleh, Maha Rahrouh, Kholoud AlQeisi, and Mujeeb Saif Mohsen Al-Absy. 2025. "Dynamic Shock-Transmission Mechanism Between U.S. Trade Policy Uncertainty and Sharia-Compliant Stock Market Volatility of GCC Economies" Risks 13, no. 3: 56. https://doi.org/10.3390/risks13030056
APA StyleTabash, M. I., Issa, S. S., Mansour, M., Saleh, M. W. A., Rahrouh, M., AlQeisi, K., & Al-Absy, M. S. M. (2025). Dynamic Shock-Transmission Mechanism Between U.S. Trade Policy Uncertainty and Sharia-Compliant Stock Market Volatility of GCC Economies. Risks, 13(3), 56. https://doi.org/10.3390/risks13030056