Article

Dynamic Connectedness Among Key Financial Markets and the Role of Policy Uncertainty: A Quantile-Based Approach

by
Lumengo Bonga-Bonga
School of Economics, University of Johannesburg, Johannesburg 2006, South Africa
Risks 2025, 13(12), 228; https://doi.org/10.3390/risks13120228
Submission received: 15 October 2025 / Revised: 6 November 2025 / Accepted: 18 November 2025 / Published: 24 November 2025

Abstract

This paper investigates the return spillover dynamics among carry trade, stock, foreign exchange, and commodity markets to identify their roles as net transmitters or receivers of shocks under varying market conditions. Employing a Quantile Vector Autoregressive (QVAR) framework within the network-connectedness approach, the analysis captures asymmetric and state-dependent relationships across these markets. In addition, the study examines the influence of U.S. monetary and economic policy uncertainties on the total return spillovers among these markets across different market regimes, using the quantile-in-causality technique. The empirical results reveal that market influence shifts with changing conditions, while total interconnectedness intensifies during periods of elevated uncertainty, particularly throughout the bear market with the total connectedness index reaching 69.97%. Moreover, U.S. Monetary Policy Uncertainty (MPU) exerts varying effects on total connectedness depending on the prevailing market regime, with a pronounced effect at 0.50 quantile, representing stable market regime with no effect at extreme market conditions. These findings offer valuable insights for policymakers and investors, especially regarding the timing of asset allocation and investment decisions under different states of market uncertainty.

1. Introduction

The increasing integration of global financial markets has intensified the transmission of shocks, information, and contagion effects across asset classes (Wu and Wang 2025; Buraschi and Tebaldi 2024; Georg 2013). This growing interconnectedness has transformed the behaviour of investors and amplified systemic vulnerabilities, particularly through speculative strategies such as currency carry trades. A carry trade involves borrowing in a low-yielding currency to invest in a higher-yielding one, thereby exploiting deviations from Uncovered Interest Parity (UIP) (Pavlova and De Boyrie 2014). However, contrary to UIP theory, empirical evidence shows that high-yield currencies tend to appreciate rather than depreciate—a persistent “forward premium puzzle” (Suh 2019). While profitable, these positions expose global markets to abrupt reversals, as the unwinding of trades during episodes of heightened uncertainty can trigger sharp exchange rate fluctuations and broader financial instability.
Understanding how policy uncertainty interacts with carry trade dynamics is increasingly vital in an era marked by frequent global shocks and tightening monetary cycles. Both Economic Policy Uncertainty (EPU) and U.S. Monetary Policy Uncertainty (MPU) play pivotal roles in shaping investors’ expectations, risk perceptions, and cross-asset capital flows (Awosusi 2025; Husted et al. 2020). However, the extent to which these uncertainties influence the interconnectedness among carry trade, stock, commodity, and foreign exchange markets remains insufficiently understood—particularly when market conditions shift nonlinearly across bull, bear, and normal regimes. Examining this nexus is essential for revealing how policy-driven uncertainty amplifies or dampens cross-asset linkages, alters the direction and intensity of contagion, and redefines the scope for portfolio diversification in globally integrated financial systems.
Although several studies have examined financial market spillovers (e.g., Fung et al. 2013; Abankwa and Blenman 2021; Wu et al. 2023; Nefzi and Melki 2023), most assume homogeneous transmission mechanisms over time. Recent works using time-varying parameter VAR (TVP-VAR) models (e.g., Kocaarslan 2024) offer useful insights but fail to capture nonlinearities and asymmetries that emerge across market regimes. Moreover, empirical analyses of EPU and MPU effects on global asset linkages seldom integrate regime-dependent connectedness or consider how policy uncertainty drives heterogeneous responses during stress episodes such as the COVID-19 pandemic.
This paper addresses these shortcomings by exploring how U.S. Monetary Policy Uncertainty and Economic Policy Uncertainty influence the interconnectedness among carry trade, stock, foreign exchange, and commodity markets across different market regimes. Using a Quantile Vector Autoregression (QVAR) within the Diebold and Yilmaz (2009, 2012) connectedness framework, the study assesses how the magnitude and direction of return spillovers evolve from lower (bear) to upper (bull) quantiles, providing a richer view of asymmetric and nonlinear interdependence.
The key contributions of this paper are threefold. First, through a quantile-based spillover approach, the study combines Quantile Vector Autoregressive (QVAR) modelling with connectedness analysis to capture how spillovers vary across market states between carry trade, stock, commodity, and foreign exchange markets, thereby uncovering asymmetric transmission channels that conventional linear models often overlook. Second, it offers a novel integration of uncertainty and regime dynamics by jointly examining U.S. Monetary Policy Uncertainty (MPU) and Economic Policy Uncertainty (EPU) as drivers of regime-dependent connectedness across major financial markets. Third, it provides a detailed identification of net transmitters and receivers by quantifying how different asset classes—carry trade, stock, foreign exchange, and commodity markets—alternately act as sources or absorbers of shocks under varying market regimes.
The remainder of the paper is structured as follows. Section 2 reviews the related literature, Section 3 outlines the methodology, Section 4 discusses the data and empirical results, and Section 5 concludes.

2. Literature Review

Understanding how shocks propagate across global financial markets has been a central concern in financial economics, particularly in the context of increasing globalisation, capital mobility, and policy uncertainty. This section critically reviews the evolving literature on financial market connectedness, carry trade interdependencies, policy uncertainty, and regime-dependent spillovers, highlighting how methodological innovations have shaped current knowledge and where gaps remain.

2.1. Evolution of Financial Market Connectedness

The literature on financial market connectedness has evolved from static correlation models to dynamic, system-based approaches that quantify how shocks transmit across asset classes. The seminal contribution of Diebold and Yilmaz (2009, 2012) introduced the Generalised Forecast Error Variance Decomposition (GFEVD) and the Total Connectedness Index (TCI), providing a benchmark for directional spillover measurement. Later extensions incorporated time variation and frequency-domain analysis (Baruník and Křehlík 2018), revealing that connectedness fluctuates across short-, medium-, and long-term horizons.
More recently, studies have advanced toward quantile-based and network approaches that capture tail dependence and asymmetric responses. For instance, Ando et al. (2018) developed the Quantile Connectedness framework to examine how extreme shocks alter network topology, while Oliyide et al. (2023) and Kocaarslan (2024) extended this to assess time–frequency–quantile dynamics under uncertainty. Despite these advancements, much of the literature remains focused on linear or symmetric spillovers, overlooking the nonlinear adjustments that arise during periods of economic stress or policy shifts.

2.2. Carry Trades and Cross-Market Interdependencies

Carry trade strategies form an important linkage between currency and broader financial markets, as they are sensitive to changes in global liquidity, interest rate differentials, and investor sentiment. Early studies such as Burnside et al. (2011) and Menkhoff et al. (2012) documented persistent deviations from Uncovered Interest Parity (UIP), while Fung et al. (2013) and Cheung et al. (2012) showed how carry trades transmit volatility to equity and commodity markets.
More recent evidence highlights that carry trade shocks propagate nonlinearly. Using an EGARCH–GVAR approach, Nefzi and Melki (2023) show that carry trade returns act as a major source of volatility spillovers during crises, while Wang et al. (2021) employ deep learning models to uncover structural breaks and nonlinear predictability in exchange rate returns. Yet, few studies extend this analysis to the joint behaviour of carry trades, stock indices, and commodities under shifting market regimes—a gap that limits understanding of systemic linkages during periods of high uncertainty.

2.3. Policy Uncertainty and Market Connectedness

Policy uncertainty has emerged as a dominant determinant of cross-market linkages. Kurov and Stan (2018) and Husted et al. (2020) demonstrate that monetary policy shocks can reshape co-movements among equities, oil, and exchange rates by altering expectations about growth and inflation. Aftab and Phylaktis (2022) show that the response of foreign exchange markets to monetary and economic policy uncertainties exhibits significant country-level heterogeneity, with the effects generally amplifying across most economies. Fasanya et al. (2021) assess the effect of U.S. economic policy uncertainty on the connectedness across oil and the most globally traded currency pairs. The authors find that this connectedness is driven by economic policy uncertainty around the lower and median quantiles. During the COVID-19 pandemic, Anyikwa and Phiri (2023) and Özçelebi and Kang (2024) showed that policy uncertainty heightened connectedness across markets, with commodities like gold and silver emerging as safe-haven assets.
While the literature establishes that policy uncertainty influences financial dynamics, most studies examine MPU and EPU in isolation or rely on linear models that cannot capture asymmetric and nonlinear effects. There remains limited empirical evidence on how these two forms of uncertainty jointly affect multi-market connectedness, particularly under changing market conditions.

2.4. Market Conditions and Regime-Dependent Spillovers

Market behaviour is inherently regime-dependent. Frijns et al. (2008) and Lee and Chang (2013) first demonstrated that contagion intensifies during bear markets due to rising risk aversion. Recent research by Reboredo et al. (2021), Oliyide et al. (2023), and Kocaarslan (2024) confirms that connectedness strengthens under stress conditions but weakens in tranquil periods. However, most of these studies treat market states as exogenous or static, rather than endogenously varying across quantiles. As a result, they overlook how spillovers evolve nonlinearly when investor sentiment and liquidity conditions shift abruptly.
Current evidence thus reveals two major gaps. First, the interaction between policy uncertainty and regime-dependent spillovers remains underexplored. Second, existing models rarely unify MPU, EPU, and multi-market connectedness within a single nonlinear framework capable of distinguishing between bull, bear, and normal regimes. Addressing these gaps is essential to understand how policy-driven uncertainty influences global systemic linkages and contagion dynamics.
Little is known about how U.S. policy uncertainties jointly affect the regime-dependent connectedness among carry trade, stock, commodity, and foreign exchange markets. By employing a quantile-based network framework, this study advances the literature by capturing asymmetric spillovers and nonlinear transmission channels across market conditions.

3. Methodology

The aim of this study is to investigate the extent of return spillover dynamics between the carry trade and the three main financial markets by adopting the quantile connectedness approach. Furthermore, the study aims to investigate the impact of policy uncertainties on the total spillovers of the markets.
Following Ando et al. (2018), the quantile VAR methodology is used to derive the dynamic forecast error variance decomposition to construct the spillover index and connectedness among key variables. The steps that follow in the construction of the spillover index measures start with the quantile model expressed as
Q τ y t F t 1 = c τ + k = 1 p   A k τ y t k + u t ( τ )  
where y t = y 1 t , , y N t is the returns of the key financial market assets analysed in this paper. For quantile level τ ( 0,1 ) , the τ -th conditional quantile of y t is modelled as a V A R ( p ) in Equation (1). A k ( τ ) are coefficients allowing heterogeneity across τ .
The moving average representation that allows for deriving the forecast error variance decomposition is expressed as:
y t = μ ( τ ) + h = 0   Φ h ( τ ) u t h ( τ ) , Φ 0 ( τ )
where Φ h ( τ ) are obtained by inverting A ( L , τ ) .
Following the generalised forecast error variance decomposition (GFEVD) obtained from Equation (2), the H -step share of the forecast error variance of variable i due to shocks in variable j is
θ i j H ( τ ) = σ j j 1 ( τ ) h = 0 H 1     e i Φ h ( τ ) Σ ( τ ) e j 2 h = 0 H 1     e i Φ h ( τ ) Σ ( τ ) Φ h ( τ ) e i
where e i is the i -th selection vector and σ j j ( τ ) is the j -th diagonal element of Σ ( τ ) . Row-wise normalisation gives
j = 1 N   θ i j H ( τ ) = 1
Ando et al. used the above equation to build quantile connectedness network measures. Such as:
(i) Total Connectedness Index (TCI):
T C I ( H ) ( τ ) = 100 × i j     θ ` i j ( H ) ( τ ) N
(ii) Directional “From Others” (to):
C i ( H ) ( τ ) = 100 × j i θ i j H ( τ )   .
(iii) Directional “To Others” (from):
C i ( H ) ( τ ) = 100 × j i   θ i j H ( τ )
(iv) Net Directional Connectedness (transmitter + / receiver −):
N E T i ( H ) ( τ ) = C i ( H ) ( τ ) C i ( H ) ( τ )
(v) Pairwise Net Connectedness (between i and j):
N P i j ( H ) ( τ ) = 100 × ( θ H ( τ ) θ i j H ( τ )
The last step of the analysis uses the causality-in-quantile to assess the distributional effect of policy uncertainty (EPU and MPU) on total connectedness index or spillover among carry trade, stock, foreign exchange and commodity markets.
Building upon the QAR framework, the causality-in-quantiles methodology was developed by Balcilar et al. (2016) to test for Granger causality not just in the mean, but across the entire conditional distribution of a variable. This test is crucial for detecting causality that may be absent on average but is present during specific market states, such as bull/bear markets or periods of high/low volatility.
Let Y t be the variable of interest and X t be the potential causal variable. The test examines if X t Granger-causes Y t at a specific quantile τ .
The null hypothesis of no Granger causality from X to Y at quantile τ is:
H 0 : Q Y t τ I t 1 = Q Y t τ I t 1 X t 1 , , X t p
This equation states that the τ -th conditional quantile of Y t remains unchanged whether we include or exclude the lagged values of X t in the information set I t 1 .

4. Data and Empirical Analysis

4.1. Data Description, Sources and Statistics

For the purpose of this study, four weekly indices covering the period from November 2015 to October 2023 were retrieved from Thomson Reuters Datastream to represent the key segments of the global financial market. These include the Morgan Stanley Capital International (MSCI) Index, which serves as a broad measure of global equity market performance; the Diapason Commodity Index (DCI), which captures aggregate movements in the international commodity market; and the EUR/USD exchange rate, representing the relative strength between two of the world’s leading economies and serving as a proxy for global currency market dynamics. Carry trade performance (Carry trade) is measured using the SGI FX G10 Carry Trade Index, developed by Société Générale, which captures the return profile of a strategy that takes long positions in the three highest-yielding and short positions in the three lowest-yielding G10 currencies based on short-term interest rate differentials. The index is equally weighted, rebalanced monthly, and constructed with daily rolling of forward contracts to isolate the carry component from spot exchange rate movements. Its use is well established in the literature as a representative measure of institutional carry trade activity and its sensitivity to global shocks (Burnside et al. 2011; Menkhoff et al. 2012).
By employing these key and globally representative financial market indicators, the study seeks to examine the extent and nature of interconnectedness among the major financial markets worldwide. This approach provides a comprehensive perspective on how shocks or fluctuations originating in one market segment—such as equities, commodities, or foreign exchange—can transmit to others, thereby revealing patterns of global financial integration and contagion.
In the second stage of the study, the Monetary Policy Uncertainty (MPU) and Economic Policy Uncertainty (EPU) indexes, sourced from https://www.policyuncertainty.com/ (accessed on 20 July 2025), are incorporated. The purpose of this stage is to assess the individual impacts of monetary and economic policy uncertainty on the total connectedness or spillover among these key financial markets. These indices are critical measures of risk sentiment, particularly during periods of heightened uncertainty.
As the policy uncertainty indices are available on a monthly basis, the frequency of the financial asset data was transformed into a monthly format for consistency. The sample period for both datasets spans from November 2015 to October 2023, which includes the significant market turbulence associated with the COVID-19 pandemic and other global crises.
Table 1 reflects the descriptive summary of the key financial market returns. Starting with carry trades and the financial markets, all the variables recorded sharp declines in returns due to the effects of the COVID-19 pandemic. Carry trade recorded a minimum of −3.53% in returns which was likely due to investors pulling out of riskier assets during confirnthe pandemic, the forex market noticed a −3.77% decline in likely due to the weakening of the Euro or the strengthening of the USD as a safe haven for investors, stock markets experienced extreme declines of −13.30% which was likely due to the stock market crashes of March 2022 during the peak of the pandemic and the commodity market with extreme lows of −11.44% which was likely caused by the crash in oil prices and other commodities during the time when global demand plummeted due to the COVID-19 restrictions and laws. On average, all the variables recorded positive returns, although very close to zero. During favourable market conditions, the stock and commodity markets had the highest returns of 10.42% and 8.34%, respectively, possibly due to recovery from the COVID-19 crisis. Carry Trade, MSCI, and DCI have negative skewness, meaning their distributions are left-skewed with a tendency for extreme negative returns. EURUSD has near-zero skewness, indicating a roughly symmetric distribution of returns. Carry Trade and EURUSD have low kurtosis (platykurtic), indicating fewer extreme values and thinner tails than a normal distribution. MSCI has high kurtosis (leptokurtic), suggesting fat tails and a higher likelihood of extreme outliers. DCI has kurtosis close to 3, indicating it is nearly normal, with slightly fewer extreme values than a normal distribution. All variables deviate from normality, but the deviation is most significant for MSCI (due to high kurtosis) and DCI. Carry Trade and EURUSD also reject normality but with smaller deviations.
Table 2 provides the results of the unit root tests using ADF. These results denote rejection of the null hypothesis of a unit root, showing that these series are stationary.

4.2. Quantile Connectedness Spillover

Table 3, Table 4 and Table 5 present the results of the spillover index based on the QVAR model and dynamic forecast error variance decomposition from Equations (1)–(4), showing the three main market conditions: bull, stable and bearish markets, represented by the 90th, 50th and 10th quantiles, respectively. The lag of unity in the QVAR model was selected using Akaike Information Criteria (AIC). The paper uses a 1 -step-ahead GFEVD following Bonga-Bonga and Khalique (2025).
The values in the table indicate how much each of the markets contributes to or receives from others, and they identify whether each market is a net receiver or net transmitter of the return spillovers. The diagonal values show how much the market’s own forecast error variance is determined by its own past, representing the degree to which each market is self-connected and self-dependent. Off-diagonal return spillovers examine the degree to which each of the markets contributes to the variance of other markets. Higher values, therefore, indicate stronger spillover effects and lower values indicate that the market is not heavily impacted by the other, or itself (Diebold and Yilmaz 2009).
In a bull market represented in Table 3, MSCI and DCI become highly dependent on external factors. More than half of their variability, 42.69% and 44.69%, respectively, is explained by spillovers from other markets, reflecting the interconnectedness of global stock markets and the dynamic connectedness index during favourable conditions. However, both MSCI and DCI play a crucial role as net transmitters of shocks, with a net transmission of 8.77% for DCI and 6.10% for MSCI, the global stock market. The rationale of this outcome is that in expansions or bullish regimes, growth and earnings surprises are impounded first into equities and cyclical commodities. The better performance of the equity market and high demand for commodities make these two market originators of shocks that are transmitted to the foreign exchange or currency as a reflection of the health of the economy. Moreover, as the Carry trade market benefits from this expansionary sentiment and the rise in the stock market through the reduction of global volatility (Bonga-Bonga and Rangoanana 2022), carry trade and currency markets are the net receivers in this system during a bullish market.
Table 4 shows that all the markets act as net receivers of shocks except the currency market (EURUSD). This reality may be explained by the fact that in standard economic regimes, demand for currency is primarily guided by functional economic behaviour such as routine transactions, risk management, and portfolio diversification. These functions affect the stock market through risk management, especially asset diversification. Also, the demand for currency for transactional motives affects the commodity market. This reality explains why the commodity market (DCI) and stock market (MSCI) are net receivers of shocks while the currency market is the net transmitter. The carry trade market is the net receiver, especially of shocks from the currency market, as the carry trade strategy depends on the value of the currency of the funding countries, like the U.S. and European countries.
During bear markets, financial stress in the stock and commodity markets is rapidly transmitted to the currency and carry trade markets. This reality occurs primarily because declining investor confidence and increased uncertainty reduce demand for foreign exchange driven by real economic activity, such as trade and investment. As business activity slows, the transactional demand for currency weakens. Simultaneously, heightened market volatility undermines the profitability of carry trade strategies, which depend on stable interest rate differentials and low risk. Investors tend to unwind these trades during elevated uncertainty, triggering abrupt capital outflows from high-yield currencies. As a result, stock and commodity markets function as net transmitters of shocks, while currency and carry trade markets become net receivers. This outcome reflects the directional flow of volatility and risk aversion across asset classes, where market instability in equities and commodities spills over into foreign exchange dynamics.
Another important observation from Table 3, Table 4 and Table 5 is the variation in the Total Connectedness Index (TCI) across different market regimes. The TCI, which measures the proportion of total forecast error variance attributable to cross-market spillovers, is highest during the bear market at 69.97%, compared to 67.16% in the bull market and 44.23% in the normal market. This pattern indicates that market interconnectedness intensifies significantly during financial stress, reflecting heightened systemic vulnerability (Yao et al. 2020; Long et al. 2024). In bear markets, investors’ collective responses to risk—including asset sell-offs, liquidity reallocation, and volatility shocks—tend to propagate more strongly across asset classes. The lower TCI in normal conditions suggests more contained and idiosyncratic market behaviour, where shocks are largely absorbed within individual markets rather than spreading system wide.
Figure 1 illustrates the dynamic relationships detailed in Table 3, Table 4 and Table 5, highlighting how the roles of net transmitters and receivers of shocks evolve across the commodity, carry trade, global stock, and currency markets under varying market conditions. The figure captures how these inter-market linkages shift in response to economic sentiment, volatility, and risk changes. For example, during market stress or bear phases, equity and commodity markets often emerge as dominant transmitters of shocks, while the currency and carry trade markets primarily absorb these disturbances. Conversely, in more stable or bullish environments, the flow of shocks may become more balanced or even reverse in direction. This visualisation underscores the systemic interconnectedness of global financial markets and the conditional nature of shock propagation across different asset classes.

4.3. Dynamic Total Connectedness and Spillover Among Key Financial Markets

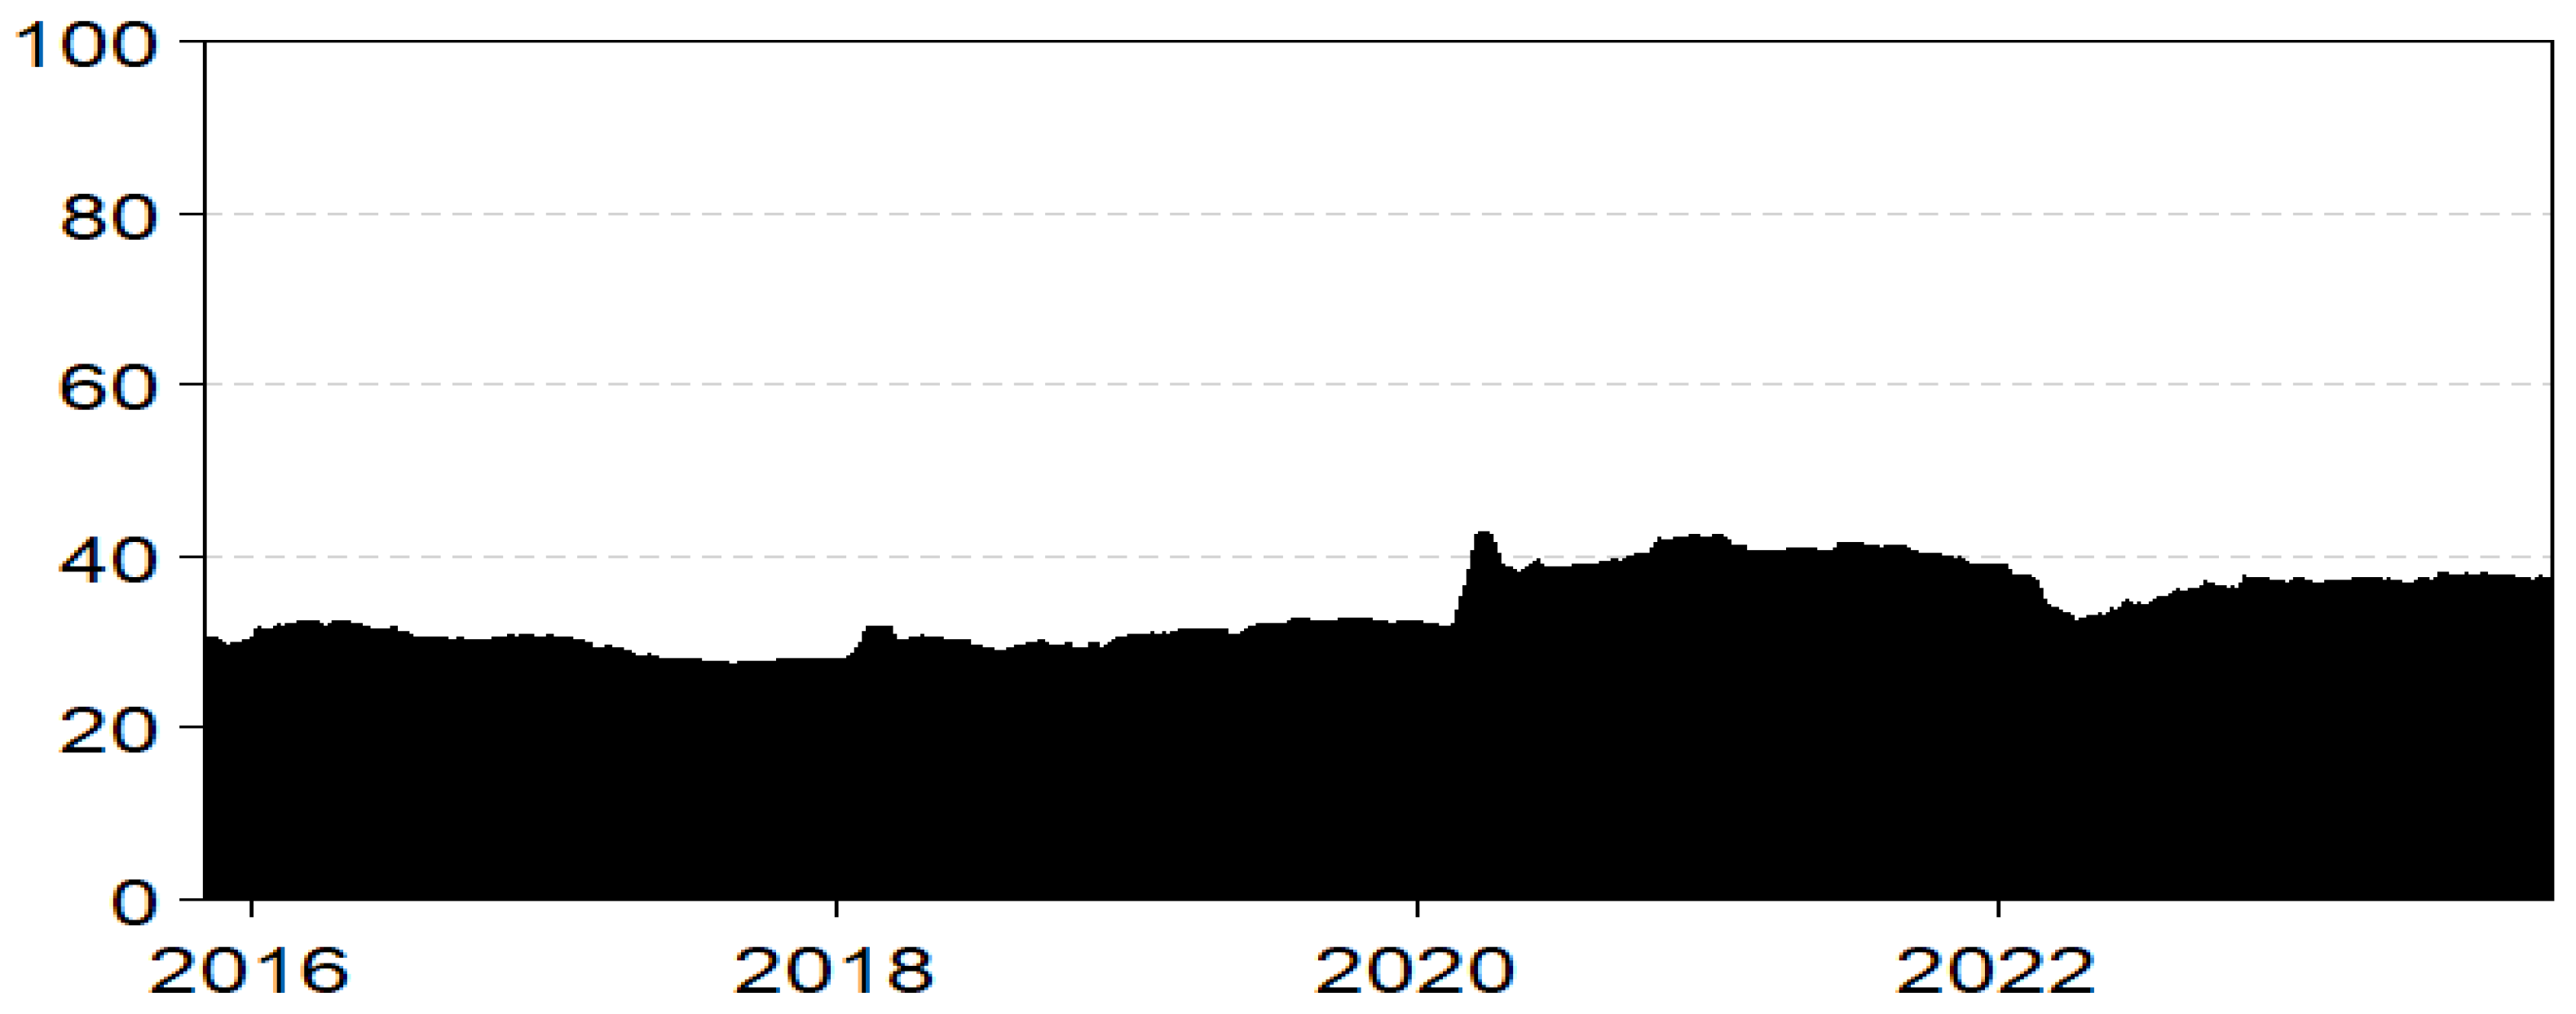
To assess the overall dynamic total connectedness index among the global stock, currency, carry trade, and commodity markets, the study computes the rolling window FEVD based on time-varying parameter (TVP)-VAR. The outcome of this dynamic TCI is reported in Figure 2.
Figure 2 shows the dynamic TCI over the observed timeframe. From 2016 to 2020 (pre-COVID-19 pandemic), the TCI remained stable, fluctuating below 40% suggesting that the interdependence of the markets is moderate under more stable market conditions. From early 2020 to early 2022, the global economy faced the pandemic, COVID-19, which caused a sharp spike in the TCI due to the investor uncertainties caused by the turbulence of the pandemic, leading to high spillovers between these markets. TCI reached its highest levels, exceeding 40% during this time, suggesting that the markets were highly interconnected during the pandemic. These findings are consistent with Nefzi and Melki (2023), although their focus was primarily on the volatility spillovers and not necessarily the returns. The sustained higher levels of TCI post-2020 and its elevated effect in 2022 after a short attempt to decrease signal elevated geopolitical risk with the Russian invasion of Ukraine and the Israel-Palestine conflicts of late 2023.
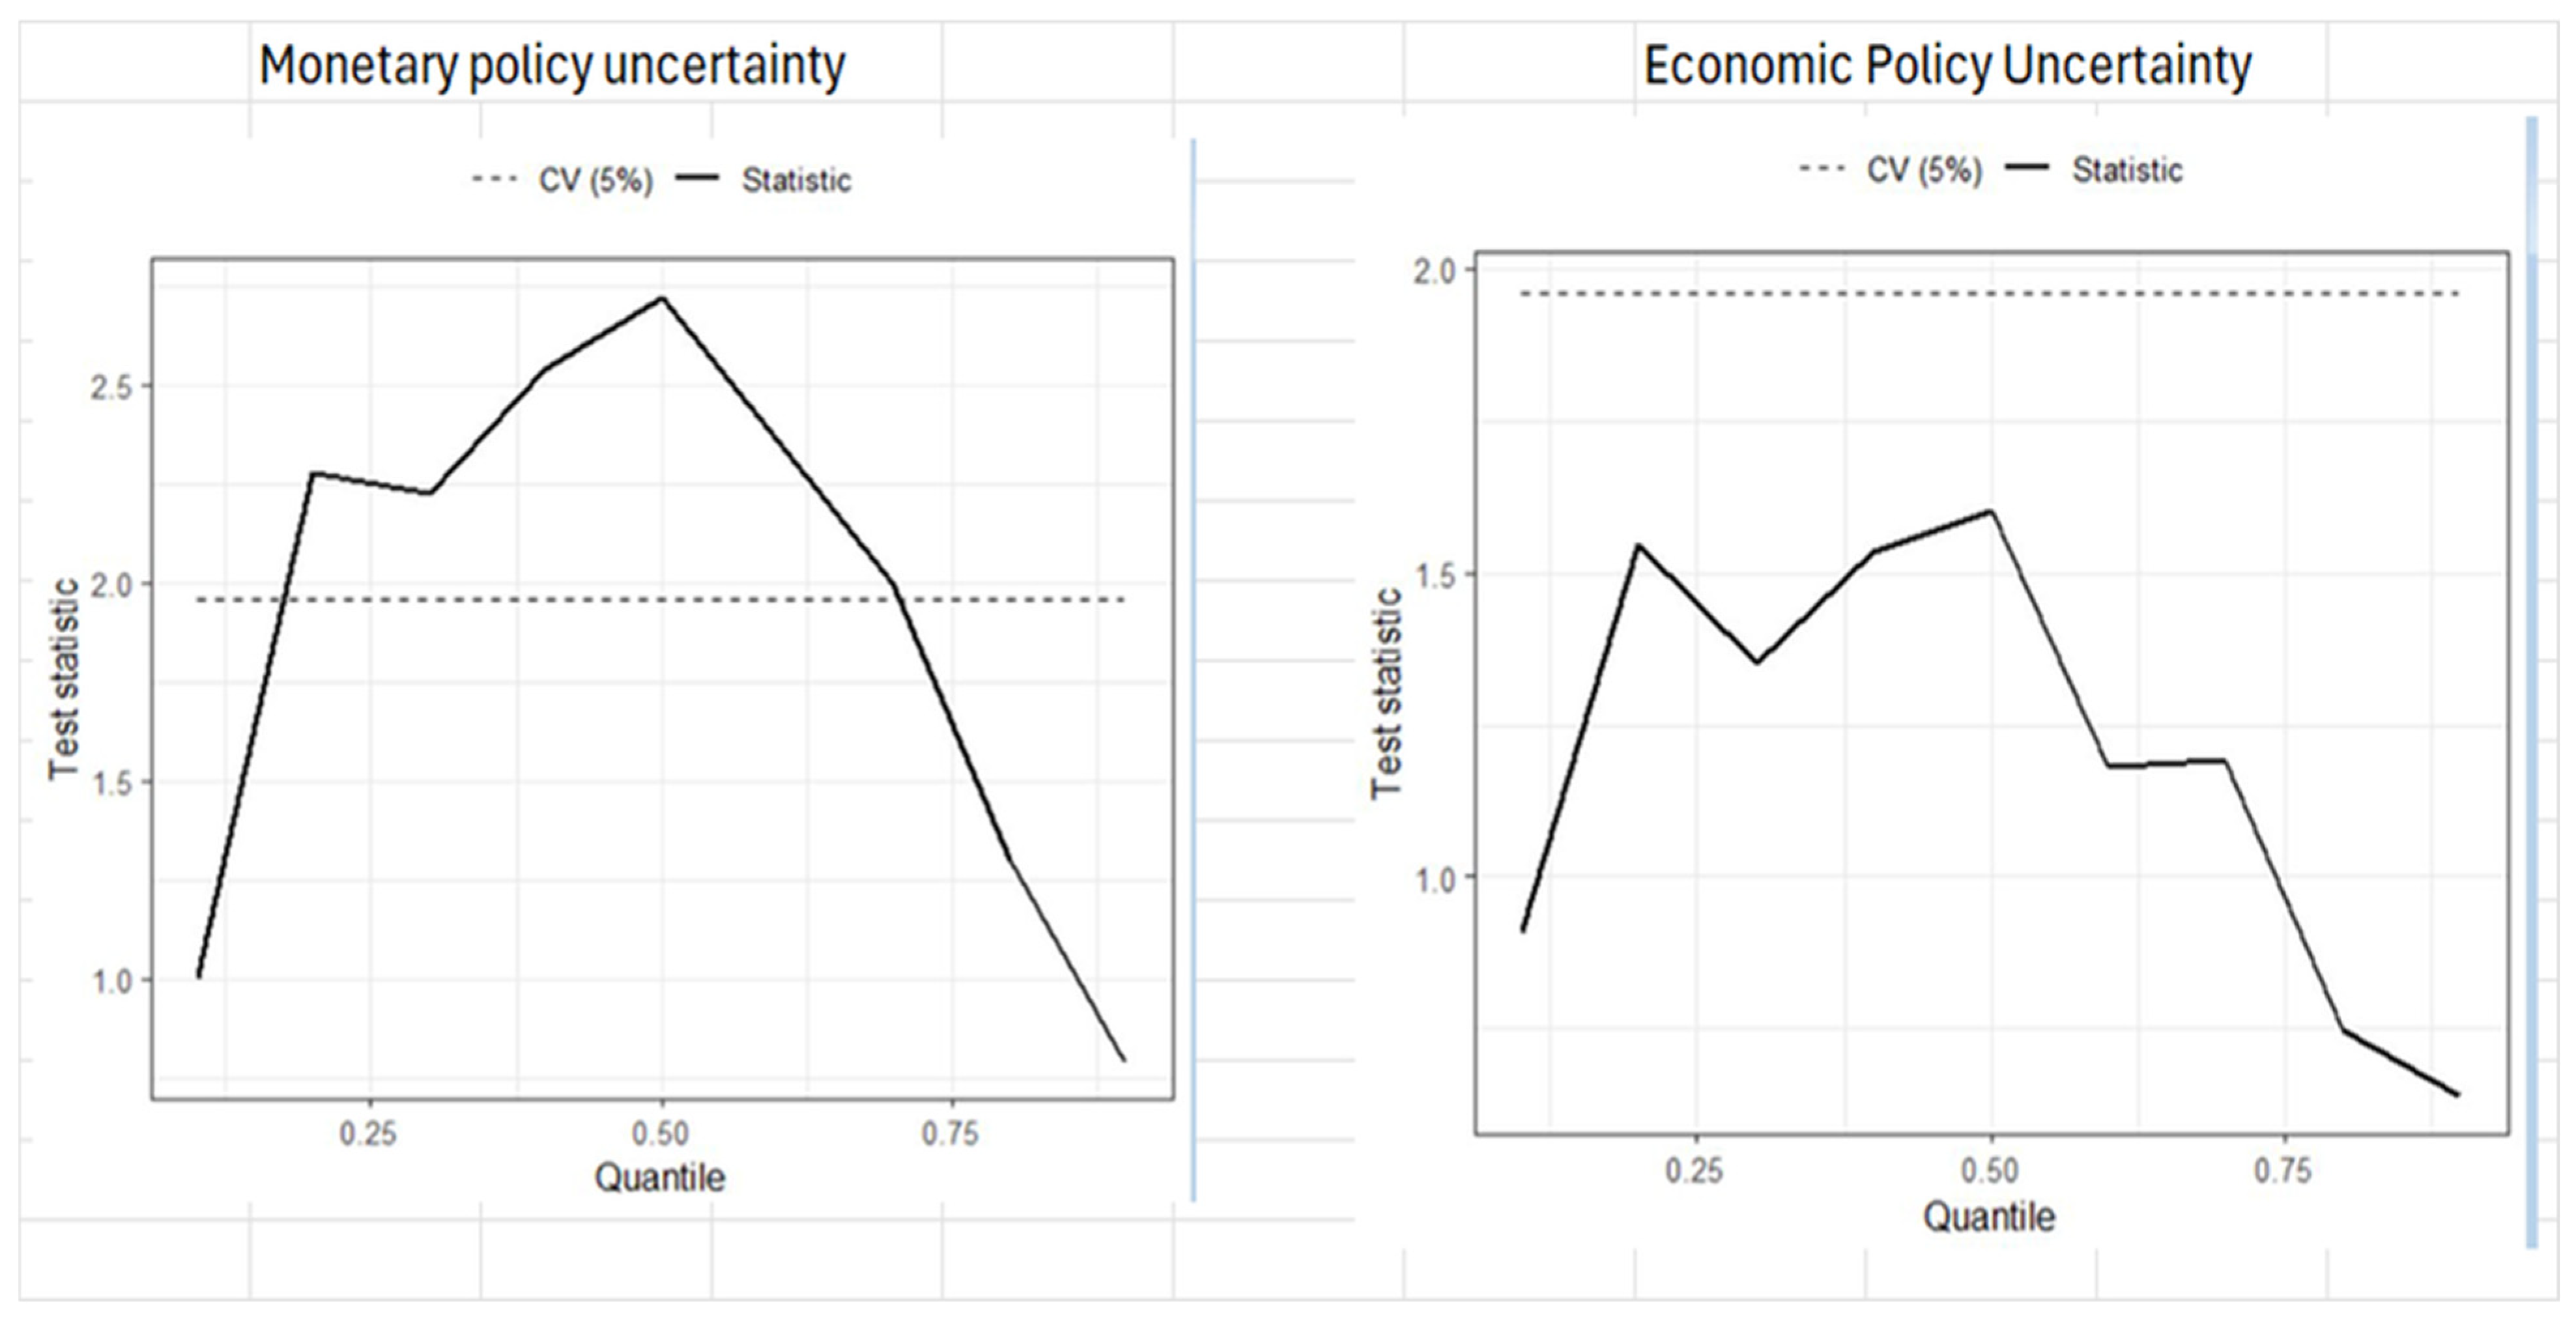
The last analysis of this paper attempts to assess the impact of monetary policy and economic policy uncertainties on the total connectedness index or return spillover among the currency, carry trade, global stock, and commodity markets. To this end, the paper used causality-in-quantile methodology to capture its distributional causality.
Within the U.S. context, these policy-uncertainty measures capture distinct sources of ambiguity that may transmit to financial markets. MPU reflects uncertainty about the Federal Reserve’s future policy path (interest rates, QE, balance-sheet actions) and is typically proxied by media-based indices that count articles referencing monetary-policy uncertainty in major newspapers. EPU is a broader construct (Baker et al. 2016), combining newspaper coverage of policy uncertainty, the share of tax code provisions scheduled to expire, and dispersion in professional macroeconomic forecasts.
Given that the TCI is based on weekly observations while policy uncertainty variables are available at a monthly frequency, the TCI series was converted to a monthly frequency by averaging the weekly observations within each month. The estimation results for Equation (10) are reported in Figure 3.
Before interpreting these results, it is important to note that the results of the quantile spillovers reported and discussed above show that TCI is higher during the bear market, noting contagion effects. It is lower during standard times and increases during a boom market. Figure 3 results are interpreted based on this reality.
Figure 3 shows that monetary policy uncertainties affect TCI during specific market conditions, while economic policy uncertainty does not Granger-cause TCI. This outcome shows the importance of a specific monetary policy in affecting financial market outcomes compared to a broader and general policy, such as economic policy. Many studies allude to the impact of monetary policy and its uncertainties on the financial market (Bonga-Bonga and Kabundi 2011; Luo et al. 2024; Dinh et al. 2025). Specifically, the results of how monetary policy uncertainty Granger causes the total return spillover among the key financial markets show that at a lower quantile of the TCI, the stable and quiet regime, any monetary policy uncertainty does not affect the total spillover. The core idea of this outcome is that during calm periods, markets are driven by fundamental, long-term factors, making them less sensitive to short-term U.S. policy noise (Eichholtz et al. 2015). The results in Figure 3 show that monetary policy uncertainty affects TCI in the middle regime, which represents the bull regime in the context of TCI. This reality may be explained by the fact that during bull regimes, investors are sensitive to noises that could cause the bubble to burst and reallocate their portfolio, which causes spillover between the market and assets. Studies show that in a bull market, the primary driver is greed and the fear of missing out (FOMO) (Baker and Wurgler 2007; Bekaert et al. 2005). However, this greed exists alongside a deep-seated, underlying anxiety that the exuberance will end. This reality creates a psychological environment where investors become hyper-vigilant to any sign of trouble or noise, no matter how small. Lastly, the results reported in Figure 3 show that monetary policy uncertainty does not affect the total return spillover among key financial markets during the bear market. The central idea is that a pervasive systemic fear factor or crisis catalyst dominates investor behaviour and market dynamics during a bear market. At this stage, markets are already characterised by heightened risk aversion, liquidity constraints, and synchronised asset sell-offs. Consequently, the specific impact of monetary policy uncertainty becomes marginal, as the broader market-wide distress overshadows its transmission channels. In other words, the spillover channels are already saturated, leaving little room for additional shocks from policy uncertainty to exert incremental influence.
The absence of a Granger-causal relationship between Economic Policy Uncertainty (EPU) and the Total Connectedness Index (TCI) may be attributed to the broad and aggregated nature of EPU, which captures a wide range of fiscal, trade, and regulatory uncertainties rather than the targeted and transmission-sensitive nature of monetary policy uncertainty. EPU, by construction, reflects the general policy environment and political discourse (Baker et al. 2016), but its impact on financial connectedness may be diluted when compared to more specific uncertainty measures such as Monetary Policy Uncertainty (MPU), which directly affects interest rate expectations, discount rates, and intertemporal portfolio decisions (Husted et al. 2020; Istrefi and Mouabbi 2021).
The findings of this paper offer valuable insights for investors and portfolio managers with exposure to the four major global markets—the stock, commodity, currency, and carry trade markets. The results enhance understanding of the mechanisms through which shocks are transmitted across these interconnected markets and how the intensity and direction of spillovers vary under different market conditions, such as bull, bear, and typical phases. Furthermore, the study provides critical evidence on how uncertainty surrounding key U.S. policy domains—particularly monetary, fiscal, and financial regulation policies—can influence the magnitude and persistence of these spillovers. Given the pivotal role of the United States in the global financial system, such insights are essential for anticipating cross-market contagion, managing portfolio risk, and formulating effective hedging and diversification strategies.

5. Conclusions and Policy Recommendations

5.1. Conclusions

The paper examined how return spillovers propagate among four core segments of global finance—carry trade, equities (MSCI), foreign exchange (EUR/USD), and commodities (DCI)—and how these linkages vary across market states using a Quantile VAR (QVAR)–based connectedness framework. Moreover, by mapping total connectedness or return spillover among these key markets, the paper assessed how the U.S. policy-uncertainty measures (MPU and EPU) affect this total connectedness in different market conditions.
The paper finds that interdependence is regime-dependent and intensifies under stress: the Total Connectedness Index (TCI) peaks in bear markets (≈70%), is elevated in bull markets (≈67%), and is lowest in normal times (≈44%). This pattern signals pronounced contagion and tighter cross-asset co-movements when risk aversion is high, with more idiosyncratic behaviour in tranquil periods.
Transmitter–receiver roles rotate with conditions. Equities (MSCI) and commodities (DCI) are net transmitters in bull phases. At the same time, carry trades and the currency market are net receivers, consistent with growth surprises priced first into cyclical assets. In standard regimes, the currency market (EUR/USD) becomes the main net transmitter—reflecting transactional, hedging, and portfolio-rebalancing functions—while MSCI, DCI, and carry trade are net receivers. In bear markets, MSCI and DCI dominate as transmitters as currencies and carry trades absorb shocks amid unwinds and heightened liquidity preference.
On the role of Policy uncertainties in affecting the TCI among the four markets, the paper finds that Monetary Policy Uncertainty (MPU) raises total connectedness most clearly in mid-quantiles associated with expansionary conditions. However, its incremental effect fades at extremes as system-wide stress dominates.

5.2. Policy Recommendations

The findings reveal that financial interconnectedness among carry trade, equity, commodity, and foreign exchange markets is regime-dependent and intensifies during bear markets, reflecting heightened contagion and systemic vulnerability under stress. Moreover, U.S. Monetary Policy Uncertainty (MPU) amplifies total connectedness, particularly during expansionary conditions, underscoring the sensitivity of global markets to shifts in U.S. policy communication and expectations. These results carry several important policy implications. First, policymakers should strengthen macroprudential frameworks by incorporating regime-dependent dynamics into stress testing and systemic risk monitoring. Counter-cyclical buffers and liquidity support mechanisms should be adjusted proactively during high-uncertainty or contractionary periods to contain contagion risks. Second, the significant effect of MPU highlights the need for clearer policy communication and forward guidance. Transparent and predictable monetary policy can mitigate uncertainty-driven volatility and reduce cross-asset co-movements. Third, regulators and international financial institutions should enhance cross-market and cross-border surveillance by adopting network-based connectedness indicators to detect emerging transmission hubs. Coordinated efforts between central banks and financial authorities can improve crisis response and limit the global spillovers of U.S. policy shocks. Finally, investors and asset managers should adopt state-contingent diversification and hedging strategies, recognising that portfolio correlations tighten in downturns.

Funding

This research received no external funding.

Data Availability Statement

The raw data supporting the conclusions of this article will be made available by the authors on request.

Conflicts of Interest

The author declares no conflict of interest.

References

  1. Abankwa, Samuel, and Lloyd P. Blenman. 2021. Measuring liquidity effects on carry trade across currencies and regimes. Journal of Multinational Financial Management 60: 100683. [Google Scholar] [CrossRef]
  2. Aftab, Muhammad, and Kate Phylaktis. 2022. Economic integration and exchange market pressure in a policy uncertain world. Journal of International Money and Finance 128: 102701. [Google Scholar] [CrossRef]
  3. Ando, Tomohiro, Matthew Greenwood-Nimmo, and Yongcheol Shin. 2018. Quantile Connectedness: Modelling tail behaviour in the topology of financial networks. Management Science 68: 23377–3174. [Google Scholar] [CrossRef]
  4. Anyikwa, Izunna, and Andrew Phiri. 2023. Connectedness and spillover between African equity, commodity, foreign exchange and cryptocurrency markets during the COVID-19 and Russia-Ukraine conflict. Future Business Journal 9: 48. [Google Scholar] [CrossRef]
  5. Awosusi, Abraham Ayobamiji. 2025. How do economic policy uncertainty, climate policy uncertainty and US monetary policy uncertainty shape investors’ sentiment in the green market? Applied Economics, 1–19. [Google Scholar] [CrossRef]
  6. Baker, Malcolm, and Jeffrey Wurgler. 2007. Investor sentiment in the stock market. Journal of Economic Perspectives 21: 129–52. [Google Scholar] [CrossRef]
  7. Baker, Scott R., Nicholas Bloom, and Steven J. Davis. 2016. Measuring Economic Policy Uncertainty. The Quarterly Journal of Economics 131: 1593–636. [Google Scholar] [CrossRef]
  8. Balcilar, Mehmet, Rangan Gupta, and Christian Pierdzioch. 2016. Does uncertainty move the gold price? New evidence from a nonparametric causality-in-quantiles test. Resources Policy 49: 74–80. [Google Scholar] [CrossRef]
  9. Baruník, Jozef, and Tomáš Křehlík. 2018. Measuring the frequency dynamics of financial connectedness and systemic risk. Journal of Financial Econometrics 16: 271–96. [Google Scholar] [CrossRef]
  10. Bekaert, Geert, Campbell R. Harvey, and Angela Ng. 2005. Market integration and contagion. Journal of Business 78: 39–69. [Google Scholar] [CrossRef]
  11. Bonga-Bonga, Lumengo, and Alain Kabundi. 2011. Monetary policy action and inflation in South Africa: An empirical analysis. African Finance Journal 13: 25–37. [Google Scholar]
  12. Bonga-Bonga, Lumengo, and Muhammad Khalique. 2025. The Dynamic Relationship Between Digital Currency and Other Financial Assets in Developed and Emerging Markets. International Journal of Financial Studies 13: 205. [Google Scholar] [CrossRef]
  13. Bonga-Bonga, Lumengo, and Sefora Motena Rangoanana. 2022. Carry trade and capital market returns in South Africa. Journal of Risk and Financial Management 15: 498. [Google Scholar] [CrossRef]
  14. Buraschi, Andrea, and Claudio Tebaldi. 2024. Financial contagion in network economies and asset prices. Management Science 70: 484–506. [Google Scholar] [CrossRef]
  15. Burnside, Craig, Martin Eichenbaum, and Sergio Rebelo. 2011. Carry trade and momentum in the currency market. Annual Review of Financial Economics 3: 511–35. [Google Scholar] [CrossRef]
  16. Cheung, Yan-Leung, Yin-Wong Cheung, and Angela W. W. He. 2012. Yen carry trades and stock returns in target currency countries. Japan and the World Economy 24: 174–83. [Google Scholar] [CrossRef]
  17. Diebold, Francis X., and Kamil Yilmaz. 2009. Measuring financial asset return and volatility spillovers, with application to global equity markets. The Economic Journal 119: 158–71. [Google Scholar] [CrossRef]
  18. Diebold, Francis X., and Kamil Yilmaz. 2012. Better to give than to receive: Predictive directional measurement of volatility spillovers. International Journal of Forecasting 28: 57–66. [Google Scholar] [CrossRef]
  19. Dinh, Le Quoc, Tran Thi Kim Oanh, and Nguyen Thi Hong Ha. 2025. Financial stability and sustainable development: Perspectives from fiscal and monetary policy. International Journal of Finance and Economics 30: 1724–41. [Google Scholar] [CrossRef]
  20. Eichholtz, Piet, Ronald Huisman, and Remco C. J. Zwinkels. 2015. Fundamentals or trends? A long-term perspective on house prices. Applied Economics 47: 3681–92. [Google Scholar] [CrossRef]
  21. Fasanya, O. Ismail, Oluwasegun B. Adekoya, and Abiodun M. Adetokunbo. 2021. On the connection between oil and global foreign exchange markets: The role of economic policy uncertainty. Resources Policy 72: 102110. [Google Scholar] [CrossRef]
  22. Frijns, Bart, Esther Koellen, and Thorsten Lehnert. 2008. On the determinants of portfolio choice. Journal of Economic Behaviour and Organisation 66: 373–86. [Google Scholar] [CrossRef]
  23. Fung, Hung-Gay, Yiuman Tse, and Lin Zhao. 2013. Are stock markets in Asia related to the carry trade? Pacific-Basin Financial Journal 25: 200–17. [Google Scholar] [CrossRef]
  24. Georg, Co-Pierre. 2013. The effect of the interbank network structure on contagion and common shocks. Journal of Banking and Finance 37: 2216–28. [Google Scholar] [CrossRef]
  25. Husted, Lucas, John Rogers, and Bo Sun. 2020. Monetary policy uncertainty. Journal of Monetary Economics 115: 20–36. [Google Scholar] [CrossRef]
  26. Istrefi, K., and S. Mouabbi. 2021. Subjective monetary policy uncertainty. European Economic Review 132: 103657. [Google Scholar]
  27. Kocaarslan, Baris. 2024. Dynamic spillovers between oil market, monetary policy, and exchange rate dynamics in the U.S. Finance Research Letters 69: 106137. [Google Scholar] [CrossRef]
  28. Kurov, Alexander, and Raluca Stan. 2018. Monetary policy uncertainty and the market reaction to macroeconomic news. Journal of Banking and Finance 86: 127–42. [Google Scholar] [CrossRef]
  29. Lee, Hsiu-Chuan, and Shu-Lien Chang. 2013. Spillovers of currency carry trade returns, market risk sentiment, and U.S. market returns. North American Journal of Economics and Finance 26: 197–216. [Google Scholar] [CrossRef]
  30. Long, Trinh Quang, Lan Hoang Nguyen, and Peter J. Morgan. 2024. Dynamic connectedness of financial stress across advanced and emerging economies: Evidence from time and frequency domains. The Singapore Economic Review 69: 751–91. [Google Scholar] [CrossRef]
  31. Luo, Changqing, Yi Qu, Yaya Su, and Liang Dong. 2024. Risk spillover from international crude oil markets: Evidence from extreme events and U.S. North American Journal of Economics and Finance 70: 102041. [Google Scholar] [CrossRef]
  32. Menkhoff, Lukas, Lucio Sarno, Maik Schmeling, and Anderas Schrimpf. 2012. Carry trades and global foreign exchange volatility. The Journal of Finance 67: 681–718. [Google Scholar] [CrossRef]
  33. Nefzi, Nourhaine, and Abir Melki. 2023. Volatility transmitter or receiver? Investigating dynamic connectedness between the carry trade and financial markets. Borsa Istanbul Review 23: 748–58. [Google Scholar] [CrossRef]
  34. Oliyide, Johnson A., Oluwasegun B. Adekoya, Mohamed Marie, and Mamdouh Abdulaziz Saleh Al-Faryan. 2023. Green finance and commodities: Cross-market connectedness during different COVID-19 episodes. Resources Policy 85: 103916. [Google Scholar] [CrossRef]
  35. Özçelebi, Oguzhan, and Oguzhan Kang. 2024. Extreme connectedness and network across financial assets and commodity futures markets. The North American Journal of Economics and Finance 69: 102099. [Google Scholar] [CrossRef]
  36. Pavlova, Ivelina, and Maria De Boyrie. 2014. Carry Trades and Sovereign CDS Spreads: Evidence from Asia-Pacific Markets. The Journal of Futures Markets 35: 1067–87. [Google Scholar] [CrossRef]
  37. Reboredo, Juan Carlos, Andrea Ugolini, and Jose Arreola Hernandez. 2021. Dynamic spillovers and network structure among commodity, currency, and stock markets. Resources Policy 74: 102266. [Google Scholar] [CrossRef]
  38. Suh, Sangwon. 2019. Unexploited currency carry trade profit opportunity. Journal of International Financial Markets, Institutions and Money 58: 236–54. [Google Scholar] [CrossRef]
  39. Wang, Xiao, Xiao Xie, Yihua Chen, and Borui Zhao. 2021. Machine learning approach to forecasting carry trade returns. Applied Economics Letters 29: 1199–204. [Google Scholar] [CrossRef]
  40. Wu, Baoxiu, and Qing Wang. 2025. Cross-asset contagion and risk transmission in global financial networks. The North American Journal of Economics and Finance 80: 102511. [Google Scholar] [CrossRef]
  41. Wu, Hao, Huiming Zhu, Fei Huang, and Weifang Mao. 2023. How does economic policy uncertainty drive time-frequency connectedness across commodity and financial markets? North American Journal of Economics and Finance 64: 101865. [Google Scholar] [CrossRef]
  42. Yao, Xiaoyang, Wei Le, Xiaolei Sun, and Jianping Li. 2020. Financial stress dynamics in China: An interconnectedness perspective. International Review of Economics and Finance 68: 217–38. [Google Scholar] [CrossRef]
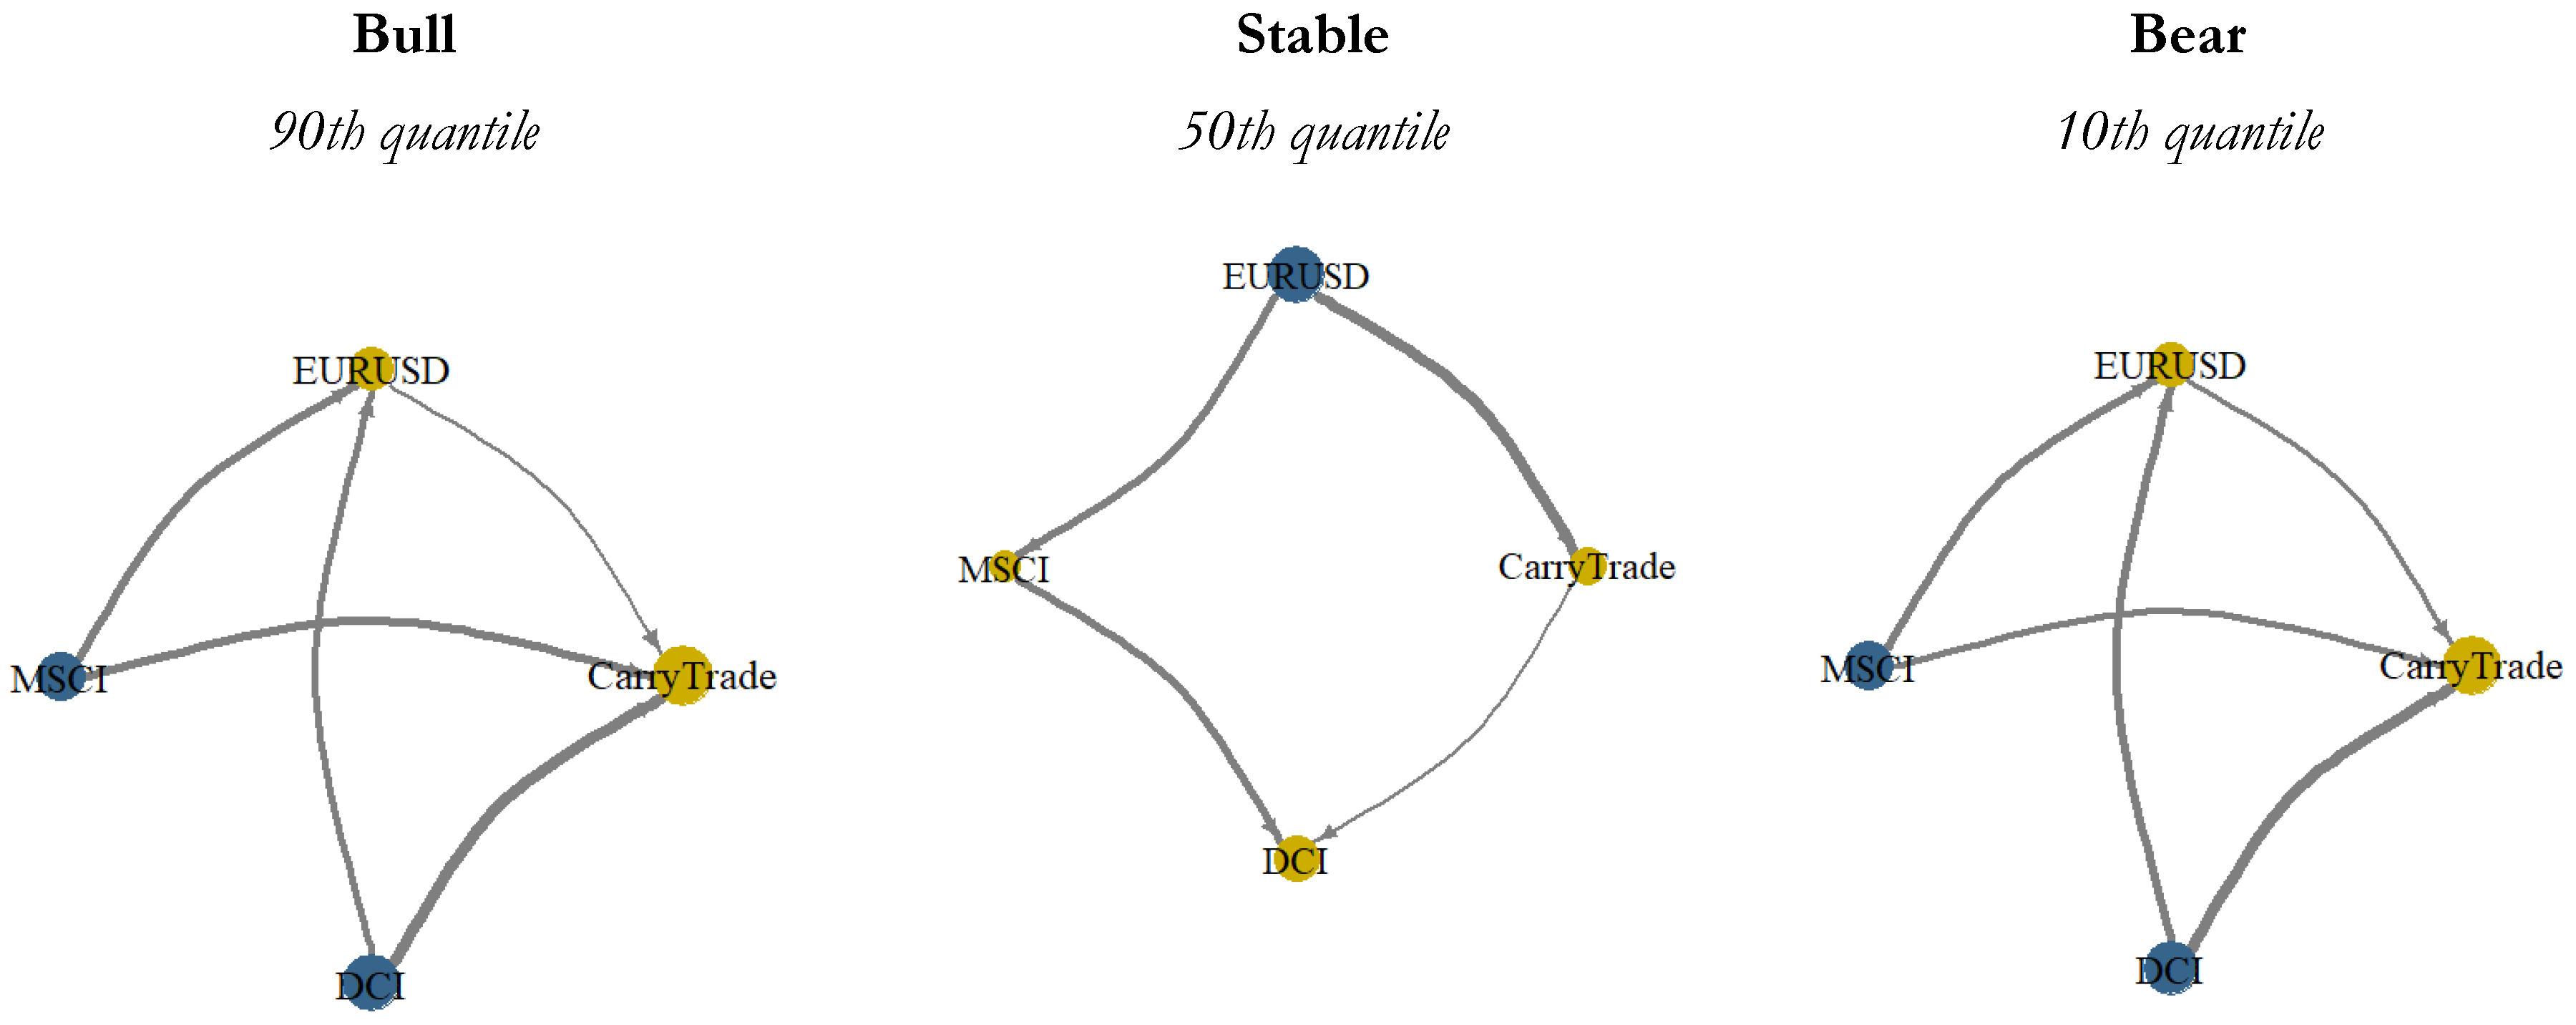
Figure 1. Connectedness Network Plots. Note: Net transmitters are represented in blue and net receivers in yellow.
Risks 13 00228 g001
Figure 2. Dynamic Total connectedness spillovers.
Risks 13 00228 g002
Figure 3. Quantile-in-causality between TCI and both monetary and economic policy uncertainties.
Risks 13 00228 g003
Table 1. Descriptive statistics.
Carry TradeEURUSDMSCIDCI
Min−3.538−3.771−13.29−11.43
Mean0.036−0.00260.1370.1142
Max2.7324.085910.4178.3353
Standard deviation0.91161.03422.36022.4650
Skewness−0.3160.0893−0.834−0.8122
Kurtosis0.64101.24416.90542.84627
JB test14.69828.675899.33191.97
Q(20)29.02722.2349.1125.893
Q(20) probability0.0870.1690.3280.981
Note: the reported probabilities of Q(20) show that the null hypothesis of no serial correlation is not rejected for all the variables.
Table 2. ADF Unit Root.
Variablet-Statistic
Carry trade−6.8873 ***
EUR/USD−6.5435 ***
MSCI−7.9685 ***
DCI−5.6478 ***
*** denotes rejection of the null hypothesis of unit root at 1% level.
Table 3. Spillover connectedness at 90th quantile (bull).
Carry TradeEUR/USDMSCIDCIFROM
Carry Trade63.086.4813.3217.1336.92
EURUSD4.6948.0525.5621.7051.95
MSCI9.8922.1742.6925.2557.31
DCI12.0618.7124.5444.6955.31
TO26.6447.3663.4164.08201.49
NET−10.29−4.596.108.7767.16/50.37
Table 4. Spillover connectedness at 50th quantile (normal).
Carry TradeEURUSDMSCIDCIFROM
Carry Trade62.4533.842.511.2037.55
EURUSD31.5957.887.852.6742.12
MSCI2.939.6070.3417.1329.66
DCI1.852.6418.9076.6123.39
TO36.3746.0829.2721.01132.72
NET−1.183.96−0.39−2.3944.24/33.18
Table 5. Spillover connectedness at 10th quantile (bear).
Carry TradeEURUSDMSCIDCIFROM
Carry Trade60.086.5413.6219.7639.92
EURUSD4.4247.2325.6822.6752.77
MSCI 10.4422.3942.1025.0757.90
DCI14.9319.2225.1840.6659.34
TO29.7948.1564.4867.50209.92
NET−10.13−4.626.598.1669.97/52.48
Disclaimer/Publisher’s Note: The statements, opinions and data contained in all publications are solely those of the individual author(s) and contributor(s) and not of MDPI and/or the editor(s). MDPI and/or the editor(s) disclaim responsibility for any injury to people or property resulting from any ideas, methods, instructions or products referred to in the content.