1. Introduction
The different financial market actors have experienced a stressful period since the end of 2019, after the global propagation of coronavirus disease (COVID-19). On 11 March 2020, the whole world entered a period of major turmoil; following this, the number of confirmed COVID-19 cases followed an upward trend to reach 767,518,723 cases globally by 28 June 2023 according to the World Health Organization (WHO). Governments and politicians tried to counter the spread of this infectious disease to save their citizens and economy. Meanwhile, international investors faced significant uncertainty and ambiguity. With the implementation of different stringency measures, such as lockdowns, travel bans, quarantines, and fiscal stimulus packages, worldwide economies entered a recession, while the development of vaccines against the pandemic helped to speed up economic recovery and mitigate anxiety among financiers. As of 27 June, a total of 13,461,751,619 vaccine doses had been administered, as reported by the WHO.
Investors confronted “sentiment volatility.” This incited global stock markets to look for haven assets to manage their risks. Despite the efforts provided by governments and politicians to boost economic recovery, the financial situation became more complicated with the Russia–Ukraine conflict, which began in September 2021. Russia faced rigorous sanctions imposed by Western countries; these actions had repercussions on neighboring countries, especially countries that rely on Russian energy exports (
Ahmed et al. 2022;
Yousaf et al. 2022;
Izzeldin et al. 2023).
Boungou and Yatié (
2022) demonstrate that global stock indices were significantly and negatively affected by the Ukraine–Russia war, and
Assaf et al. (
2023) note that emerging countries experienced less negative price reactions than developed countries. Hence, the Russia–Ukraine conflict strongly amplified systemic financial stress and increased uncertainties in Europe and America (
Boungou and Yatié 2024).
Pandemics, wars, and financial crises represent unsafe environments for investment; thus, investors struggle to make resilient judgments and to manage their portfolios. Indeed, the dynamicity, complexity, non-linearity, and ambiguity of the stock market cause financial managers to struggle to make optimal decisions, and the rapid changes in technology have increased uncertainty.
Yasin et al. (
2022) described this situation as a “VUCA environment,” which refers to an environment of volatility, uncertainty, complexity, and ambiguity. Investment decisions become more difficult and delicate in times of market stress, and distinguishing better stocks and knowing how to allocate wealth optimally are difficult. In periods of turmoil, investors become more interested in protecting their capital and in reducing their risk than in maximizing their returns (
Schulmerich et al. 2014). Mitigating risk can be achieved via diversification (
Hanif et al. 2021;
Ravipati 2012); through holding different assets, stocks, or commodities, risk diversification can be achieved (
Mangram 2013).
One of the tools used for portfolio management is portfolio optimization. This is an important method for different individual investors, institutional investors, fund managers, and financial advisors to achieve their goals, such as maximizing their returns, minimizing their risks, and satisfying their risk/return trade-off. Thus, portfolio optimization is a concern of most researchers (
Chen et al. 2021) as they consider various factors that influence asset allocation, such as overall market conditions and geopolitical risks (
Ma 2023). Portfolio optimization is the best combination of assets that can be held to receive the highest return for a given level of risk or the lowest risk for a given level of return. It is a game of balancing return and risk (
Zanjirdar 2020).
Thakkar and Chaudhari (
2020) note that construction, selection, and management tasks characterize the portfolio optimization process. This latter aspect has attracted lot of attention over time; it is the most dynamic topic, and researchers aim to create an optimal portfolio through relying on two main parameters, which are risk and expected return.
In 1952, Harry Markowitz changed the world of finance by introducing the mean-variance model, which is the backbone of portfolio optimization and subsequent theories. This American economist announced in his mathematical model that the investor should consider the co-movement between all the securities detained in the portfolio to construct one that has the highest return and lowest risk.
This paper focuses on selecting the best asset combination, such as G7 stock indices, bonds, commodities, and dirty and clean cryptocurrencies (in terms of environmental impact), in order to find an optimal portfolio based on Markowitz portfolio theory. While most researchers mainly focus on certain periods, such as pre-COVID-19 vs. post-COVID-19 (
Bukhari et al. 2022;
Alamgir and Cheng 2023;
Prajapati 2023; etc.) or during the Russia–Ukraine war (
Boungou and Yatié 2022;
Lo et al. 2022; etc.), our study focuses on four periods, as follows: before COVID-19 was declared a pandemic, during the spread of COVID-19 and before the Russia–Ukraine war, during the spread of COVID-19 and the Russia–Ukraine war, and after the end of COVID-19 as a pandemic and during the Russia–Ukraine war. These recent crises have not been combined into a portfolio comparative study to date. Thus, this work provides the best strategy for investors to adapt their preferences and objectives to each of these different periods (peaceful period, health crisis period, and/or geopolitical crisis period).
The risk measure used in this paper is the mean CVaR, which is the expected average loss that exceeds the VaR threshold. Reaching the optimal portfolio relies on the application of genetic algorithms known as metaheuristics, namely, NSGAII, SPEA2, and PSO.
Researchers have become interested in applying artificial intelligence in their studies and in various other domains (
Boubaker and Bannour 2023;
Kaur et al. 2023;
Khaleel et al. 2023, etc.). This can be explained by machine learning methods’ ability to outperform parametric methods (
Park et al. 2014;
Dai et al. 2019). For example,
Lwin et al. (
2017) show the effectiveness of a learning mechanism in solving complex portfolio optimization problems. The metaheuristic algorithms NSGAII, SPEA2, and PSO are broadly used by researchers.
Anagnostopoulos and Mamanis (
2011) find that SPEA2 ranked first in solving both constrained and unconstrained multi-objective optimization problems compared to NSGAII. Also,
Dashti et al. (
2007) show that the PSO algorithm represents a helpful tool for investors in constructing their portfolio and making decisions regarding their investment strategy; the same result was found by
Zhu et al. (
2011).
Lwin et al. (
2014) reveal that both NSGA-II and SPEA2 engender similar results for most problems. However, SPEA2 is more expensive in terms of process time. Thus, the ability to rely on the three algorithms NSGAII, PSO, and SPEA2 in the case of portfolio optimization is limited. In addition, previous researchers have tried to solve optimization problems with several evolutionary algorithms while not considering the effect of the nature of the study period (
Babaei et al. 2015;
Day and Lin 2019; etc.). In our work, the manipulation of machine learning techniques such as NSGAII, PSO, and SPEA2 in portfolio optimization creates powerful instruments for risk monitoring and the development of practical portfolio strategies under different climates.
To identify risk, the value at risk was used to quantify the extent of financial losses over a specified period at a given confidence interval and under normal market conditions. Solely considering undesirable fluctuations is a positive aspect of the VaR. However, it suffers from overvaluing the risk of an asset portfolio, exceeding the total risk of individual assets, and is a non-linear, non-convex, and non-differentiable function that is difficult to optimize. Loss distributions are frequently fat-tailed; therefore, this method was found to be ineffective (
Rockafellar and Uryasev 2002).
The idea of measuring the risk of a portfolio using CVaR was proposed by Ureyasev in 2000. CVaR, as an alternative to VaR, can address mean excess loss, mean shortfall ES, or tail VaR; it estimates the expected losses beyond the VaR threshold. This method shows an efficient performance in optimization problems (
Kaucic et al. 2019).
Larsen et al. (
2002) noted that evaluating risk with CVaR represents a “sub-additive” measure, which means that the CVaR value is decreased due to portfolio diversification while VaR increases, which highlights the superiority of CVaR compared to VaR.
It is important for investors to know the best investment portfolio during different periods of crisis, since this leads to well-managed portfolio risk, optimal portfolio diversification, and effective hedging strategies. We contribute to the existing literature by looking for the optimal portfolio during four periods, including three periods of crisis, such as the COVID-19 pandemic and the ongoing Russia–Ukraine war. Secondly, we applied artificial intelligence in our work by using three genetic algorithms, which are NSGAII, SPEA2, and PSO. Finally, regarding the portfolio, it contains several types of assets: equities, commodities, cryptocurrencies, and bonds. Our results have important implications for international investors and policymakers.
This paper is organized as follows: first, we provide the data and methodology; secondly, we present the empirical results and discussion; and finally, we present the conclusion.
2. Data and Methodology
2.1. Data
Our dataset consists of the daily closing prices of the G7 stock indices (CAC40; DAX, FTSE100; FTSE MIB; Nikkei225; S&P/TSX; S&P500), bonds (S&P Green Bond index), and commodities (Gold; WTI crude oil), with Bitcoin as the dirty cryptocurrency and Ripple as the clean, over the period from 3 January 2017 to 2 May 2024, which has been divided into four periods: the first is from 3 January 2017 to 11 March 2020 (pre-COVID-19 pandemic), the second is from 12 March 2020 to 23 February 2022 (during the COVID-19 pandemic and pre-Russia–Ukraine war), the third is from 24 February 2022 to 5 May 2023 (during the COVID-19 pandemic and the Russia–Ukraine war), and the fourth is from 6 May 2022 to 2 May 2024 (after the end of the COVID-19 pandemic and during the Russia–Ukraine war). Bitcoin is presented as the dirty cryptocurrency because it is the most prominent example of blockchain that requires massive computational power and electricity, according to the United Nations Conference on Trade and Development report, while Ripple is an eco-friendly coin due to its less energy-intensive nature, with this currency promising to reach net-zero carbon emissions by 2030, as reported in the Fintech Times.
In this study, multi-asset classes were combined to build a diversified portfolio.
Andrianto and Diputra (
2018) find that including cryptocurrencies in a portfolio minimizes risk and provides investors with more allocation options. Relying on Markowitz portfolio theory, they find that a 5 to 20% investment in cryptocurrencies is the optimum allocation level for beating the performance of the S&P 500 and Dow Jones indexes. Similar results were obtained by
Almeida and Gonçalves (
2022), who highlight crypto’s ability to hedge against stocks, geopolitical risks, and economic policy uncertainty (EPU). In addition,
Som and Kayal (
2022) declare that both Bitcoin and gold should be included in a portfolio in small and high proportions, respectively. This is due to the high volatility of the dirty cryptocurrency and the negative correlation of gold with all the other asset classes. In addition,
Gomes et al. (
2023) find that to mitigate the market risk in Canada, France, Germany, Italy, the UK, and the US, it is beneficial for investors to hold gold. Incorporating commodities into a portfolio provides potential diversification benefits due to their negative association with stocks, especially during economic downturns (
Shahzad et al. 2014). For
Klein et al. (
2018), Bitcoin can be used for hedging and Ripple functions as a diversifier. As a proxy for the green bond market, we used the S&P Green Bond, similarly to many others (
Pham 2016;
Huynh et al. 2020;
Tiwari et al. 2022;
Rehan et al. 2024). In this context,
Arif et al. (
2022) and
Rehan et al. (
2024) show that the green bond serves as a portfolio diversifier. According to
Arslan and Hussein (
2023), 4%, 21%, 18%, 9%, 34%, 3%, and 11% are the optimal allocations of oil, gold, S&P stock, dollars, Bitcoin, Ripple, and Ethereum, respectively, to create a diversified portfolio. The studied countries represent a sample of developed countries.
All the indices represent widely used benchmarks for market performance. We chose daily data because this frequency provides better accuracy, and it does not have the cost of intraday data; this has been proved by
Liu (
2009). Also, it can capture short-term shocks. So, relying on daily data provides better diversification and leads to better portfolio optimization decisions.
The stock index, commodity, and cryptocurrency price data were derived from Investing.com. The Green Bond Index was retrieved from the S&P Dow Jones Indices website. All market data are expressed in USD. These preliminary price series will be transformed into returns, which are defined as the first difference in the natural logarithm of the daily prices, such that Rt = ln(Pt) − ln(Pt − 1), where Rt are returns at time t, and Pt and Pt − 1 are the current price and one-period lagged price, respectively.
2.2. Methodology: Portfolio Optimization via Improved Evolutionary Algorithms
- i.
NSGAII:
The Non-dominated Sorting Genetic Algorithm II (NSGA-II or NSGA2) improves on the original NSGA, and it was proposed by
Deb et al. (
2002). The addition of non-dominated sorting, crowding distance assignment, and a crowded comparison operator improves on the original method.
When applied to a population Q, the non-dominated sorting technique (Algorithm I) separates this population into sets υ (referred to as fronts) .
The first front comprises all the original population’s non-dominated solutions, the second all the non-dominated solutions in the set Q\Ƒ1\Ƒ2, the third all the non-dominated solutions in the set (Q\Ƒ1\Ƒ2), and so on. The total complexity of this non-dominated sorting technique is O (mN2), where N is the population size and m is the number of objectives.
The crowding distance estimates the density of solutions in the population surrounding a specific solution. This is accomplished by calculating the average distance between two places on either side of this solution, alongside each of the goals. Extremal points (solutions with the smallest and greatest objective values) are allocated an infinite distance value and are saved for the following generation. The crowding distance is an estimate of the size of the greatest cuboid encompassing the solution without considering any other population point.
- ii.
SPEA2
The SPEA2 (Strength Pareto Evolutionary Algorithm II) is an upgraded version of the original SPEA, and it was proposed by
Zitzler et al. (
2001). SPEA2 improves on its predecessor by including a new fitness scheme, a nearest neighbor density estimation methodology, and an archive truncation method. SPEA2 maintains an archive
of fixed size (
) containing the best front discovered thus far.
Every
I in the archive
and population
Pt is given a strength rating based on the number of solutions it dominates:
This strength value is then used to compute this individual’s raw fitness:
A density estimation is conducted in addition to this raw fitness score using an adaptation of the
k-nearest neighbor approach. Distances in objective space to all people
j in the archive and population are calculated for each person
I, kept in a list and sorted in increasing order. The
kth entry in this list then indicates the distance (
) required to determine this individual’s density value:
Finally, an individual’s final fitness value is the sum of its raw fitness value and density estimation:
Environmental selection is accomplished by copying all nondominated individuals from the present archive and population to the following generation’s archive.
There are three scenarios to consider while mimicking these people:
- ➢
= : The undominated front is perfectly suited to the archive. In this situation, environmental selection is complete.
- ➢
< : The next generation’s archive is insufficient. The best dominating individuals from the previous archive and population are transferred into the new archive in this situation.
- ➢
> : The future generation’s archive is far too large. An archive truncation process is used in this circumstance. This truncation procedure removes people progressively until = . The individual selected for removal is the one with the shortest distance to another individual. If there are numerous such people, the shortest distance is taken, and so on.
- iii.
PSO Algorithm:
PSO is an optimization algorithm inspired by the behavior of birds or fish in groups. It was proposed by
Kennedy and Eberhart (
1995). A particle swarm is a population of particles, each of which is a moving entity that traverses the search space and is drawn to previously visited sites with high fitness. Particles, unlike people in evolutionary computation, do not reproduce and are not replaced by other particles.
Assume a particle swarm of N particles, where describe the position and velocity of particle I in n-dimensional search space, respectively.
denotes the local optimal location of each particle (lbest), whereas denotes the global optimal location of all particles (gbest).
Each particle’s velocity update formula is as follows:
where
t is the number of iterations,
c1 and
c2 are speeding figures that regulate the duration while flying to the most particles in the entire swarm and the most optimistic individual particle,
w is the inertia weight, and
rand1 and
rand2 are two independent random numbers ranging from 0 to 1.
After updating particle velocity, apply the following formula to update particle location:
When the new position of each particle is compared to the objective value of the local ideal location, if the new position is better than the local ideal location, (lbest) is updated for the new location; otherwise, (lbest) remains unchanged. Then, (gbest) is updated to reflect the new global optimal particle swarm solution and continue the evolution of the next generation. The particle swarm converges to the global optimum solution after a specific number of evolutionary computations through PSO, resulting in a global optimal objective value.
- iv.
Algorithm settings
Table 1 presents the parameters of three algorithms: NSGAII, SPEA2, and PSO.
- v.
Algorithm evaluation metrics
The mean squared error (MSE) is defined as the average sum of the squared differences between the actual value and the predicted value, which represents the deviation from actual outcomes.
The average sum of differences between the actual value and the predicted value is what defines Mean Absolute Error (
MAE), which is a simple way to measure model accuracy that is less sensitive to outliers.
where
N represents the number of predictions,
is the real value, and
is the predicted value. The two measures show the difference between the true and the expected values. The lower the
MSE and
MAE, the greater the prediction accuracy.
3. Empirical Results and Discussion
In our empirical work, we used MATLAB R2017a software. We detail the results of our portfolio optimization study using the NSGA-II, SPEA2, and PSO over four distinct periods: pre-health crisis, during the health crisis, during the health crisis and Russia–Ukraine war, and post-health crisis and during the war. Our portfolio consisted of four types of assets: equities (CAC40, DAX, FTSE100, FTSE MIB, Nikkei225, S&P/TSX, S&P500), cryptocurrencies (dirty crypto: Bitcoin; clean crypto: Ripple), commodities (gold, WTI crude oil), and bonds (S&P Green Bond).
3.1. Optimal Portfolio Using Classical Methods
The classical risk metrics are variance (VAR), semi-variance (SV), mean absolute deviation (MAD), and expected shortfall (CVaR). These criteria are used to quantify a portfolio’s risk.
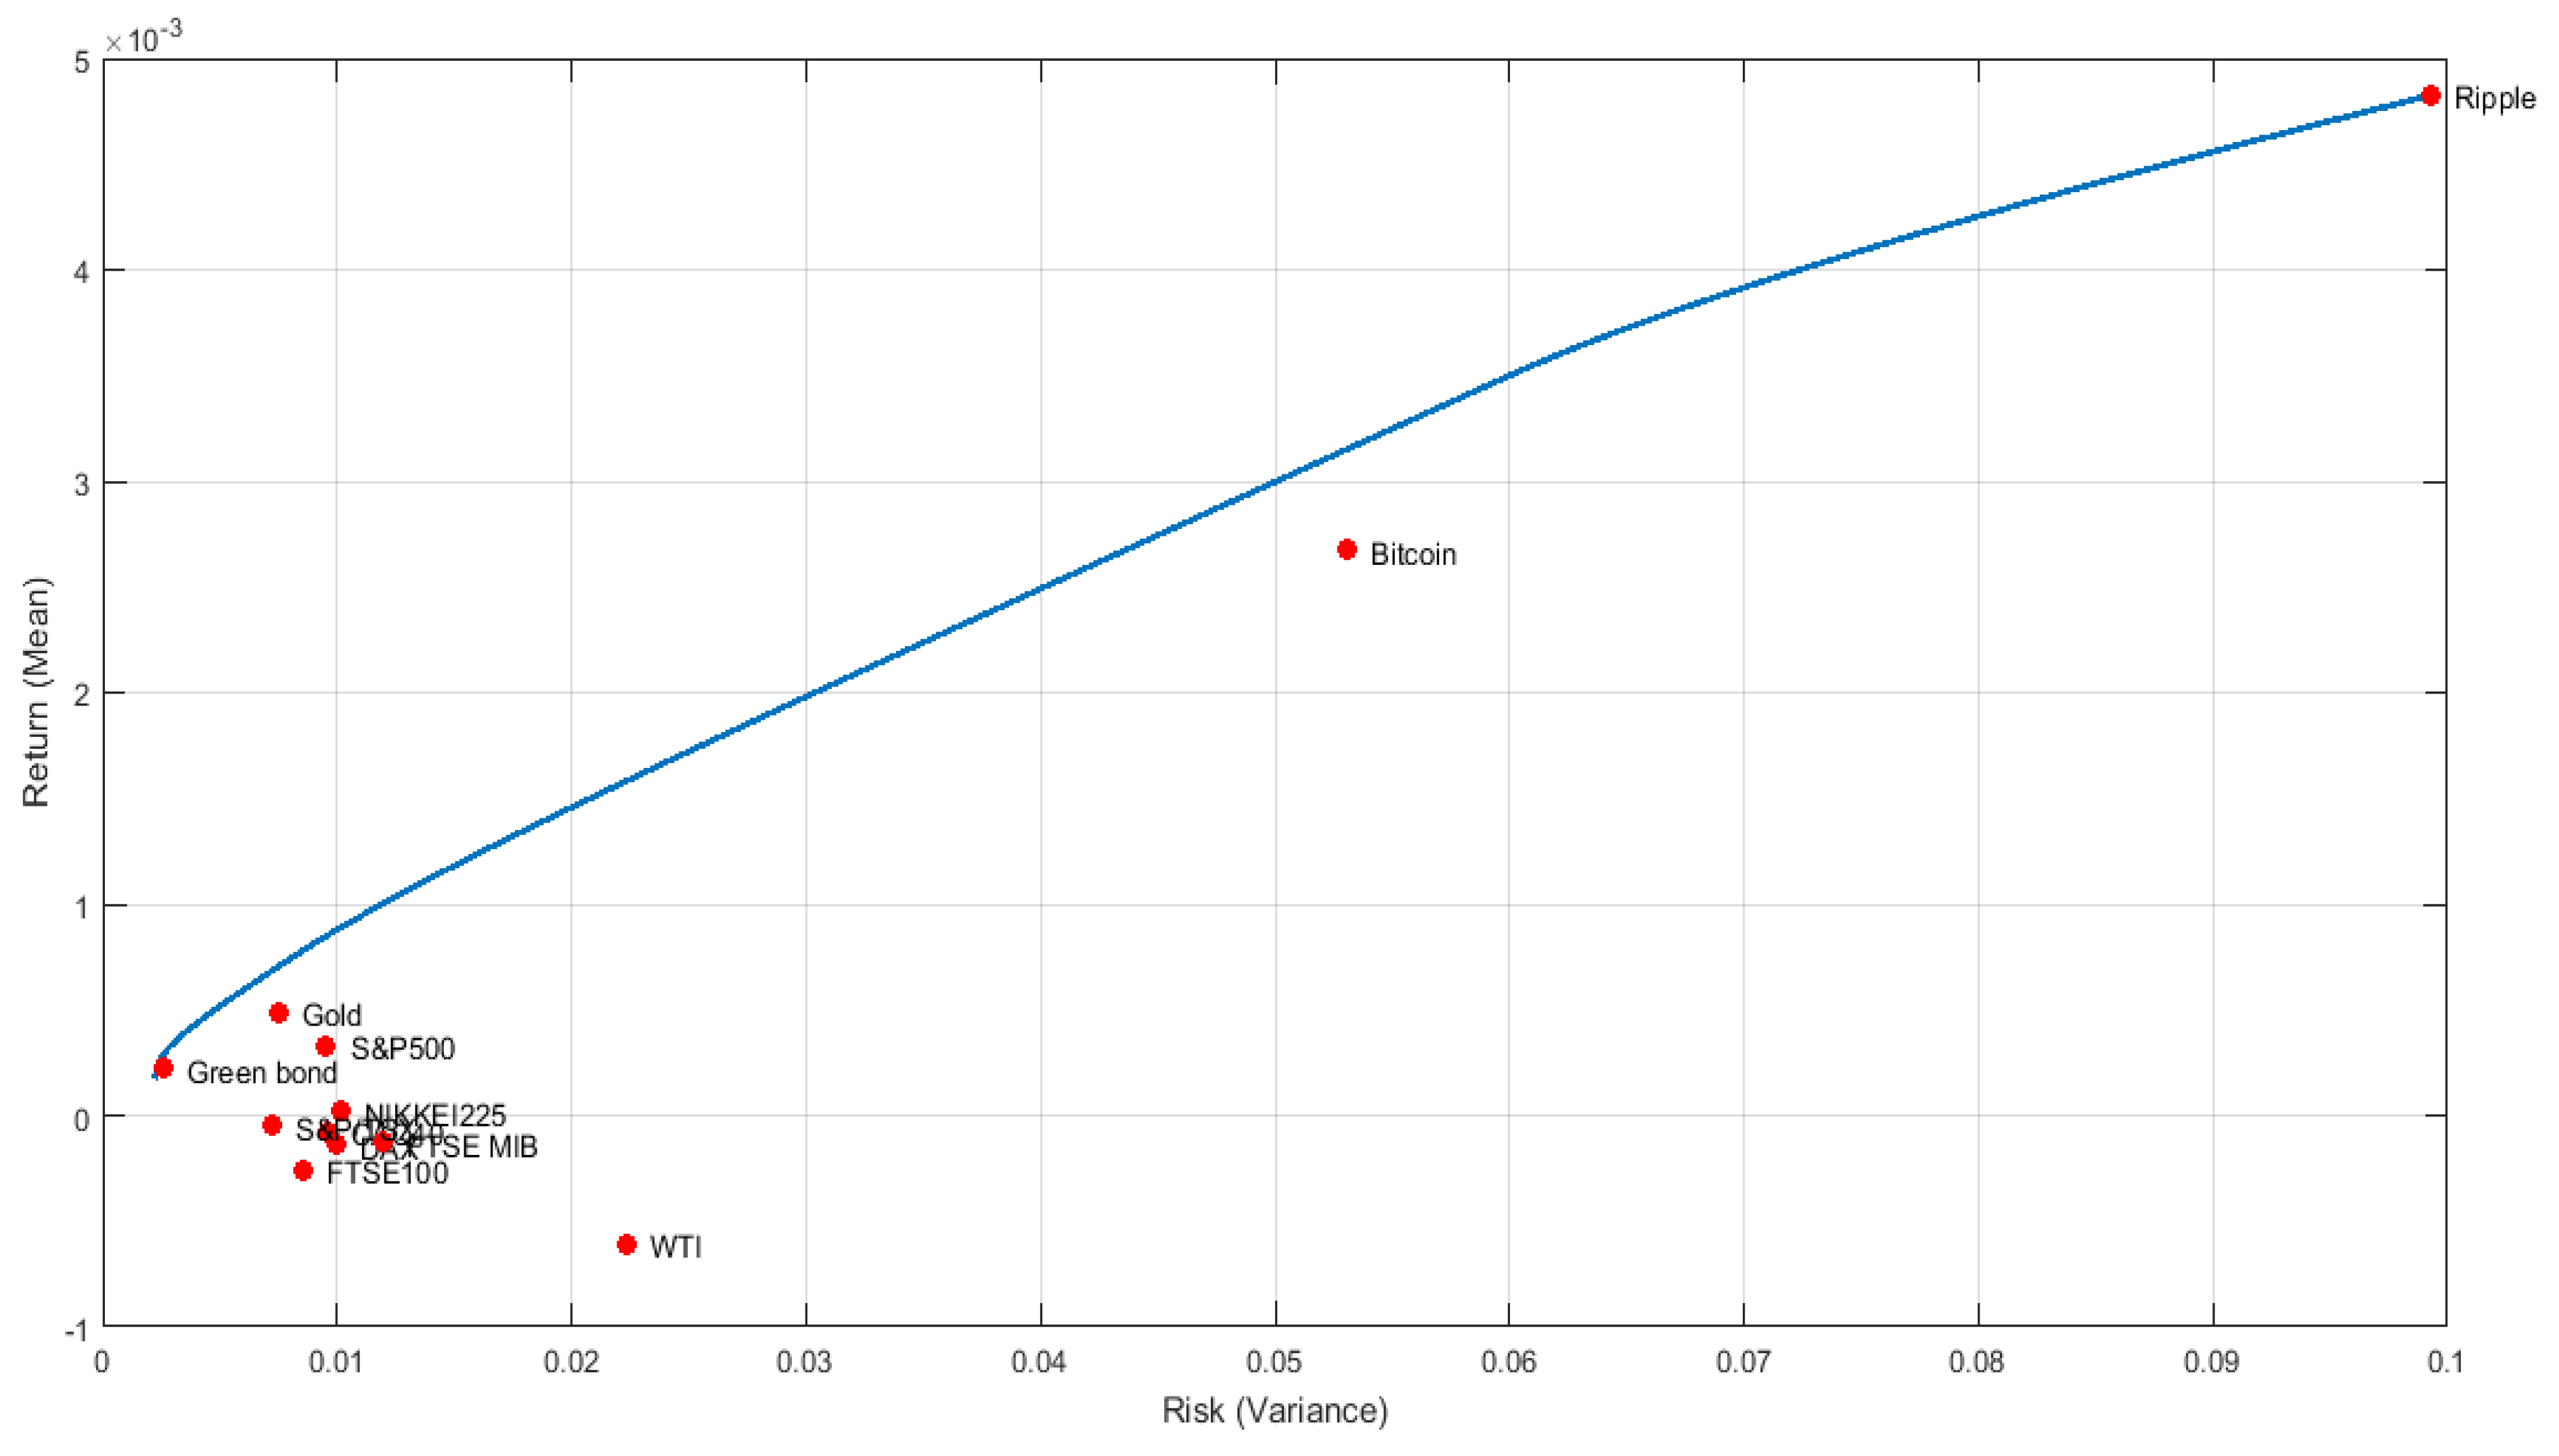
Figure 1,
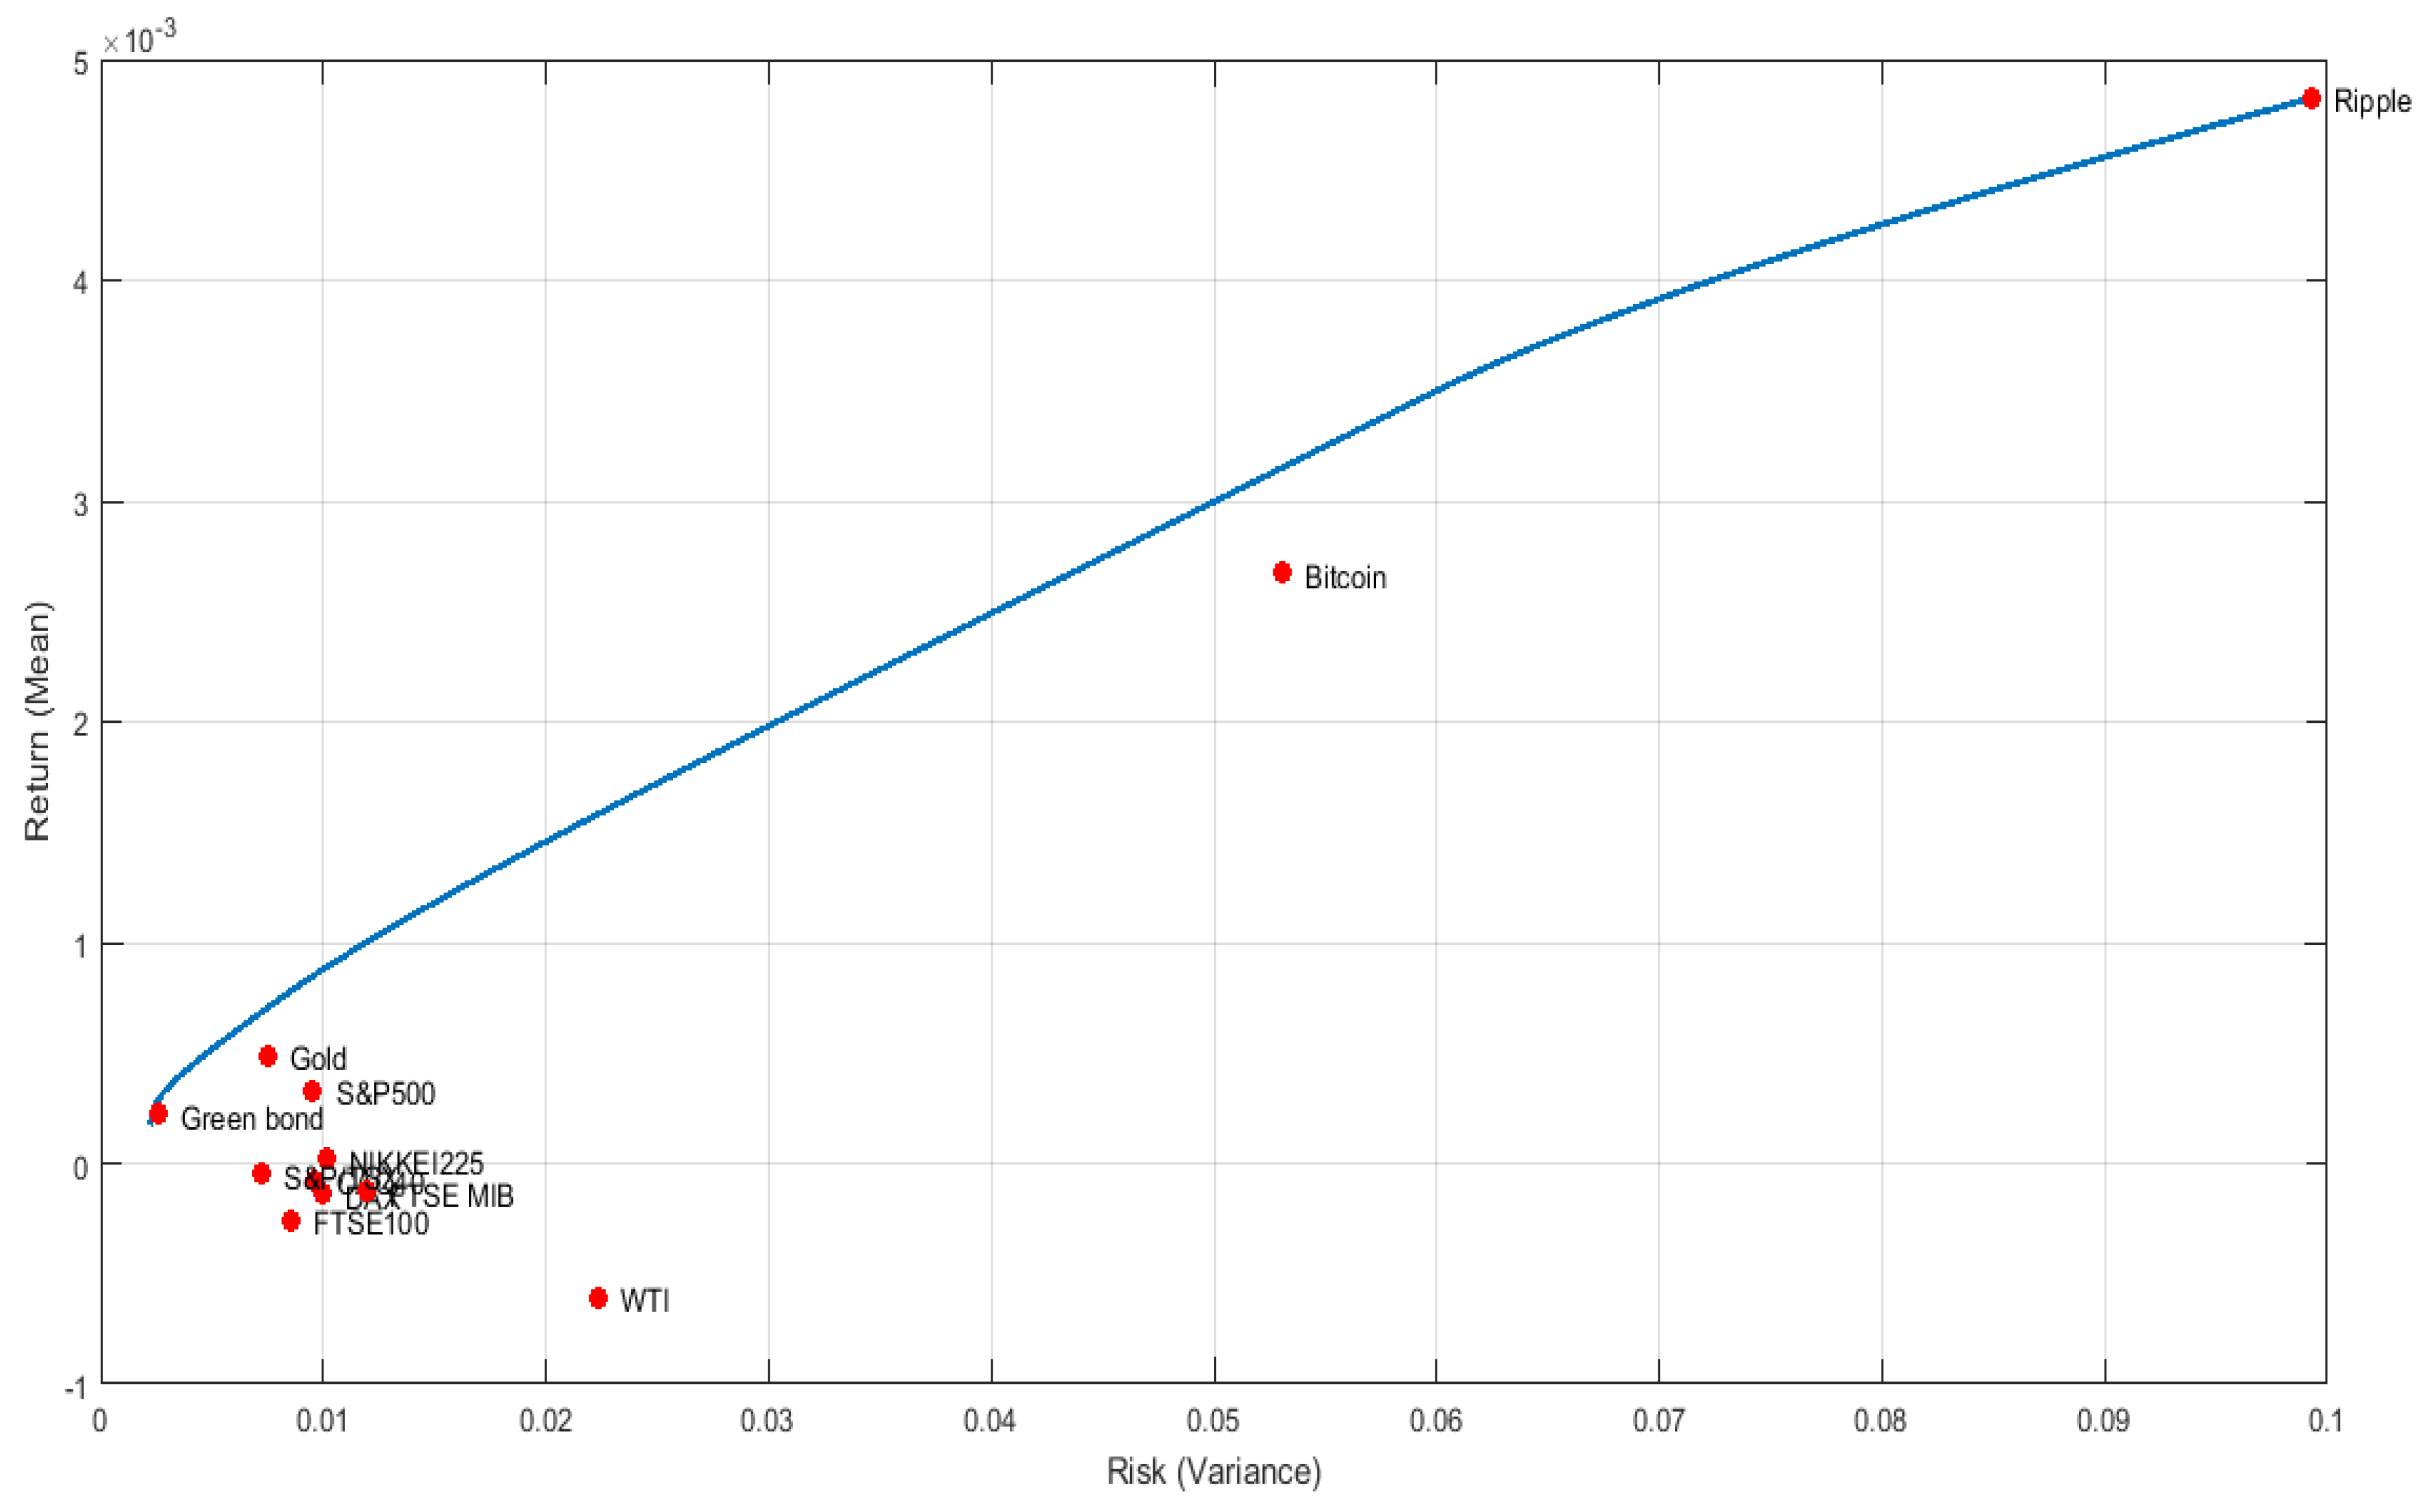
Figure 2,
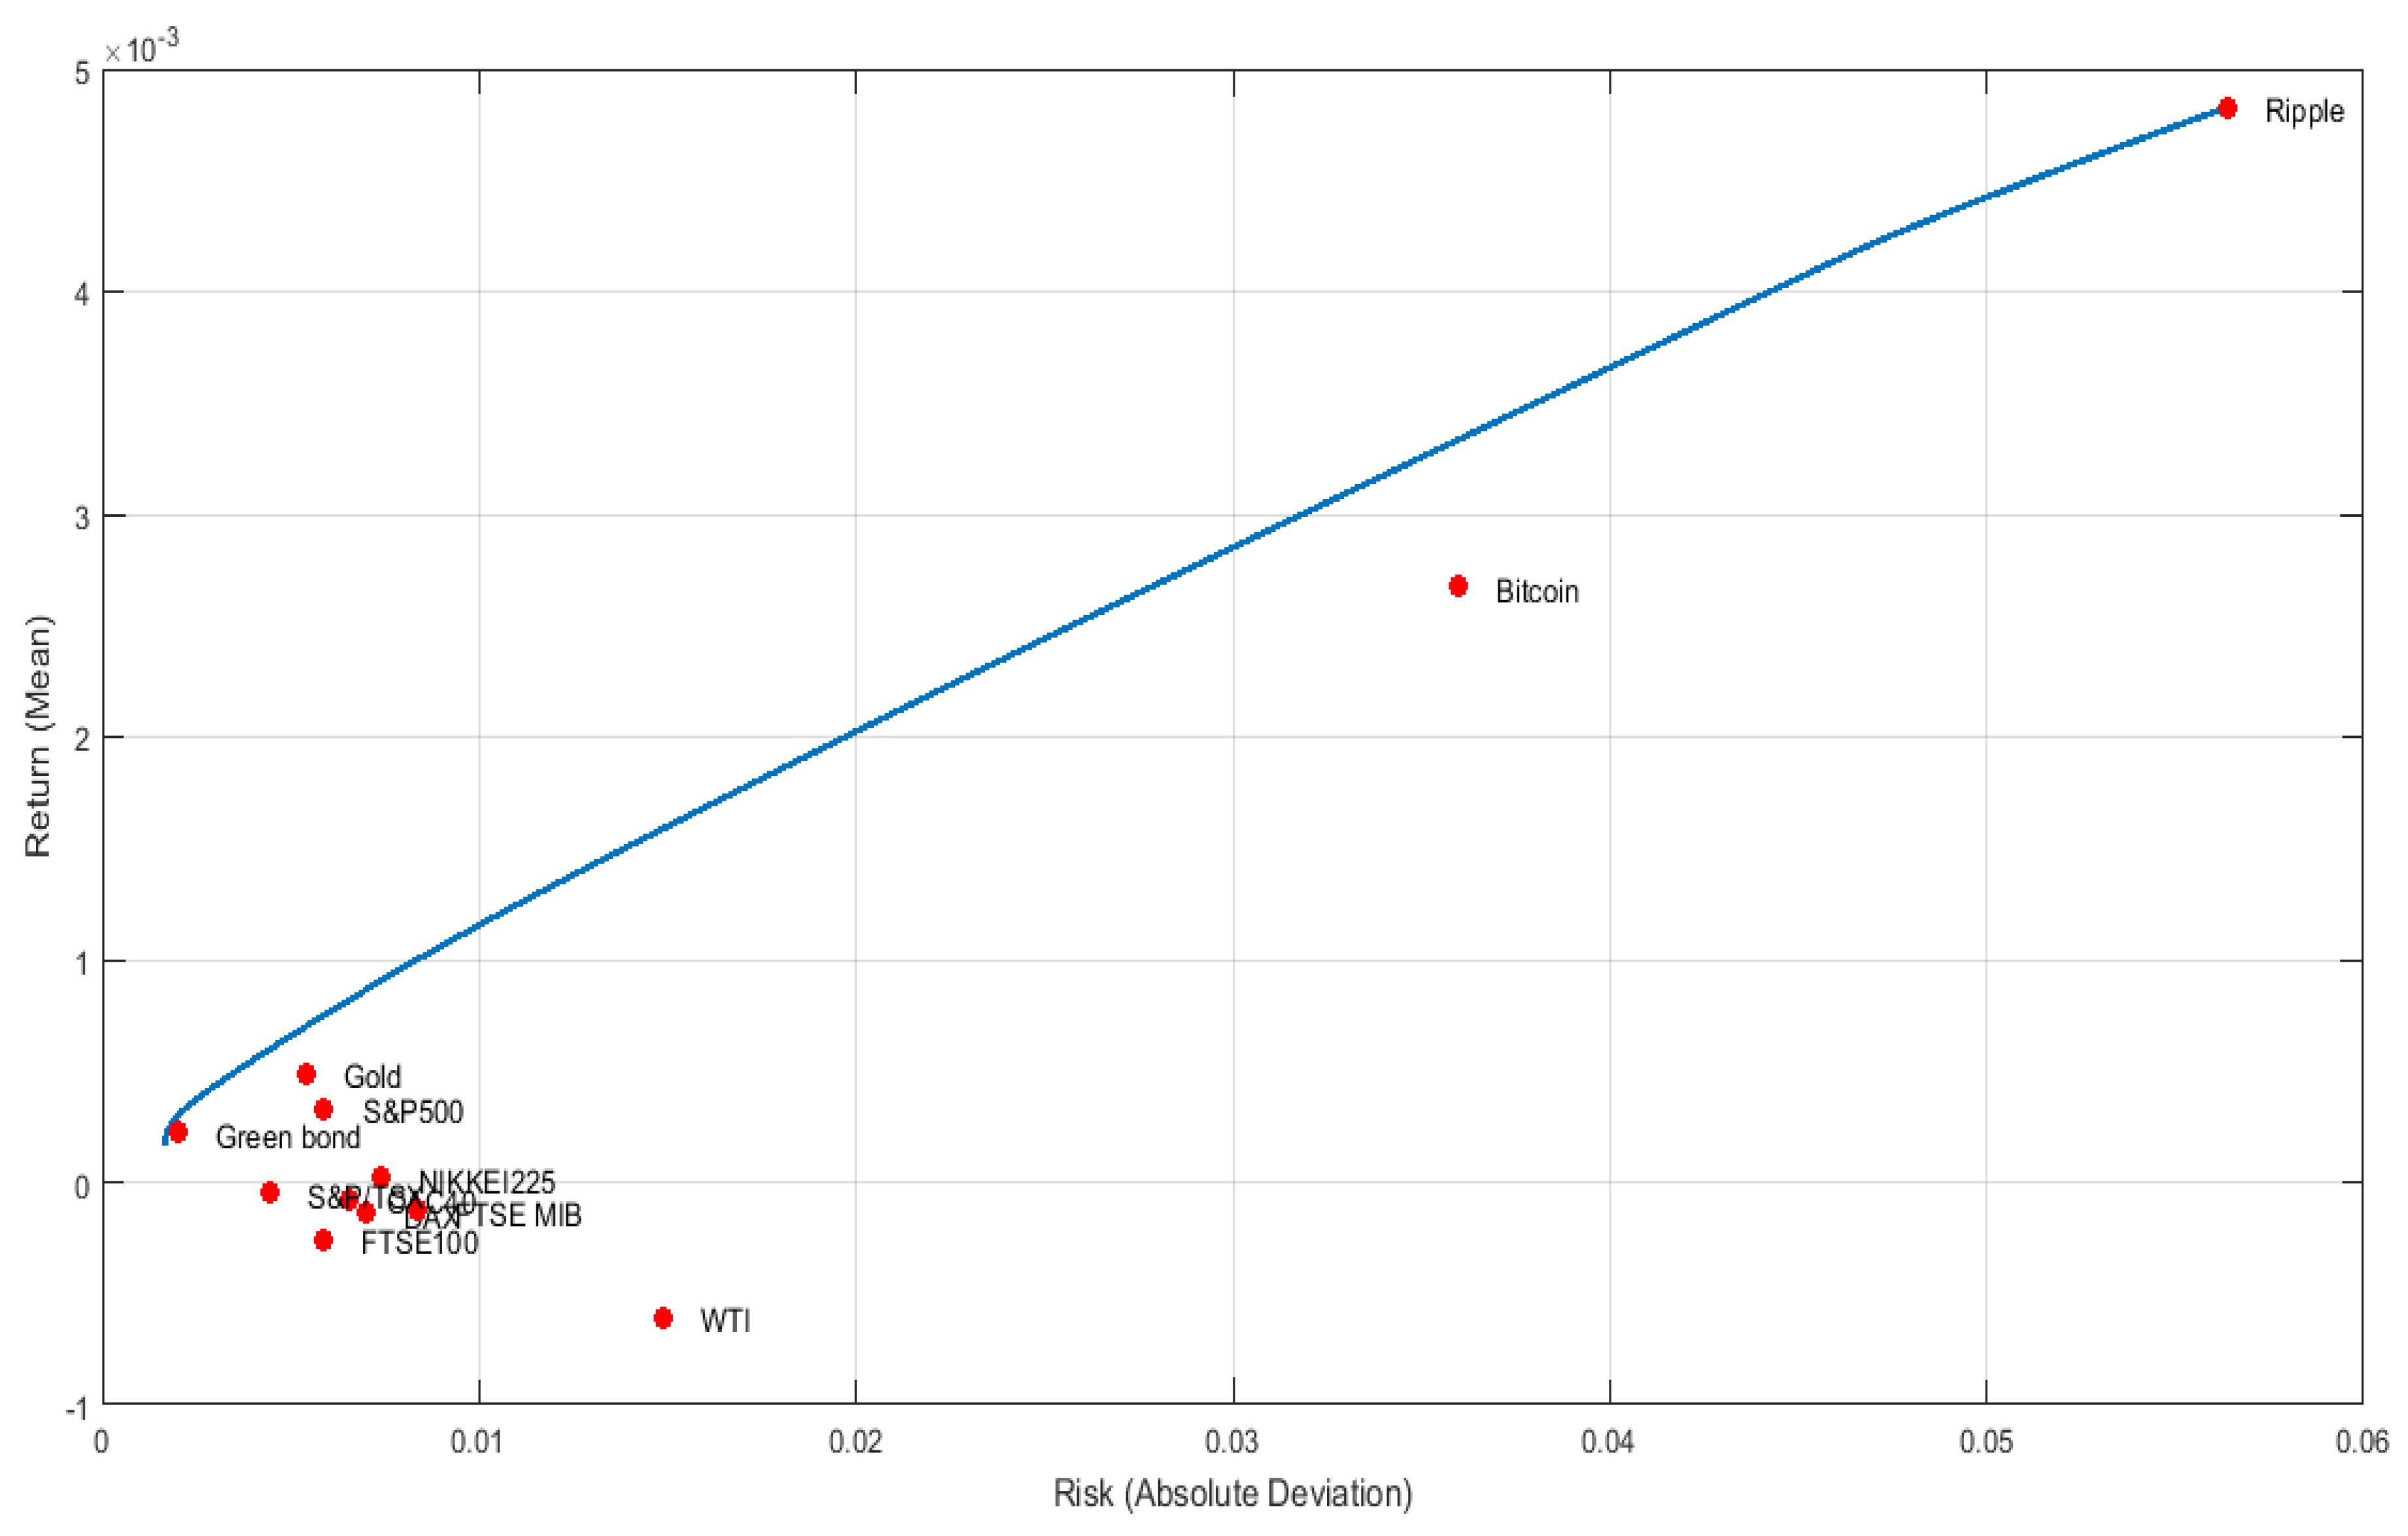
Figure 3 and
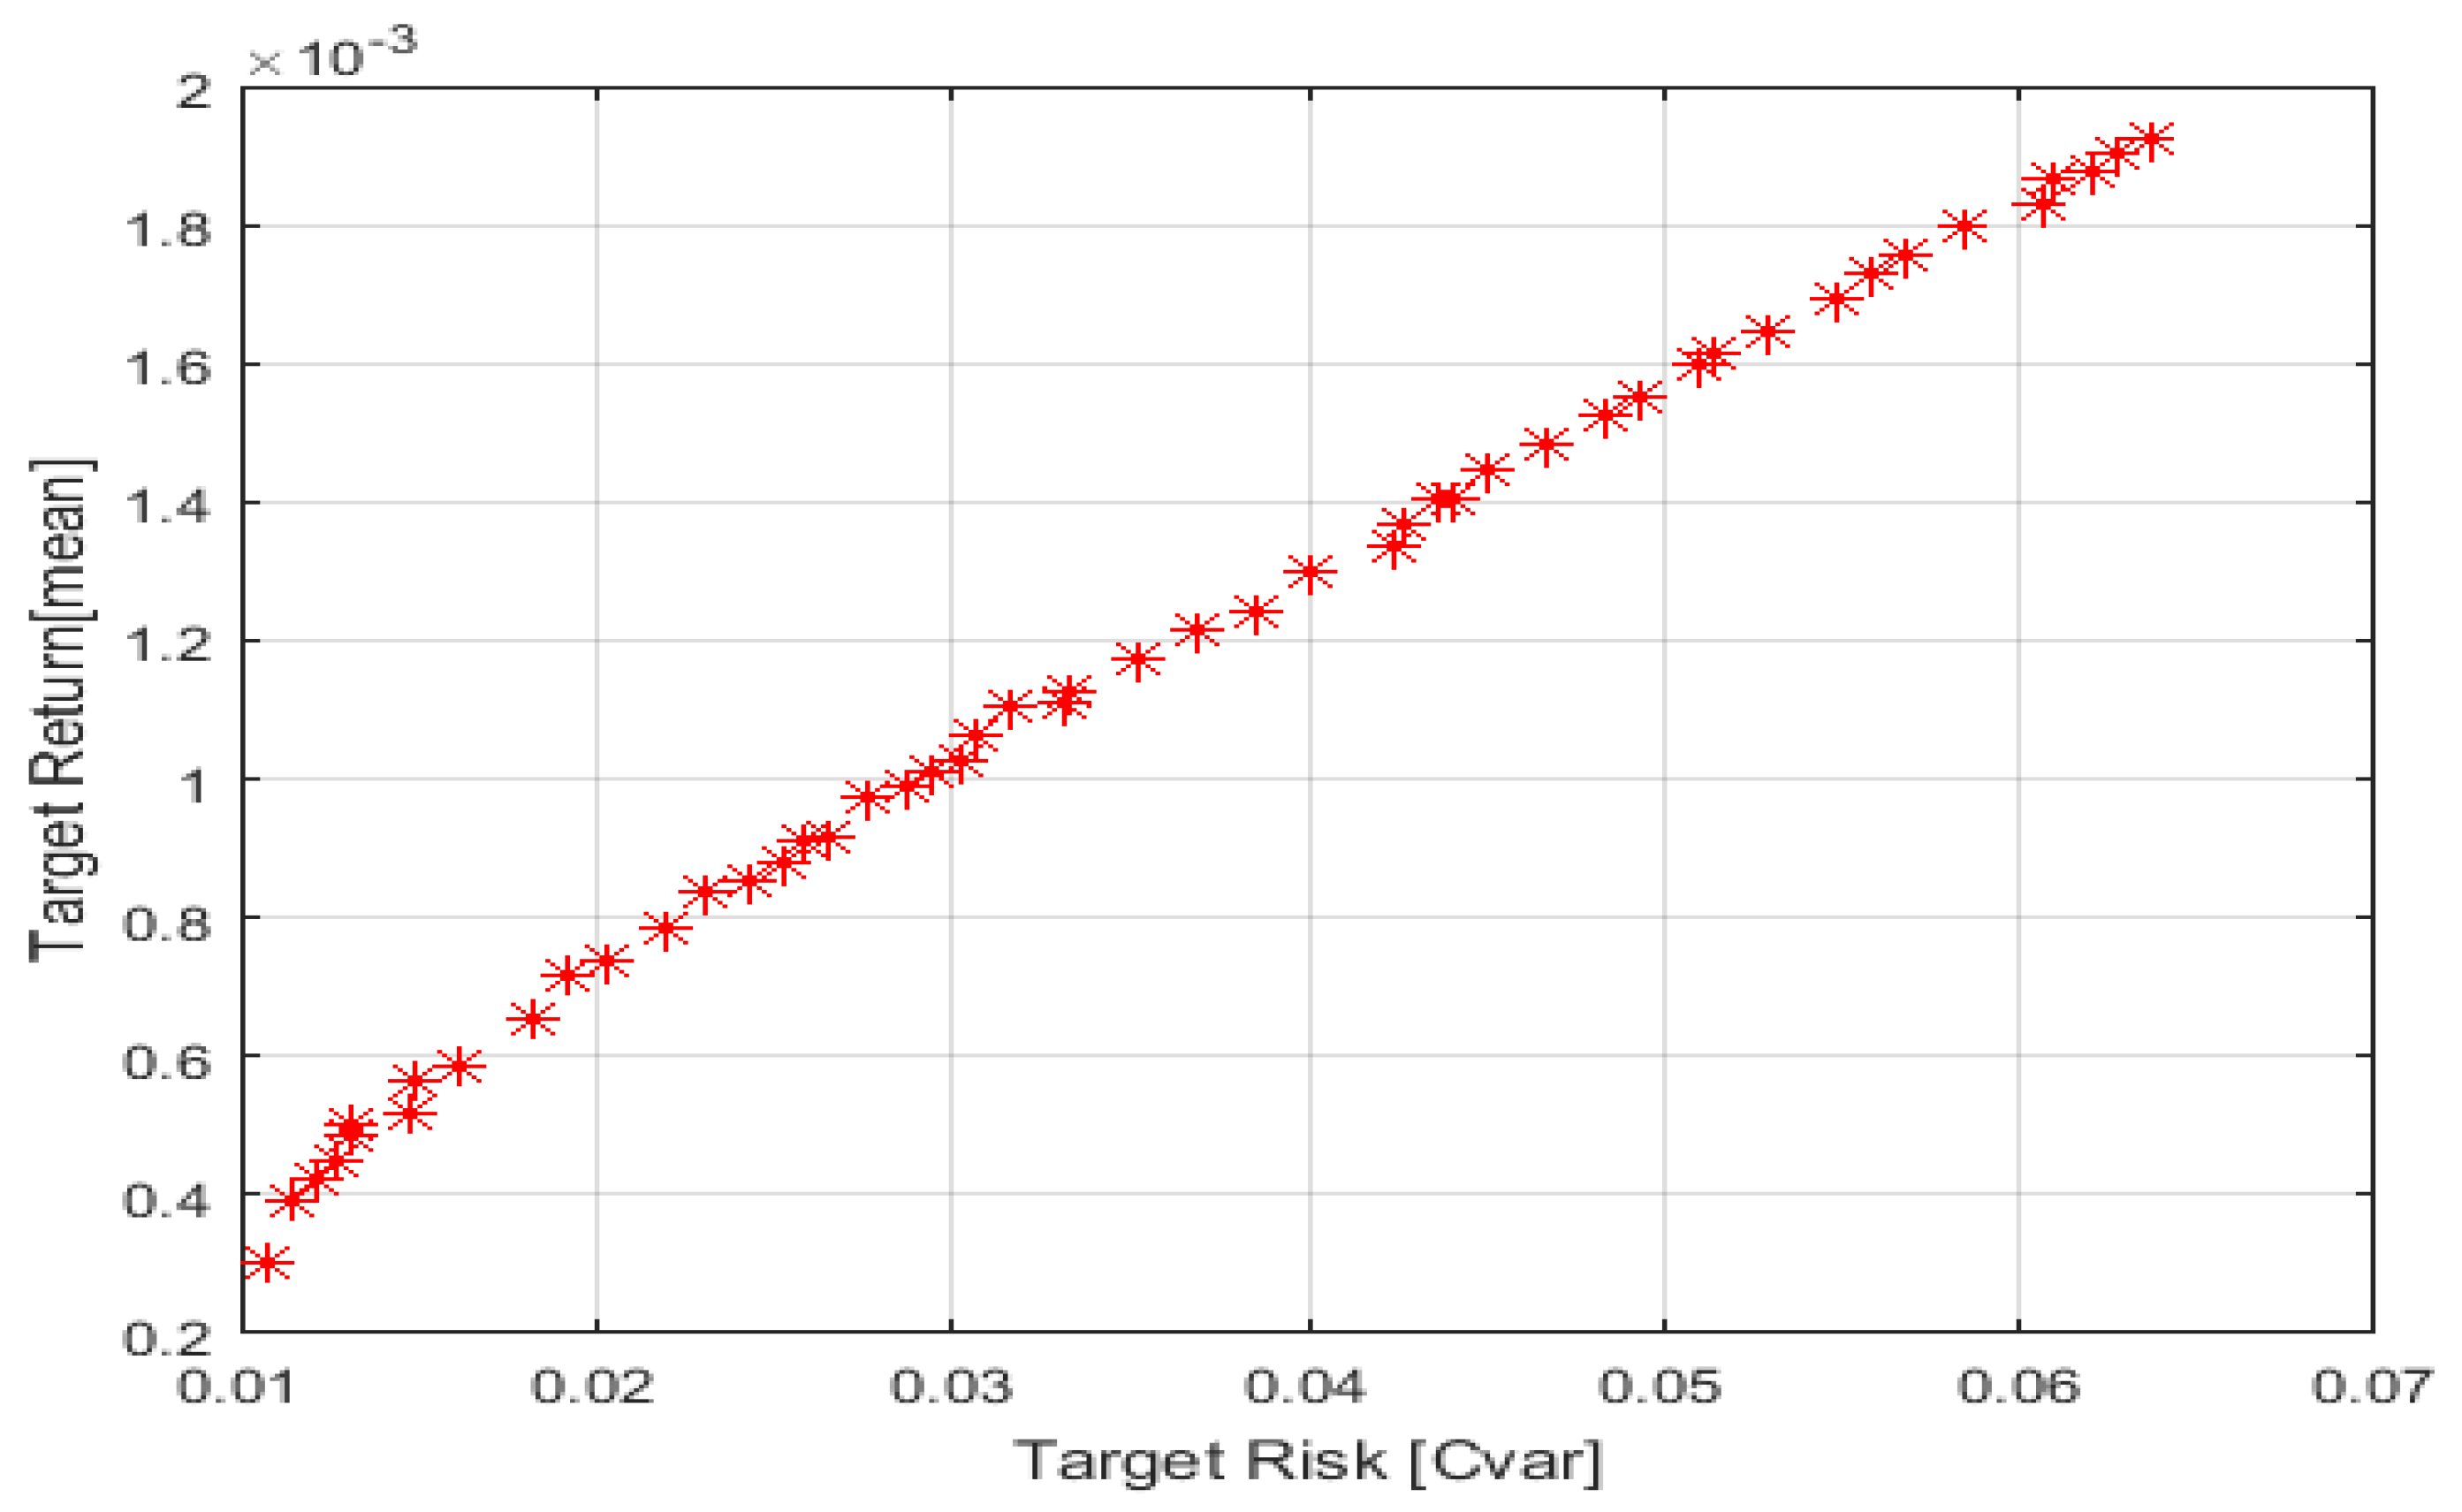
Figure 4 represent the resulting optimal portfolio that contains the different chosen assets (during the first period, which is the pre-COVID-19 pandemic period).
The Pareto efficient frontiers are illustrated in these graphs according to the four risk measures. Regarding the first period of study, the empirical results indicate that the clean cryptocurrency, Ripple, is in the right extreme point of the four exposed efficient frontiers; this shows that Ripple has the highest return accompanied by the highest risk. This may reveal that Ripple is a volatile asset. The S&P Green Bond represents a low-risk investment; this asset contributes to portfolio diversification by reducing its overall risk. In the next period, which is during the COVID-19 pandemic, S&P Green Bond is still at the lowest point of the efficient frontier, while Bitcoin is at its highest. This indicates that during the COVID-19 pandemic, the dirty cryptocurrency, Bitcoin, became more volatile. The same was observed during the fourth period, which was during the ongoing Russia–Ukraine war.
3.2. Optimal Portfolio Using Metaheuristic Algorithms
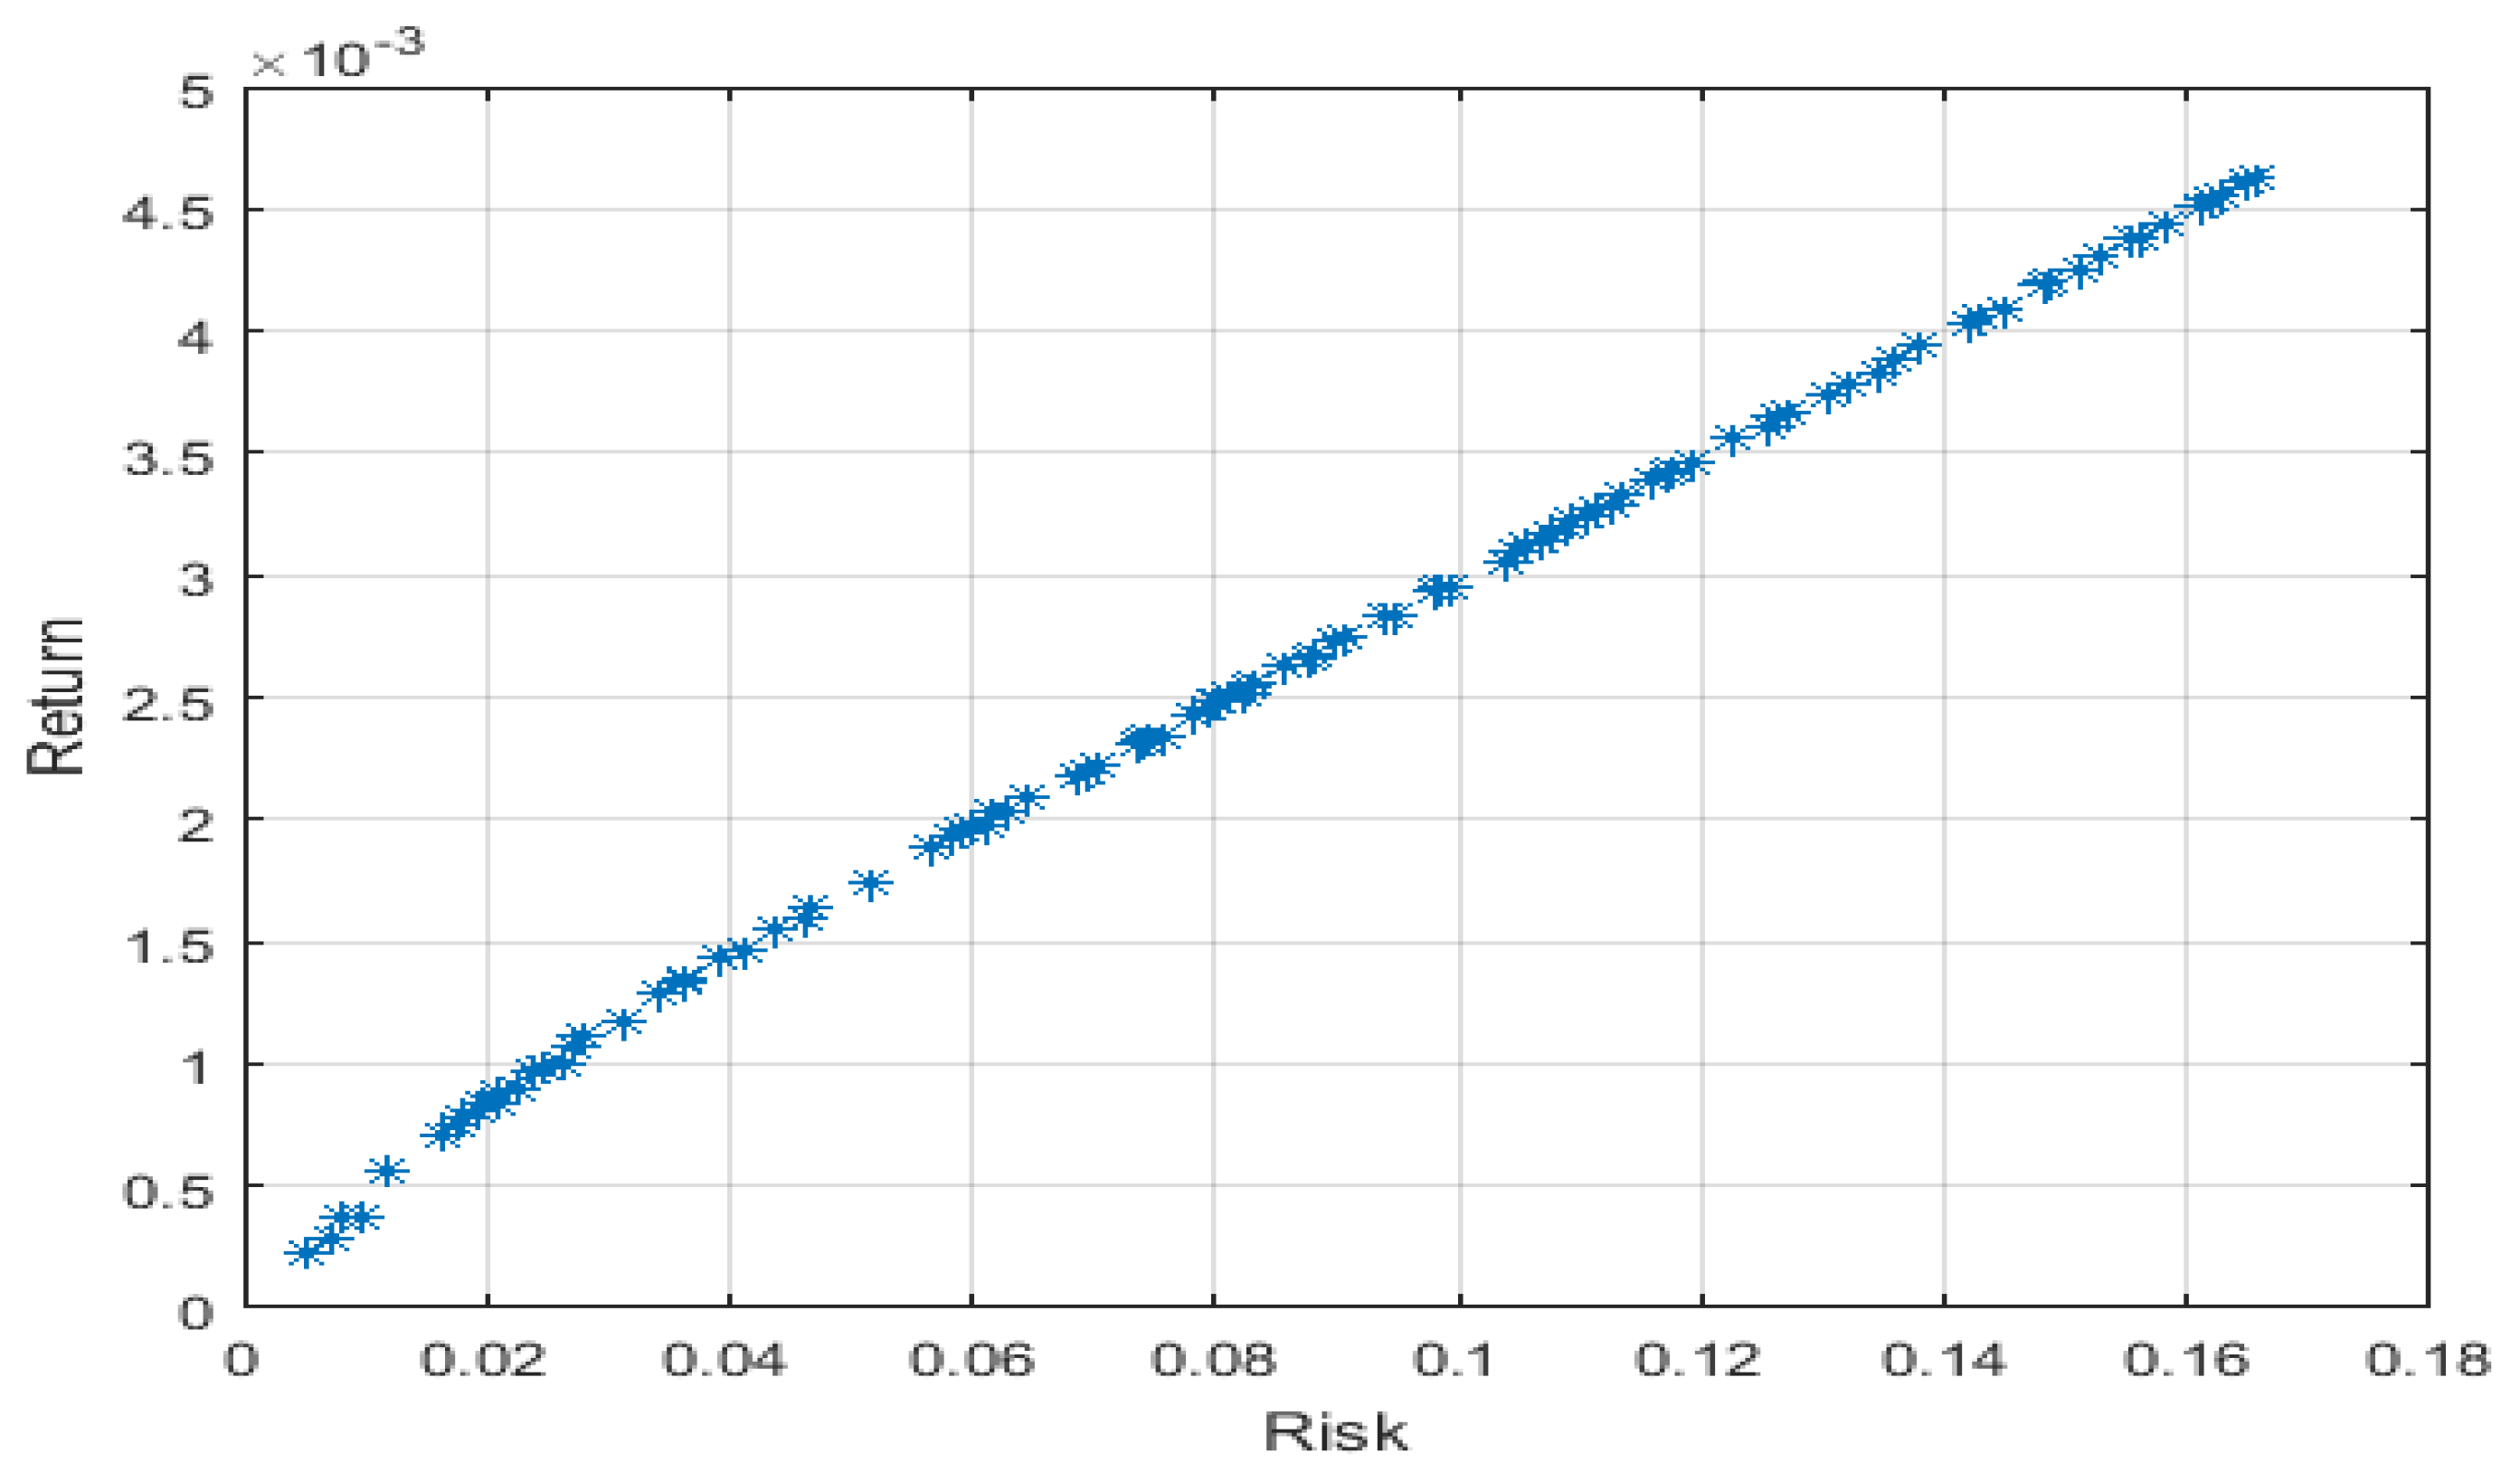
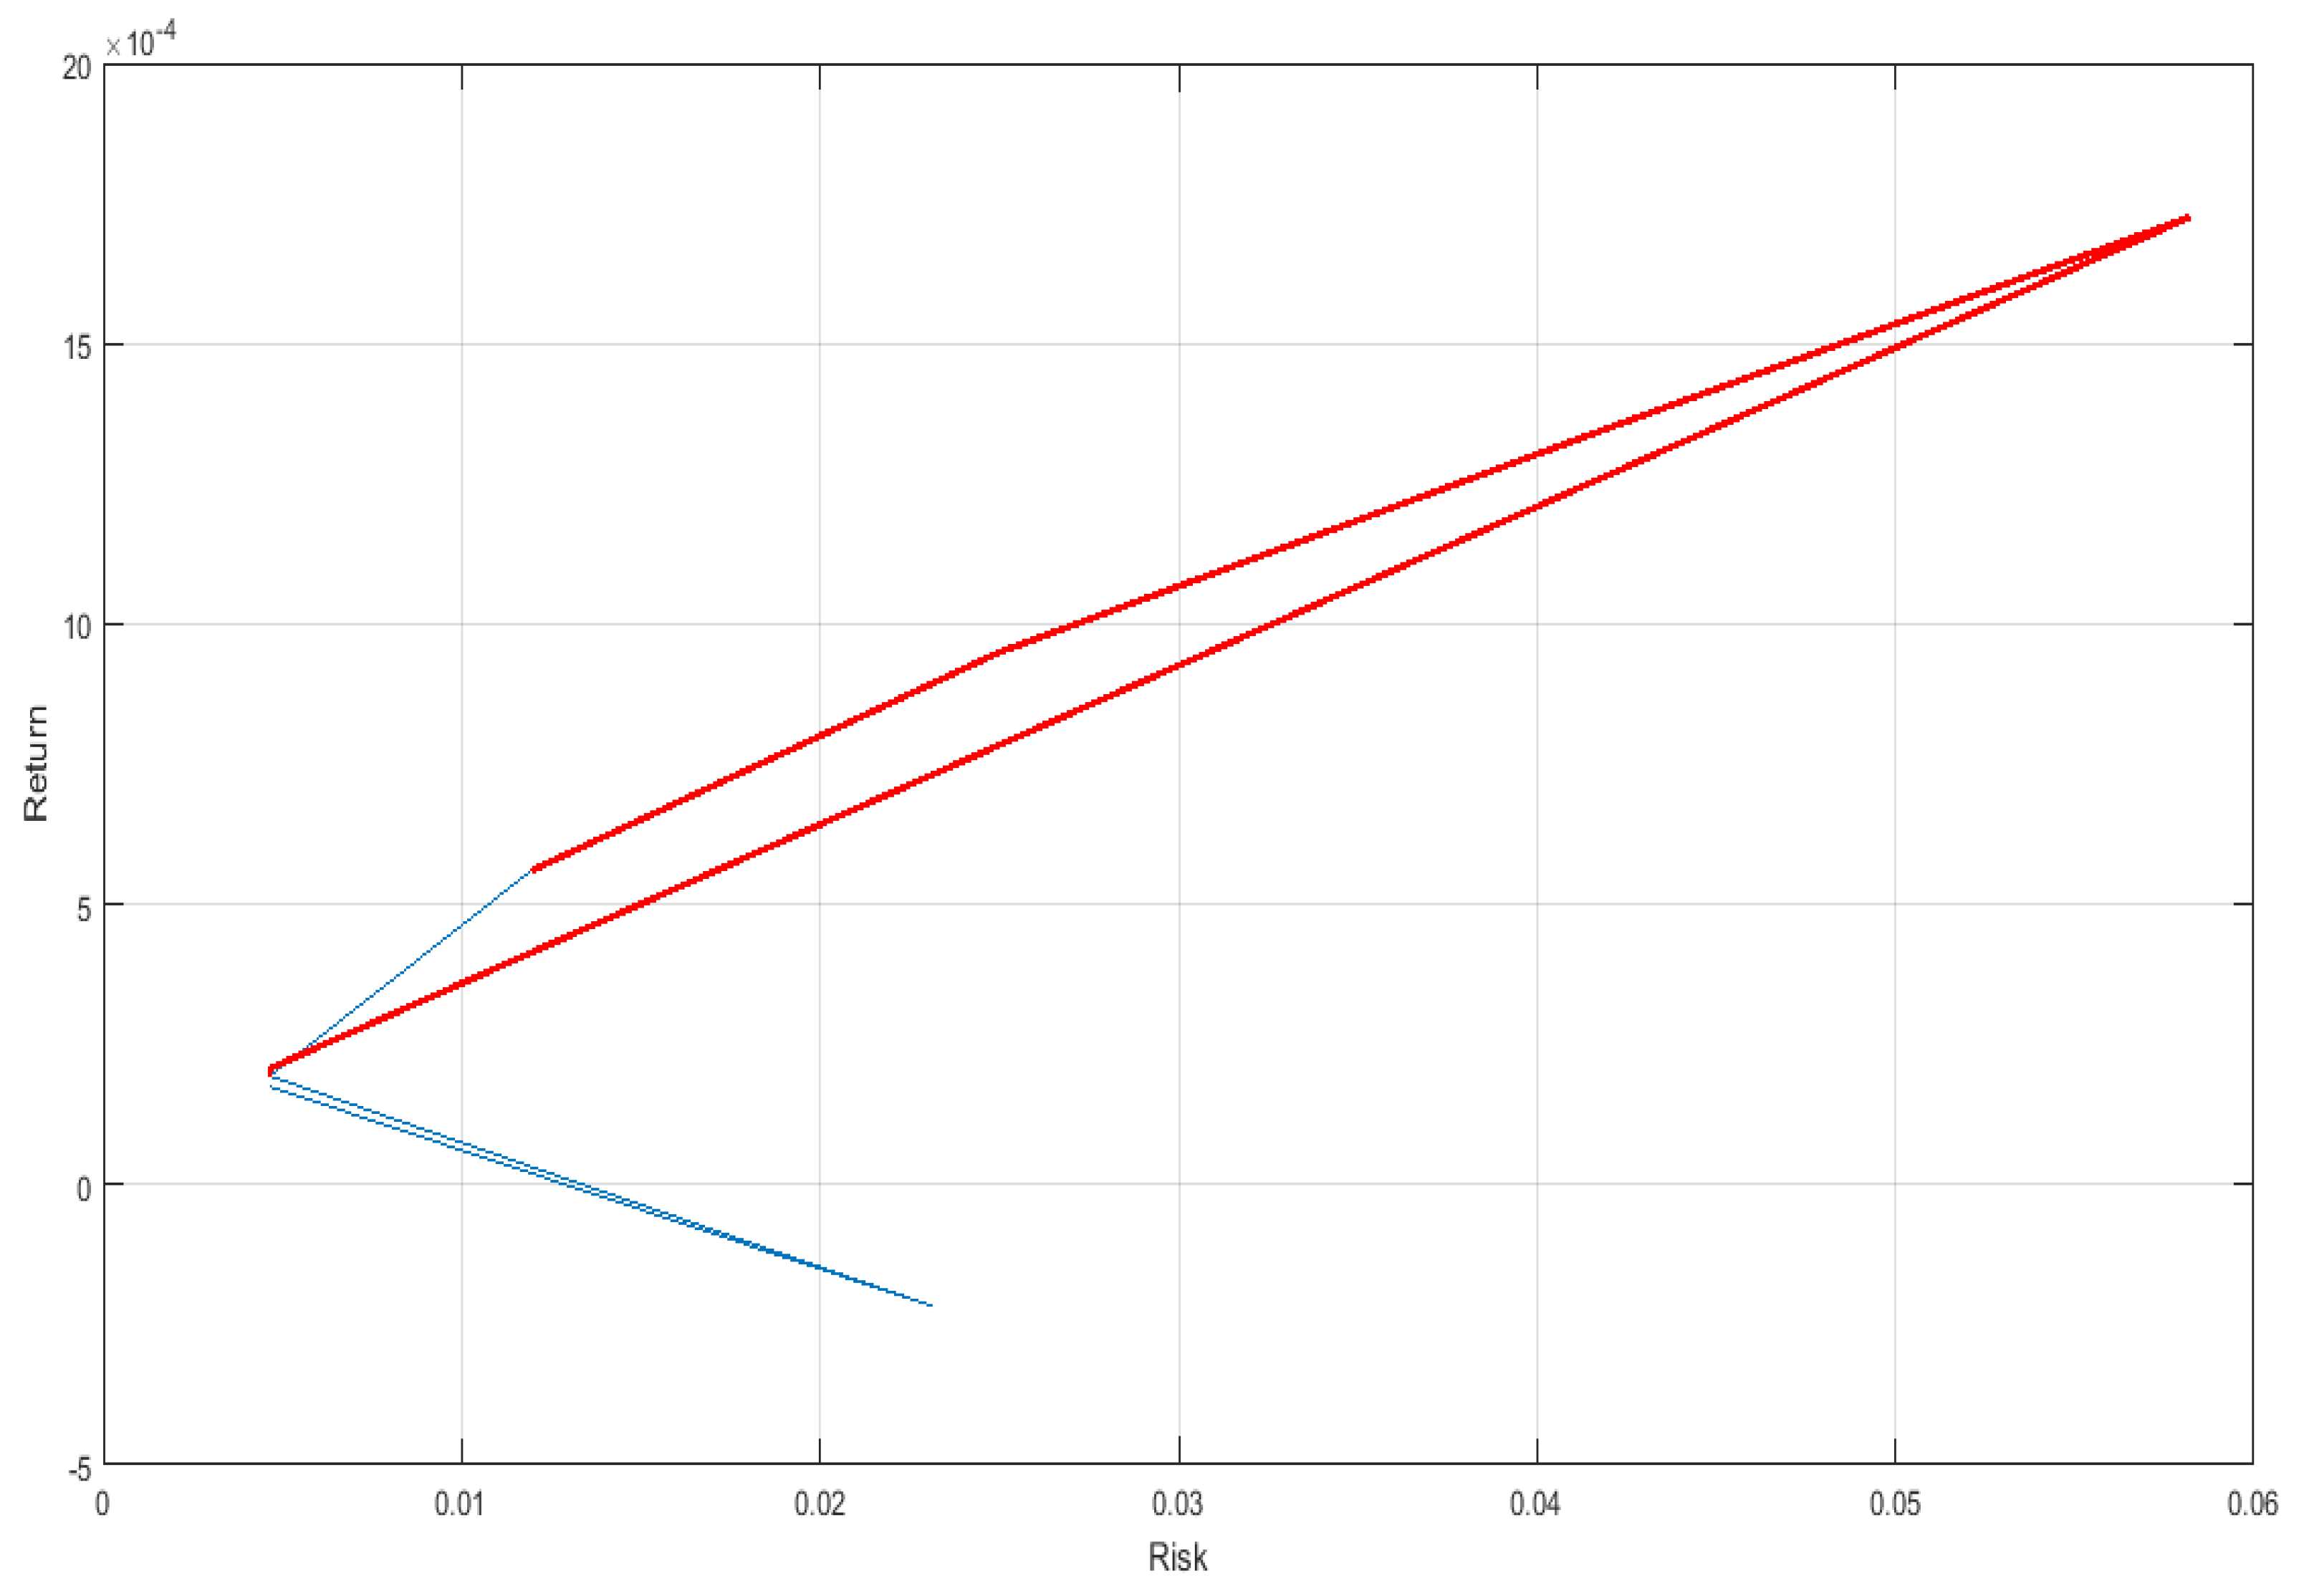
Figure 5,
Figure 6 and
Figure 7 present the efficient frontiers of optimal portfolios during the first period of study using CVaR as a measure of risk under the NSGAII, SPEA2, and PSO algorithms at a confidence level α = 0.95. In fact, the level of confidence, at 95%, is the standard level in the financial risk management and portfolio optimization literature, and it is widely adopted (for example, by
Mansini et al. 2015;
Anh and Binh 2021, among others). A higher level of confidence than 95% generates portfolios that are too conservative; thus, a 95% level of confidence is presented as a balance and a standard in portfolio optimization.
The x-axis represents the target risk, which is an approximation of the volatility of the portfolio, while the y-axis represents its target return. We can notice an upward trend for the three graphs; this means that, to achieve higher returns, more risk should be taken. The red points seen in the NSGAII graph and the blue ones in that of SPEA2 are the Pareto optimal portfolios that obtain the best trade-offs through balancing return and risk.
3.2.1. Performance Evaluation
In this section, we calculated two evaluation metrics, which are Mean Absolute Error (MAE) and Mean Squared Error (MSE), to determine the algorithm’s predictive accuracy.
Table 2 displays the values of MSE and MAE for the four periods and for each algorithm.
According to
Table 2, PSO has the lowest MSE and MAE for most periods (1, 2, and 4), while NSGAII contains the most prediction errors. These results indicate that the algorithm with the lowest MSE and MAE, which was observed to be PSO, is considered a reliable algorithm for forecasting. Thus, investors who care more about minimizing forecasting errors can opt for the PSO algorithm.
3.2.2. Optimal Minimum Risk Portfolio
In the next paragraph, relying on the mean CVaR, we determine the minimum risk portfolio, highlighting the appropriate asset allocation that constructs this portfolio in
Table 3,
Table 4,
Table 5 and
Table 6.
Table 3,
Table 4,
Table 5 and
Table 6 represent the optimal asset weightings and the portfolios risk and return produced by the three algorithms during the four periods of study. These algorithms generate weights for each asset, reflecting the optimal composition of the portfolio. These weights are crucial for building a balanced and profitable portfolio.
Before the spread of COVID-19, the portfolio generated by the three algorithms was largely covered by the S&P Green Bond, with 24.26% in NSGAII, 83.88% in SPEA2, and 85.61% in PSO, and slightly covered by Ripple. Gold comes in second place in the case of the NSGAII and SPEA2 portfolios, and the rest is invested in G7 equities. Contrary to NSGAII and SPEA2, PSO excluded three assets, specifically FTSE MIB, Ripple, gold, and WTI crude oil. Regarding risk measurement, the SPEA2 and PSO algorithms underestimate the portfolio’s risk. After COVID-19 propagation and before the Russia–Ukraine war, the S&P Green Bond contributed significantly to the SPEA2 and PSO portfolios, while gold contributed to the NSGAII portfolio. During this period, Nikkei225 allocations were also significant in the NSGAII and SPEA2 portfolios. The three algorithms excluded several assets: WTI crude oil was excluded from the NSGAII portfolio, Bitcoin was excluded from the SPEA2 portfolio, and CAC40, DAX, Ripple, and WTI crude oil were excluded from the PSO portfolio. NSGAII overestimated the risk of the portfolio. During the health and geopolitical crises, gold and Nikkei225 were the biggest contributors to the NSGAII portfolio, S&P Green Bond to the SPEA2 portfolio, and CAC40 and Nikkei225 to the PSO portfolio. Many assets were eliminated from the optimal portfolio, such as S&P500 from the NSGAII, SPEA2, and PSO portfolios. Differently from what was observed in the first two periods, the PSO algorithm overestimates the portfolio’s risk. After the announcement of the end of COVID-19 as a pandemic and during the Russia–Ukraine conflict, the weights of Nikkei225, S&P500, and S&P Green Bond were significant in the NSGAII portfolio. A total of 50% of the PSO portfolio was allocated to S&P Green Bonds, while investment in these bonds comprised nearly 32% of the SPEA2 portfolio. As seen in periods 1 and 2 of the study, NSGAII overestimates the risk. Ripple was mostly eliminated in the three algorithms.
From the different tables, we can see the differences between the asset allocations across the three algorithms.
Before the COVID-19 outbreak, NSGAII showed a very high proportion of gold and S&P Green Bonds in the optimal portfolio. This suggests a preference for safe havens and fixed-income instruments in the pre-health crisis period. Moving to the second period, which is during the COVID-19 pandemic and before the Russia–Ukraine war, NSGAII shows more distributed allocations of Bitcoin, gold, S&P/TSX, and Nikkei225. The latter obtained a large allocation during the health and the geopolitical crises, similarly to gold. This indicates the resilience of the Japanese market and its potential recovery due to its strong economic policies and the significant allocation of gold to protect portfolios against global uncertainty. Thus, investors look for safety during health and geopolitical crises, while showing optimism regarding certain markets, such as that of Japan. After the announcement of the end of the COVID-19 pandemic and during the ongoing Russia–Ukraine war, the results show moderate allocations for S&P 500, Nikkei 225, and gold, with the highest allocation being obtained by S&P Green Bond. The dominance of the green bond highlights the preference for sustainable investment, and the diversification between equity markets indicates the potential growth opportunities during geopolitical crises such as the Russia–Ukraine conflict. Maintaining gold in a portfolio serves to protect the portfolio from geopolitical risk. So, these results reflect investors’ appetite for limited risk during the conflict and their strategy adjustment based on the lessons learned from the COVID-19 crisis. We can notice from the distribution of wealth among the different mentioned assets and for each period that this algorithm is characterized by its balance and diversification. NSGAII tries to take advantage of the various asset classes. We note the steady allocation of the traditional assets of stocks, commodities, and bonds, while there was a slight reliance on gold and S&P Green Bonds in later periods. We can deduce that NSGAII provides investors with limited exposure to individual assets’ volatility while benefiting from the different asset classes, and we can describe it as a “balanced diversification strategy” due to its consistent diversification of assets, which is corroborated by
Macedo et al. (
2017). This strategy is adequate for investors who are looking for practical expansion.
The SPEA2 algorithm allocation is different from NSGA2. We see a slight concentration on specific assets, as observed for the G7 stock indices, during most periods. There were also significant swings towards other assets, for example, gold during the COVID-19 pandemic and the ongoing Russia–Ukraine war, which is in line with the work of
Esparcia et al. (
2022), and the S&P Green Bond before and during the spread of COVID-19. The significant allocation of gold in the SPEA2 portfolio during crisis periods shows how investors run to haven assets during periods of market uncertainty and high volatility; this highlights the flight-to-safety behavior of investors. SPEA2 is seen as a tool for the adaptive allocation of wealth; this is explained by the quick adjustments of assets’ weights to adapt to novel circumstances, namely the passing from one period to another. Within volatile markets, investors can be opportunistic by making tactical adjustments. PSO distribution is characterized by its focus on specific assets and S&P Green Bonds; usually, this reflects its diversification potential, as noted by
Arif et al. (
2022) and
Rehan et al. (
2024). Investment in this kind of asset has a positive environmental impact because it funds green projects. During the COVID-19 pandemic and the Russia–Ukraine war, we observed strong allocations in the Chinese and the French stock indices. This suggests that these markets are relatively resilient amid global instability. This could be due to the moderating relationship between China and Western market shocks and the strong policies of France. These patterns reflect the selective risk-taking behavior of investors, who mainly looked for strong markets and geographically diversified markets. The PSO algorithm can be described as a limited diversification and consistent allocation strategy, through which investors wait for high returns that cover the accompanied volatility, i.e., risk. Occasional diversification may occur. This strategy is suitable for those who are long-term return seekers. The composition of the optimal portfolio changed from one period to another and for each algorithm.
So, statistically, we find that PSO is a suitable algorithm for predictive accuracy-oriented investors, while for financially oriented and risk-averse investors, NSGAII is the best strategy, which is consistent with the results of
Kaucic et al. (
2019).
Table 7 provides the observed computational time of each algorithm. According to
Table 7, NSGAII is the fastest algorithm, as the computational time does not exceed 2 min, while SPEA2 requires more time—about 8 min. In terms of speed, our study shows how fast NSGAII is, while SPEA2 takes a large amount of time to compute.
Thus, NSGAII is the most favorable in terms of quick decision-making, as noted by
Lwin et al. (
2014); especially within fast-moving markets, this protects investors from high computational power in cases of frequent portfolio optimization.
In sum, the choice of an algorithm and the adoption of its suggested asset weightings depend on investors’ risk tolerance, their investment horizon, and their response to changing economic conditions. Our study could assist individual and institutional investors in building optimal portfolios that match their goals during various market changes.
4. Conclusions
The year 2020 was a memorable year for the whole world, being the year of the COVID-19 pandemic and its drastic repercussions on all levels. Financially, the worldwide stock markets suffered huge losses due to this unpredictable health crisis, which, in turn, became a financial crisis. This health crisis was followed by an ongoing geopolitical crisis: the war between Russia and Ukraine.
In the existing literature, many researchers concentrated on investigating the impact of COVID-19 on the stock markets, while others investigated the Russia–Ukraine war’s repercussions on the international economy. Therefore, we attempted to focus on studying the application of evolutionary algorithms to portfolio optimization during four periods, namely, pre-COVID-19 pandemic, during the COVID-19 pandemic and pre-Russia–Ukraine war, during the COVID-19 pandemic and the Russia–Ukraine war, and post-COVID-19 pandemic and during the Russia–Ukraine war. In our work, we employed three metaheuristic algorithms, NSGAII, SPEA2, and PSO, and CVaR, as a measure of risk to deal with the portfolio optimization.
Our main findings are as follows. There was a significant preference for the S&P Green Bond before and during the health crisis and during the geopolitical crisis, thanks to its portfolio diversification. Over the COVID-19 pandemic and during the war between Russia and Ukraine, the optimal portfolio was mostly covered by Nikkei 225 because of its quick recovery from the pandemic and poor reliance on the Russia–Ukraine markets, while WTI crude oil and both dirty and clean cryptocurrencies were poor contributors to the investment portfolio because these assets are sensitive to geopolitical problems. After the end of the pandemic and during the ongoing Russia–Ukraine war, the three algorithms obtained remarkably different results: there was a miscellaneous distribution of wealth in the case of the NSGAII portfolio, 32% of the SPEA2 portfolio was allocated to the S&P Green Bond, and half of the PSO portfolio was allocated to the S&P Green Bond too. This may be due to differences in investors’ preferences when aiming to protect their fortune and diversify their portfolio during the war. From a risk-averse perspective, NSGAII avoids risk underestimation, while from the perspective of forecasting, PSO is the best algorithm. In terms of time, NSGAII is the fastest algorithm, while SPEA2 requires more time to compute than NSGAII and the PSO algorithm.
To summarize, during market turmoil, including green bonds in the portfolio supports the idea that environmental, social, and governance (ESG) assets provide significant diversification benefits, and for investors and portfolio managers, integrating this green asset enhances the resilience of the investment portfolio during crisis and protects it from market shocks. Moreover, the dominance of the Japanese equity market during the pandemics and geopolitical tensions highlights investors’ preference for stable and developed market equities when facing uncertainty, while WTI crude oil and cryptocurrencies were less attractive during these crises due to their high volatility. This implies that the Japanese equity market represents a secure region during global crises, and investors and portfolio managers can benefit from its strong economic stability. However, oil and cryptocurrencies lose their diversification benefits during turbulent periods. Additionally, the divergence of portfolio allocations across the three algorithms—NSGA, PSO, and SEA2—highlights the sensitivity of metaheuristics to market conditions. The choice of algorithms should be based on investors’ and portfolio managers’ objectives. NSGAII is the most favorable in terms of quick decision-making, which is valuable in the case of frequent portfolio optimization and within fast-moving markets. For risk-averse strategies, NSGAII is the best algorithm, while PSO is more effective for forecasting strategies.
Our results are crucial in terms of portfolio optimization and risk management. Such findings can help investors to compute the risk of a portfolio containing these assets in turbulent periods, like that of the COVID-19 pandemic, to make better decisions, take advantage of investment opportunities, and reduce portfolio losses. Future research can extend on this by employing other metaheuristic algorithms and including more assets in the portfolio. Also, our work can be enriched by incorporating additional accuracy, robustness, and explainability metrics, such as RGA (Rank Graduation Accuracy), as proposed by
Raffinetti (
2023), or through adopting the RGB (Rank Graduation Box) framework presented by
Babaei et al. (
2024).
