Article

Global Uncertainty and BRICS+ Equity Markets: Spillovers from VIX, Geopolitical Risk, and U.S. Macro-Financial Shocks

1
Faculty of Economics and Management of Sfax, University of Sfax, Sfax 3018, Tunisia
2
Department of Engineering and Industrial Management, Transilvania University of Brasov, 500036 Brasov, Romania
3
Faculty of Economics and Management of Mahdia, University of Monastir, Mahdia 5111, Tunisia
*
Author to whom correspondence should be addressed.
Risks 2025, 13(11), 217; https://doi.org/10.3390/risks13110217
Submission received: 22 September 2025 / Revised: 17 October 2025 / Accepted: 22 October 2025 / Published: 4 November 2025

Abstract

This paper investigates how global uncertainty and macro-financial shocks transmitted to BRICS+ equity markets between April 2016 and July 2025. A vector autoregressive (VAR) framework, complemented by Granger-causality tests, variance decompositions, and impulse response functions, is employed to examine four key drivers: U.S. financial market volatility (VIX), geopolitical risk (GPRD), U.S. inflation expectations (T5YIE), and the U.S. term spread (T10Y3M). The findings show that the VIX functions both as a recipient and a transmitter of shocks, amplifying volatility across BRICS+ markets, with India, Brazil, and the Gulf states acting as important nodes in the global contagion network. By contrast, geopolitical risk shocks have only short-lived effects on both U.S. yields and emerging equity markets. Shocks to U.S. inflation expectations and yield-curve dynamics transmit quickly to BRICS+ markets but dissipate within a few days, underscoring efficient market adjustment. Overall, the evidence points to a multipolar structure of global contagion in which BRICS+ markets exert growing influence alongside the United States. These results offer important implications for risk management, portfolio diversification, and policy coordination under heightened uncertainty.

1. Introduction

Financial globalization has significantly amplified the interconnectedness of markets, thereby making financial systems more vulnerable to cross-market contagion during episodes of heightened uncertainty. Early research emphasized global spillovers as a natural byproduct of integration (Kaminsky and Reinhart 2000; Forbes and Rigobon 2002), but more recent evidence shows that systemic risk in emerging markets is often heterogeneous, time-varying, and regionally compartmentalized rather than uniformly tied to U.S. dynamics (Das et al. 2022). At the same time, the channels through which crises are transmitted have become increasingly complex, with the 2008 global financial crisis, the COVID-19 epidemic, the 2022 Russia–Ukraine war, and U.S.–China tensions illustrating that upper-tail and lower-tail contagion may propagate through different mechanisms, such as portfolio rebalancing, wealth effects, credit spreads, and investor sentiment (Yuan et al. 2023). These insights highlight that contemporary contagion dynamics cannot be explained solely through traditional models of financial integration but require a broader analytical approach that accounts for regional structures and crisis specific transmission mechanisms.
Within this complex financial architecture, the BRICS countries, with their extension to BRICS+, have consolidated their position as major actors with a growing influence on global capital dynamics. These economies are not limited to absorbing shocks from developed markets; they also act as net transmitters of volatility and investor sentiment under conditions of heightened economic policy uncertainty, thereby reshaping international financial connectedness (Luong 2025). Recent evidence further confirms that global factors exert significant and asymmetric effects on BRICS equity markets, underscoring their dual role as both recipients and sources of financial shocks (Wang and You 2023). Their interdependence extends beyond the traditional domains of equities and bonds, encompassing linkages through energy, currency markets, and digital assets. Evidence shows that Bitcoin can transmit risk to financial markets through foreign-exchange (FX) channels, with contagion effects more pronounced in FX markets than in equity indices (Soepriyanto et al. 2025). In addition, interactions among geopolitical risk, energy prices, and cryptocurrencies shape co-movements within BRICS economies, confirming the role of crypto-assets as an additional channel of global financial spillovers (Li et al. 2021; Lau et al. 2024). These findings highlight that BRICS+ simultaneously act as both transmitters and recipients of shocks, reinforcing their systemic relevance and adding to the complexity of risk assessment and global financial stability.
In the analysis of contagion mechanisms, global uncertainty indicators occupy a pivotal role. The VIX, widely recognized as the “fear gauge,” encapsulates investors’ perceptions of volatility and has consistently emerged as a key driver of international financial spillovers (Whaley 2000; Kang et al. 2019). Complementing this, the geopolitical risk index (GPRD) reflects global tensions and conflicts that have the potential to disrupt capital flows and undermine macro-financial stability (Caldara and Iacoviello 2022a). Equally important are U.S. macro-financial variables, notably five-year inflation expectations (T5YIE) and the term spread between long- and short-term Treasury yields (T10Y3M), which serve as central indicators of monetary policy orientation and business cycle conditions, exerting systemic influence on international markets (Bayaa and Qadan 2024; Kamal et al. 2025). More recently, empirical evidence highlights the bidirectional nature of these relationships. Geopolitical risks in BRICS markets significantly affect domestic volatility and can spill over globally. Their responses to monetary policy uncertainty also contribute to the transmission of risk across the international markets, although with lower volatility than in G7 economies (Wen et al. 2022). However, most existing studies focus primarily on advanced economies. These contrasting findings highlight the need to reassess the role of global uncertainty indicators in the BRICS+ context, where financial integration has deepened but structural asymmetries remain significant.
Nevertheless, the existing literature reveals several critical limitations that justify the need for deeper analysis. First, the research has focused almost exclusively on developed markets and on the VIX as the main determinant of international contagion, addressing BRICS+ dynamics only marginally and overlooking their potentially asymmetric mechanisms of shock transmission (Su et al. 2019). This approach constrains understanding of how emerging economies, through their institutional structures and dependence on trade and energy flows, may generate impulses that propagate globally. Second, although geopolitical risk has increasingly been incorporated into empirical models, analyses have been confined mainly to advanced economies or to narrow groups of emerging markets, underestimating the role of regions included in BRICS+. Yet recent evidence suggests that these economies can amplify shock transmission through energy and trade channels, and their omission leaves an incomplete picture of global contagion (Jiang et al. 2023; Kayani et al. 2024). Third, the bidirectional dynamics of shocks are often treated unilaterally: while most studies document how uncertainties from the U.S. affect emerging markets, relatively little empirical evidence addresses reverse transmission, from emerging markets to developed economies. This lack of consensus on the directionality of spillovers constrains policymakers’ and investors’ ability to design truly effective risk-management strategies. This gap is particularly relevant for the BRICS+ structure, where large economies such as China, India, and Brazil are increasingly integrated into global capital markets and have the potential to generate feedback effects on U.S. financial conditions and global uncertainty indices. Failing to consider these reverse spillovers may therefore bias empirical findings and limit the development of effective risk management and policy coordination strategies
These limitations underscore the need for analytical frameworks that not only revisit contagion across global markets, a theme extensively studied in the literature but also integrate less explored U.S. macro-financial indicators such as T5YIE and T10Y3M. These measures are critical because they capture the forward-looking dimension of monetary policies and the predictive power of the yield curve for economic activity, yet they have rarely been considered in spillover studies involving BRICS+ markets, despite evidence that inflation dynamics play a central role in shaping growth outcomes in these economies (Manamperi 2014). In this context, the use of a VAR framework is particularly justified, as it allows the detection of dynamic and bidirectional interactions, while impulse response functions trace how shocks to these indicators are transmitted and absorbed across markets. Accordingly, this study contributes to the literature by offering an integrated perspective that goes beyond the conventional focus on VIX and GPRD, empirically testing whether BRICS+ markets are not only recipients, but also potential transmitters of shocks driven by T5YIE and T10Y3M. In addition, by extending the analysis to the broader BRICS+ structure, this study responds directly to recent calls in the literature for the examination of emerging markets as active participants in global risk transmission. To the best of our knowledge, this is the first study to jointly investigate the role of T5YIE and T10Y3M in shaping contagion dynamics between BRICS+ equity markets and global uncertainty indicators.
The next sections present the main contributions of the related literature, followed by the description of the collected data and methodology employed. The empirical section highlights the mechanisms of shock transmission, and the concluding section synthesizes the practical and theoretical implications of the study.

2. Literature Review

2.1. Global Financial Interconnectedness and BRICS+ Dynamics

The interconnectedness of financial markets has been extensively documented, initially through cointegration theories and VAR models (Engle and Granger 1987; Johansen 1995), and more recently through quantitative connectedness frameworks (Diebold and Yilmaz 2014). Empirical evidence shows that shocks propagate rapidly across equities, bonds, energy, and commodities, thereby amplifying global vulnerability (Adeosun et al. 2023; Ren et al. 2022). Within this setting, BRICS and the extended BRICS+ have emerged as pivotal actors, not only as recipients of shocks from advanced economies but also as transmitters through channels of trade, cross-border investment, and energy markets. This dual role underscores their growing systemic importance in shaping global financial dynamics. Their influence extends beyond conventional equity linkages, shaping global stability through energy, commodity, and increasingly digital-asset markets. Recent evidence further indicates that BRICS+ spillovers intensify during episodes of elevated global uncertainty and monetary tightening, underscoring their evolution from primarily shock recipients to active transmitters within the international risk network. Consistent with this view, Mensi et al. (2025) show that emerging economies such as South Africa and Mexico act as persistent net transmitters of volatility, reinforcing the systemic role of large emerging markets in global contagion dynamics.
Recent contributions have begun to address this gap by illustrating that spillovers in BRICS markets are not confined to equities. For instance, Shao et al. (2025) report strong contemporaneous linkages between BRICS staple grain futures and U.S. markets, with Brazil and the U.S. acting as major net contributors of shocks, while South Africa functions primarily as a receiver. Similarly, Ouyang et al. (2024) construct systemic risk indices for global commodities and show that while G7 economies are more exposed to extreme price fluctuations, BRICS countries exhibit heterogeneous vulnerabilities depending on their commodity structures. In addition, behavioral dynamics, particularly herding effects, have been shown to amplify spillovers across G7 and BRICS markets (Gouta and BenMabrouk 2024). These findings highlight that BRICS economies are not only recipients of global shocks but also significant transmitters, both through conventional financial channels and through commodity and sentiment contagion mechanisms.

2.2. Volatility, Uncertainty, and Geopolitical Risk

The VIX index has become one of the most widely used measures of expected volatility and has been linked to the equity risk premium. Numerous studies confirm that volatility captured by the VIX affects both emerging and developed markets. Altinkeski et al. (2024) show that while the VIX exerts a strong and lasting influence globally, developed markets tend to absorb shocks more efficiently, whereas emerging markets remain more vulnerable to prolonged volatility transmission. Focusing specifically on BRICS, Sharma et al. (2019) analyses volatility spillovers among BRICS equity volatility indices and identify a long-run equilibrium relationship across several countries. Using an MGARCH framework, they show strong intertemporal linkages and heterogeneous spillover intensities over time, underscoring that VIX dynamics are not purely local but also reflect regional and global interconnectedness. However, most empirical studies have focused on spillovers to advanced economies, neglecting emerging blocs such as BRICS+. For instance, Papathanasiou and Koutsokostas (2024) find that VIX shocks predominantly transmit volatility to developed European markets, suggesting that their propagation mechanisms may differ significantly across emerging financial systems, which represents a gap that this study addresses.
In parallel, geopolitical risk has gained prominence with the development of the GPRD index, which has been widely applied to evaluate the impact of conflict and uncertainty on financial flows. The evidence is mixed: some studies highlight transitory effects (Pástor and Veronesi 2013), while others emphasize persistent and structural impacts, especially during crisis periods (Bouri et al. 2018). Recent analyses of the Russia–Ukraine war demonstrate that geopolitical shocks exert asymmetric effects on emerging versus advanced markets (Gopal et al. 2025; Gökgöz et al. 2024). Extending this direction, Zhang et al. (2025) show that volatility transmission between the BRICS and US equity markets varies with the nature of the shock: contagion was persistent and strong during the COVID-19 crisis, but short-lived and pulse-like during the Russo–Ukrainian conflict. However, most of these studies have focused either on global markets or on bilateral linkages, without examining the extended BRICS+ structure. Moreover, Ouyang et al. (2025) report that geopolitical risk exerts a strong and persistent influence on advanced economies, suggesting that its effects may differ across market groups. This highlights the need for further empirical assessment of whether geopolitical shocks in BRICS+ markets propagate differently compared to those in developed economies. These findings highlight that BRICS markets’ vulnerability to global uncertainty is context-dependent, shaped by both the origin and the type of the crisis.

2.3. U.S. Macro-Financial Variables and Global Spillovers

The role of U.S. macro-financial indicators in driving global spillovers has been extensively documented. The slope of the U.S. Treasury yield curve, measured by the spread between long- and short-term maturities, is widely regarded as a robust predictor of recessions (Estrella and Hardouvelis 1991) and as a proxy for market expectations of future economic conditions (Gürkaynak et al. 2010). Empirical evidence shows that changes in the term spread influence international capital flows and asset pricing in both advanced and emerging economies (Sarno et al. 2016). Likewise, inflation expectations extracted from Treasury Inflation-Protected Securities (TIPS) and breakeven rates (T5YIE) provide forward-looking indicators that are increasingly employed to evaluate risk–return trade-offs in global financial markets (Christensen et al. 2010). Recent evidence confirms that U.S. inflation expectations play a central role in transmitting monetary shocks internationally and shaping investor sentiment in global equity markets (Chiang and Chen 2023).
These macro-financial variables serve as channels through which fiscal policy and U.S. monetary shocks are transmitted internationally. Evidence shows that movements in U.S. yield spreads and inflation expectations generate volatility spillovers to emerging-market equities, bonds, and currencies, with TIPS-based measures providing useful insights into these dynamics (Papathanasiou et al. 2023). More recent studies demonstrate that the magnitude of these spillovers differs across countries and over time, with emerging markets often displaying heightened sensitivity (Castello and Resta 2022). However, while much of the literature focuses on the transmission of U.S. variables to international markets, relatively little is known about potential feedback effects from BRICS+ to the U.S., leaving bidirectional dynamics underexplored.

2.4. Research Gaps, Hypotheses, and Contribution

The review highlights three main shortcomings in the existing literature. First, prior research remains fragmented, often analyzing global uncertainty indices, geopolitical risk, or U.S. macro-financial variables separately rather than within an integrated framework (Antonakakis et al. 2014). Recent evidence confirms that uncertainty indicators exert joint and nonlinear effects across global financial systems, yet most studies still treat them separately rather than simultaneously (Chen 2023). Second, BRICS+ markets have received limited attention, despite their growing influence through both traditional and alternative contagion channels (Salisu et al. 2022). However, much of the existing work focuses on volatility connectedness alone, overlooking broader transmission mechanisms and cross-market interdependencies within BRICS financial systems (Ijaz et al. 2025). Third, most studies emphasize unidirectional transmission from the U.S. to emerging markets, with limited exploration of possible feedback effects, even though some evidence suggests their existence (Su et al. 2019). This leaves a major research gap concerning whether BRICS+ markets act solely as shock absorbers or also as net transmitters of volatility back to the United States and global uncertainty indicators. To address these gaps, this study applies a VAR framework with impulse response functions, enabling a simultaneous investigation of interactions between BRICS+, the VIX, GPRD, and U.S. macro-financial variables. Studies such as Li et al. (2024) highlight the impact of geopolitical risks and economic policy uncertainty on stock market spillovers within BRICS, yet the literature still lacks a unified approach that incorporates both global uncertainty indices and U.S. macro-financial indicators, leaving bidirectional spillovers underexplored.
Accordingly, the study formulates the following testable hypotheses:
H1: 
Shocks originating from U.S. macro-financial indicators are transmitted to BRICS+ equity markets, generating significant volatility spillovers.
H2: 
BRICS+ markets are not only recipients but also potential transmitters of shocks, producing bidirectional spillovers toward U.S. financial indicators and global uncertainty indices.

3. Data and Methodology

3.1. Data

This study employs daily data spanning the period from April 1, 2016, to July 2, 2025. The selected period is justified by two considerations: first, it captures major episodes of global financial and geopolitical uncertainty (Brexit aftermath, U.S.–China trade tensions, COVID-19 crisis, Russia–Ukraine conflict, and post-pandemic monetary tightening cycles), and second, consistent data availability for all BRICS+ members begins after 2016, ensuring sample comparability and reliability. Equity market indices for BRICS+ economies were retrieved from Refinitiv Datastream (Refinitiv 2025) and Bloomberg (Bloomberg L.P. 2025), covering SSE (China), RTSI (Russia), BSE30 (India), BVSP (Brazil), JTOPI (South Africa), TASI (Saudi Arabia), ADX (Abu Dhabi), and EGX30 (Egypt). Iran, Indonesia and Ethiopia, despite being full BRICS+ members, were excluded due to the lack of consistent and continuous daily equity data for the full sample period, as well as limited market liquidity and accessibility in global databases. Moreover, their recent accession to BRICS+ does not allow for a sufficiently long time series required for reliable VAR estimation and impulse response analysis. VIX was sourced from CBOE (CBOE Volatility Index), while GPRD was obtained from the Caldara and Iacoviello database (Caldara and Iacoviello 2022b). To capture U.S. macro-financial dynamics, T5YIE and T10Y3M were collected from FRED (Federal Reserve Bank of St. Louis 2024) and serve as forward-looking indicators of monetary policy expectations and yield-curve behavior.
The choice of national benchmark indices is motivated by their ability to reflect overall market performance in each country. These indices are widely recognized as standard barometers of national equity markets and are extensively employed in the literature on international spillovers and financial integration. Focusing on country-level benchmarks allows the analysis to capture broad market dynamics, avoiding sectoral or firm-specific idiosyncrasies, and is consistent with the objective of assessing systemic cross-market volatility transmission across BRICS+ economies during periods of heightened uncertainty. All equity indices were analyzed in their domestic currency denominations, following established practices in spillover literature, to preserve country-specific market dynamics (Diebold and Yilmaz 2014). This approach prevents distortion of equity return behavior that would arise from currency conversion and ensures that spillover effects reflect genuine equity market interdependence rather than exchange rate volatility.
All price series were converted into daily log returns to ensure stationarity, in line with prior studies (Antonakakis et al. 2014). The macro-financial indicators (T5YIE, T10Y3M) and GPRD were employed in first differences when required, based on standard unit root tests (ADF and PP). Data reliability was ensured by cross-checking values across alternative sources and by trimming the data at the 1% and 99% levels to mitigate the influence of extreme outliers.

3.2. Descriptive Statistics

Table 1 reports the descriptive statistics. Equity indices display near-zero mean returns, consistent with the stylized facts of financial time series. Volatility varies markedly across markets, with BVSP and EGX30 exhibiting higher standard deviations, whereas Gulf markets (TASI, ADX) appear comparatively more stable. RTSI records the widest return range (±2.3), reflecting the impact of financial and geopolitical turbulence. VIX shows substantially higher variability relative to equity indices, capturing episodes of global uncertainty. All return series exhibit negative skewness, indicating a higher probability of extreme negative returns, a common feature in emerging markets. Kurtosis values exceed 3 for all series, confirming leptokurtic distributions with fat tails, which justify the use of econometric techniques robust to non-normality. Among macro-financial indicators, T5YIE remains relatively stable yet responds to inflation expectations and monetary policy shocks, while T10Y3M fluctuates more strongly and frequently turns negative during recessionary phases as the yield curve inverts. GPRD displays the greatest dispersion, in line with its construction as a measure of tail geopolitical risk episodes rather than normal market fluctuations. The return distributions exhibit significant skewness, with some indices showing pronounced asymmetry indicating a tendency toward extreme positive or negative returns. Additionally, the excess kurtosis values are markedly high across the indices, reflecting heavy-tailed distributions and a higher likelihood of extreme market events than suggested by normal distributions.

3.3. Unit Root Tests

To ensure the suitability of the data for VAR modeling, the stationarity of all series was examined using the Augmented Dickey–Fuller (ADF) and Phillips–Perron (PP) unit root tests. The results, reported in Table 2, indicate that the null hypothesis of a unit root is rejected at the 1% significance level for all variables. This confirms that the series are stationary in their employed form, thereby eliminating concerns about spurious regression and validating their use in the subsequent econometric analysis.

3.4. Methodology

To investigate the dynamic interdependencies among BRICS+ equity indices, U.S. macro-financial indicators, and global risk measures, this study employs a vector autoregressive (VAR) framework. Originally introduced by Sims (1980), VAR models are well suited for multivariate time series in which each variable is a linear function of its own past values and those of other variables. Their flexibility and ability to capture complex dynamic interactions have established them as standard tools in applied macro-financial research (Lütkepohl 2005; Becketti 2020). Compared with alternative approaches such as structural equation models, GARCH-type frameworks, or quantile regressions, the VAR methodology offers a more parsimonious way to capture both short- and medium-term interdependencies without imposing restrictive assumptions on the transmission channels.
The general form of a VAR(p) can be written as:
Y t = A 1 Y t 1 + A 2 Y t 2 + + A p Y t p + B X t + u t ,
where Yt is an n × 1 vector of endogenous variables (BRICS+ equity returns, VIX, GPRD, T5YIE, T10Y3M), Xt is an m × 1 vector of exogenous controls, Dt contains deterministic terms, Ai, and B, are parameter matrices, and ut is a vector of innovations assumed to be white noise.
In this study, two alternative VAR specifications are estimated. Both models include the BRICS+ benchmark indices (SSE, RTSI, BSE30, BVSP, JTOPI, TASI, ADX, EGX30) together with the U.S. macro-financial variables T5YIE and T10Y3M. The distinction lies in the choice of the global uncertainty proxy: the first specification incorporates VIX, whereas the second replaces it with GPRD to assess whether the transmission of shocks differs between financial market volatility and geopolitical risk.
Formally, the first specification is:
S S E t R T S I t B S E 30 t B V S P t J T O P I t T A S I t A D X t E G X 30 t T 5 Y I E t T 10 Y 3 M t V I X t = α 0 + A 1 S S E t 1 R T S I t 1 V I X t 1 + + A k S S E t k R T S I t k V I X t k + ε 1 , t ε 2 , t ε 11 , t
The second specification replaces VIX with GPRD:
S S E t R T S I t B S E 30 t B V S P t J T O P I t T A S I t A D X t E G X 30 t T 5 Y I E t T 10 Y 3 M t G P R D t = α 0 + A 1 S S E t 1 R T S I t 1 G P R D t 1 + + A k S S E t k R T S I t k G P R D t k + ε 1 , t ε 2 , t ε 11 , t
This dual specification enables disentangling the effects of VIX from GPRD, thereby providing a richer perspective on the sources of uncertainty affecting BRICS+ markets. Following the estimation of the VAR, impulse response functions (IRFs) are employed to trace the time-path impacts of shocks originating in one variable on all others in the system. The forecast error variance decomposition (FEVD) measures the extent to which the forecast uncertainty of a given variable can be attributed to innovations in other variables. These tools capture both the magnitude and persistence of spillovers across financial, macroeconomic, and uncertainty channels. This methodological framework offers a comprehensive basis for assessing the role of BRICS+ markets as both recipients and transmitters of global shocks.

4. Results and Discussion

4.1. VIX Shocks and Spillovers to BRICS+ Equity Markets

The Granger-causality results (Table A1) reveal a highly interconnected global financial network in which shocks propagate rapidly across emerging-market equities, regional indices, and U.S. interest-rate indicators. At the center of this network lies VIX, functioning both as a barometer and a generator of global risk. Notably, BSE30, BVSP, and TASI exert significant influence on VIX, indicating that risk transmission is not unidirectional from advanced to emerging markets and that volatility can also originate within major emerging economies. Once activated, VIX becomes an active transmitter of shocks: it significantly affects SSE, BSE30, JTOPI, TASI, ADX, EGX30, and T10Y3M, confirming its dual role as both a receiver and an amplifier of global risk within the U.S.—BRICS+ interconnected system.
Cross-market equity spillovers reinforce this view of deep integration. As shown by the Granger-causality results, SSE responds not only to VIX but also to shocks from BSE30, BVSP, JTOPI, and TASI, underscoring China’s exposure to both regional neighbors and distant emerging markets. BVSP, in turn, transmits significant impulses to RTSI, highlighting a South–South transmission channel within the BRICS sphere. This pattern is in line with findings by Gnagne et al. (2024), who show that BRICS markets increasingly act as transmitters of systemic risk. BSE30 stands out as both vulnerable and influential: it is affected by VIX, SSE, BVSP, ADX, T5YIE, and T10Y3M, yet also propagates shocks to BVSP and TASI. This dual role reflects India’s growing integration in global capital markets and its sensitivity to both equity and macro-financial shocks, consistent with the evidence presented by Kumar and Dua (2024), who document how U.S. yield dynamics interact with capital flows to BRICS and reinforce cross-market dependence.
Regional dynamics in Asia, Africa, and the Middle East further demonstrate the global reach of these spillovers. South Africa’s JTOPI is affected by VIX, SSE, BSE30, BVSP, ADX, T5YIE, and T10Y3M, which reflects strong financial exposure to both global volatility conditions and U.S. monetary policy signals. Saudi Arabia’s TASI responds to volatility shocks from VIX, SSE, and BSE30, while Abu Dhabi’s ADX is influenced by both global and regional factors, including VIX, T5YIE, and TASI, as well as BRICS indices such as BVSP and BSE30. North Africa is integrated as well, with Egypt’s EGX30 shaped by shocks from VIX, JTOPI, ADX, and T5YIE. Importantly, the results confirm the existence of reverse spillovers: together with BSE30, JTOPI, TASI, and ADX, EGX30 feeds directly into U.S. five-year inflation expectations, confirming a feedback channel from emerging markets to U.S. financial conditions rather than a purely unidirectional dependence.
Finally, the U.S. yield curve is far from insulated. T10Y3M is significantly influenced by VIX, BSE30, JTOPI, TASI, and ADX, indicating that global equity dynamics and Middle Eastern markets shape U.S. monetary policy expectations. Similarly, T5YIE reacts to spillovers from BRICS+ markets, suggesting that inflation expectations in the United States embed external risk factors transmitted through financial globalization. Taken together, T5YIE and T10Y3M function not only as conduits of domestic fundamentals but also as receivers of international equity shocks, confirming the existence of bidirectional shock transmission between the United States and BRICS+ financial systems.
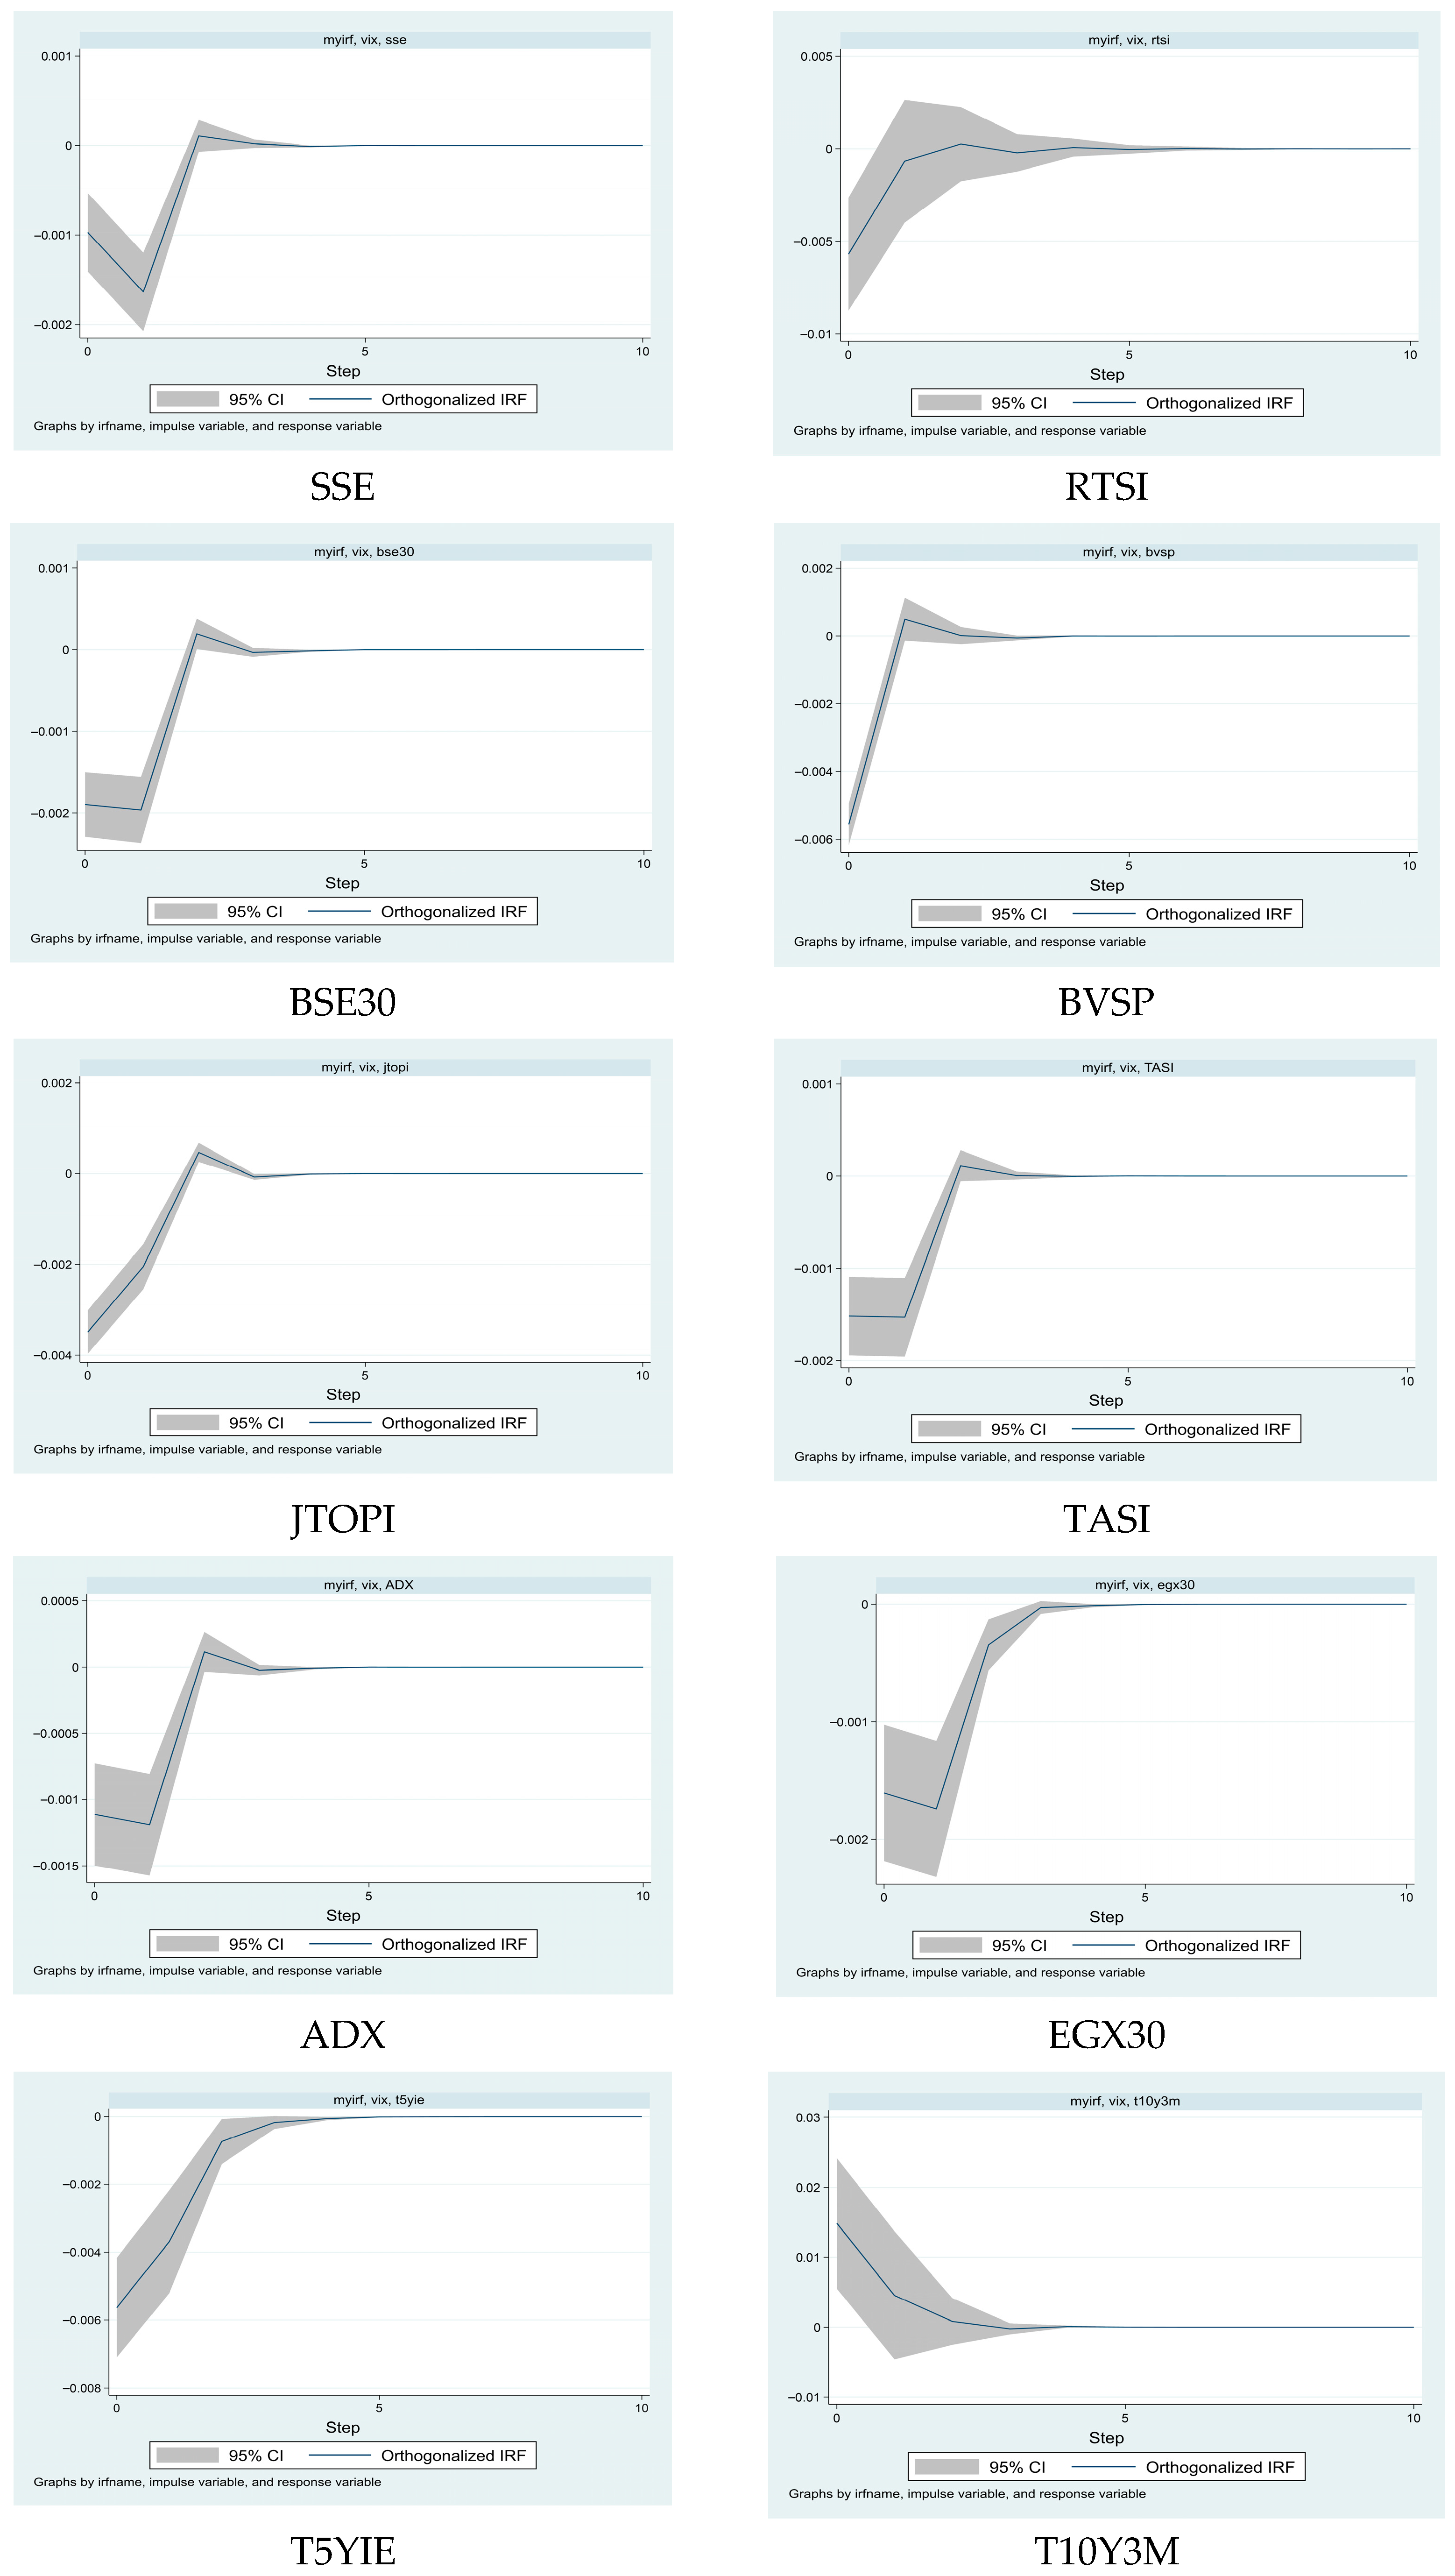
The IRFs provide further insights into the short-run dynamics of VIX shocks (Figure 1). SSE exhibits an immediate and sharp decline, followed by a rapid reversal within one to two periods, which aligns with the view that Chinese markets absorb external volatility swiftly through state-driven liquidity injections and targeted policy interventions. RTSI shows the most volatile response, with a sluggish return to equilibrium over three periods, reflecting its structural vulnerability to global risk sentiment and commodity dependence. BSE30 also reacts negatively but with a smaller magnitude, stabilizing more quickly than RTSI, indicating that India, while financially integrated, maintains a relatively stronger market shock-absorption capacity due to diversified capital flows and macroprudential buffers.
BVSP and JTOPI both register sharp negative responses to VIX shocks, though the effects dissipate rapidly. For BVSP, the shock is absorbed within a few periods, while JTOPI’s smaller amplitude suggests greater resilience, possibly due to a higher share of domestic institutional investors and lower exposure to speculative capital flows. Similar short-lived declines are also evident for TASI, ADX, and EGX30, confirming that Gulf and North African markets are exposed to volatility spillovers, although the effects remain transitory and do not generate persistent contagion dynamics within the regional markets.
Turning to U.S. financial indicators, T5YIE exhibits a modest increase following a VIX shock, whereas T10Y3M steepens sharply, reflecting flight-to-safety flows into long-term Treasuries. Both effects dissipate within two to three periods, highlighting the resilience of U.S. markets and the anchoring of inflation expectations even under heightened global uncertainty. Overall, these results lend strong support to H1, confirming that global volatility shocks captured by the VIX are transmitted across BRICS+ equity markets and U.S. yields, albeit with heterogeneous intensity and short-lived persistence. The time-path behavior of these dynamics underscores the dominance of short-horizon contagion mechanisms over longer-term structural spillovers. The detailed VAR regression results underlying these responses are presented in Supplementary Table S1.

4.2. GPRD Shocks and Spillovers to BRICS+ Equity Markets

The Granger-causality results (Table A2) point to a densely interconnected global financial system in which equity markets across Asia, Latin America, the Middle East, and North Africa transmit shocks both among themselves and toward U.S. interest-rate expectations. By contrast, GPRD occupies a largely peripheral position, consistent with evidence from Zhang and Hamori (2022), who find that geopolitical risk plays a secondary role compared to financial indicators. However, its effects should not be underestimated, as Çepni et al. (2023) show that BRICS carry trades are highly responsive to geopolitical uncertainty, suggesting that such shocks may influence capital flows and risk premia through specific channels, even if their aggregate role remains limited. Within this framework, SSE emerges as a key receiver of shocks from BSE30, BVSP, and JTOPI, underscoring its sensitivity to both regional and global equity conditions, a result aligned with Wen et al. (2022), who highlight heterogeneous but persistent transmission patterns in BRICS. Additionally, the role of geopolitical risk may operate indirectly through exchange rate movements and trade balances, as documented by Ekanayake and Dissanayake (2022) document that exchange rate volatility shapes U.S. trade with BRICS, reinforcing the broader view that uncertainty can transmit through multiple economic channels
RTSI responds significantly to impulses from BVSP and T5YIE, highlighting the combined influence of Latin American markets and U.S. rate expectations. BSE30 is affected by BVSP, JTOPI, ADX, T5YIE, and T10Y3M, reflecting its dual exposure to emerging-market peers and U.S. monetary policy signals. BVSP, in turn, is shaped by ADX, EGX30, and T5YIE, revealing strong transmission channels from the Middle East and North Africa as well as sensitivity to U.S. real yields.
JTOPI exhibits the broadest global integration, reacting to SSE, BSE30, BVSP, TASI, ADX, T5YIE, and T10Y3M, thereby acting as a conduit that links major emerging equity markets with U.S. bond dynamics. Within the Gulf, TASI is influenced by BSE30, BVSP, JTOPI, and ADX, while ADX itself responds to SSE, BSE30, BVSP, and T5YIE. EGX30 is affected by JTOPI and T5YIE, anchoring North Africa to both South African equity conditions and U.S. real yields.
Feedback effects into U.S. rates are pronounced. T5YIE is driven by BSE30, BVSP, ADX, and EGX30, while T10Y3M responds to BSE30, JTOPI, TASI, ADX, and T5YIE. These findings indicate that U.S. yield expectations incorporate external financial conditions transmitted through BRICS+ equity markets, demonstrating that U.S. yield expectations are shaped not only by domestic fundamentals but also by international equity markets.
The IRFs provide further insight into the short-run dynamics of GPRD shocks (Figure 2). For T5YIE, a positive shock to geopolitical risk generates an immediate increase of about 0.02, heightened risk aversion and a temporary repricing of inflation expectations. The effect, however, quickly reverses, falling below zero by the second day and returning to baseline within five days, consistent with the transitory nature of geopolitical shocks. Similarly, T10Y3M jumps to about 0.04 on impact, steepening the yield curve, but reverts to baseline within three days as markets reassess growth and monetary policy expectations. These patterns indicate that U.S. bond markets internalize geopolitical shocks rapidly and efficiently, preventing the emergence of prolonged contagion.
Across equity markets, RTSI, BVSP, JTOPI, EGX30, TASI, and BSE30 exhibit immediate negative responses to a GPRD shock, consistent with the view that heightened geopolitical tensions depress short-term performance by increasing uncertainty and risk premia. These effects are transitory, with most indices reverting to equilibrium within a few days. BVSP and JTOPI, in particular, rebound rapidly, suggesting that although these markets are sensitive to geopolitical risk, they do not experience persistent dislocations and are able to absorb external shocks through rapid price adjustments and liquidity recovery.
For ADX and SSE, the IRFs reveal a short-lived increase followed by a sharp decline below zero, with both indices stabilizing around baseline within four days. The response is consistent with expectations, as geopolitical shocks tend to dampen equity valuations. However, the limited magnitude and duration of these responses indicate that these markets possess effective absorption mechanisms, likely supported by domestic policy interventions, market regulation frameworks, and liquidity buffers that prevent volatility amplification.
The evidences indicates that GPRD shocks generate short-term volatility in U.S. yields and BRICS+ equity markets, but the effects are rapidly absorbed and lack persistence. For investors, this suggests that while geopolitical events may temporarily affect bond pricing and equity valuations, long-term portfolio strategies should remain anchored in fundamentals rather than transient risk episodes. For policymakers, the results highlight the importance of robust institutional frameworks and adequate liquidity buffers that enable financial systems to absorb geopolitical shocks without major disruptions. Overall, the results support H2 by confirming that BRICS+ markets participate in global shock transmission, although geopolitical risk generates weaker and less persistent spillovers compared to VIX. The detailed VAR regression results underlying these responses are presented in Supplementary Table S2.

4.3. T5YIE Shocks and Spillovers to BRICS+ Equity Markets

The Granger-causality results point to a complex and tightly interconnected global financial system in which emerging-market equities and U.S. interest-rate measures are strongly interlinked (Table A3). The SSE is significantly affected by shocks from BSE30, BVSP, and JTOPI, underscoring that developments in major emerging markets propagate swiftly across regions. The RTSI is shaped by impulses from BVSP and T5YIE, suggesting that both Latin American equity dynamics and T5YIE influence Russian equities, consistent with the evidence that commodity-linked economies display heightened sensitivity to U.S. macro-financial shocks.
BSE30 responds to a wide set of drivers, including SSE, BVSP, JTOPI, TASI, ADX, and T5YIE, highlighting its high degree of global financial integration and vulnerability to shifts in U.S. monetary policy. BVSP is shaped primarily by EGX30 and T5YIE, reflecting both South–South linkages and the centrality of U.S. yield expectations for Latin American equities, in line with Gao et al. (2024). JTOPI emerges as a major transmission hub, absorbing shocks from SSE, BSE30, BVSP, TASI, ADX, and T5YIE, thereby connecting African equities with both Asian markets and U.S. interest-rate conditions.
In the Gulf, TASI is significantly affected by T5YIE, BSE30, BVSP, JTOPI, and ADX, underscoring the strong interdependence of Gulf markets with both emerging equities and T5YIE. Balli et al. (2021) show that U.S. uncertainties drive spillovers into international markets; our findings extend this evidence by demonstrating that T5YIE acts as a critical transmission channel for Gulf markets. Similarly, ADX responds to SSE, BSE30, BVSP, and T5YIE, illustrating the influence of both U.S. yields and Asian markets in shaping regional dynamics. EGX30 reacts to JTOPI and T5YIE, confirming North Africa’s exposure to African equity shocks and U.S. real yields through integrated financial and trade linkages.
These results are consistent with Panda et al. (2023), who show that BRICS equity markets are highly sensitive to both inflation dynamics and broader macroeconomic fundamentals. By incorporating T5YIE as a forward-looking measure of T5YIE, our analysis extends this literature and demonstrates that BRICS+ markets are not only driven by domestic inflation but also by international monetary policy signals. Kumar and Dua (2024) argue that higher U.S. Treasury yields reduce foreign portfolio investment inflows into BRICS economies. However, our findings reveal heterogeneous responses across BRICS+ markets: some markets, such as BVSP and JTOPI, display quick adjustments, indicating partial resilience to U.S. monetary tightening through regional capital reallocation and market depth effects.
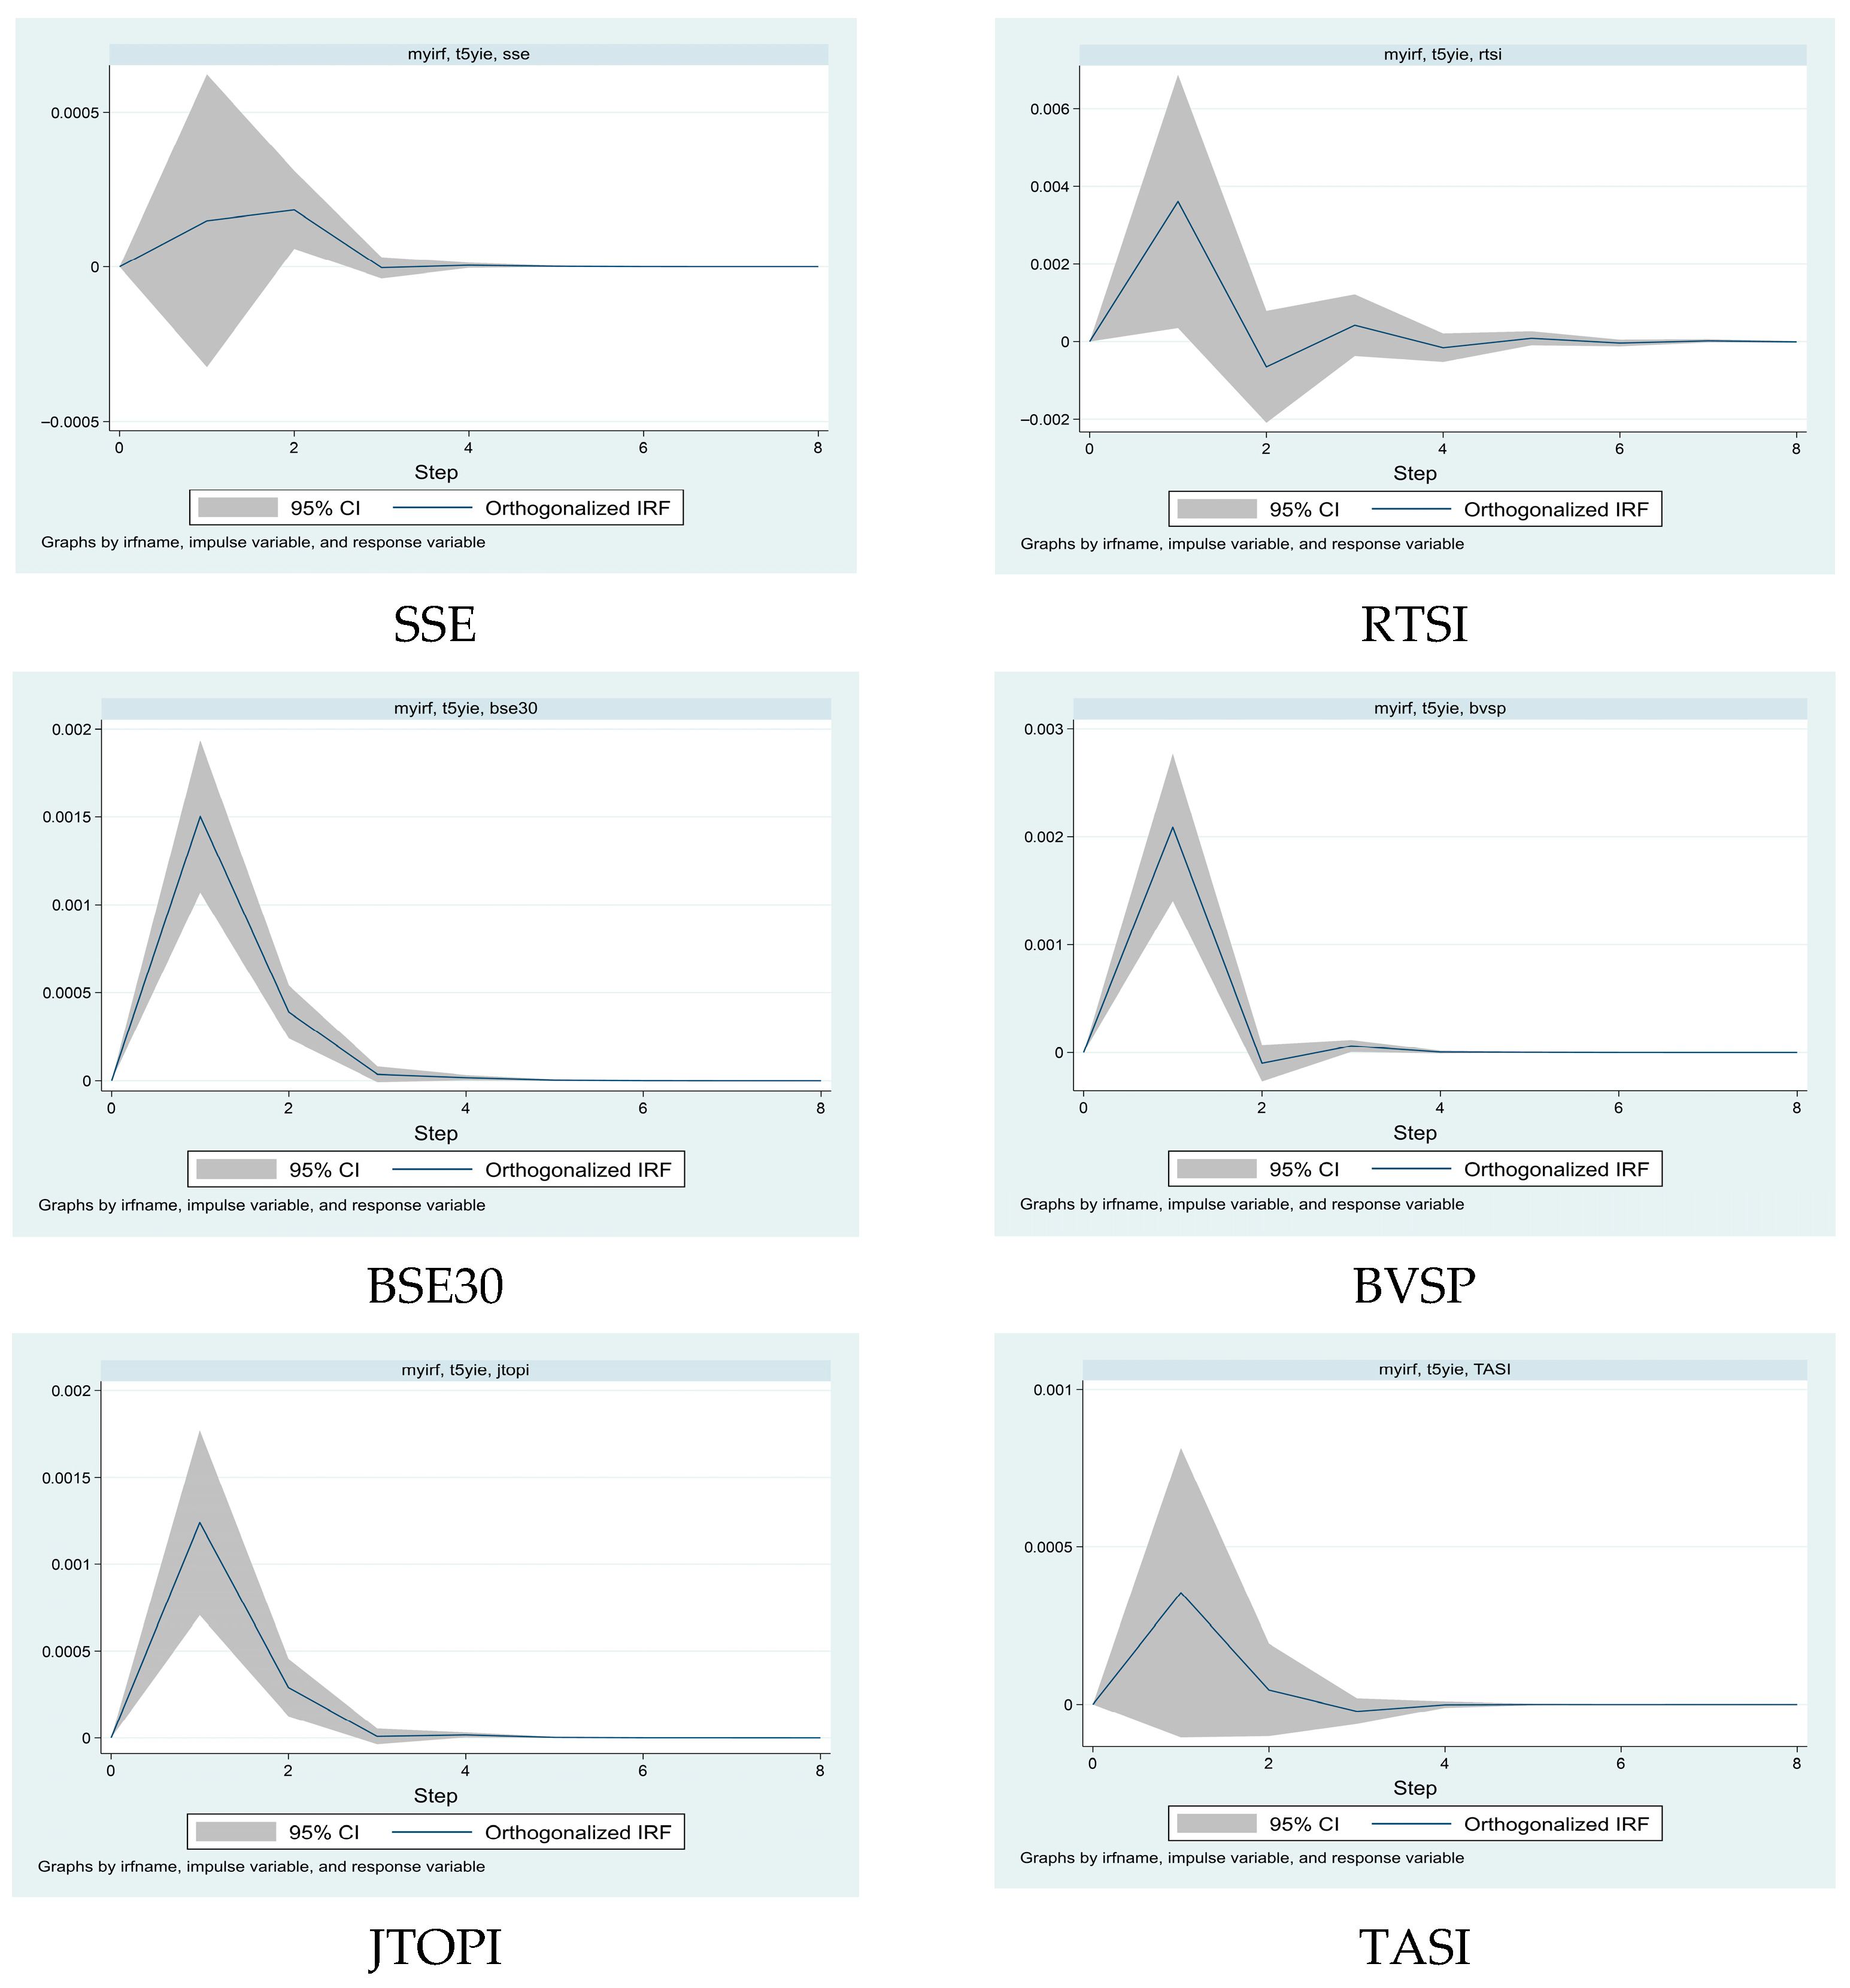
The IRFs provide further insight into the transmission of T5YIE shocks (Figure 3). JTOPI exhibits the strongest immediate response: following a positive T5YIE shock, the index rises sharply on impact, indicating that higher T5YIE can temporarily boost returns in highly integrated markets through anticipations of stronger nominal growth and capital inflows. The effect is statistically significant yet short-lived, dissipating within three days, a pattern consistent with rapid arbitrage activity and efficient adjustment to global macro-financial signals.
Other BRICS+ markets exhibit heterogeneous responses. SSE and TASI display small and statistically insignificant reactions, suggesting that domestic policy frameworks and regional conditions buffer them from global inflation shocks. In contrast, BSE30, BVSP, and ADX record more pronounced but temporary positive responses, all converging to baseline within three days. This pattern indicates that although equity valuations across emerging economies are sensitive to T5YIE, the adjustment remains swift and non-persistent, reflecting underlying market resilience.
From an economic perspective, these results suggest that T5YIE shocks function primarily as short-term signals for equity markets rather than as persistent drivers of valuation. Highly integrated economies such as South Africa, India, and Brazil display more immediate and pronounced reactions, whereas markets with stronger domestic anchors such as China and the Gulf states exhibit more muted responses. For investors, this implies that opportunities arising from inflation expectation surprises are transitory. For policymakers, the findings underscore the importance of credible monetary policy frameworks and well-developed bond markets in mitigating volatility spillovers, consistent with recent evidence on the stabilizing role of TIPS during periods of heightened uncertainty. Overall, the evidence lends support to H2 by demonstrating that U.S. macro financial indicators, in particular inflation expectations, constitute significant channels of shock transmission to BRICS+ markets, even though the associated effects remain short lived and exhibit limited persistence. The detailed VAR regression results underlying these responses are presented in Supplementary Table S3.

4.4. T10Y3M Shocks and Spillovers to BRICS+ Equity Markets

The Granger-causality analysis (Table A4) highlights a highly interconnected global financial system in which shocks from emerging-market equities, Gulf markets, and U.S. interest-rate measures propagate rapidly across regions, consistent with the view that yield-curve dynamics function as global risk transmission mechanisms. SSE is significantly influenced by BSE30, BVSP, and JTOPI, confirming its exposure to both Asian and Latin American developments. RTSI is primarily driven by BVSP, pointing to a South–South transmission channel, while BSE30 absorbs impulses from BVSP, JTOPI, ADX, and T10Y3M itself, underscoring its dual sensitivity to emerging-market peers and U.S. bond-market dynamics. BVSP, in turn, is shaped by EGX30, reflecting strong cross-regional financial linkages between Latin America and North Africa.
JTOPI emerges as a central hub, responding to SSE, BSE30, BVSP, TASI, ADX, and T10Y3M, which underscores Africa’s position as an intermediary between Asian, Middle Eastern, and U.S. markets. In the Gulf, TASI is driven by BSE30, BVSP, JTOPI, and ADX, while ADX itself reacts to SSE, BSE30, and BVSP. EGX30 receives impulses from JTOPI and ADX, reinforcing the role of Africa–Gulf linkages in transmitting financial shocks across regions. Finally, T10Y3M is influenced by BSE30, TASI, ADX, and EGX30, confirming that global equity developments feed directly back into U.S. interest-rate expectations. These results are consistent with evidence that yield-curve movements embed international spillovers from equity markets and commodity markets alike. In particular, Umar et al. (2022) demonstrate that oil price shocks significantly affect the level, slope, and curvature of the U.S. yield curve across different time horizons, highlighting T10Y3M as both a receiver and transmitter of global shocks.
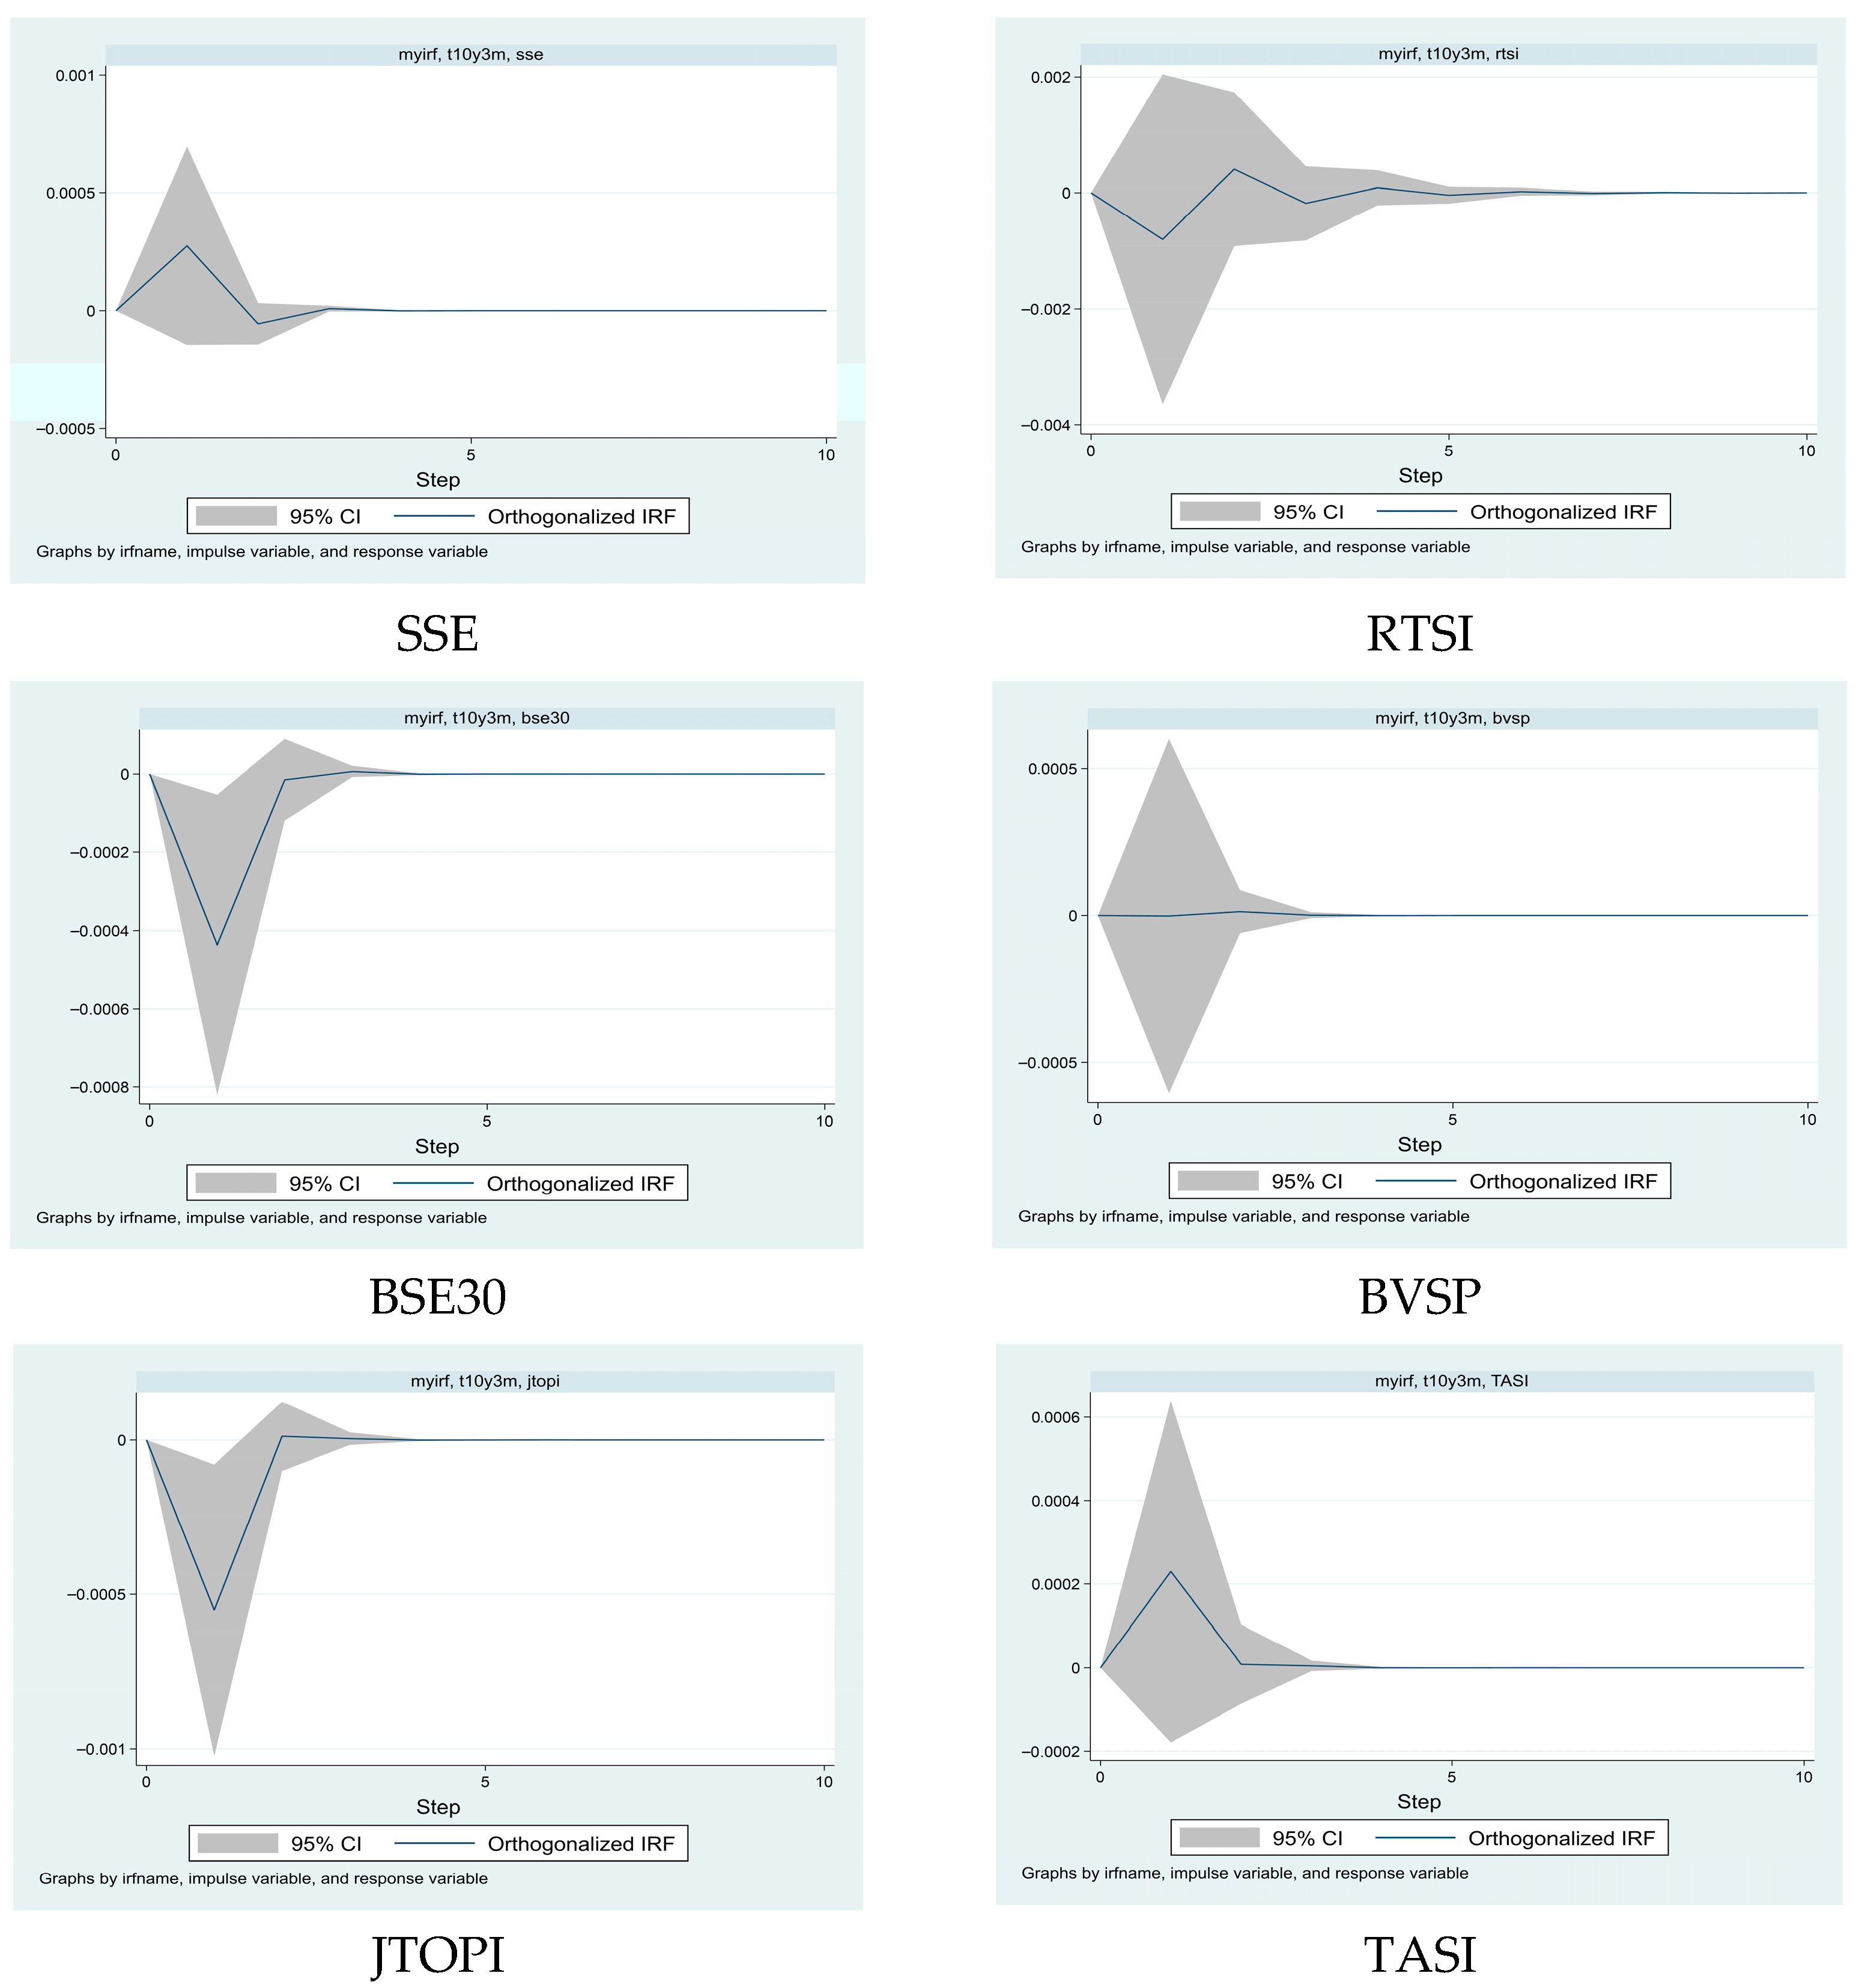
The IRFs (Figure 4) provide further insights into how BRICS+ markets absorb T10Y3M shocks. For SSE and TASI, the responses are positive on impact, peaking within the first day before quickly reverting to zero. This short-lived reaction suggests temporary portfolio rebalancing toward emerging markets, possibly driven by yield differentials or delayed equity repricing in response to shifts in the U.S. term structure. By contrast, BSE30, RTSI, and JTOPI register immediate and sharp negative reactions. Similar to the quantile-based network analysis of Rehman et al. (2025), these findings suggest that tighter U.S. financial conditions tend to trigger equity outflows and raise risk premia in emerging markets. However, the declines dissipate within a few days across all markets, indicating rapid adjustment without long-term dislocation.
For ADX, EGX30, and BVSP, the responses are statistically insignificant, indicating that U.S. term-spread shocks do not exert persistent influence across all emerging markets equally. This heterogeneous impact reflects differences in market openness, depth of financial integration, macroeconomic stability, and the role of domestic institutional investors, supporting the view that sensitivity to U.S. yield-curve movements varies significantly across BRICS+ economies.
Taken together, these results suggest that U.S. term-spread shocks generate short-term volatility across BRICS+ equities, but the effects are neither uniform nor persistent. Highly integrated economies such as India, South Africa, and Russia are most vulnerable, while Gulf and North African markets exhibit greater resilience. For investors, this implies that yield-curve movements create tactical but temporary risks for equity portfolios. For policymakers, the findings highlight the importance of monitoring spillovers from U.S. bond markets, as domestic monetary conditions can be influenced by external equity dynamics. Overall, the evidence reinforces H2 by showing that U.S. yield-curve dynamics represent a key channel of macro-financial transmission to BRICS+ markets, although the resulting spillovers are predominantly short lived. The detailed VAR regression results underlying these responses are presented in Supplementary Table S4.
5. Conclusions, Limitations, and Future Research Directions

This study examined the transmission of global risk factors, captured by VIX, GPRD, T5YIE, and T10Y3M, to BRICS+ equity markets and T5YIE. Using Granger-causality tests and impulse response functions, the analysis revealed a tightly interconnected global financial system in which shocks propagate rapidly across regions and asset classes, although with heterogeneous intensity and persistence. The results highlight that while spillovers from global volatility (VIX) and U.S. macro-financial indicators (T5YIE and T10Y3M) are strong and immediate, those originating from GPRD are weaker and short lived.
The results highlight several key insights. First, VIX functions as both a transmitter and a receiver of volatility shocks, confirming its central role within the global risk network. Second, GPRD, although theoretically relevant, plays only a peripheral role during the sample period, generating short-lived and statistically weak effects on equities and U.S. yields. Third, shocks to U.S. macro-financial variables show that T5YIE and yield-curve dynamics exert significant influence on BRICS+ markets, although the effects are generally transitory. The most pronounced responses are observed in highly integrated economies such as India, South Africa, and Brazil, whereas Gulf and North African markets display greater resilience. These findings indicate that financial fundamentals and U.S. monetary policy expectations outweigh geopolitical shocks as primary drivers of cross-market contagion during the sample period.
From a policy perspective, the results call for targeted rather than generic monitoring responses from regulators and central banks in BRICS+ economies. Specifically, policy action should be linked to measurable external shock signals: (i) sharp increases in VIX should trigger short-horizon liquidity backstops and temporary macroprudential tightening, (ii) persistent T10Y3M inversions should activate yield-curve stress diagnostics in domestic bond markets, and (iii) unexpected rises in T5YIE should prompt supervisory scrutiny of duration risk and FX-mismatch exposure in the banking sector. Strengthening market resilience requires operational measures such as developing local currency bond markets, expanding central clearing to reduce margin stress, and enhancing swap line arrangements to stabilize cross-border funding.
For investors, the empirical evidence implies that passive diversification across regions is insufficient during global stress episodes. Instead, active risk management must account for the documented (1–3) day spillover window identified in the IRFs. This means dynamically reducing portfolio beta during VIX-driven shocks and reallocating toward resilient BRICS+ markets (TASI, ADX, EGX30) when contagion originates from macro-financial channels (T5YIE, T10Y3M). Even geographically distant markets can be strongly influenced by shocks originating in the U.S. or from major BRICS+ hubs such as India and South Africa, but the rapid dissipation of spillovers also creates tactical trading opportunities for short-horizon strategies.
Despite its contributions, this study is subject to several limitations. First, the analysis focuses exclusively on BRICS+ economies, which, although highly relevant, do not fully capture the complexity of global spillover dynamics. Second, the sample period does not encompass extreme geopolitical or financial episodes, such as global wars or systemic crises, during which the role of GPRD might become more pronounced and potentially shift from a peripheral to a dominant risk factor. Third, the empirical framework, which relies on VAR-based Granger-causality tests and linear IRFs, may not fully account for nonlinearities, structural breaks, or regime-dependent dynamics that often characterize financial contagion, particularly during high-volatility phases or liquidity freezes.
Future research could address these limitations in several directions. Expanding the sample to include advanced economies or other emerging regions would yield a more comprehensive picture of global interconnectedness and help determine whether the bidirectional spillovers identified here persist beyond the BRICS+ network. Using high-frequency data or alternative indicators of geopolitical risk and uncertainty may uncover more nuanced patterns of short-term contagion. From a methodological perspective, adopting nonlinear frameworks such as quantile VAR, Markov-switching models, or network-based approaches would allow researchers to capture asymmetric effects and regime shifts more effectively and to distinguish between shock amplification and shock absorption phases. Finally, extending the analysis to sectoral or firm-level data within BRICS+ could help identify which segments of the economy are most vulnerable to global shocks.
In conclusion, the global financial system is characterized by strong interdependencies across equity and bond markets, yet the effects of shocks are largely transitory and display substantial heterogeneity across countries. These findings highlight both the challenges and opportunities faced by policymakers and investors in a world where financial risks are increasingly global and rapidly transmitted. Strengthening resilience while leveraging short-lived market adjustments thus remains a central task for ensuring stability and sustaining growth in an interconnected financial landscape, as well as clarifying whether transmission originates primarily from financial, energy, or technology sectors.

Supplementary Materials

The following supporting information can be downloaded at https://www.mdpi.com/article/10.3390/risks13110217/s1. Table S1: VAR Granger test results; Table S2: Granger test results; Table S3: Granger VAR test results; Table S4: Granger causality which provide additional econometric results complementing the main analysis.

Author Contributions

Conceptualization, A.J., A.K. and C.K.; methodology, A.J., A.K. and C.K.; software, A.J. and C.K.; validation, C.G.; formal analysis, A.K. and C.K.; investigation, A.K. and C.K.; resources, C.G.; data curation, A.J. and C.K.; writing—original draft preparation, A.J. and C.G.; writing—review and editing, A.J. and C.K.; visualization, C.K.; supervision, C.G. All authors have read and agreed to the published version of the manuscript.

Funding

This research received no external funding.

Data Availability Statement

The original contributions presented in this study are included in the article/Supplementary Material. Further inquiries can be directed to the corresponding authors.

Conflicts of Interest

The authors declare no conflicts of interest.

Abbreviations

The following abbreviations are used in this manuscript:
AIArtificial intelligence
BSE30Bombay Stock Exchange Index (India)
BVSPBovespa Index (Brazil)
EPUEconomic Policy Uncertainty
EGX30Egyptian Exchange 30 Index
FREDFederal Reserve Economic Data
FXForeign Exchange
GPRDGeopolitical Risk Daily Index
IMF-IFSInternational Monetary Fund, International Financial Statistics
IRFImpulse Response Function
JTOPIJohannesburg Top 40 Index (South Africa)
RTSIRussian Trading System Index
SSEShanghai Stock Exchange Composite Index (China)
TASITadawul All Share Index (Saudi Arabia)
T5YIE5-Year Treasury Inflation Expectation Rate
T10Y3MTerm Spread between 10-Year and 3-Month U.S. Treasuries
VIXCBOE Volatility Index

Appendix A

Table A1. VAR Granger test results.
EqExcl χ 2 df p χ 2 EqExcl χ 2 df p χ 2 EqExcl χ 2 df p χ 2 EqExcl χ 2 df p χ 2
VIXSSE0.64610.422RTSIT10Y3M0.78610.375JTOPIEGX300.38910.533EGX30JTOPI6.76210.009
VIXRTSI0.50210.479RTSIALL28.63100.001JTOPIT5YIE3.41710.065EGX30TASI0.46710.494
VIXBSE303.97810.046BSE30VIX48.4910.000JTOPIT10Y3M11.7910.001EGX30ADX2.86510.091
VIXBVSP4.16210.041BSE30SSE4.23810.040JTOPIALL184.9100.000EGX30T5YIE4.90410.027
VIXJTOPI0.17610.675BSE30RTSI0.24710.619TASIVIX29.2810.000EGX30T10Y3M1.87110.171
VIXTASI10.3310.001BSE30BVSP21.1610.000TASISSE3.16110.075EGX30ALL43.67100.000
VIXADX2.36110.124BSE30JTOPI3.49610.062TASIRTSI0.65710.418T5YIEVIX1.76510.184
VIXEGX300.85410.355BSE30TASI1.28510.257TASIBSE3013.0010.000T5YIESSE0.01110.918
VIXT5YIE0.00810.929BSE30ADX25.4810.000TASIBVSP0.69210.406T5YIERTSI0.20610.650
VIXT10Y3M0.15610.693BSE30EGX301.27510.259TASIJTOPI6.33310.012T5YIEBSE3012.2210.000
VIXALL21.88100.016BSE30T5YIE5.15410.023TASIADX13.0010.000T5YIEBVSP1.49410.222
SSEVIX43.6210.000BSE30T10Y3M6.77410.009TASIEGX300.09910.753T5YIEJTOPI9.21910.002
SSERTSI0.01610.898BSE30ALL206.4100.000TASIT5YIE3.48510.062T5YIETASI5.58010.018
SSEBSE3011.2310.001BVSPVIX0.06510.798TASIT10Y3M0.24410.621T5YIEADX7.03510.008
SSEBVSP2.82610.093BVSPSSE0.37210.542TASIALL81.13100.000T5YIEEGX305.99510.014
SSEJTOPI15.3810.000BVSPRTSI0.00010.986ADXVIX8.27710.004T5YIET10Y3M2.46310.117
SSETASI4.93910.026BVSPBSE305.85210.016ADXSSE4.69810.030T5YIEALL63.68100.000
SSEADX0.47010.493BVSPJTOPI0.62310.430ADXRTSI1.02810.311T10Y3MVIX3.04710.081
SSEEGX300.64310.423BVSPTASI6.24710.012ADXBSE3015.5310.000T10Y3MSSE0.11610.733
SSET5YIE1.76210.184BVSPADX1.94110.164ADXBVSP4.98710.026T10Y3MRTSI0.47010.493
SSET10Y3M0.53610.464BVSPEGX301.49110.222ADXJTOPI2.57810.108T10Y3MBSE3016.2610.000
SSEALL113.2100.000BVSPT5YIE4.89910.027ADXTASI21.9910.000T10Y3MBVSP0.11810.731
RTSIVIX1.89610.169BVSPT10Y3M0.12510.724ADXEGX300.00510.942T10Y3MJTOPI4.38310.036
RTSISSE0.21310.645BVSPALL23.51100.009ADXT5YIE6.90810.009T10Y3MTASI4.74210.029
RTSIBSE301.46510.226JTOPIVIX83.4310.000ADXT10Y3M0.77210.380T10Y3MADX9.91610.002
RTSIBVSP5.52310.019JTOPISSE3.48110.062ADXALL81.05100.000T10Y3MEGX302.11810.146
RTSIJTOPI0.44910.503JTOPIRTSI0.30410.582EGX30VIX10.2510.001T10Y3MT5YIE0.41410.520
RTSITASI1.32210.250JTOPIBSE3032.1710.000EGX30SSE0.49410.482T10Y3MALL42.49100.000
RTSIADX1.85110.174JTOPIBVSP4.89210.027EGX30RTSI0.00510.944
RTSIEGX300.05410.816JTOPITASI0.18810.665EGX30BSE300.22210.637
RTSIT5YIE1.66110.197JTOPIADX24.6110.000EGX30BVSP0.73110.393
Note: “Eq” denotes the dependent equation, “Excl” the excluded variable, χ2 the test statistic, “df” the degrees of freedom, and p(χ2) the p-value.
Table A2. Granger test results.
EqExcl χ 2 df p χ 2 EqExcl χ 2 df p χ 2 EqExcl χ 2 df p χ 2 EqExcl χ 2 df p χ 2
SSERTSI0.00210.963BSE30T10Y3M10.7310.001TASIT5YIE2.30510.129T5YIETASI0.03810.845
SSEBSE308.57810.003BSE30ALL199.7100.000TASIGPRD0.45610.499T5YIEADX55.9410.000
SSEBVSP12.7510.000BVSPSSE0.00011.000TASIT10Y3M0.77710.378T5YIEEGX3020.2810.000
SSEJTOPI29.2510.000BVSPRTSI0.00010.992TASIALL65.82100.000T5YIEGPRD0.95410.329
SSETASI0.45410.501BVSPBSE301.73410.188ADXSSE4.53510.033T5YIET10Y3M0.18810.664
SSEADX0.46110.497BVSPJTOPI0.07510.784ADXRTSI0.86410.353T5YIEALL147.9100.000
SSEEGX301.67310.196BVSPTASI0.02510.875ADXBSE306.84710.009GPRDSSE0.01210.912
SSET5YIE0.23210.630BVSPADX2.79110.095ADXBVSP22.2410.000GPRDRTSI0.09610.757
SSEGPRD0.37510.540BVSPEGX303.19110.074ADXJTOPI1.16810.280GPRDBSE300.56610.452
SSET10Y3M1.39910.237BVSPT5YIE36.8210.000ADXTASI2.44010.118GPRDBVSP0.15410.695
SSEALL71.88100.000BVSPGPRD0.14910.699ADXEGX301.00010.317GPRDJTOPI1.14010.286
RTSISSE0.43110.512BVSPT10Y3M0.80810.369ADXT5YIE22.0110.000GPRDTASI1.34410.246
RTSIBSE301.01910.313BVSPALL42.80100.000ADXGPRD0.86410.353GPRDADX0.21910.640
RTSIBVSP5.69210.017JTOPISSE4.62610.031ADXT10Y3M0.19410.659GPRDEGX302.72510.099
RTSIJTOPI0.07910.779JTOPIRTSI0.30910.578ADXALL73.83100.000GPRDT5YIE1.45510.228
RTSITASI0.49710.481JTOPIBSE3021.9410.000EGX30SSE0.76210.383GPRDT10Y3M0.35310.552
RTSIADX0.31110.577JTOPIBVSP39.4710.000EGX30RTSI0.01510.903GPRDALL8.817100.550
RTSIEGX300.01210.914JTOPITASI9.18810.002EGX30BSE300.19910.655T10Y3MSSE1.47410.225
RTSIT5YIE5.49610.019JTOPIADX7.42010.006EGX30BVSP0.46810.494T10Y3MRTSI0.48610.486
RTSIGPRD0.03910.842JTOPIEGX300.14110.707EGX30JTOPI4.94910.026T10Y3MBSE309.90010.002
RTSIT10Y3M0.79310.373JTOPIT5YIE25.1310.000EGX30TASI0.06910.792T10Y3MBVSP0.98910.320
RTSIALL21.39100.019JTOPIGPRD1.59610.206EGX30ADX2.23310.135T10Y3MJTOPI3.29310.070
BSE30SSE2.33910.126JTOPIT10Y3M8.97910.003EGX30T5YIE4.83610.028T10Y3MTASI3.37810.066
BSE30RTSI0.24410.622JTOPIALL129.9100.000EGX30GPRD0.80510.370T10Y3MADX6.66410.010
BSE30BVSP46.1310.000TASISSE2.09910.147EGX30T10Y3M0.08110.775T10Y3MEGX302.65210.103
BSE30JTOPI10.8710.001TASIRTSI0.92210.337EGX30ALL25.94100.004T10Y3MT5YIE22.1410.000
BSE30TASI2.43010.119TASIBSE3012.3510.000T5YIESSE1.93910.164T10Y3MGPRD0.16310.686
BSE30ADX5.06910.024TASIBVSP13.9710.000T5YIERTSI0.88110.348T10Y3MALL62.32100.000
BSE30EGX300.57110.450TASIJTOPI13.3410.000T5YIEBSE3035.9110.000
BSE30T5YIE51.8110.000TASIADX23.2610.000T5YIEBVSP22.0410.000
BSE30GPRD1.75310.185TASIEGX300.00910.923T5YIEJTOPI2.44810.118
Note: ”Eq” denotes the dependent equation, “Excl” the excluded variable, χ2 the test statistic, “df” the degrees of freedom, and p(χ2) the p-value.
Table A3. Granger VAR test results.
EqExcl χ 2 df p χ 2 EqExcl χ 2 df p χ 2 EqExcl χ 2 df p χ 2
SSERTSI0.00310.958BVSPTASI0.04110.840ADXALL72.7580.000
SSEBSE308.39710.004BVSPADX2.62210.105EGX30SSE0.81710.366
SSEBVSP12.7710.000BVSPEGX303.11410.078EGX30RTSI0.01510.901
SSEJTOPI28.9910.000BVSPT5YIE35.9210.000EGX30BSE300.19510.659
SSETASI0.53410.465BVSPALL41.8180.000EGX30BVSP0.44510.505
SSEADX0.56510.452JTOPISSE5.27710.022EGX30JTOPI5.00810.025
SSEEGX301.59710.206JTOPIRTSI0.29410.588EGX30TASI0.06910.793
SSET5YIE0.45610.500JTOPIBSE3022.6710.000EGX30ADX2.32610.127
SSEALL70.0180.000JTOPIBVSP39.2610.000EGX30T5YIE4.69010.030
RTSISSE0.48710.485JTOPITASI10.0810.002EGX30ALL25.0380.002
RTSIBSE301.07910.299JTOPIADX8.40110.004T5YIESSE1.93610.164
RTSIBVSP5.71010.017JTOPIEGX300.2010.655T5YIERTSI0.88010.348
RTSIJTOPI0.08710.768JTOPIT5YIE21.0210.000T5YIEBSE3036.3510.000
RTSITASI0.43510.509JTOPIALL118.480.000T5YIEBVSP22.2710.000
RTSIADX0.37110.543TASISSE2.03810.153T5YIEJTOPI2.43410.119
RTSIEGX300.01710.897TASIRTSI0.92510.336T5YIETASI0.05610.813
RTSIT5YIE4.98610.026TASIBSE3012.0510.001T5YIEADX56.2010.000
RTSIALL20.5480.008TASIBVSP13.8010.000T5YIEEGX3020.2910.000
BSE30SSE2.85210.091TASIJTOPI13.3010.000T5YIEALL146.780.000
BSE30RTSI0.25610.613TASIADX23.6710.000
BSE30BVSP45.8510.000TASIEGX300.01210.912
BSE30JTOPI11.2010.001TASIT5YIE2.74310.098
BSE30TASI2.94910.086TASIALL64.5780.000
BSE30ADX5.95910.015ADXSSE4.53710.033
BSE30EGX300.45510.500ADXRTSI0.86210.353
BSE30T5YIE45.4710.000ADXBSE307.02610.008
BSE30ALL185.880.000ADXBVSP22.4610.000
BVSPSSE0.00210.964ADXJTOPI1.16010.282
BVSPRTSI0.00010.995ADXTASI2.32310.127
BVSPBSE301.80510.179ADXEGX300.99610.318
BVSPJTOPI0.06710.796ADXT5YIE22.0210.000
Note: ”Eq” denotes the dependent equation, “Excl” the excluded variable, χ2 the test statistic, “df” the degrees of freedom, and p(χ2) the p-value.
Table A4. Granger causality.
EqExcl χ 2 df p χ 2 EqExcl χ 2 df p χ 2 EqExcl χ 2 df p χ 2
SSERTSI0.00210.961BVSPTASI0.00710.934ADXALL50.2480.000
SSEBSE308.65410.003BVSPADX0.06810.794EGX30SSE0.74310.389
SSEBVSP13.7810.000BVSPEGX302.71710.099EGX30RTSI0.01410.905
SSEJTOPI30.0910.000BVSPT10Y3M0.00010.995EGX30BSE300.19010.663
SSETASI0.44610.504BVSPALL5.78480.671EGX30BVSP1.06010.303
SSEADX0.34810.555JTOPISSE4.40710.036EGX30JTOPI6.14310.013
SSEEGX301.68810.194JTOPIRTSI0.31110.577EGX30TASI0.09210.762
SSET10Y3M1.64810.199JTOPIBSE3021.5810.000EGX30ADX4.28110.039
SSEALL71.2480.000JTOPIBVSP50.5310.000EGX30T10Y3M0.00010.984
RTSISSE0.39710.529JTOPITASI8.60810.003EGX30ALL20.2980.009
RTSIBSE301.02310.312JTOPIADX15.8910.000T10Y3MSSE1.62410.203
RTSIBVSP7.79910.005JTOPIEGX300.23110.631T10Y3MRTSI0.46810.494
RTSIJTOPI0.28610.593JTOPIT10Y3M5.25610.022T10Y3MBSE309.65410.002
RTSITASI0.53810.463JTOPIALL101.980.000T10Y3MBVSP0.05210.820
RTSIADX1.28710.257TASISSE2.08110.149T10Y3MJTOPI1.73010.188
RTSIEGX300.02410.876TASIRTSI0.92310.337T10Y3MTASI3.18010.075
RTSIT10Y3M0.30510.581TASIBSE3012.2810.000T10Y3MADX14.0810.000
RTSIALL15.8280.045TASIBVSP16.1410.000T10Y3MEGX302.92310.087
BSE30SSE2.09110.148TASIJTOPI14.7510.000T10Y3MALL39.5180.000
BSE30RTSI0.22810.633TASIADX21.0210.000
BSE30BVSP62.7310.000TASIEGX300.00410.951
BSE30JTOPI16.3810.000TASIT10Y3M1.21510.270
BSE30TASI2.06410.151TASIALL62.9980.000
BSE30ADX15.9710.000ADXSSE4.16310.041
BSE30EGX300.35610.551ADXRTSI0.83610.361
BSE30T10Y3M4.98310.026ADXBSE306.93410.008
BSE30ALL142.580.000ADXBVSP30.6410.000
BVSPSSE0.00510.946ADXJTOPI2.47710.116
BVSPRTSI0.00010.984ADXTASI2.52310.112
BVSPBSE301.73210.188ADXEGX300.82510.364
BVSPJTOPI0.14110.707ADXT10Y3M0.07910.779
Note: “Eq” denotes the dependent equation, “Excl” the excluded variable, χ2 the test statistic, “df” the degrees of freedom, and p(χ2) the p-value.

References

  1. Adeosun, Opeoluwa A., Mosab I. Tabash, and Xuan Vinh Vo. 2023. Oil prices, news-based uncertainty measures and exchange rate returns in BRICS countries. International Journal of Energy Sector Management 17: 1092–118. [Google Scholar] [CrossRef]
  2. Altinkeski, Buket Kirci, Sel Dibooglu, Emrah Ismail Cevik, Yunus Kilic, and Mehmet Fatih Bugan. 2024. Quantile connectedness between VIX and global stock markets. Borsa Istanbul Review 24 Suppl. 1: 71–79. [Google Scholar] [CrossRef]
  3. Antonakakis, Nikolaos, Ioannis Chatziantoniou, and George Filis. 2014. Dynamic spillovers of oil price shocks and economic policy uncertainty. Energy Economics 44: 433–47. [Google Scholar] [CrossRef]
  4. Balli, Faruk, Mudassar Hasan, Hatice Ozer-Balli, and Russell Gregory-Allen. 2021. Why do U.S. uncertainties drive stock market spillovers? International evidence. International Review of Economics & Finance 76: 288–301. [Google Scholar] [CrossRef]
  5. Bayaa, Yasmeen, and Mahmoud Qadan. 2024. The shape of the Treasury yield curve and commodity prices. International Review of Financial Analysis 94: 103311. [Google Scholar] [CrossRef]
  6. Becketti, Sean. 2020. Introduction to Time Series Using Stata. College Station: Stata Press. [Google Scholar]
  7. Bloomberg L.P. 2025. Bloomberg Terminal. Available online: https://www.bloomberg.com/professional/ (accessed on 10 August 2025).
  8. Bouri, Elie, Syed Jawad Hussain Shahzad, Naveed Raza, and David Roubaud. 2018. Oil volatility and sovereign risk of BRICS. Energy Economics 70: 258–69. [Google Scholar] [CrossRef]
  9. Caldara, Dario, and Matteo Iacoviello. 2022a. Geopolitical Risk Index (GPR and GPRD). Board of Governors of the Federal Reserve System. Available online: https://www.matteoiacoviello.com/gpr.htm (accessed on 10 August 2025).
  10. Caldara, Dario, and Matteo Iacoviello. 2022b. Measuring geopolitical risk. American Economic Review 112: 1194–225. [Google Scholar] [CrossRef]
  11. Castello, Oleksandr, and Marina Resta. 2022. Modeling the yield curve of BRICS countries: Parametric vs. machine learning techniques. Risks 10: 36. [Google Scholar] [CrossRef]
  12. Chen, Xiuwen. 2023. Are the shocks of EPU, VIX, and GPR indexes on the oil–stock nexus alike? A time-frequency analysis. Applied Economics 55: 5637–52. [Google Scholar] [CrossRef]
  13. Chiang, Thomas C., and Pei-Ying Chen. 2023. Inflation risk and stock returns: Evidence from US aggregate and sectoral markets. North American Journal of Economics and Finance 68: 101986. [Google Scholar] [CrossRef]
  14. Christensen, Jens H. E., Jose A. Lopez, and Glenn D. Rudebusch. 2010. Inflation expectations and risk premiums in an arbitrage-free model of nominal and real bond yields. Journal of Money, Credit and Banking 42: 143–78. [Google Scholar] [CrossRef]
  15. Çepni, Oguzhan, Furkan Emirmahmutoglu, Ibrahim Ethem Guney, and Muhammed Hasan Yilmaz. 2023. Do the carry trades respond to geopolitical risks? Evidence from BRICS countries. Economic Systems 47: 101000. [Google Scholar] [CrossRef]
  16. Das, Sanjiv R., Madhu Kalimipalli, and Subhankar Nayak. 2022. Banking networks, systemic risk, and the credit cycle in emerging markets. Journal of International Financial Markets, Institutions and Money 80: 101633. [Google Scholar] [CrossRef]
  17. Diebold, Francis X., and Kamil Yilmaz. 2014. On the network topology of variance decompositions: Measuring the connectedness of financial firms. Journal of Econometrics 182: 119–34. [Google Scholar] [CrossRef]
  18. Ekanayake, E. M., and Amila Dissanayake. 2022. Effects of real exchange rate volatility on trade: Empirical analysis of the United States exports to BRICS. Journal of Risk and Financial Management 15: 73. [Google Scholar] [CrossRef]
  19. Engle, Robert F., and Clive. W. J. Granger. 1987. Co-integration and error correction: Representation, estimation, and testing. Econometrica 55: 251–76. [Google Scholar] [CrossRef]
  20. Estrella, Arturo, and Gikas A. Hardouvelis. 1991. The term structure as a predictor of real economic activity. The Journal of Finance 46: 555–76. [Google Scholar] [CrossRef]
  21. Federal Reserve Bank of St. Louis. 2024. Federal Reserve Economic Data (FRED). Available online: https://fred.stlouisfed.org/ (accessed on 10 August 2025).
  22. Forbes, Kristin J., and Roberto Rigobon. 2002. No contagion, only interdependence: Measuring stock market comovements. The Journal of Finance 57: 2223–61. [Google Scholar] [CrossRef]
  23. Gao, Wang, Haizhen Zhang, Hongwei Zhang, and Shixiong Yang. 2024. The role of G7 and BRICS country risks on critical metals: Evidence from time- and frequency-domain approach. Resources Policy 88: 104257. [Google Scholar] [CrossRef]
  24. Gnagne, Pascal Xavier, Beatrice D. Simo-Kengne, and Mathias Mandla Manguzvane. 2024. The interconnectedness and spillover effects among economic uncertainty, energy-related risks and sovereign risk in BRICS economies. Investment Analysts Journal 53: 262–85. [Google Scholar] [CrossRef]
  25. Gopal, Suresh, Viswanathan Thangaraj, Naveen Kumara R., and Rupa R. 2025. Geopolitical shockwaves: The Russia-Ukraine war’s impact on BRICS financial markets. Cogent Economics & Finance 13: 2476096. [Google Scholar] [CrossRef]
  26. Gouta, Sarra, and Houda BenMabrouk. 2024. The nexus between herding behavior and spillover: Evidence from G7 and BRICS. Review of Behavioral Finance 16: 360–77. [Google Scholar] [CrossRef]
  27. Gökgöz, Halilibrahim, Salha Ben Salem, Azza Bejaoui, and Ahmed Jeribi. 2024. Connectedness structure and volatility dynamics between BRICS markets and international volatility indices: An investigation. International Journal of Finance & Economics 30: 2981–3002. [Google Scholar] [CrossRef]
  28. Gürkaynak, Refet S., Brian Sack, and Jonathan H. Wright. 2010. The TIPS yield curve and inflation compensation. American Economic Journal: Macroeconomics 2: 70–92. Available online: https://www.jstor.org/stable/25760285 (accessed on 10 August 2025). [CrossRef]
  29. Ijaz, Muhammad. Shazad., Robert Faff, Mahrukh Khurram, and Irfan Munir. 2025. Mapping complex interdependencies through higher order moments: Cross-market spillovers and shocks in BRICS. Finance Research Letters 79: 107091. [Google Scholar] [CrossRef]
  30. Jiang, Yong, Seema Narayan, Yi-Shuai Ren, and Chao-Qun Ma. 2023. The international oil price in the context of the COVID-19 pandemic outbreak: Evidence from BRICS and US. Emerging Markets Finance and Trade 60: 983–1001. [Google Scholar] [CrossRef]
  31. Johansen, Søren. 1995. Likelihood-Based Inference in Cointegrated Vector Autoregressive Models. Oxford: Oxford University Press. [Google Scholar]
  32. Kamal, Elham, Naji Jalkh, and Elie Bouri. 2025. Inflation expectations and the stock-bond nexus in the US: Hedging implications. The European Journal of Finance 31: 671–95. [Google Scholar] [CrossRef]
  33. Kaminsky, Graciela, and Carmen M. Reinhart. 2000. On crises, contagion, and confusion. Journal of International Economics 51: 145–68. [Google Scholar] [CrossRef]
  34. Kang, Sang Hoon, Debasish Maitra, Saumya Ranjan Dash, and Robert Brooks. 2019. Dynamic spillovers and connectedness between stock, commodities, bonds, and VIX markets. Pacific-Basin Finance Journal 58: 101221. [Google Scholar] [CrossRef]
  35. Kayani, Umar, Amir Hasnaoui, Maaz Khan, Nadia Zahoor, and Farrukh Nawaz. 2024. Analyzing fossil fuel commodities’ return spillovers during the Russia and Ukraine crisis in the energy market. Energy Economics 135: 107651. [Google Scholar] [CrossRef]
  36. Kumar, Virender, and Pami Dua. 2024. What explains foreign portfolio investment inflows to BRICS countries? Economic Analysis and Policy 82: 32–46. [Google Scholar] [CrossRef]
  37. Lau, Chi Keung, Alaa M. Soliman, and Dongna Zhang. 2024. Energy price inflation, geopolitical risk, and Bitcoin dependence structure: Evidence from BRICS. Emerging Markets Finance and Trade 60: 2631–45. [Google Scholar] [CrossRef]
  38. Li, Rong, Guangyuan Tang, Chen Hong, Sufang Li, Bingting Li, and Shujian Xiang. 2024. A study on economic policy uncertainty, geopolitical risk and stock market spillovers in BRICS countries. The North American Journal of Economics and Finance 73: 102189. [Google Scholar] [CrossRef]
  39. Li, Yingli, Jianbai Huang, Wang Gao, and Hongwei Zhang. 2021. Analyzing the time-frequency connectedness among oil, gold prices and BRICS geopolitical risks. Resources Policy 73: 102134. [Google Scholar] [CrossRef]
  40. Luong, Anh Tram. 2025. How does the asymmetric spillover of investor sentiment respond to economic policy uncertainty in G7 and BRICS countries? Review of Behavioral Finance 17: 317–41. [Google Scholar] [CrossRef]
  41. Lütkepohl, Helmut. 2005. New Introduction to Multiple Time Series Analysis. Berlin: Springer. [Google Scholar]
  42. Manamperi, Nimantha. 2014. The short and long-run dynamics between inflation and economic growth in BRICS. Applied Economics Letters 21: 140–45. [Google Scholar] [CrossRef]
  43. Mensi, Walid, Eray Gemici, Müslüm Polat, and Sang Hoon Kang. 2025. Markov switching volatility connectedness across international CDS markets. International Review of Economics and Finance 98: 103839. [Google Scholar] [CrossRef]
  44. Ouyang, Ruolan, Tiancheng Pei, Yi Fang, and Yang Zhao. 2024. Commodity systemic risk and macroeconomic predictions. Energy Economics 138: 107807. [Google Scholar] [CrossRef]
  45. Ouyang, Zisheng, Zhen Chen, Xuewei Zhou, and Zhongzhe Ouyang. 2025. Imported risk in global financial markets: Evidence from cross-market connectedness. North American Journal of Economics and Finance 76: 102374. [Google Scholar] [CrossRef]
  46. Panda, Babita, Ajaya Kumar Panda, and Pradiptarathi Panda. 2023. Macroeconomic response to BRICS countries stock markets using panel VAR. Asia-Pacific Financial Markets 30: 259–72. [Google Scholar] [CrossRef]
  47. Papathanasiou, Spyros, and Drosos Koutsokostas. 2024. A trade-off between sustainability ratings and volatility in portfolio hedging strategies. International Journal of Banking, Accounting and Finance 14: 370–406. [Google Scholar] [CrossRef]
  48. Papathanasiou, Spyros, Dimitris Kenourgios, Drosos Koutsokostas, and Georgios Pergeris. 2023. Can treasury inflation-protected securities safeguard investors from outward risk spillovers? A portfolio hedging strategy through the prism of COVID-19. Journal of Asset Management 24: 198–211. [Google Scholar] [CrossRef]
  49. Pástor, Ľuboš, and Pietro Veronesi. 2013. Political uncertainty and risk premia. Journal of Financial Economics 110: 520–45. [Google Scholar] [CrossRef]
  50. Refinitiv. 2025. Datastream. Available online: https://www.refinitiv.com (accessed on 10 August 2025).
  51. Rehman, Mobeen Ur, Rami Zeitun, Neeraj Nautiyal, Xuan Vinh Vo, and Sang Hoon Kang. 2025. How do US sectoral markets connect in calm and crisis? A quantile-based network analysis. Applied Economics, 1–24. [Google Scholar] [CrossRef]
  52. Ren, Bo, Huajiao Li, Jianglan Shi, Yanxin Liu, and Yajie Qi. 2022. Identifying the key sectors and paths of the embodied energy in BRICS nations: A weighted multilayer network approach. Energy 239, Pt B: 122091. [Google Scholar] [CrossRef]
  53. Salisu, Afees A., Juncal Cuñado, and Rangan Gupta. 2022. Geopolitical risks and historical exchange rate volatility of the BRICS. International Review of Economics & Finance 77: 179–90. [Google Scholar] [CrossRef]
  54. Sarno, Lucio, Ilias Tsiakas, and Barbara Ulloa. 2016. What drives international portfolio flows? Journal of International Money and Finance 60: 53–72. [Google Scholar] [CrossRef]
  55. Shao, Ying-Hui, Yan-Hong Yang, and Wei-Xing Zhou. 2025. Risk spillovers between the BRICS and the U.S. staple grain futures markets. Finance Research Letters 75: 106835. [Google Scholar] [CrossRef]
  56. Sharma, Gagan, Parthajit Kayal, and Piyush Pandey. 2019. Information linkages among BRICS countries: Empirical evidence from implied volatility indices. Journal of Emerging Market Finance 18: 251–70. [Google Scholar] [CrossRef]
  57. Sims, Christopher A. 1980. Macroeconomics and reality. Econometrica 48: 1–48. [Google Scholar] [CrossRef]
  58. Soepriyanto, Gatot, Shinta Amalina Hazrati Havidz, and Rangga Handika. 2025. Crypto goes East: Analyzing Bitcoin, technological and regulatory contagions in Asia–Pacific financial markets using asset pricing. International Journal of Emerging Markets 20: 2794–815. [Google Scholar] [CrossRef]
  59. Su, Zhi, Tong Fang, and Libo Yin. 2019. Understanding stock market volatility: What is the role of U.S. uncertainty? The North American Journal of Economics and Finance 48: 582–90. [Google Scholar] [CrossRef]
  60. Umar, Zaghum, Mariya Gubareva, Tamara Teplova, and Wafa Alwahedi. 2022. Oil price shocks and the term structure of the US yield curve: A time–frequency analysis of spillovers and risk transmission. Annals of Operations Research 352: 363–87. [Google Scholar] [CrossRef]
  61. Wang, Ningli, and Wanhai You. 2023. New insights into the role of global factors in BRICS stock markets: A quantile cointegration approach. Economic Systems 47: 101015. [Google Scholar] [CrossRef]
  62. Wen, Fenghua, Aojie Shui, Yuxiang Cheng, and Xu Gong. 2022. Monetary policy uncertainty and stock returns in G7 and BRICS countries: A quantile-on-quantile approach. International Review of Economics & Finance 78: 457–82. [Google Scholar] [CrossRef]
  63. Whaley, Robert E. 2000. The investor fear gauge. The Journal of Portfolio Management 26: 12–17. [Google Scholar] [CrossRef]
  64. Yuan, Ying, Haiying Wang, and Tianyang Wang. 2023. Investigating the dynamics of crisis transmission channels: A comparative analysis. Journal of International Money and Finance 135: 102857. [Google Scholar] [CrossRef]
  65. Zhang, Yi, Long Zhou, Zhidong Liu, and Baoxiu Wu. 2025. Spillover of fear among the US and BRICS equity markets during the COVID-19 crisis and the Russo-Ukrainian conflict. The North American Journal of Economics and Finance 75, Pt A: 102308. [Google Scholar] [CrossRef]
  66. Zhang, Yulian, and Shigeyuki Hamori. 2022. A connectedness analysis among BRICS’s geopolitical risks and the US macroeconomy. Economic Analysis and Policy 76: 182–203. [Google Scholar] [CrossRef]
Figure 1. Impulse response functions of BRICS+ equity markets and U.S. inflation rates to VIX shocks. Note: Shaded areas represent 95% confidence intervals obtained via bootstrap replications.
Risks 13 00217 g001
Figure 2. Impulse response functions of BRICS+ equity markets and U.S. inflation rates to GPRD shocks. Note: Confidence bands correspond to 95% bootstrap intervals.
Risks 13 00217 g002
Figure 3. Impulse response functions of BRICS+ equity markets to T5YIE shocks. Note: Shaded regions denote 95% confidence intervals constructed through bootstrap simulations.
Risks 13 00217 g003aRisks 13 00217 g003b
Figure 4. Impulse response functions of BRICS+ equity markets and U.S. inflation rates to T10Y3M shocks. Note: Shaded areas indicate 95% confidence bands from bootstrap replications.
Risks 13 00217 g004aRisks 13 00217 g004b
Table 1. Descriptive statistics.
VariableMeanVarianceSkewnessKurtosisJarque–BeraERSQ(20)Q2(20)
VIX0.0000.0061.365 ***9.027 ***9079.079 ***−21.753 ***29.161 ***149.459 ***
(0.953)(0.000)(0.000)(0.000)(0.000)(0.000)(0.000)
SSE0.0000−0.596 ***8.336 ***7239.386 ***−22.377 ***37.812 ***256.549 ***
(0.931)(0.000)(0.000)(0.000)(0.000)(0.000)(0.000)
RTSI0.0000.0050.088 *1014.613 ***105,088,582.902 ***−29.865 ***526.912 ***611.303 ***
(0.904)(0.075)(0.000)(0.000)(0.000)(0.000)(0.000)
BSE.300.000 **0−1.588 ***23.269 ***56,299.866 ***−20.146 ***56.998 ***1197.153 ***
(0.019)(0.000)(0.000)(0.000)(0.000)(0.000)(0.000)
BVSP0.000 *0−1.189 ***18.753 ***36,477.877 ***−18.027 ***83.800 ***2779.189 ***
(0.099)(0.000)(0.000)(0.000)(0.000)(0.000)(0.000)
JTOPI0.0000−0.512 ***7.312 ***5564.267 ***−22.180 ***27.564 ***1769.483 ***
(0.223)(0.000)(0.000)(0.000)(0.000)(0.000)(0.000)
TASI0.0000−1.156 ***10.933 ***12,748.277 ***−3.509 ***77.542 ***745.889 ***
(0.330)(0.000)(0.000)(0.000)(0.000)(0.000)(0.000)
ADX0.000 *0−0.335 ***19.170 ***37,560.939 ***−6.158 ***90.914 ***2742.648 ***
(0.060)(0.000)(0.000)(0.000)(0.000)(0.000)(0.000)
EGX.300.001 **0−0.368 ***6.074 ***3821.802 ***−7.854 ***76.255 ***484.591 ***
(0.020)(0.000)(0.000)(0.000)(0.000)(0.000)(0.000)
T5YIE0.0000.002−0.466 ***5.922 ***3668.308 ***−19.449 ***23.139 ***541.638 ***
(0.593)(0.000)(0.000)(0.000)(0.004)(0.004)(0.000)
T10Y3M−0.0010.003−0.143 ***3.344 ***1149.565 ***−19.720 ***15.729 *541.677 ***
(0.425)(0.004)(0.000)(0.000)(0.094)(0.094)(0.000)
GPRD0.0000.19−0.0232.094 ***436.279 ***−5.454 ***492.601 ***316.776 ***
(0.999)(0.648)(0.000)(0.000)(0.000)(0.000)(0.000)
Note: *, **, and *** denote statistical significance at the 10%, 5%, and 1% levels, respectively. Values in parentheses represent p-values.
Table 2. Unit root test results.
VariableADFPP1%5%10%p-Value
VIX 26.955 49.028 3.960 3.410 3.1200.0000
SSE 26.128 49.019 3.960 3.410 3.1200.0000
RTSI 44.339 76.480 3.960 3.410 3.1200.0000
BSE30 27.810 49.602 3.960 3.410 3.1200.0000
BVSP 27.077 49.953 3.960 3.410 3.1200.0000
JTOPI 26.632 43.928 3.960 3.410 3.1200.0000
TASI 18.566 37.397 3.960 3.410 3.1200.0000
ADX 30.296 43.786 3.960 3.410 3.1200.0000
EGX30 21.855 37.144 3.960 3.410 3.1200.0000
T5YIE 26.164 41.990 3.960 3.410 3.1200.0000
T10Y3M 27.117 44.839 3.960 3.410 3.1200.0000
GPRD 40.571 72.972 3.960 3.410 3.1200.0000
Disclaimer/Publisher’s Note: The statements, opinions and data contained in all publications are solely those of the individual author(s) and contributor(s) and not of MDPI and/or the editor(s). MDPI and/or the editor(s) disclaim responsibility for any injury to people or property resulting from any ideas, methods, instructions or products referred to in the content.