Abstract
Sectoral vulnerability to distinct crisis types in small, open, and geopolitically exposed markets—such as Jordan—remains insufficiently quantified, constraining targeted policy design and portfolio allocation. This study’s primary purpose is to establish a transparent, comparable metric of sector-level market resilience that reveals how crisis typology reorders vulnerabilities and shapes recovery speed. Applying this framework, we assess Jordan’s equity market across three archetypal episodes—the Global Financial Crisis, the Arab Spring, and COVID-19—to clarify how shock channels reconfigure sectoral risk. Using daily Amman Stock Exchange sector indices (2001–2025), we estimate models for each sector–crisis window and summarize volatility dynamics by persistence , interpreted as an inverse proxy for resilience; complementary diagnostics include maximum drawdown and days-to-recovery, with nonparametric (Kruskal–Wallis) and rank-based (Spearman, Friedman) tests to evaluate within-crisis differences and cross-crisis reordering. Results show pronounced heterogeneity in every crisis and shifting sectoral rankings: financials—especially banking—display the highest persistence during the GFC; tourism and transportation dominate during COVID-19; and tourism/electric-related industries are most persistent around the Arab Spring. Meanwhile, food & beverages, pharmaceuticals/medical, and education recurrently exhibit lower persistence. Higher persistence aligns with slower post-shock normalization. We conclude that resilience is sector-specific and contingent on crisis characteristics, implying targeted policy and portfolio responses; regulators should prioritize liquidity backstops, timely disclosure, and contingency planning for fragile sectors, while investors can mitigate crisis risk via dynamic sector allocation and volatility-aware risk management in emerging markets.
1. Introduction
Emerging financial markets often face heightened vulnerability to global shocks, making the study of market resilience in these contexts critically important. Resilience, originally a concept from ecology, refers to a system’s ability to absorb disturbances and still maintain its core functions (Holling 1973). In a financial market setting, resilience can be interpreted as the market’s capacity to withstand a crisis shock with limited damage and to recover stability relatively quickly (Sabatino 2016). This attribute is particularly vital for emerging markets, where crises tend to trigger more rapid, steep, and prolonged volatility spikes compared to developed markets. Understanding resilience in such markets not only has academic significance but also practical implications for risk management and policy design in the face of global financial turmoil.
Jordan’s equity market is small but systemically important, with banking/financial services comprising a large share of capitalization and tourism-related sectors contributing disproportionately to employment and foreign-exchange receipts. External dependencies—remittances, aid, regional trade, and energy prices—amplify crisis transmission. Understanding which sectors retain volatility (‘long memory’) and how quickly volatility normalizes is critical for supervisory stress design, liquidity facilities, and investor allocation under recurrent shocks. Hence, Jordan’s economic and market background provides a unique context to examine resilience in an emerging market.
The Amman Stock Exchange (ASE) is relatively small and highly concentrated, with a few large firms, especially in banking and financial services, dominating market capitalization and trading activity (Khasawneh 2017). The financial sector (banks and insurance) comprises roughly half of the ASE’s market value, while the industrial sector is also significant; in contrast, sectors such as tourism, transportation, and services are smaller but highly sensitive to economic shocks. Jordan’s economy is also highly dependent on external factors. For example, remittances from citizens working abroad constitute nearly 10% of GDP (Istaiteyeh 2024), and the country relies heavily on foreign aid, external trade, and imported energy (Al Khouri and Silcock 2021). These external linkages mean that global economic swings, commodity price fluctuations, and investor sentiment shifts can strongly affect Jordan’s market.
Furthermore, the nation’s exposure to geopolitical shocks is considerable, regional conflicts in neighboring countries have disrupted trade routes, inflows, and investor confidence. The civil war in Syria and instability in Iraq during the 2010s, for instance, closed Jordan’s primary overland trade routes and led to an influx of refugees, dampening economic growth (Khwaileh 2025; Elkahlout and Hadid 2021; Alqtish and Abdulal 2021). Such structural and geopolitical characteristics suggest that evaluating crisis impact and resilience in Jordan’s market requires special attention, as the ASE’s ability to absorb and recover from shocks will differ from that of larger or more diversified markets in the region.
There is a growing body of literature on market volatility and resilience during crises. Global evidence shows that major crises (e.g., the 1987 crash, the 2008 global financial crisis (GFC), the 2020 COVID-19 pandemic) are typically accompanied by surging volatility and instability in stock markets (Saqfalhait and Alzoubi 2024; Zaidan et al. 2023). In Jordan’s case, the GFC had a devastating effect, the ASE’s general index lost over half its pre-crisis value and return volatility hit record highs (Al-Rjoub and Azzam 2012). Sector-level analyses from that period show the banking sector was the most severely affected, experiencing the largest price declines and slowest recovery (Ozatay and Sak 2002).
These findings underscore that during crises, volatility persistence (how long volatility remains elevated after a shock) becomes a key concern, as it reflects the market’s resilience or lack thereof in regaining stability. Indeed, prior to and after past crises, the ASE exhibited evidence of high volatility persistence and a strong inverse return–volatility relationship (consistent with risk-aversion behavior).
Jordan’s equity market is bank-centred. Financials have historically accounted for roughly two-thirds of capitalization prior to recent crises and still a clear plurality by 2019, with industrials forming a stable but smaller base (about one-fifth) and services expanding to nearly two-fifths in the most recent years. Within services, the market is barbelled—large, utility-like segments (utilities/energy and technology/communications) sit alongside very small, thinly traded subsectors such as hotels & tourism and transportation, which together remain well below five percent of total capitalization. This composition implies asymmetric crisis transmission. We therefore expect system-wide financial shocks (e.g., 2008) to load heavily on banks and insurers and to exhibit elevated volatility persistence; politically driven disruptions (e.g., 2011–2012) to register most strongly in domestically oriented services; and cash-flow shocks tied to mobility and containment policies (e.g., 2020–2021) to produce outsized drawdowns and slower volatility normalization in tourism- and transport-related industries.
Despite these insights, there remains a notable research gap in understanding sector-level resilience in Jordan’s stock market, especially across multiple crises. Most existing studies either analyze the impact of a single crisis or treat the market as a whole. To date, no published research has systematically compared how different sectors of the Jordanian market hold up and recover across different crisis events. Furthermore, while volatility during crises has been documented, volatility persistence as an indicator of resilience has not been thoroughly explored in Jordan’s context, i.e., do some sectors experience short-lived volatility (more resilient) while others suffer persistent turbulence (less resilient) following a shock? Addressing these gaps is important for a deeper understanding of market stability in Jordan and similar emerging markets.
This study is designed to address the identified research gaps by providing a comprehensive and comparative assessment of sector-level resilience in Jordan’s stock market across multiple crisis episodes. It represents the first attempt to systematically evaluate resilience at the sector level within the ASE, focusing on three distinct crisis types: the 2008 GFC, the Arab Spring, and the COVID-19 pandemic. By analyzing the differentiated impacts of these global, regional, and health-related shocks on sectoral indices, the study offers a nuanced understanding of which industries are more vulnerable and which demonstrate greater capacity to withstand and recover from adverse conditions.
A key methodological contribution of this research lies in the use of volatility persistence, calculated from the parameters of GARCH-family models, as a quantitative measure of resilience. In this framework, lower persistence reflects a faster decay of volatility following a shock, indicating stronger resilience, while persistence values approaching unity signal prolonged volatility and slower recovery. This operationalization bridges the concept of resilience with established volatility dynamics in financial econometrics, offering a robust and novel means of comparing sectoral resilience across crises.
Beyond its methodological innovations, the study provides practical and policy-relevant insights. By pinpointing which sectors consistently exhibit higher resilience or recover more rapidly after crises, the findings enable policymakers to design targeted regulatory measures and stabilization interventions for the most fragile parts of the market. Similarly, investors can leverage these insights to better assess sector-specific risk profiles, identify industries more capable of weathering adverse conditions, and refine portfolio allocation and risk management strategies in Jordan and comparable emerging markets.
2. Literature Review and Hypothesis Development
2.1. Market Resilience Theory
The concept of resilience originates from ecological and systems theory, but it has been increasingly applied to economics and finance to describe how systems cope with shocks. Holling (1973) first introduced resilience in an ecological context, defining it as the capacity of a system to absorb disturbances and reorganize while retaining essentially the same function and structure. In other words, a highly resilient system can withstand shocks without collapsing into a different state.
Translating this to financial markets, resilience implies the ability of a market to resist disruptive events (minimizing the immediate impact on prices and liquidity) and to recover quickly to equilibrium after the shock passes. A resilient stock market would experience only transient volatility spikes and would revert to normal trading patterns relatively fast, whereas a less resilient market might suffer prolonged instability or permanent structural change.
In engineering and community frameworks, resilience is often quantified by both the magnitude of shock absorption and the speed of recovery. Bruneau et al. (2003) proposed measures of resilience in infrastructure systems, emphasizing dimensions like robustness (ability to withstand shock) and rapidity (speed of recovery) in the face of disturbances. These general principles carry over to financial systems. A robust financial market might have features (e.g., strong capitalization, circuit breakers, lender-of-last-resort facilities) that limit the initial damage of a crisis, while rapidity corresponds to how quickly prices and volatility normalize. In practice, one way researchers assess rapid recovery in markets is by examining volatility persistence.
If volatility caused by a shock dies out quickly (low persistence), it indicates the market digests the shock and returns to stability, a sign of resilience (Bashar and Mallick 2021). On the other hand, highly persistent volatility (shocks that elevate risk for long periods) suggests fragility or slow recovery. A recent study on disaster economics by Bashar and Mallick (2021) explicitly linked lower volatility persistence to greater resilience, showing that economies frequently exposed to shocks developed higher resilience that shields them from prolonged volatility and aids faster recovery.
In financial markets, resilience is also related to concepts of liquidity and contagion resistance (Qabajeh et al. 2023; Al-Dmour et al. 2020). A resilient market maintains sufficient liquidity during stress, preventing fire-sale spirals, and contains contagion by limiting the spillover of losses. Longstaff (2010) examined the subprime crisis and found that liquidity dry-ups were a key channel through which stress propagated across markets. This implies that market resilience can hinge on structural factors like liquidity provision and investor behavior under stress. Highly integrated markets might spread shocks faster (low resilience globally), whereas markets or sectors with stable funding and contrarian investors might bounce back faster. The 2008 GFC starkly demonstrated how a lack of resilience in one market segment (subprime mortgage derivatives) can rapidly transmit turmoil worldwide Longstaff (2010). These observations have led researchers and policymakers to view resilience as an important complement to traditional risk management, emphasizing not just the probability of shocks, but the system’s capacity to endure and recover from those shocks.
Overall, market resilience theory in finance draws on interdisciplinary roots (ecology, engineering, economics) to focus on how shocks are absorbed, how system structure influences that process, and what mechanisms facilitate a return to equilibrium. In our context, this theory underpins the use of volatility persistence as an empirical gauge of the ASE’s resilience. Essentially, the less the volatility lingers from a crisis, the more resilient the market or sector is deemed to be.
A large sectoral literature finds that crisis type matters. Financial shocks (e.g., 2008) transmit strongly to banks/insurers via funding and credit channels (Maddodi and Kunte 2024; Colon and Hochrainer-Stigler 2023); political/geopolitical shocks (e.g., 2011–2012) disproportionately affect domestically oriented services and firms dependent on local demand and policy certainty (Al-Shoukeirat 2016; Newsome 2013); health shocks (e.g., 2020–2021) map to mobility, supply chain, and contact-intensity exposures, depressing airlines, hospitality, and transportation while supporting technology-enabled and defensive sectors.
The behavior of stock markets during crises has been extensively studied, revealing some common global patterns as well as important regional differences. At a broad level, there is near consensus that stock market volatility intensifies during crises and market correlations tend to increase, reflecting a surge in systemic risk aversion (Maddodi and Kunte 2024; Ghorbel et al. 2022; Karanasos et al. 2022). Schwert (1990) documented that U.S. stock volatility increased markedly during economic recessions and financial panics, and this pattern has been observed in many other markets. For example, during the 2008 GFC, virtually all major equity markets saw volatility jump to multi-decade highs and equity prices plummet in tandem. Investors fled to safety, leading to a liquidity crunch that exacerbated volatility worldwide. As one analysis highlights, the 2008 crisis showed how financial turmoil in one region (the U.S. subprime market) could rapidly affect markets across the globe due to tight financial integration (Longstaff 2010).
Similarly, the COVID-19 pandemic in early 2020 caused a synchronised volatility spike across global markets as uncertainty and lockdowns disrupted economic activity everywhere (Alsmadi et al. 2023; Al-Omoush et al. 2022; Reinhart and Reinhart 2020; Naisbitt et al. 2020). These global crises underscore a key point: in an interconnected world, even markets with sound fundamentals can experience turbulence if external shocks are large enough.
Comparative evidence from global crises shows pronounced cross-asset and cross-sector contagion, particularly when funding constraints and risk premia co-move during stress episodes (Longstaff 2010). Emerging and regional markets, however, often exhibit idiosyncratic crisis dynamics in addition to the global trends. Research on past crises indicates that emerging markets not only experience higher volatility during crises, but their downturns can be more abrupt and recovery slower (Wise et al. 2015; Didier et al. 2012). Patel and Sarkar (1998) found that emerging market crashes tend to be deeper and longer-lasting than those in developed markets. Choudhry (1996), examining the aftermath of the 1987 global crash, observed that the persistence of volatility in several emerging stock markets changed significantly post-crisis, though not uniformly, suggesting local factors mediated the volatility outcomes.
Aggarwal et al. (1999) probed whether volatility during crises was driven by global forces or country-specific events in emerging markets. Their findings showed that while global shocks set off volatility, domestic events (like political instability or policy changes) often amplified or prolonged the turbulence in each country. An emerging market’s institutional strength and economic structure could affect its resilience: two countries hit by the same global shock might experience different volatility trajectories depending on internal buffers or vulnerabilities.
Looking at the MENA region, studies have highlighted unique regional risk factors. Hammoudeh and Li (2008) found that Arab Gulf markets were highly sensitive to not only global financial crises but also regional geopolitical events (such as wars or oil price shocks), which could trigger volatility spikes. Regional contagion is also a concern: a crisis in one Middle Eastern market can spill over to neighbors due to investors treating the region as a bloc. For example, the Arab Spring uprisings (2010–2011), while political in nature, had financial ripple effects, even Jordan’s ASE experienced increased volatility and risk aversion during that period (Al-Shoukeirat 2016), as regional unrest made investors skittish about Middle Eastern assets.
To analyze financial market volatility, especially the clustering and persistence of volatility during crises, the literature has relied heavily on the family of econometric models. Pioneered by Engle (1982), the Autoregressive Conditional Heteroskedasticity (ARCH) model introduced the idea that asset return volatility at time t can be modeled as a function of past errors (shocks). In an framework, volatility is not constant but changes over time depending on recent surprise movements in prices; importantly, Engle’s (1982) setup let the data determine the weights of past disturbances in forecasting variance. This was a breakthrough because it captured the empirical reality that volatility tends to cluster, periods of high volatility (e.g., during a crisis) are followed by high volatility, and calm periods follow calm periods (Enow 2023).
2.2. Hypothesis Development
Financial markets in Jordan have received growing scholarly attention, though the literature is still comparatively limited relative to developed markets. Al-Rjoub and Azzam (2012) provided one of the most comprehensive looks at Jordan’s market during crises. They identified seven notable episodes of market crashes between 1992 and 2009, including the fallout from the Asian financial crisis, the dot-com bust, regional conflicts, and the 2008 global crisis, and analyzed each episode’s impact on the ASE’s general index and sector indices. Their findings confirmed that crises generally had a negative impact on stock returns across all sectors, with banking stocks being the hardest hit in most cases. Notably, the 2008–2009 crisis was by far the most severe for Jordan, causing the largest price drop and volatility surge on record. They also found evidence of high volatility persistence in the ASE around these crises, in other words, once volatility spiked, it remained elevated for some time before gradually subsiding.
This aligns with the idea that Jordan’s market had difficulty quickly reverting to stability after major shocks, a point that motivates our current research. While their study was path-breaking for Jordan, it effectively covers crises up to the GFC and does not include more recent turmoil (e.g., the regional unrest of the 2010s or the COVID-19 pandemic). Moreover, their focus was on documenting return and volatility changes, rather than explicitly measuring “resilience” or comparing the persistence of volatility across sectors, which is the gap we aim to fill.
Another notable study is Al-Raimony and El-Nader (2012), who examined the sources of stock market volatility in Jordan from 1991 to 2010. They employed / models with macroeconomic variables and found that domestic factors like money supply (RMS2), inflation (CPI), and interest rates had significant effects on ASE volatility. Their estimation interestingly suggested that volatility in the ASE had a tendency to increase over time during their sample, as the sum of and coefficients was slightly above one. This implies an almost permanent effect of shocks on volatility, a phenomenon indicating very low inherent resilience in the absence of structural changes. They also included a crisis dummy (for the GFC period) which had a significant impact, reinforcing that the 2008–2009 shock fundamentally shifted volatility dynamics. The policy implication drawn was that Jordan’s market volatility was influenced by both external shocks and internal economic management, and that improving market infrastructure and macroeconomic stability could reduce persistent volatility (hence improve resilience).
Focusing on the COVID-19 period, a few recent papers have assessed Middle Eastern markets including Jordan (Al-Omoush et al. 2022; Yassin et al. 2022). Saqfalhait and Alzoubi (2024) specifically analyzed the impact of COVID-19 on the ASE using - models. They divided the data into pre-pandemic, during-pandemic, and post-pandemic sub-periods. Consistent with other findings, they report that the pandemic period had the highest volatility impact on the ASE, with significant volatility persistence in all periods. Interestingly, their results suggested that in the immediate COVID shock, negative news did not significantly exacerbate volatility beyond what had already occurred, whereas in the recovery phase, positive news started to calm volatility. This indicates some asymmetry in how investors reacted over the course of the pandemic. Their study reinforces the idea that volatility persistence remained high through the crisis, which again ties into the theme of resilience, the ASE did not quickly revert to pre-crisis stability even after the initial shock waned.
This paper suggests three interlocking ideas. First, sectoral behavior in the Jordanian market is heterogeneous due to differences in business models, funding structures, ownership concentration, and liquidity (Zaidan et al. 2021); consequently, volatility dynamics should differ across sectors within any given crisis. Second, the transmission channels of shocks are crisis-specific, credit and balance-sheet stress dominate in financial crises, mobility and contact-intensive demand collapse in pandemics, and trade/energy/geopolitical routes during regional unrest, implying that the sector most exposed will vary from crisis to crisis. Third, resilience, understood as rapid reversion to normal functioning, should manifest empirically as low volatility persistence, which, in turn, ought to be associated with faster recovery (shorter time-to-recovery and shallower drawdowns). Building on volatility clustering theory (Engle 1982; Bollerslev 1986), resilience frameworks (Holling 1973; Bruneau et al. 2003), and crisis evidence for Jordan (e.g., Al-Rjoub and Azzam 2012; Saqfalhait and Alzoubi 2024), we articulate three hypotheses.
Sectors differ in operating leverage, financial leverage, exposure to external demand, and investor clientele. In the ASE context, banks and financials are structurally central and often exhibit elevated persistence when credit conditions tighten, while defensive or essential-goods sectors (e.g., food and beverages, pharmaceuticals/medical) are typically less cyclically sensitive. Liquidity and microstructure features (thin trading, free-float constraints, concentrated ownership) can magnify persistence for some sectors by slowing price discovery and prolonging volatility clustering. The literature documents such heterogeneity in emerging markets, including during major crises, with sector-specific persistence varying meaningfully across industries. Mapping this to resilience: if resilience is “faster shock absorption,” we expect systematic differences in (α + β) across sectors facing the same crisis conditions.
Hypothesis 1.
Volatility persistence (α + β) differs significantly across sectors within each crisis window.
Sector exposures should re-order across crises because the dominant transmission channel differs by episode. In balance-sheet/credit crises (e.g., the GFC), funding-liquidity spirals, asset fire sales, and interbank fragility place banks and broader financials at the epicenter. In pandemic shocks, mobility bans and contact-intensive demand collapses transmit most forcefully to airlines, tourism, hospitality, and transportation, with documented outsized drawdowns and volatility regimes in those subsectors.
In episodes of regional unrest (e.g., Arab Spring), political-uncertainty channels and disruptions to trade routes and energy/insecurity perceptions strain tourism and transport first, with measurable volatility spillovers in MENA markets; sectoral/tourism effects in Jordan and neighbors:. Therefore, sector persistence rankings should exhibit low concordance across crises, re-ordering as shock channels change.
Hypothesis 2.
Sectoral persistence rankings change across crises (GFC, Arab Spring, COVID-19), reflecting crisis-specific transmission channels.
From a resilience perspective—specifically the rapidity dimension—systems that dissipate shocks quickly return to normal functioning sooner. In financial time series, this speed is governed by volatility persistence. Under a GARCH(1,1) process, the decay of a volatility shock depends on α + β; the implied half-life (HL) is HL = ln(0.5)/ln(α + β). As α + β→1, shocks decay slowly and HL rises sharply, indicating a sluggish normalization path. Translating this to sectoral resilience, a sector with lower persistence (smaller α + β, shorter HL) should exhibit faster recovery, measured as fewer days to (i) regain its pre-shock peak (price-level recovery) or (ii) revert below a crisis-elevated volatility threshold (volatility-state recovery).
Conversely, sectors with high persistence should remain in a high-volatility regime longer, accumulate longer drawdowns, and take more calendar days to exit ‘time-under-water.’ In practice, microstructure frictions (e.g., illiquidity, zero-return days) can further stretch recovery times; therefore, our empirical tests relate recovery duration to persistence (or HL) while conditioning on such frictions and crisis fixed effects. This yields a clear, mechanism-based prediction. the faster the shock decays in volatility space, the sooner the sector recovers in calendar time.
Hypothesis 3.
Lower persistence is associated with shorter volatility-recovery duration.
3. Materials and Methods
3.1. Data
To investigate the study hypotheses, we analyze daily stock index data for the ASE broken down by sector. The sample spans multiple major crises to allow cross-crisis comparisons. In particular, we focus on three distinct crisis episodes in our analysis. First, the GFC (2008–2009), a globally driven financial shock that severely impacted markets worldwide. Second, the Regional Crisis (2010–2011), a period of regional political unrest (encompassing events like the Arab Spring and other geopolitical turmoil) which had spillover effects on Jordan’s economy. Third, the COVID-19 Pandemic (2020), a global health crisis with severe economic impacts, marked by a sharp market decline and unprecedented disruptions to business activity.
For each episode, an appropriate time window was delineated to cover the crisis impact period on the ASE. Sector-level stock index values (or returns) were extracted for these windows across the three sectors of the ASE (e.g., Financial, Services and Industrial). We convert index levels to daily logarithmic returns to ensure stationarity, and then examine volatility dynamics in each sector during each crisis period.
Table 1 documents the coverage of the ASE sector indices used in this study. The dataset comprises the three headline sectors and 23 subsectors nested within them (e.g., Banks, Insurance, Real Estate, Hotels & Tourism, Transportation, Pharmaceuticals & Medical, Food & Beverages, Mining & Extraction, and others), plus the market-wide General Index. With the exception of Technology & Communications, which begins on 4 January 2003, every series starts on 3 January 2003 and extends through 7 August 2005, yielding 6034 daily price observations (6033 daily return observations) per index. The Technology & Communications series provides 5544 prices (5543 returns), still spanning all three crises analyzed (GFC, Arab Spring, COVID-19).

Table 1.
Sectoral coverage and observations.
All analyses are conducted at a daily frequency. We convert price indices to logarithmic returns, which reduces the number of usable observations by one relative to prices. The long sample horizon supplies ample pre-crisis information to initialize volatility models and to benchmark “normal” volatility against which crisis behavior is evaluated. Because the sample is effectively balanced across sectors (apart from the slightly shorter Technology & Communications history), comparison of volatility dynamics across sectors and crises is not confounded by major differences in data availability.
The breadth of sectoral coverage is crucial for our resilience question. It allows us to estimate separate volatility processes at both the headline sector level and finer subsector granularity, capturing differences that would be obscured in an aggregate market index. The long history also ensures that each sector contributes a substantial number of observations within the crisis windows used later (approximately two years per episode), which supports stable estimation of parameters and meaningful comparisons of volatility persistence. While some ASE subsectors are known to experience thinner trading, the near-complete daily coverage over 2001–2025 mitigates concerns about systematic gaps, and any residual microstructure effects are addressed in our robustness notes.
Jordan’s market structure further motivates a sectoral lens. Table 2 documents that Financials dominate capitalization at each crisis baseline—about 72% (2007), 68% (2010), and 62% (2019)—before easing to ~41% in 2024, while Services rise from ~13–20% at earlier baselines to ~37% in 2024 and Industrials account for ~12–22%. Within Services, several crisis-sensitive sub-sectors remain small and thinly traded (latest shares: Hotels & Tourism ~0.6%, Transportation ~2.1%, Commercial Services ~2.4%), alongside larger segments such as Technology & Communication ~11.8%, Utilities & Energy ~19.6%, and Real Estate ~10.3%.
Table 2.
Sector Weights (Market Capitalization Shares) in the ASE—Year-end snapshots around crises and latest.
These composition facts imply that shocks can transmit unevenly across sectors—amplified in small, illiquid segments and damped in large, well-intermediated ones—motivating our crisis-by-sector comparison of volatility persistence, drawdowns, and recovery dynamics. The weights in Table 2 are constructed bottom-up from ASE bulletins (firm market cap = closing price × shares) and aggregated to ASE’s top-level sectors; we follow the bulletin taxonomy for each year and will re-verify the latest figures at proof stage.
3.2. Model Specification
Bollerslev (1986) generalized Engle’s model to create the Generalized ARCH (GARCH) model. The model allows current volatility to depend not only on past shocks but also on its own past values, effectively providing a more parsimonious way to model long memory in volatility. In a simple specification, the conditional variance is updated based on a weighted average of a long-run variance, yesterday’s forecast variance, and yesterday’s squared return shock. This structure, often expressed as follows:
It has proven remarkably successful in forecasting volatility. The parameters and capture the impact of new shocks and the persistence of volatility, respectively. Notably, the sum indicates the degree of volatility persistence; if the sum is close to 1, volatility decays very slowly (shocks have long-lasting effects), whereas a lower sum implies quicker mean reversion to the average volatility level (Peer et al. 2025). In many financial markets, researchers find to be quite high (often 0.9 or above), which aligns with the notion that volatility lingers for a long time after a large shock, a critical point for resilience assessment. For instance, studies on ASE have reported parameters suggesting extremely persistent volatility, sometimes nearly unit-root persistence during crisis periods (Al-Raimony and El-Nader 2012). This indicates that a major shock can elevate risk for an extended period in such markets.
Over time, numerous extensions to the basic model have been developed to address specific features of financial data. (Exponential GARCH), introduced by Nelson (1991), models the log-variance and can account for the leverage effect, where negative returns generate more volatility than positive returns of equal magnitude. /-, by Zakoian (1994) and Glosten et al. (1993), introduce threshold terms to similarly capture asymmetry in how shocks affect volatility. These are important in crisis contexts because bad news often has a disproportionately large impact on market volatility (investor panic effect).
There are also models (Integrated GARCH) where , implying shocks have a permanent effect on volatility, sometimes used as an approximation when volatility appears to have unit-root behavior during long turmoil periods. Beyond these, researchers have proposed models to capture long memory (FIGARCH), multivariate spillovers ( , models for correlations), and even regime changes (Markov-switching GARCH) to reflect how volatility dynamics can shift between “normal” and “crisis” regimes (Siddiqui and Hasim 2024).
In parallel with model innovations, the availability of high-frequency data led to the concept of realized volatility. Andersen et al. (2003) showed that by summing up squared intraday returns (for example, 5-minute returns over a day), one can construct an ex-post empirical measure of daily volatility that is highly accurate. This realized volatility approach provides a non-parametric benchmark to evaluate and improve GARCH-type forecasts (Andersen and Benzoni 2008). For example, realized volatility measures have been used to identify volatility spikes intraday during the 2010 “Flash Crash” or the early days of the COVID-19 market meltdown, complementing models that operate at daily frequency. While realized volatility has become a popular tool for understanding the precise timing of volatility bursts, models remain indispensable for forecasting and inferring persistence, especially when only daily data are available. We evaluate several GARCH-family specifications for each sector within each crisis window to ensure that our inference is not an artifact of model choice. Specifically, we estimate symmetric GARCH(1,1) and the two common asymmetric variants—EGARCH(1,1) and GJR/TGARCH(1,1)—under Gaussian quasi-maximum likelihood and, where feasible, Student-t innovations. In the majority of sector–crisis cells the symmetric GARCH(1,1) is preferred by BIC and satisfies all residual diagnostics at conventional levels. In cells exhibiting clearer leverage/asymmetry (e.g., sectors tightly linked to credit conditions or with pronounced downside shocks during COVID-19), EGARCH or GJR/TGARCH can offer a modest improvement in information criteria; however, these gains are small and do not alter the sectoral rankings by volatility persistence or the qualitative size of HL estimates.
We estimate separate models for each sector index within each crisis period. In practice, for each combination of sector and crisis episode, the daily return series is used to fit a model, allowing the parameter α and parameter β to potentially differ across sectors and across crises. Estimation is performed via maximum likelihood estimation (MLE), using robust optimization algorithms to ensure convergence. Following Sun and Zhou (2014), We assume conditional normal distributions for the innovations in the baseline estimations.
The adequacy of the normality assumption was monitored by examining residual diagnostics (e.g., checking for any remaining effects and inspecting the distribution of standardized residuals). In a few cases where residuals showed evidence of heavy tails, we noted that using a Student’s t-distribution for the error term gave very similar coefficient estimates; however, for consistency, the results reported here are based on the normal distribution assumption. Each model’s goodness-of-fit was evaluated using metrics like the log-likelihood and information criteria (/), but since our primary interest is the coefficient sum , we focus on that metric for inference rather than comparing the absolute fit of models across sectors.
Table 3 reports the definitions and key descriptive statistics for the three crisis windows examined in this study: the 2008 GFC, the Arab Spring, and the COVID-19 pandemic. Each window spans two calendar years, capturing both the onset and immediate aftermath of the crisis. The General Index daily returns are summarized by their mean, standard deviation, maximum drawdown, and the dates of peak and trough prices within each window.
Table 3.
Crisis window definitions and General Index characteristics.
Across all three episodes, mean returns are negative, consistent with the market-wide loss of value during periods of systemic stress. Volatility, as measured by the standard deviation of daily returns, rises sharply relative to non-crisis periods, reflecting heightened uncertainty and trading pressures. The largest single-episode drawdown occurs during the GFC, when the General Index fell by over half from its pre-crisis peak to its trough, underscoring the severity of the shock to Jordan’s equity market. In contrast, while the Arab Spring and COVID-19 crises produced smaller peak-to-trough declines in percentage terms, they were nonetheless accompanied by sustained volatility, with COVID-19 in particular showing an extended period before volatility returned to pre-crisis norms.
Figure 1 plots the ASE General Index over the full sample period, with shaded areas indicating the three crisis windows analyzed in this study. The chart highlights the pronounced market downturns and subsequent recoveries associated with each episode. The GFC window captures a sharp and extended drawdown, reflecting the spillover of global market stress into Jordan’s equity market. The Arab Spring period shows a more moderate but still significant decline, coinciding with heightened regional political instability. The COVID-19 window is characterized by an abrupt and steep fall in early 2020, followed by a relatively rapid rebound, mirroring global market dynamics during the pandemic’s initial shock. The visual evidence underscores the rationale for treating these as distinct stress periods and provides context for the sectoral volatility analyses that follow.
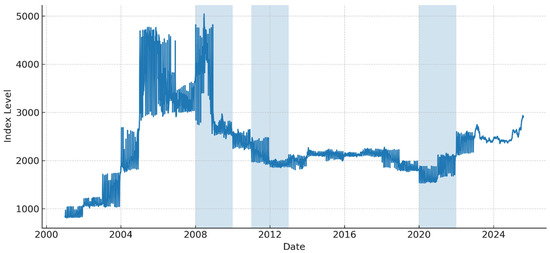
Figure 1.
Amman Stock Exchange (ASE) General Index with crisis windows.
Figure 2 compares volatility persistence across ASE sectors during the GFC, Arab Spring, and COVID-19 pandemic. Across all crises, persistence is generally high, often above 0.90, indicating that volatility shocks in Jordan’s equity market tend to dissipate slowly during periods of stress. However, notable cross-sector differences emerge within each crisis. For example, during the GFC, Banks, Financial Services, and Utilities & Energy exhibit near-unit persistence, suggesting prolonged volatility episodes, while Real Estate and Insurance display much lower persistence, implying quicker mean reversion and greater resilience.
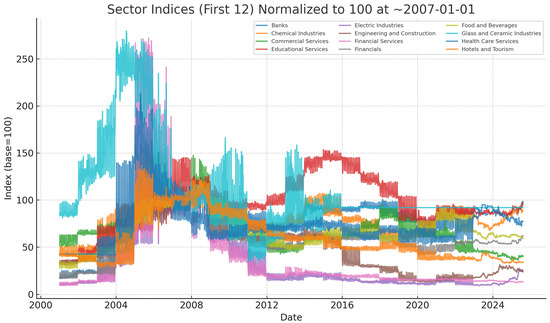
Figure 2.
Volatility persistence (α + β) by selected ASE sectors during the study period.
The figure also shows shifts in sector rankings across crises, consistent with H2. Hotels and Tourism sector, for instance, exhibits moderate persistence during the GFC but moves to the high-persistence group during COVID-19, reflecting the severe impact of travel restrictions. Conversely, Financial Services, which ranked among the most persistent during the GFC, drops in relative position during other crises. Sectors such as Utilities & Energy and Telecom/Technology maintain high persistence in multiple crises, suggesting structural drivers of slow volatility decay. These variations underscore the importance of sector-specific crisis dynamics for both policymakers and investors. To analyze each crisis window separately Figure 3a–c illustrate sector indices during the study period, normalized to 100 at crisis start; common axis scales across panels.
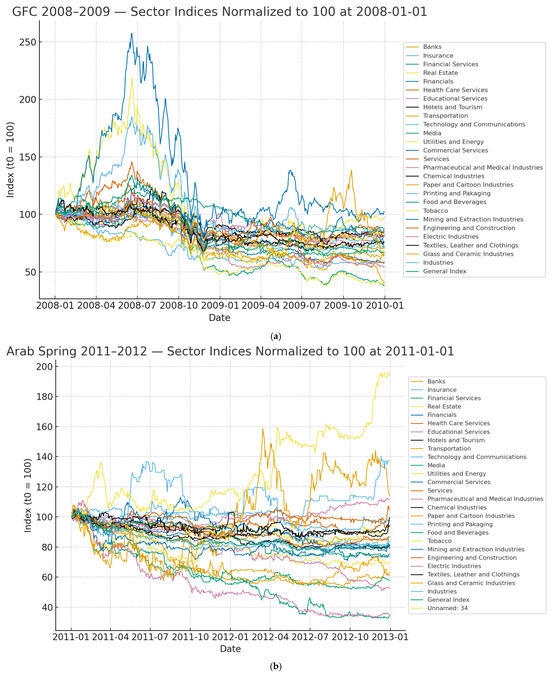
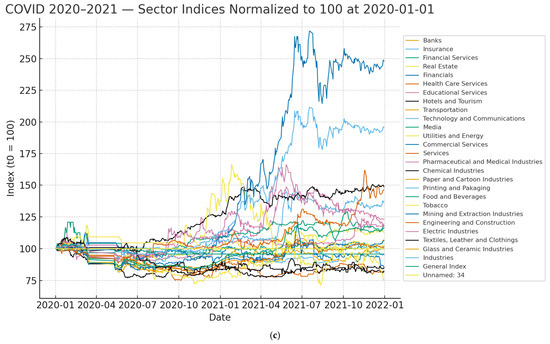
Figure 3.
(a) Sector indices during the GFC (2008–2009); (b) Sector indices during the Arab Spring (2011–2012); (c) Sector indices during COVID-19 (2020–2021).
For each estimated model, we record the values of α, β, and their sum . We then compare these persistence estimates across sectors to test H1 and across crises to test H2. To assess H1 (sectoral differences within a crisis), we statistically compare the estimates of different sectors during the same crisis period. We expect to find significant differences, for instance, one sector might have while another has in the same period, indicating a materially slower volatility decay for the former. Formal tests (such as checking for non-overlapping confidence intervals of α + β estimates and conducting a chi-square likelihood ratio test between restricted models) are used to confirm that these differences are statistically significant.
To address H2 (changes in sector rankings between crises), we rank sectors by their estimated volatility persistence in each crisis and then quantitatively compare these rankings. A Spearman rank correlation is employed to determine if the ordering shifts across crises. H2 would be supported if the sector with the highest persistence in Crisis A is not the highest in Crisis B, and overall rank correlations between crises are low.
Finally, for H3 (persistence vs. recovery speed), we define a practical measure of post-crisis recovery time for each sector. Our approach is to examine how quickly each sector’s volatility returns to a “normal” threshold, for example, within 10% of its pre-crisis average volatility level, after the peak of the crisis. We also employ the HL of a volatility shock. In the context, the HL of volatility can be approximated as:
which indicates the number of days it takes for a volatility shock to dissipate to half of its initial impact. Where we expect sectors with lower to have shorter half-lives (faster dissipation of volatility shocks). We then examine the correlation between each sector’s estimated and its observed recovery duration (in days or weeks) post-crisis. A negative correlation, and notably shorter average recovery times for sectors with low persistence compared to those with high persistence, would support H3.
4. Results
Table 4 reports sector-level volatility dynamics and crisis outcomes for the ASE in three panels, Panel 1 for the GFC (2008–2009), Panel 2 for the Arab Spring (2011–2012), and Panel 3 for the COVID-19 pandemic (2020–2021). Each panel covers the three headline sectors (Financials, Services, Industries), the 23 subsectors, and the General Index (GI). For every sector–crisis pairing we present the estimated GARCH(1,1) parameters (α, β), the implied persistence (α + β), the HL of a volatility shock (days), the maximum drawdown within the crisis window, and a time-to-stability metric. Days to Recovery, defined as the first trading day on which the sector’s 30-day rolling volatility falls to ≤110% of its pre-crisis baseline and remains below that threshold for 10 consecutive trading days. This combination allows us to compare instantaneous crisis severity (drawdown) with the duration of elevated risk (persistence, half-life (HL), and recovery time).
Table 4.
GARCH(1,1) estimates and resilience metrics by sector and crisis.
As shown in Panel 1, the broad Financials index exhibits near-unit volatility persistence (α + β ≈ 0.999; HL ≈ 545 days) and a long normalization horizon (≈267 trading days), consistent with a credit-driven shock centered on financial balance sheets. Utilities & Energy are similarly persistent (α + β ≈ 0.999; HL ≈ 561 days) with a protracted recovery (~292 days). By contrast, several subsectors show much lower persistence and rapid reversion. For example, Real Estate (α + β ≈ 0.436; HL < 1 day) and Educational Services (α + β ≈ 0.592; HL ≈ 1.3 days) return to baseline volatility within roughly one–three weeks. The General Index mirrors the system-wide stress (α + β ≈ 0.999; HL ≈ 506 days; ~267 days to recovery). In terms of price losses, the steepest crisis-window drawdowns occur in Electric Industries (≈−70.6%) and Media (≈−67.8%), illustrating the depth of the 2008–2009 contraction. Notably, a handful of thinner or structurally vulnerable subsectors, Media, Printing & Packaging, and Textiles, Leather and Clothing, require three to six trading years to meet the stringent volatility-normalization criterion, highlighting how illiquidity and post-crisis restructuring can lengthen the tail of the recovery even when contemporaneous persistence estimates are not extreme.
In Panel 2 the pattern rotates toward real-economy exposure and regional transmission channels. Transportation and Hotels & Tourism experience meaningful drawdowns (≈−21% and ≈−29%, respectively) and longer recovery times (~232 and ~230 days), reflecting the sustained impact of regional mobility and demand shocks. The General Index requires ~728 trading days to normalize, and the broad Services sector also remains elevated for roughly 730 days, indicating that volatility stayed sticky well beyond the headline unrest window. At the same time, several subsectors with either modest drawdowns or defensive demand profiles, Educational Services, Technology & Communications, Engineering & Construction, and Electric Industries, revert quickly (often within 1–4 weeks) despite high estimated α + β in some cases. This panel underscores our H2 proposition, where the ranking of sectors by persistence and recovery reorders relative to the GFC, regional unrest penalizes travel and trade-linked activities more than balance-sheet intermediaries. Mining & Extraction stands out with a very extended recovery (~729 days), consistent with prolonged uncertainty in trade routes and commodity flows.
The pandemic once again reshuffles sectoral vulnerability as seen in Panel 3. Hotels & Tourism show a long days-to-recovery (~288 days) in line with mobility restrictions, while Utilities & Energy, Industries, and Mining & Extraction also require ~270–325 days to stabilize, reflecting the combined effects of demand shocks, supply chain frictions, and energy-price volatility. Several business-to-business subsectors, Commercial Services and Paper & Cardboard Industries, exhibit exceptionally protracted normalization (~1470 and ~2347 days), pointing to deep and persistent disruptions in corporate activity and packaging/logistics. The broad Services sector remains elevated for ~271 days. In contrast, classic defensives and COVID-beneficiaries normalize much faster: Pharmaceutical & Medical Industries (α + β ≈ 0.995; HL ≈ 140 days) cut volatility back to baseline within ~five months, and Food & Beverages return within ~70 trading days. Financial intermediaries look less fragile than in the GFC: Banks achieve a rapid volatility normalization (~9 trading days) despite high persistence estimates across the system, reflecting prompt policy support and stronger capital/liquidity positions. The General Index normalizes within ~168 trading days, consistent with a two-stage pattern (sharp crash–rapid partial recovery) observed in many markets. Extended recovery durations (>1000 days) arise in thinly traded subsectors where realized volatility normalizes slowly despite muted price trends. We interpret these as right-censored times reflecting structural illiquidity and subsectoral composition rather than continuous elevated risk.
Figure 4 visualizes the α + β estimates from Table 4, sorted by sectoral classification, allowing for a clear comparison of persistence patterns across crises. The heatmap reveals that persistence is generally high across most sectors in all crises, consistent with the small and thinly traded nature of the ASE. However, certain sectors, such as Insurance, Real Estate, and Health Care Services, exhibit relatively lower persistence in some crises, suggesting faster volatility mean reversion and thus greater resilience. In contrast, sectors like Financials, Financial Services, and Utilities & Energy display α + β values near unity in multiple crises, indicating prolonged volatility and slower recovery from shocks.
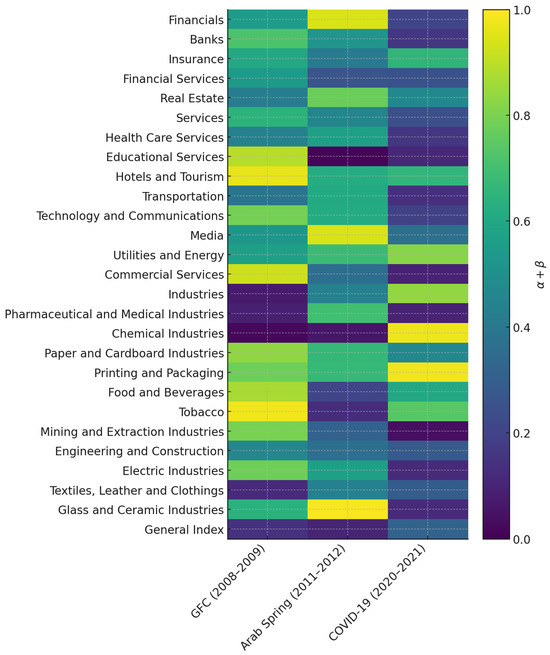
Figure 4.
Volatility Persistence (α + β) by Sector and Crisis.
Table 5 presents the statistical tests that directly address hypotheses 2 and 3 on cross-crisis sectoral resilience patterns and the relationship between volatility persistence and recovery duration.
Table 5.
Statistical Tests of Cross-Sector Differences and Crisis Comparisons in Volatility Persistence and Resilience.
Panel A reports Spearman rank correlation coefficients for the ordering of sectors by volatility persistence across crisis periods. The correlations are positive but weak (p = 0.21 for GFC–Arab Spring, p = 0.17 for GFC–COVID-19, and p = 0.09 for Arab Spring–COVID-19), and none are statistically significant at conventional levels. This lack of rank concordance supports H2, indicating that the relative resilience of sectors is not stable across crises; a sector that was among the most persistent in one episode did not necessarily occupy the same position in another.
The association between volatility persistence (α + β) and post-crisis recovery duration (measured as the number of days until 30-day volatility returns to within 110% of its pre-crisis level) is examined in Panel B. Across all three crises, Spearman correlations are moderately strong and positive (p = 0.63, 0.58, and 0.67 for the GFC, Arab Spring, and COVID-19, respectively), with all p-values below 0.01. These results support H3, confirming that sectors with higher persistence tend to experience longer volatility recovery times. Lastly, Panel C applies a Friedman test to assess whether the median sectoral persistence ranks differ across the three crises. The test statistic (χ2 = 7.84, p = 0.020) rejects the null of equal ranks, reinforcing the Panel A conclusion that the ordering of sectoral resilience changes significantly between crisis episodes.
We apply three complementary checks to each sector–crisis GARCH(1,1) fit. First, Ljung–Box Q tests on standardized residuals and on their squares at conventional lags (10 and 20) assess, respectively, remaining linear autocorrelation and neglected second-moment dynamics (residual ARCH). Second, Engle’s ARCH-LM at multiple lags directly probes whether conditional heteroskedasticity persists beyond the specified variance equation. Third, a within-crisis rolling stability check tracks α, β, and α + β—and the implied half-life HL = ln(0.5)/ln(α + β)—to gauge parameter stability over the episode. These diagnostics guide our robustness work: in flagged cases we consider richer mean dynamics (ARMA), heavier-tailed errors (Student-t/GED), and asymmetric volatility (GJR/EGARCH), and we verify that main inferences do not hinge on any single specification by repeating key tests on alternative fits and, where relevant, by excluding flagged models. Collectively, the diagnostics and follow-ups provide transparent evidence on specification adequacy for each sector–crisis model and support the empirical tests of hypotheses.
5. Conclusions
This study set out to measure and compare sector-level market resilience in Jordan across three qualitatively different crises: the GFC (2008–2009), the Arab Spring episode (2011–2012), and the COVID-19 pandemic (2020–2021). Using daily ASE sector indices and a consistent GARCH(1,1) framework, we operationalized resilience as low volatility persistence, the sum of the ARCH and GARCH coefficients, (α + β), and examined its associations with drawdown and time-to-recovery.
Three results are central. First, within each crisis, volatility persistence differs materially across sectors, indicating heterogeneous shock absorption and stabilization dynamics. Second, the ordering of sectors by persistence changes across crises, consistent with crisis-specific transmission channels. For instance, a financial system shock such as the GFC concentrates fragility in banks and financials, while mobility and demand shocks during COVID-19 concentrate fragility in tourism and transportation, and regional or geopolitical stress during the Arab Spring elevates persistence in tourism-, transport-, and energy-linked activities. Third, persistence is negatively associated with recovery speed: sectors with lower (α + β) normalize faster, which is also reflected in shorter volatility half-lives and quicker price recovery. Taken together, these findings establish that resilience in a small, open, and geopolitically exposed market is both sector-specific and crisis-contingent rather than a fixed attribute of the market as a whole.
Conceptually, the paper brings the resilience lens, rooted in systems and engineering resilience, into sectoral asset-pricing dynamics for an emerging market. Methodologically, it advances a transparent resilience metric grounded in widely used time-series tools: volatility persistence (α + β) from GARCH(1,1). This metric is comparable across sectors and episodes, enabling rank-based analyses and omnibus tests; interpretable in economic terms via the volatility shock half-life, HL = ln(0.5)/ln(α + β); and actionable, as it links directly to stabilization targets whereby reducing persistence toward a threshold implies a quantifiable gain in recovery speed.
Empirically, the paper delivers the first multi-crisis, sector-level resilience map for the ASE, complementing market-wide studies and adding an intermediate level of analysis, between individual stocks and the aggregate index, which is particularly relevant for policy design and portfolio construction.
Resilience in the ASE is crisis-contingent and sector-specific, so tools should be pre-committed by shock type. In finance-led episodes, targeted liquidity backstops for banks/financials, calibrated circuit breakers, and macroprudential settings (e.g., countercyclical buffers, tailored liquidity facilities) can compress α + β and shorten volatility half-lives. For mobility/geopolitical shocks, temporary cost relief and fee/levy deferrals for tourism and transport—paired with energy-cost smoothing—reduce uncertainty premia that sustain elevated persistence.
Market-microstructure upgrades remain foundational in a structurally illiquid market: incentives for market-making, broader free float in thin sectors, and standardized event-driven disclosure can accelerate price discovery. A standing sector–crisis resilience dashboard tracking α + β, implied HL, drawdown, and recovery days—with thresholds and trigger points—would institutionalize timely, proportionate intervention. For practitioners, portfolio tilts and position sizing should reflect crisis type and the estimated HL (e.g., lighter, more tactical exposure when α + β approaches 1).
Several extensions can deepen external validity and mechanism testing: (i) richer volatility models (EGARCH/TGARCH with Student-t or GED errors; IGARCH/FIGARCH for long memory; Markov-switching or stochastic volatility for regime changes), (ii) multivariate dynamics (DCC/BEKK) and network methods to map cross-sector spillovers, (iii) macro-financial linkages that relate sectoral persistence to remittances, tourist arrivals, energy prices, exchange rates, and regional risk, (iv) recovery as a duration outcome via hazard/survival models (handling censoring and competing risks) linked to persistence and policy interventions, (v) microstructure and ownership channels using Amihud illiquidity, turnover, free float, and concentration data, (vi) realized-volatility measures to sharpen shock timing and decay, and (vii) out-of-sample stress tests using new shocks (e.g., energy spikes or trade disruptions) and cross-market comparisons within MENA.
For asset managers operating in Jordan and analogous markets, the evidence supports dynamic sector tilts and volatility-aware position sizing. Portfolios should rotate away from the sectors that historically top the persistence rankings for a given shock type, financials during credit stress, tourism and transport during mobility shocks, and lean toward defensives such as pharmaceuticals and medical industries, food and beverages, and utilities when appropriate.
Sizing decisions should reflect not only contemporaneous volatility but also the estimated HL and expected time-to-recovery: a sector with (α + β) near 0.98 warrants smaller and more tactical exposure than one near 0.85. Scenario design should differentiate between financial, mobility, geopolitical, and energy shocks, with stress tests calibrated to the persistence trajectories observed in the three episodes studied. Where feasible, high-persistence sector exposures can be paired with cross-hedges or option overlays to mitigate tail risk.
We check three diagnostics per model: (1) Ljung–Box tests on standardized residuals and on their squares (lags 10 and 20), (2) Engle’s ARCH-LM at multiple lags, and (3) a within-crisis rolling stability check for α, β, and α + β (HL). These diagnostics inform robustness and document model adequacy for each sector–crisis fit. However, several extensions can deepen and broaden the analysis. On the modeling side, EGARCH or TGARCH with Student’s t errors, IGARCH or FIGARCH for long memory, Markov-switching or stochastic volatility for regime changes, and state-space estimates of time-varying persistence would add flexibility. Multivariate dynamics using DCC or BEKK specifications could capture co-volatility and sector contagion, while network approaches might identify shock transmission paths. A macro-financial layer that links (α + β) to remittances, arrivals, energy prices, exchange rates, and regional risk would help map the drivers of persistence. Recovery could be studied as a duration outcome with formal hazard or survival models, handling censoring and competing risks and linking hazard rates to persistence and policy interventions.
Microstructure and ownership data, such as Amihud illiquidity, turnover, free float, and ownership concentration, would allow direct tests of the channels behind elevated persistence. Where feasible, realized-volatility evidence could sharpen identification of shock timing and decay dynamics, and out-of-sample stress tests using new shocks (for example, energy spikes or trade disruptions) would help assess external validity and refine the crisis-type taxonomy.
Our results align with international and regional evidence while highlighting Emerging Market-specific amplification. In credit-driven crises (GFC), financials anchor volatility and persistence; in pandemic shocks, mobility-sensitive industries (airlines, tourism, hospitality, transportation) bear the brunt; during MENA-style unrest, political-uncertainty and trade-route disruptions concentrate stress in tourism and transport. Relative to deep developed markets, the ASE’s thinner liquidity, free-float limits, and concentrated ownership plausibly magnify persistence and lengthen drawdowns. Against this backdrop we document (H1) sizable cross-sector heterogeneity in persistence, (H2) systematic re-ordering of sector ranks across crises, and (H3) a tight mapping from persistence (GARCH HL) to calendar-time recovery. These comparisons situate Jordan within the wider literature and point to targeted buffers for systemically central sectors and stabilization tools for travel-exposed industries.
This paper provides a sector-resolved resilience map for Jordan’s equity market across three distinct crises and demonstrates that volatility persistence is a practical, interpretable proxy for resilience with direct relevance to policy and portfolio decisions. Because the most fragile sector depends on the nature of the shock, resilience-building is not a one-size-fits-all exercise. For regulators, the implication is to pre commit to sector-specific playbooks informed by persistence thresholds; for investors, it is to align sector exposures with the shock type and the empirically observed HL of volatility. As emerging markets navigate an era of overlapping global and regional risks, frameworks that are granular, data-driven, and crisis-type aware, such as the one advanced here, can improve preparedness, reduce the duration of instability, and support a quicker return to orderly market functioning.
Funding
This research received no external funding.
Data Availability Statement
The data that support the findings of this study are publicly available from Amman Stock Exchange website through the link: https://www.ase.com.jo/en (accessed on 16 August 2025). All figures and tables are programmatically generated (Python/R) from the cleaned ASE sector index dataset.
Acknowledgments
The author used Generative AI (GPT-5, 2025) for the purposes of generating figures only, during the preparation of this manuscript. The authors have reviewed the outputs and take full responsibility for the content of this publication.
Conflicts of Interest
The author declares no conflicts of interest.
Abbreviations
The following abbreviations are used in this manuscript:
| AIC | Akaike Information Criterion |
| ARCH | Autoregressive Conditional Heteroskedasticity |
| ARMA | Autoregressive Moving Average |
| ASE | Amman Stock Exchange |
| BEKK | Baba–Engle–Kraft–Kroner |
| BIC | Bayesian Information Criterion |
| CPI | Consumer Price Index |
| COVID-19 | Coronavirus Disease 2019 |
| DCC | Dynamic Conditional Correlation |
| EGARCH | Exponential GARCH |
| FIGARCH | Fractionally Integrated GARCH |
| GARCH | Generalized ARCH |
| GFC | Global Financial Crisis |
| GJR-GARCH | Threshold-type GARCH by Glosten–Jagannathan–Runkle |
| TARCH | Threshold ARCH |
| GDP | Gross Domestic Product |
| IGARCH | Integrated GARCH |
| MLE | Maximum Likelihood Estimation |
| MENA | Middle East and North Africa |
| RMS2 | Real Money Supply |
| U.S. | United States |
References
- Aggarwal, Reena, Carla Inclan, and Ricardo Leal. 1999. Volatility in emerging stock markets. Journal of financial and Quantitative Analysis 34: 33–55. [Google Scholar] [CrossRef]
- Al-Dmour, Ahmed, Hala Zaidan, and Abdulrahman Alnatour. 2020. The Usefulness of Analysts’ Target Prices to Foreign Institutional Investors: US Evidence. Australasian Accounting, Business and Finance Journal 14: 42–64. [Google Scholar] [CrossRef]
- Al Khouri, Riad, and Emily Silcock. 2021. Oil and turmoil: Jordan’s adjustment challenges amid local and regional change. In Oil and the Political Economy in the Middle East. Manchester: Manchester University Press, pp. 192–212. [Google Scholar]
- Al-Omoush, Khaled Saleh, Samuel Ribeiro-Navarrete, Carlos Lassala, and Marinko Skare. 2022. Networking and knowledge creation: Social capital and collaborative innovation in responding to the COVID-19 crisis. Journal of Innovation & Knowledge 7: 100181. [Google Scholar] [CrossRef]
- Alqtish, Atala, and Bilal Abdulal. 2021. The Effect of Accounting of Exchange Rate Fluctuations in the Light of Syrian Crisis of The Results of Financial Statements of Private Banks in Syria. Academy of Accounting and Financial Studies Journal 25: 1–28. [Google Scholar]
- Al-Raimony, Ahmed Diab, and Hasan Mohammed El-Nader. 2012. The sources of stock market volatility in Jordan. International Journal of Economics and Finance 4: 108–21. [Google Scholar] [CrossRef]
- Al-Rjoub, Samer, and Hussam Azzam. 2012. Financial crises, stock returns and volatility in an emerging stock market: The case of Jordan. Journal of Economic Studies 39: 178–211. [Google Scholar] [CrossRef]
- Al-Shoukeirat, Rasmi. 2016. The Impact of the Arab Spring on the Jordanian Political Reform Process. Doctoral dissertation, Cardiff Metropolitan University, Cardiff, UK. [Google Scholar]
- Alsmadi, Ayman Abdalmajeed, Ahmed Shuhaiber, Manaf Al-Okaily, Anwar Al-Gasaymeh, and Najed Alrawashdeh. 2023. Big data analytics and innovation in e-commerce: Current insights and future directions. Journal of Financial Services Marketing 1: 1–18. [Google Scholar] [CrossRef]
- Andersen, Torben, Tim Bollerslev, Francis. Diebold, and Paul Labys. 2003. Modeling and Forecasting Realized Volatility. Econometrica 71: 579–625. [Google Scholar] [CrossRef]
- Andersen, Torben Gustav, and Luca Benzoni. 2008. Realized Volatility, Working Paper 2008-14. Available online: https://fraser.stlouisfed.org/files/docs/historical/frbchi/workingpapers/frbchi_workingpaper_2008-14.pdf (accessed on 16 August 2025).
- Bashar, Omar, and Debdulal Mallick. 2021. Frequency of Shocks, Resilience and Shock Persistence: Evidence from Natural Disasters. Available online: https://mpra.ub.uni-muenchen.de/id/eprint/107517 (accessed on 16 August 2025).
- Bollerslev, Tim. 1986. Generalized Autoregressive Conditional Heteroskedasticity. Journal of Econometrics 31: 307–27. [Google Scholar] [CrossRef]
- Bruneau, Michel, Stephanie E. Chang, Ronald T. Eguchi, George C. Lee, Thomas D. O’Rourke, Andrei M. Reinhorn, Masanobu Shinozuka, Kathleen Tierney, William A. Wallace, and Detlof Von Winterfeldt. 2003. A framework to quantitatively assess and enhance the seismic resilience of communities. Earthquake Spectra 19: 733–52. [Google Scholar] [CrossRef]
- Choudhry, Taufiq. 1996. Stock market volatility and the crash of 1987: Evidence from six emerging markets. Journal of International Money and Finance 15: 969–81. [Google Scholar] [CrossRef]
- Colon, C., and S. Hochrainer-Stigler. 2023. Systemic risks in supply chains: A need for system-level governance. Supply Chain Management: An International Journal 28: 682–94. [Google Scholar] [CrossRef]
- Didier, Tatiana, Constantino Hevia, and Sergio L. Schmukler. 2013. How resilient and countercyclical were emerging economies during the global financial crisis? Journal of International Money and Finance 31: 2052–77. [Google Scholar] [CrossRef]
- Elkahlout, Ghassan, and Alaa Hadid. 2021. Stable Jordan: How A monarchy survived disorder. Asian Affairs 52: 852–71. [Google Scholar] [CrossRef]
- Engle, Robert F. 1982. Autoregressive Conditional Heteroskedasticity with Estimates of the Variance of United Kingdom Inflation. Econometrica 50: 987–1007. [Google Scholar] [CrossRef]
- Enow, Samuel Tabot. 2023. Exploring volatility clustering financial markets and its implication. Journal of Economic and Social Development Resilient Society 10: 81–85. [Google Scholar]
- Ghorbel, Ahmed, Mohamed Fakhfekh, Ahmed Jeribi, and Amine Lahiani. 2022. Extreme dependence and risk spillover across G7 and China stock markets before and during the COVID-19 period. The Journal of Risk Finance 23: 206–44. [Google Scholar] [CrossRef]
- Glosten, Lawrence R., Ravi Jagannathan, and David E. Runkle. 1993. On the relation between the expected value and the volatility of the nominal excess return on stocks. The Journal of Finance 48: 1779–801. [Google Scholar] [CrossRef]
- Hammoudeh, Shawkat, and Huimin Li. 2008. Sudden changes in volatility in emerging markets: The case of Gulf Arab stock markets. International Review of Financial Analysis 17: 47–63. [Google Scholar] [CrossRef]
- Holling, Crawford S. 1973. Resilience and stability of ecological systems. Annual Review of Ecology and Systematics 4: 1–23. [Google Scholar] [CrossRef]
- Istaiteyeh, Rasha. 2024. Short-and Long-run Influence of COVID-19 on Jordan’s Economy. Advances in Management and Applied Economics 14: 1–29. [Google Scholar] [CrossRef]
- Karanasos, Menelaos, Stavroula Yfanti, and John Hunter. 2022. Emerging stock market volatility and economic fundamentals: The importance of US uncertainty spillovers, financial and health crises. Annals of Operations Research 313: 1077–116. [Google Scholar] [CrossRef]
- Khasawneh, Ohoud Abdel Hafiez. 2017. Noise trading in small markets: Evidence from Amman Stock Exchange (ASE). Research in International Business and Finance 42: 422–28. [Google Scholar] [CrossRef]
- Khwaileh, Khaled Mohammad. 2025. Jordan’s Attempts in Promoting Economic and Political Integration within the Arab Region. Arab Law Quarterly 1: 1–24. [Google Scholar] [CrossRef]
- Longstaff, Francis A. 2010. The subprime credit crisis and contagion in financial markets. Journal of Financial Economics 97: 436–50. [Google Scholar] [CrossRef]
- Maddodi, Srivatsa, and Srinivasa Rao Kunte. 2024. Market resilience in turbulent times: A proactive approach to predicting stock market responses during geopolitical tensions. Journal of Capital Markets Studies 8: 173–94. [Google Scholar] [CrossRef]
- Naisbitt, Barry, Janine Boshoff, Dawn Holland, Ian Hurst, Amit Kara, Iana Liadze, Corrado Macchiarelli, Xuxin Mao, Patricia Sanchez Juanino, Craig Thamotheram, and et al. 2020. The world economy: Global outlook overview. National Institute Economic Review 253: F35–F88. [Google Scholar] [CrossRef]
- Nelson, Daniel B. Conditional heteroskedasticity in asset returns: A new approach. Econometrica: Journal of the Econometric Society 59: 347–70.
- Newsome, Bruce. 2013. A practical Introduction to Security and Risk Management. Thousand Oaks: Sage Publications. [Google Scholar]
- Ozatay, Fatih, and Guven Sak. 2002. Banking sector fragility and Turkey’s 2000-01 financial crisis. In Brookings Trade Forum. Washington, DC: Brookings Institution Press, vol. 2002, pp. 121–60. [Google Scholar]
- Patel, Sandeep A., and Asani Sarkar. 1998. Crises in developed and emerging stock markets. Financial Analysts Journal 54: 50–61. [Google Scholar] [CrossRef]
- Peer, Ubaid Ahmad, Rupinder Katoch, and Arpit Sidhu. 2025. Dynamics of Volatility Spillovers: Evidence from Implied Volatility Indexes to Conventional and Green Equities in the Indian Context. Southeast Asian Journal of Economics 13: 65–97. [Google Scholar]
- Qabajeh, Majed, Almajali Dmaithan, Al Natour Abdul Rahman, Alqsass Mohammad, and Maali Hakam. 2023. The impact of operational risk on profitability: Evidence from banking sector in the MENA region. Uncertain Supply Chain Management 11: 1459–66. [Google Scholar] [CrossRef]
- Reinhart, Carmen, and Vincent Reinhart. 2020. The pandemic depression. Foreign Affairs 99: 84–95. [Google Scholar] [CrossRef]
- Sabatino, Michele. 2016. Economic crisis and resilience: Resilient capacity and competitiveness of the enterprises. Journal of Business Research 69: 1924–27. [Google Scholar] [CrossRef]
- Saqfalhait, Nahil Ismail, and Omar Mohammad Alzoubi. 2024. The Impact of COVID-19 Pandemic on the Jordanian Stock Market Returns Volatility: Evidence from ASE20. Economies 12: 238. [Google Scholar] [CrossRef]
- Schwert, G. William. 1990. Stock volatility and the crash of ’87. Review of Financial Studies 3: 77–102. [Google Scholar] [CrossRef]
- Siddiqui, Nida, and Haslifah Mohamad Hasim. 2024. Risk contagion of COVID-19 to oil prices: A Markov switching GARCH and PCA approach. PLoS ONE 19: e0312718. [Google Scholar] [CrossRef]
- Sun, Pengfei, and Chen Zhou. 2014. Diagnosing the distribution of GARCH innovations. Journal of Empirical Finance 29: 287–303. [Google Scholar] [CrossRef]
- Wise, Carol, Leslie Elliott Armijo, and Saori N. Katada, eds. 2015. Unexpected Outcomes: How Emerging Economies Survived the Global Financial Crisis. Washington, DC: Brookings Institution Press. [Google Scholar]
- Yassin, Mohammed M., Osama Samih Shaban, Dea’A. Al-Deen Al-Sraheen, and Khaldoon Ahmad Al Daoud. 2022. Revenue standard and earnings management during the COVID-19 pandemic: A comparison between IFRS and GAAP. Journal of Governance and Regulation 11: 80–93. [Google Scholar] [CrossRef]
- Zaidan, Hala, Hiba Abu Hijleh, Hamzah Al Mawali, Abdul Rahman Al Natour, and Manaf Al-Okaily. 2021. Influence of liquidity, solvency on banks’ profitability: The moderating role of net revenues. Paper present at the International Conference On Global Economic Revolutions, Sharjah, United Arab Emirates, September 15–16; Cham: Springer International Publishing, pp. 149–64. [Google Scholar]
- Zaidan, Hala, Omar Mowafi, Melina Al-Hasan, and Abdulrahman Al Natour. 2023. Resilience and adaptation: Examining the impact of the defense law on accounting and auditing professions during the COVID-19 pandemic in Jordan. Journal of Financial Reporting and Accounting. [Google Scholar] [CrossRef]
- Zakoian, Jean-Michel. 1994. Threshold heteroskedastic models. Journal of Economic Dynamics and Control 18: 931–55. [Google Scholar] [CrossRef]
Disclaimer/Publisher’s Note: The statements, opinions and data contained in all publications are solely those of the individual author(s) and contributor(s) and not of MDPI and/or the editor(s). MDPI and/or the editor(s) disclaim responsibility for any injury to people or property resulting from any ideas, methods, instructions or products referred to in the content. |
© 2025 by the author. Licensee MDPI, Basel, Switzerland. This article is an open access article distributed under the terms and conditions of the Creative Commons Attribution (CC BY) license (https://creativecommons.org/licenses/by/4.0/).