3.1. Preliminary Data Analysis
In this section, we provide an initial analysis of the most significant data collected from our bibliometric study on KPIs and KRIs in business. This analysis offers insights into the research landscape, highlighting the active and extensive community of researchers involved in this field. We explore the dynamics and impact of the research, underscoring a clear trend towards collaboration and internationalization. These findings offer a comprehensive view of the current state and future directions of research in KPIs and KRIs, emphasizing the importance of global cooperation in advancing knowledge and practices.
Table 1 provides an overview of the data analyzed in our bibliometric study. Thus, our analysis covers the years 1992–2023, reflecting over three decades of research. The total number of sources used, including journals, books, and other documents, is 760. The total number of documents analyzed is 1395. Additionally, we observe that the annual average growth rate of the number of documents is 17.67% and the average age of the documents is 7.41 years. Furthermore, each document has an average of 18.16 citations, and the total number of references cited in all documents is 58,511. These data indicate growing interest and robust academic production in the analyzed field, with a significant growth rate and a considerable number of citations, suggesting the relevance and influence of research on KPIs and KRIs in business.
Table 2 provides key information about the content of the documents analyzed in our bibliometric study. We observe that the total number of Keywords Plus used in the analyzed articles is 1789. These keywords are generated by databases to enhance searches and better reflect the content of the articles. Additionally, the total number of author’s keywords is 4317. These keywords reflect the main themes and subjects addressed in the articles, offering insight into the points of interest in KPI and KRI research. The large number of Keywords Plus and author’s keywords indicates significant thematic diversity in the studied literature. This suggests a comprehensive approach to topics related to KPIs and KRIs, highlighting the complexity and multidimensionality of research in this field.
Important details regarding the writers of the examined articles are shown in
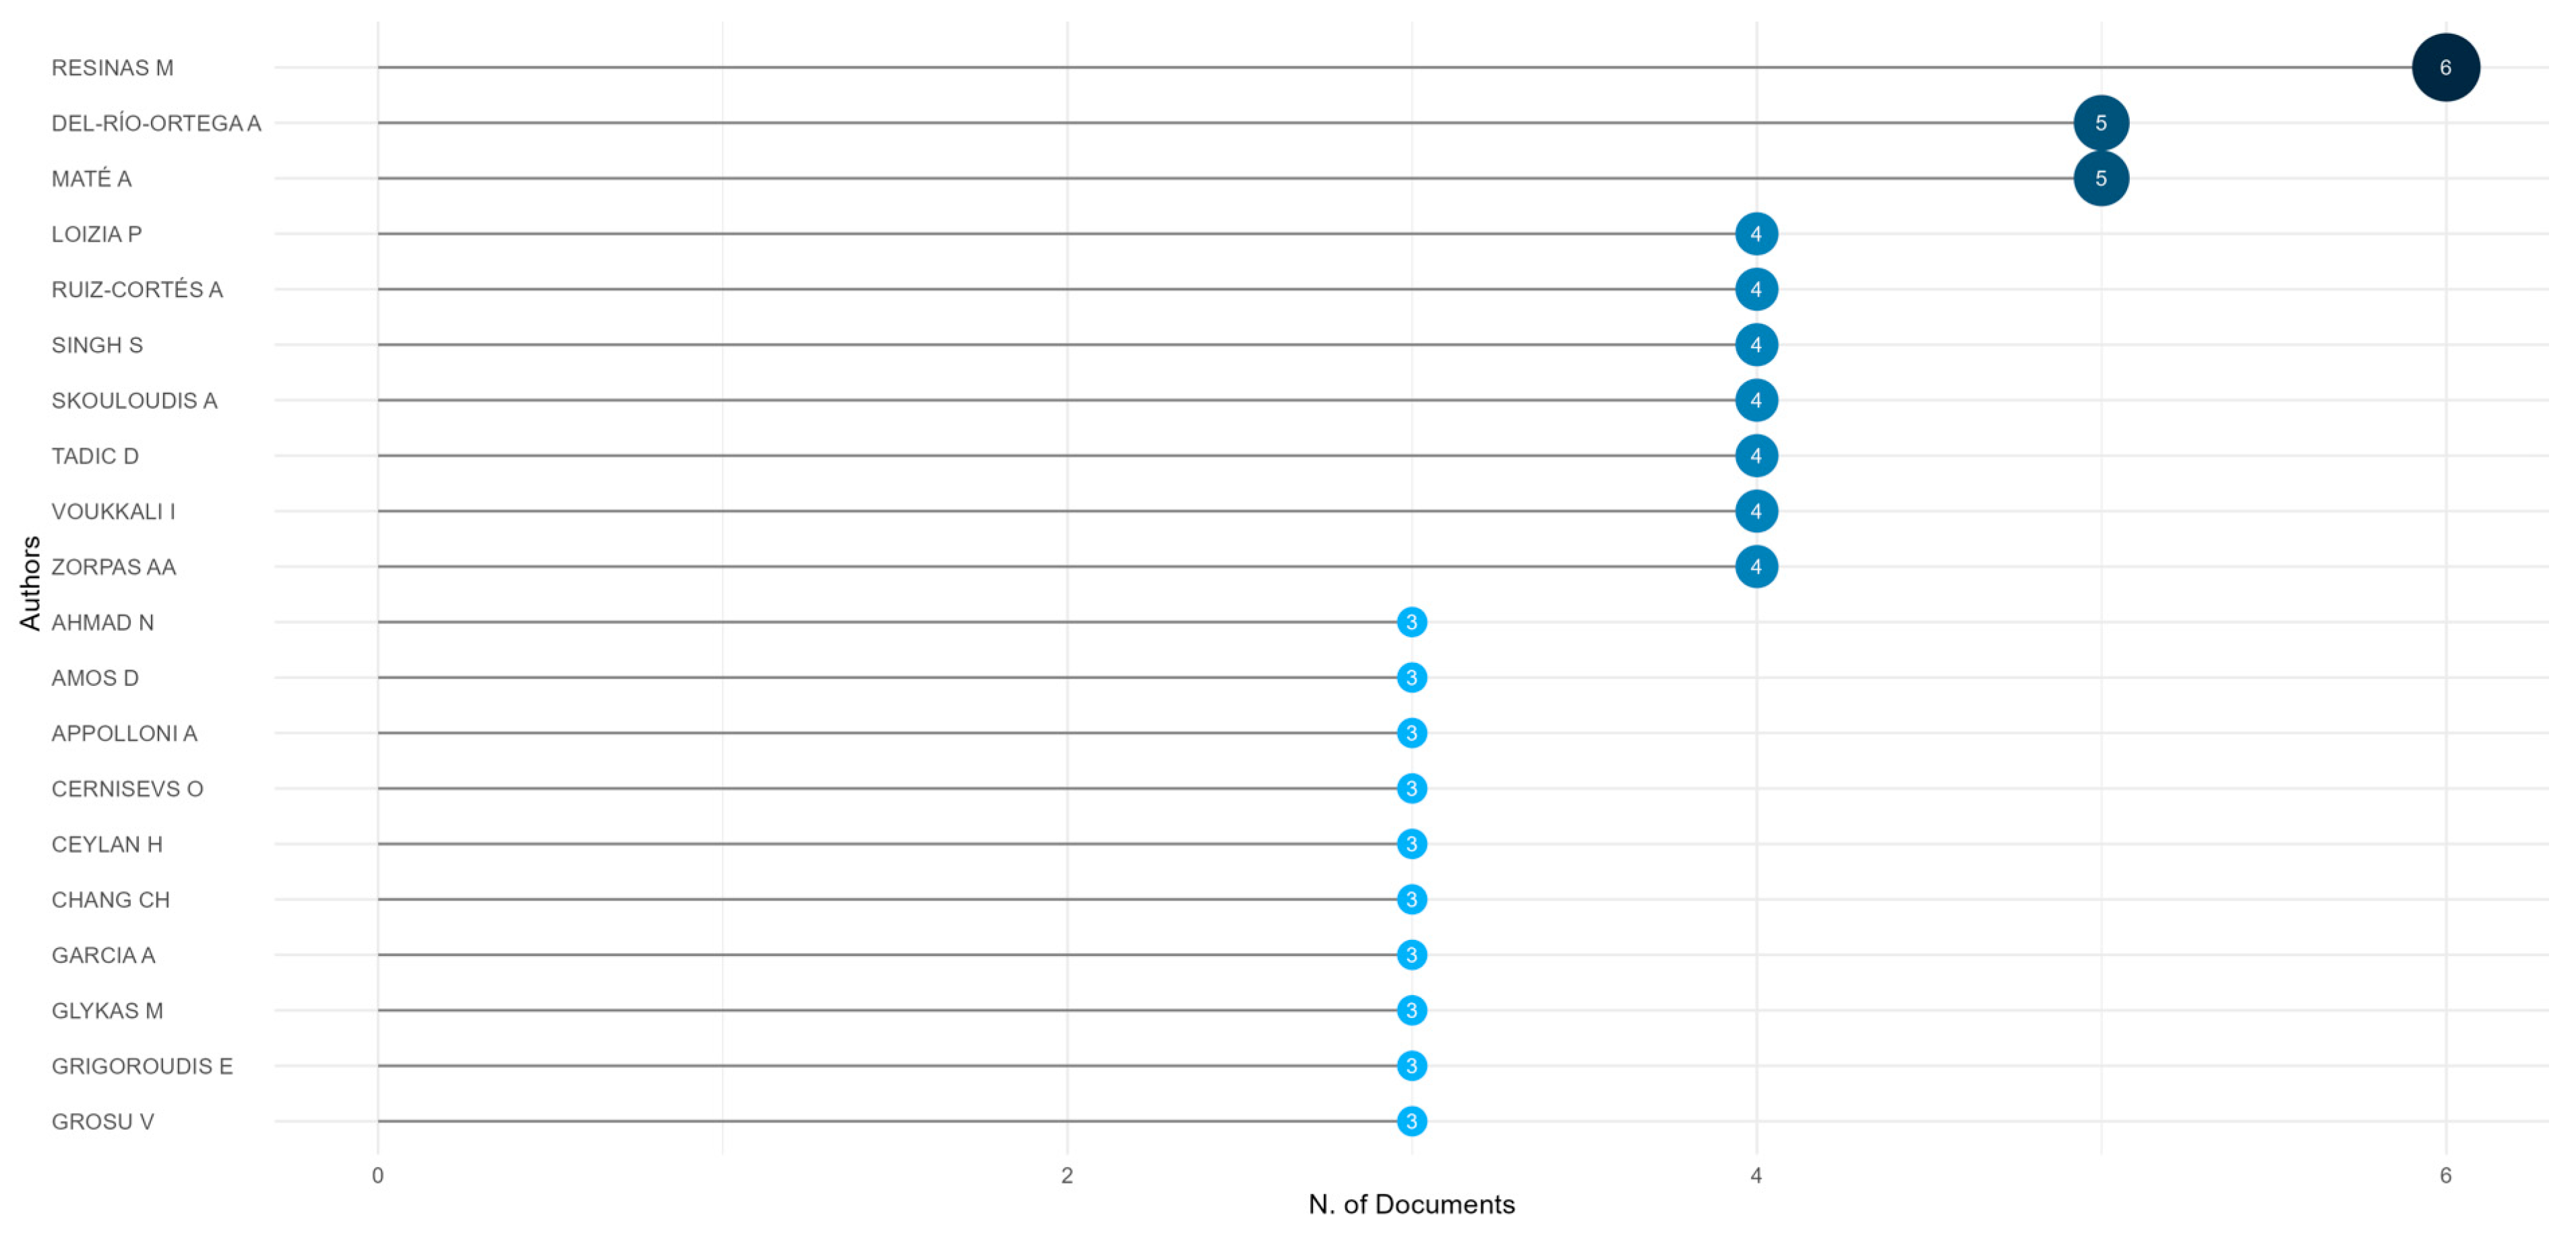
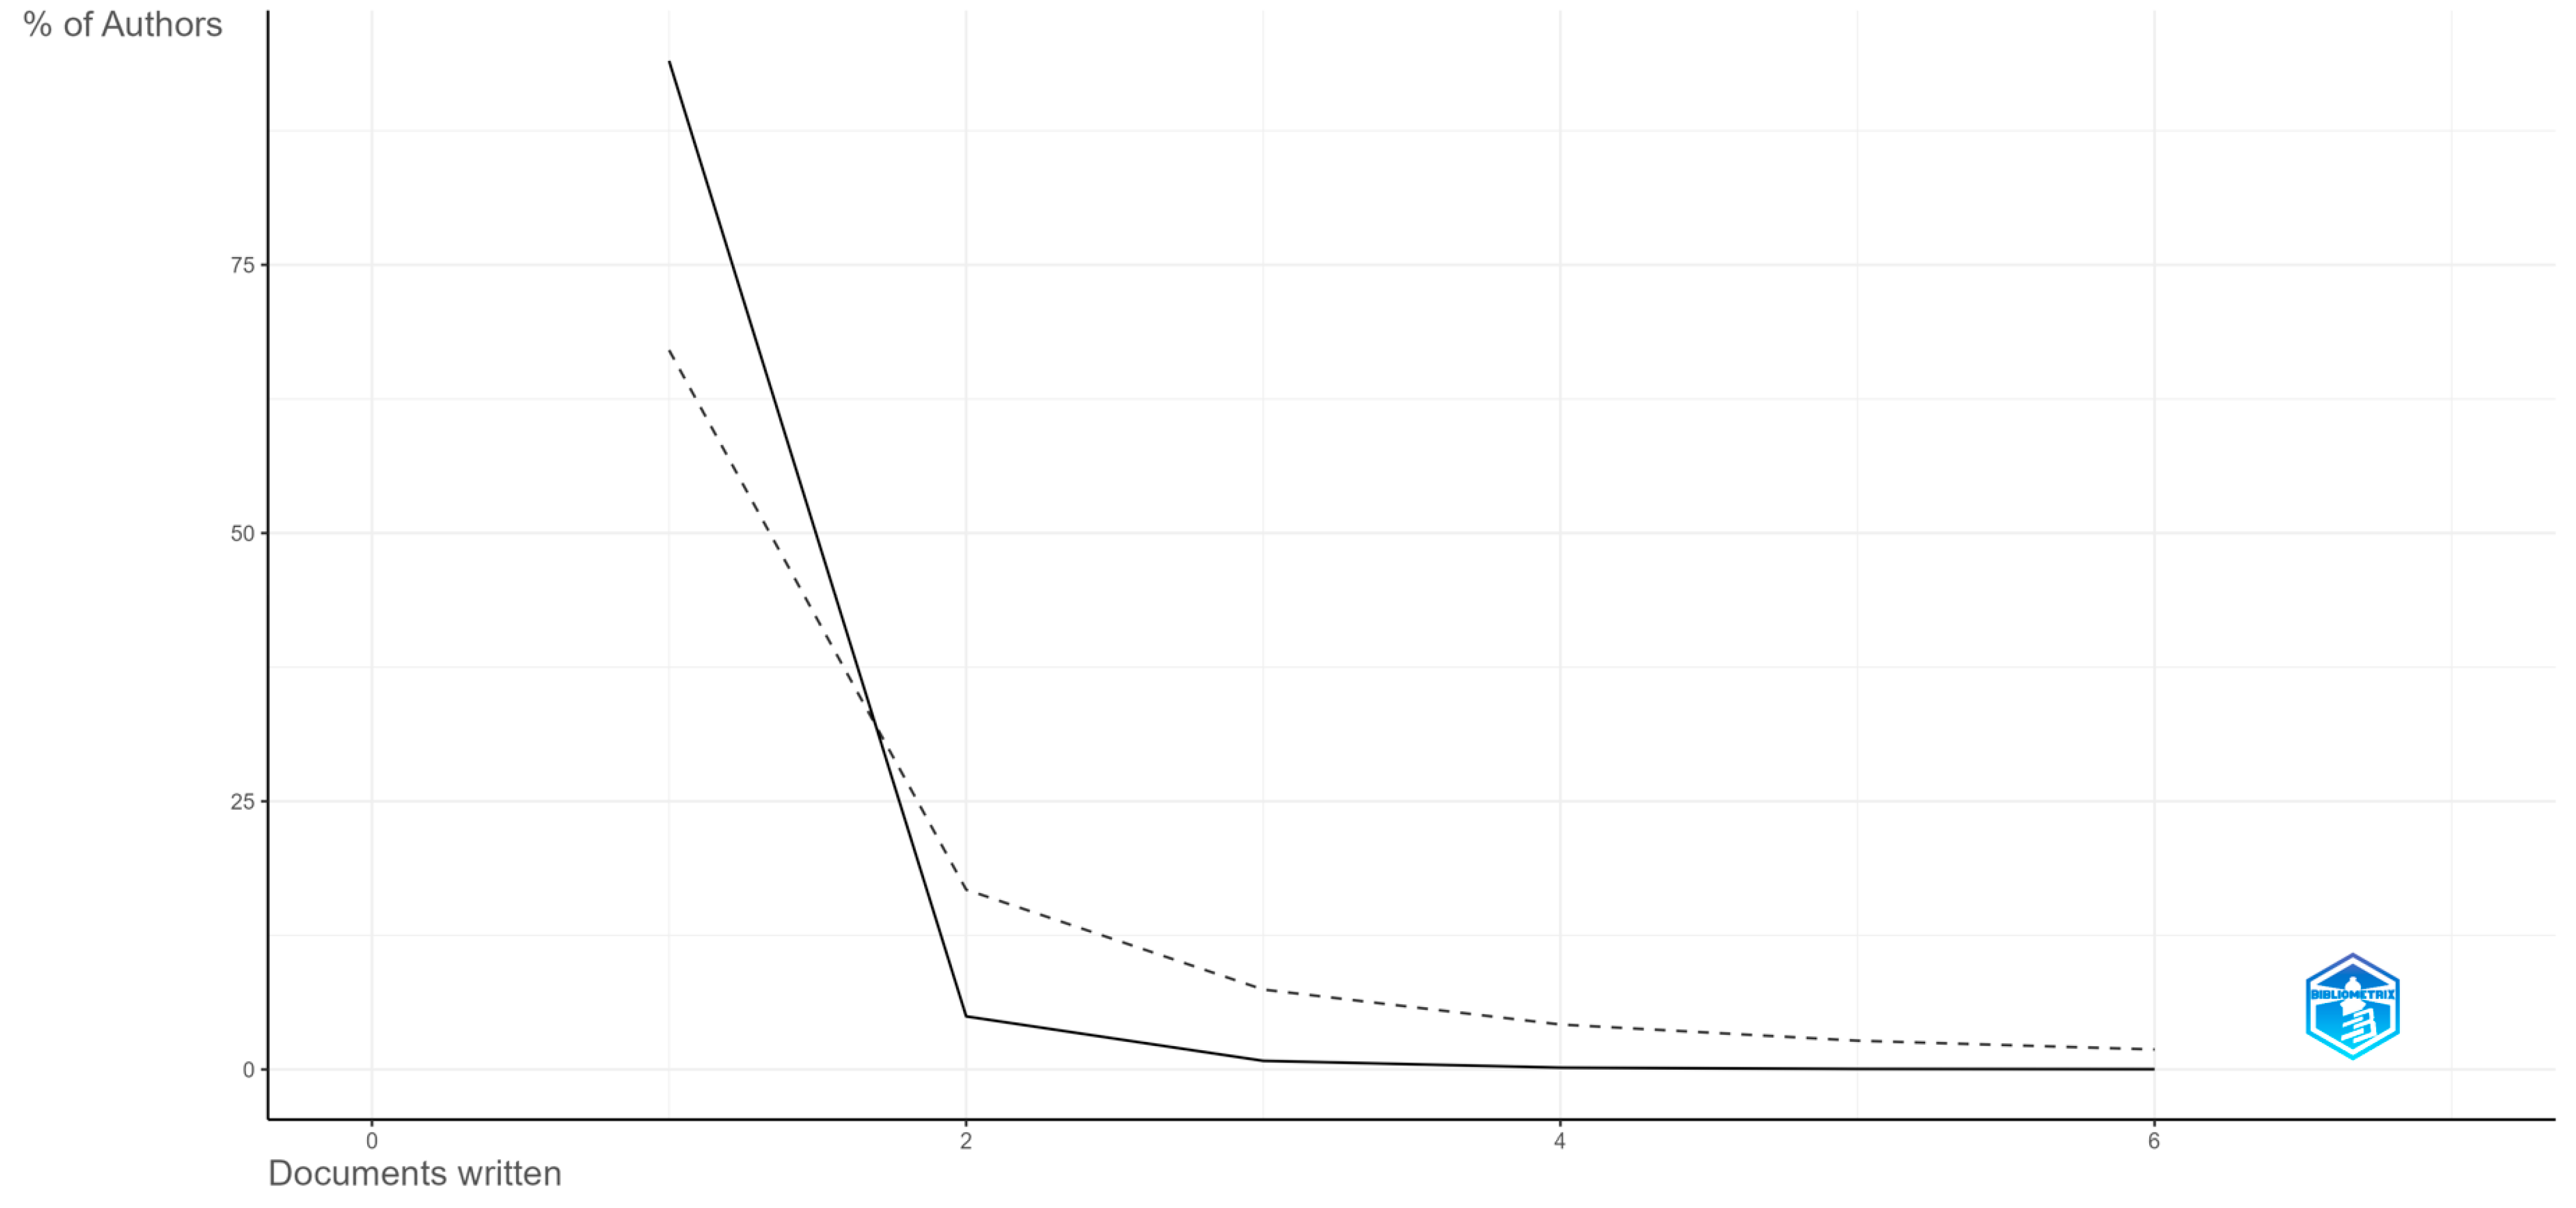
Table 3, as can be seen. There are 4094 authors in all who have contributed to the materials under analysis. This figure indicates the size of the community of active researchers in the subject of business KPIs and KRIs. Only 179 authors can claim to have authored articles. This implies that while there are a lot of collaborations in this sector, there is also a lot of interest in solitary study. The total number of authors as well as the number of single authors in the papers signal a vibrant and varied research community. The existence of both individual and collaborative efforts highlights the complexity and diversity of techniques in the study of KPIs and KRIs and advises a balance between cooperative and independent research.
The data from
Table 4 reflect a balance between individual and collaborative research, with a strong emphasis on international collaborations. There are 182 single-authored documents, indicating that while collaboration is prevalent, individual research holds significant importance in the field. On average, each document has 3.15 co-authors, highlighting a high level of collaboration among researchers. Additionally, 23.87% of the documents involve international collaborations. This high percentage underscores the importance of international cooperation in KPI and KRI research. This suggests that the field benefits from a global network of researchers working together to advance knowledge and practices.
Thus, regarding the preliminary analysis of the most important data, we observe that research on KPIs and KRIs in business is characterized by a vast and active community of researchers. All this information provides a complex picture of the dynamics and impact of research in the analyzed field, highlighting a clear trend towards collaboration and internationalization.
3.2. Research Output and Impact Analysis
In this section, we analyze key visualizations to better understand the research landscape for KPIs and KRIs in business. Specifically, we examine the annual scientific production, the average citation per year, and a three-field plot. These analyses provide insights into the evolution, impact, and interconnectedness of research in this domain.
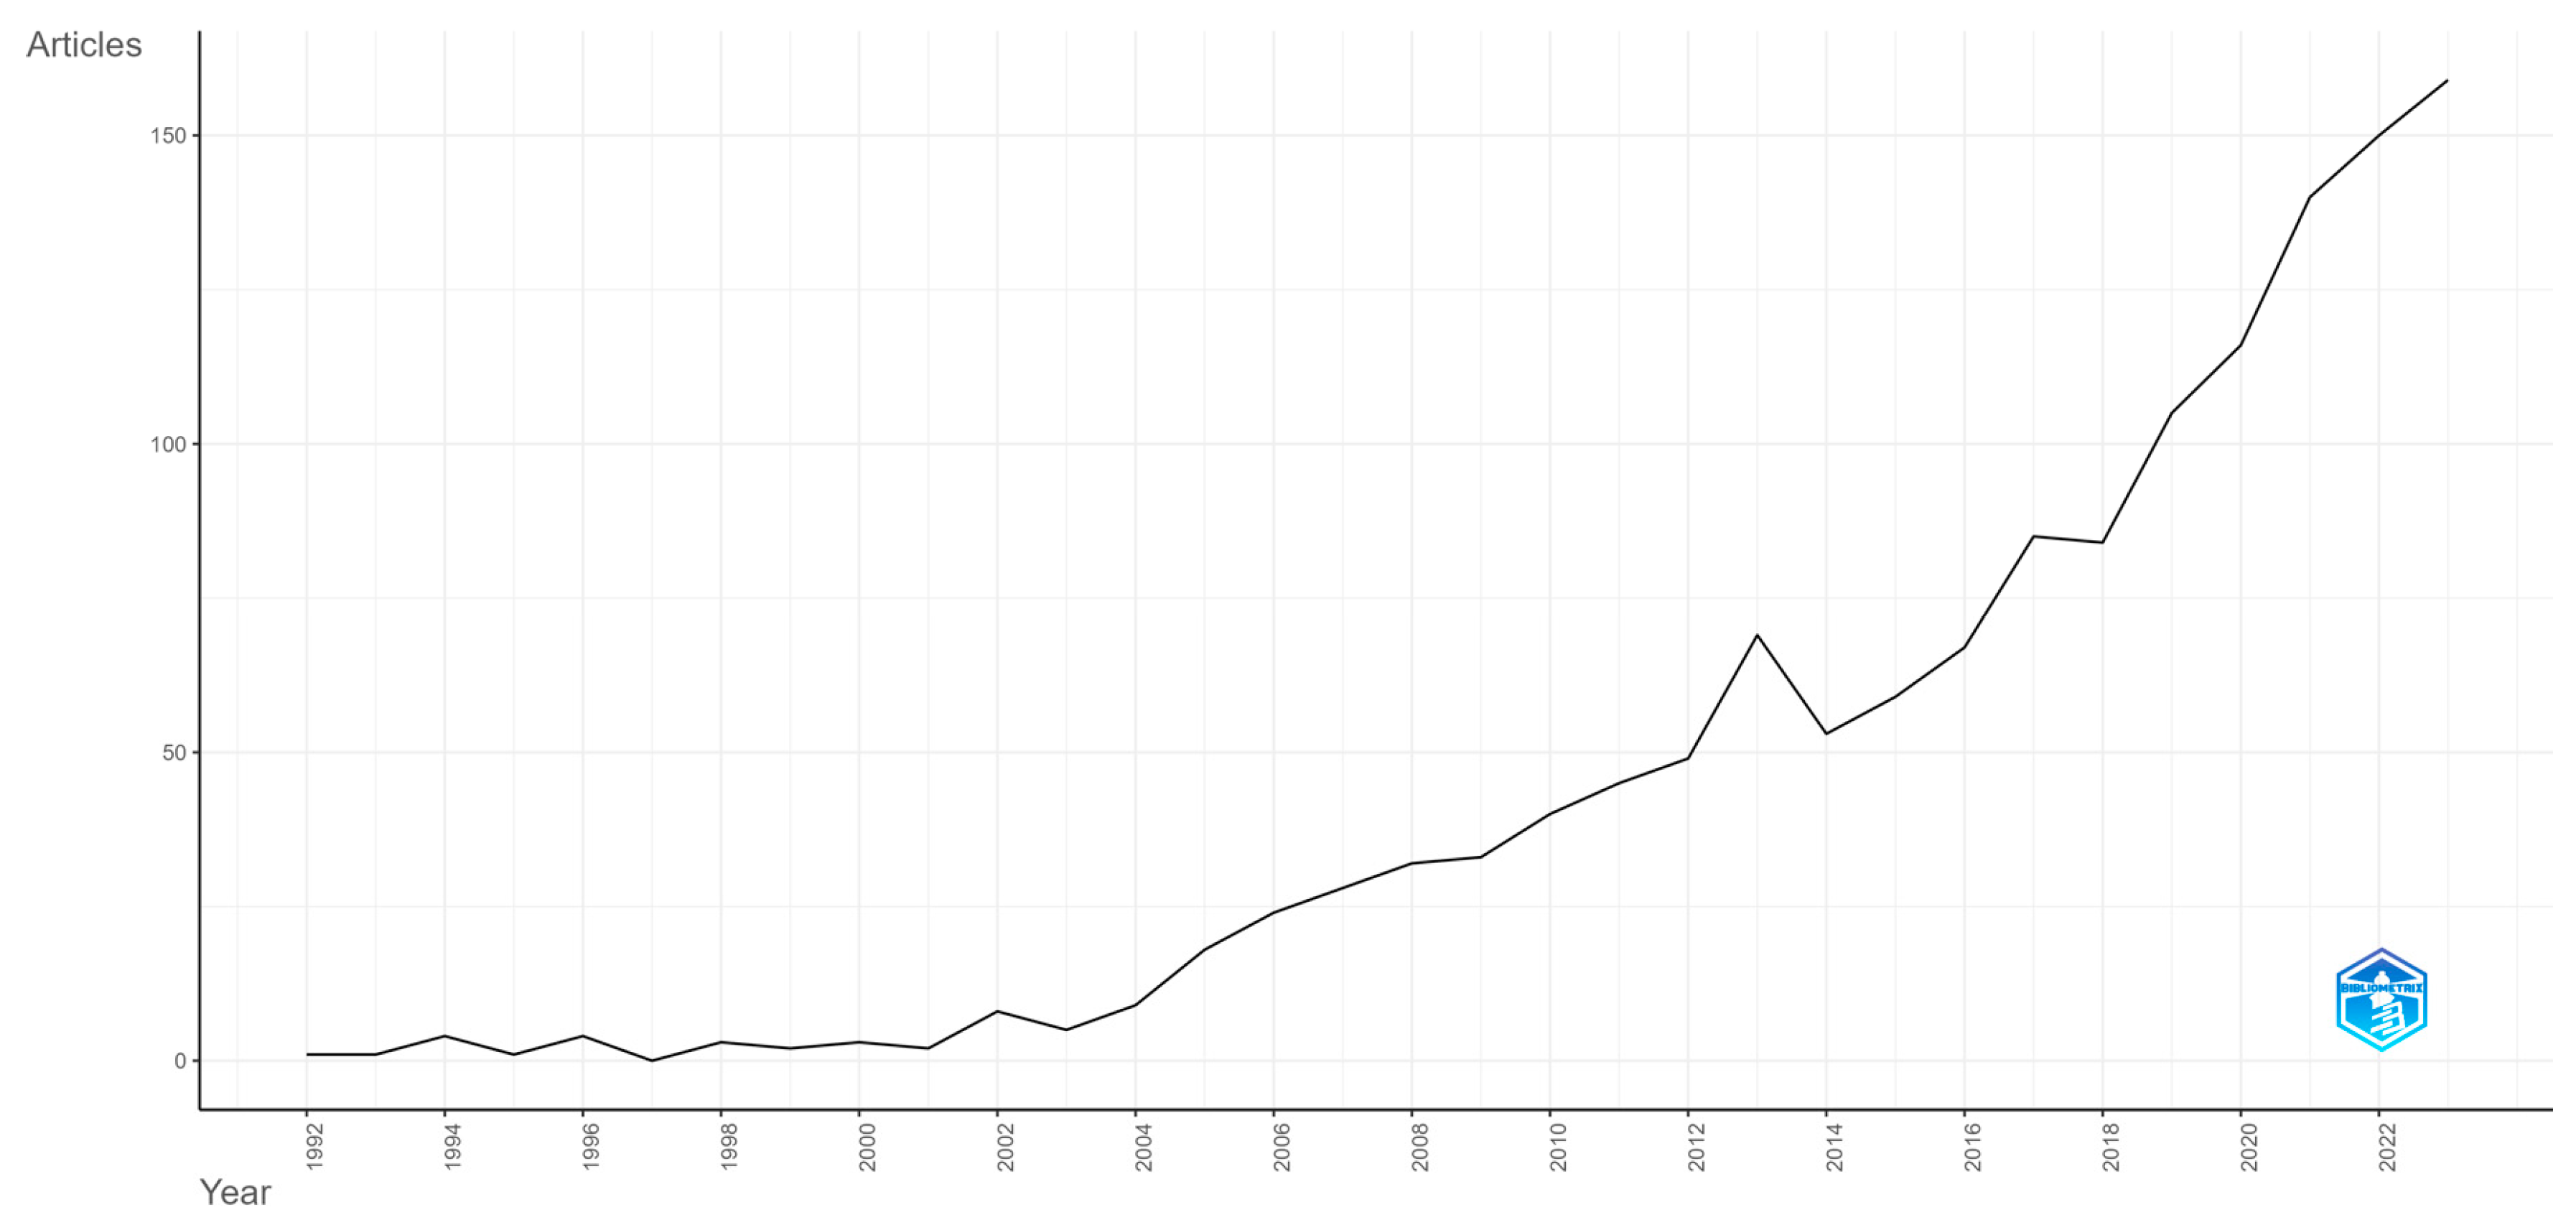
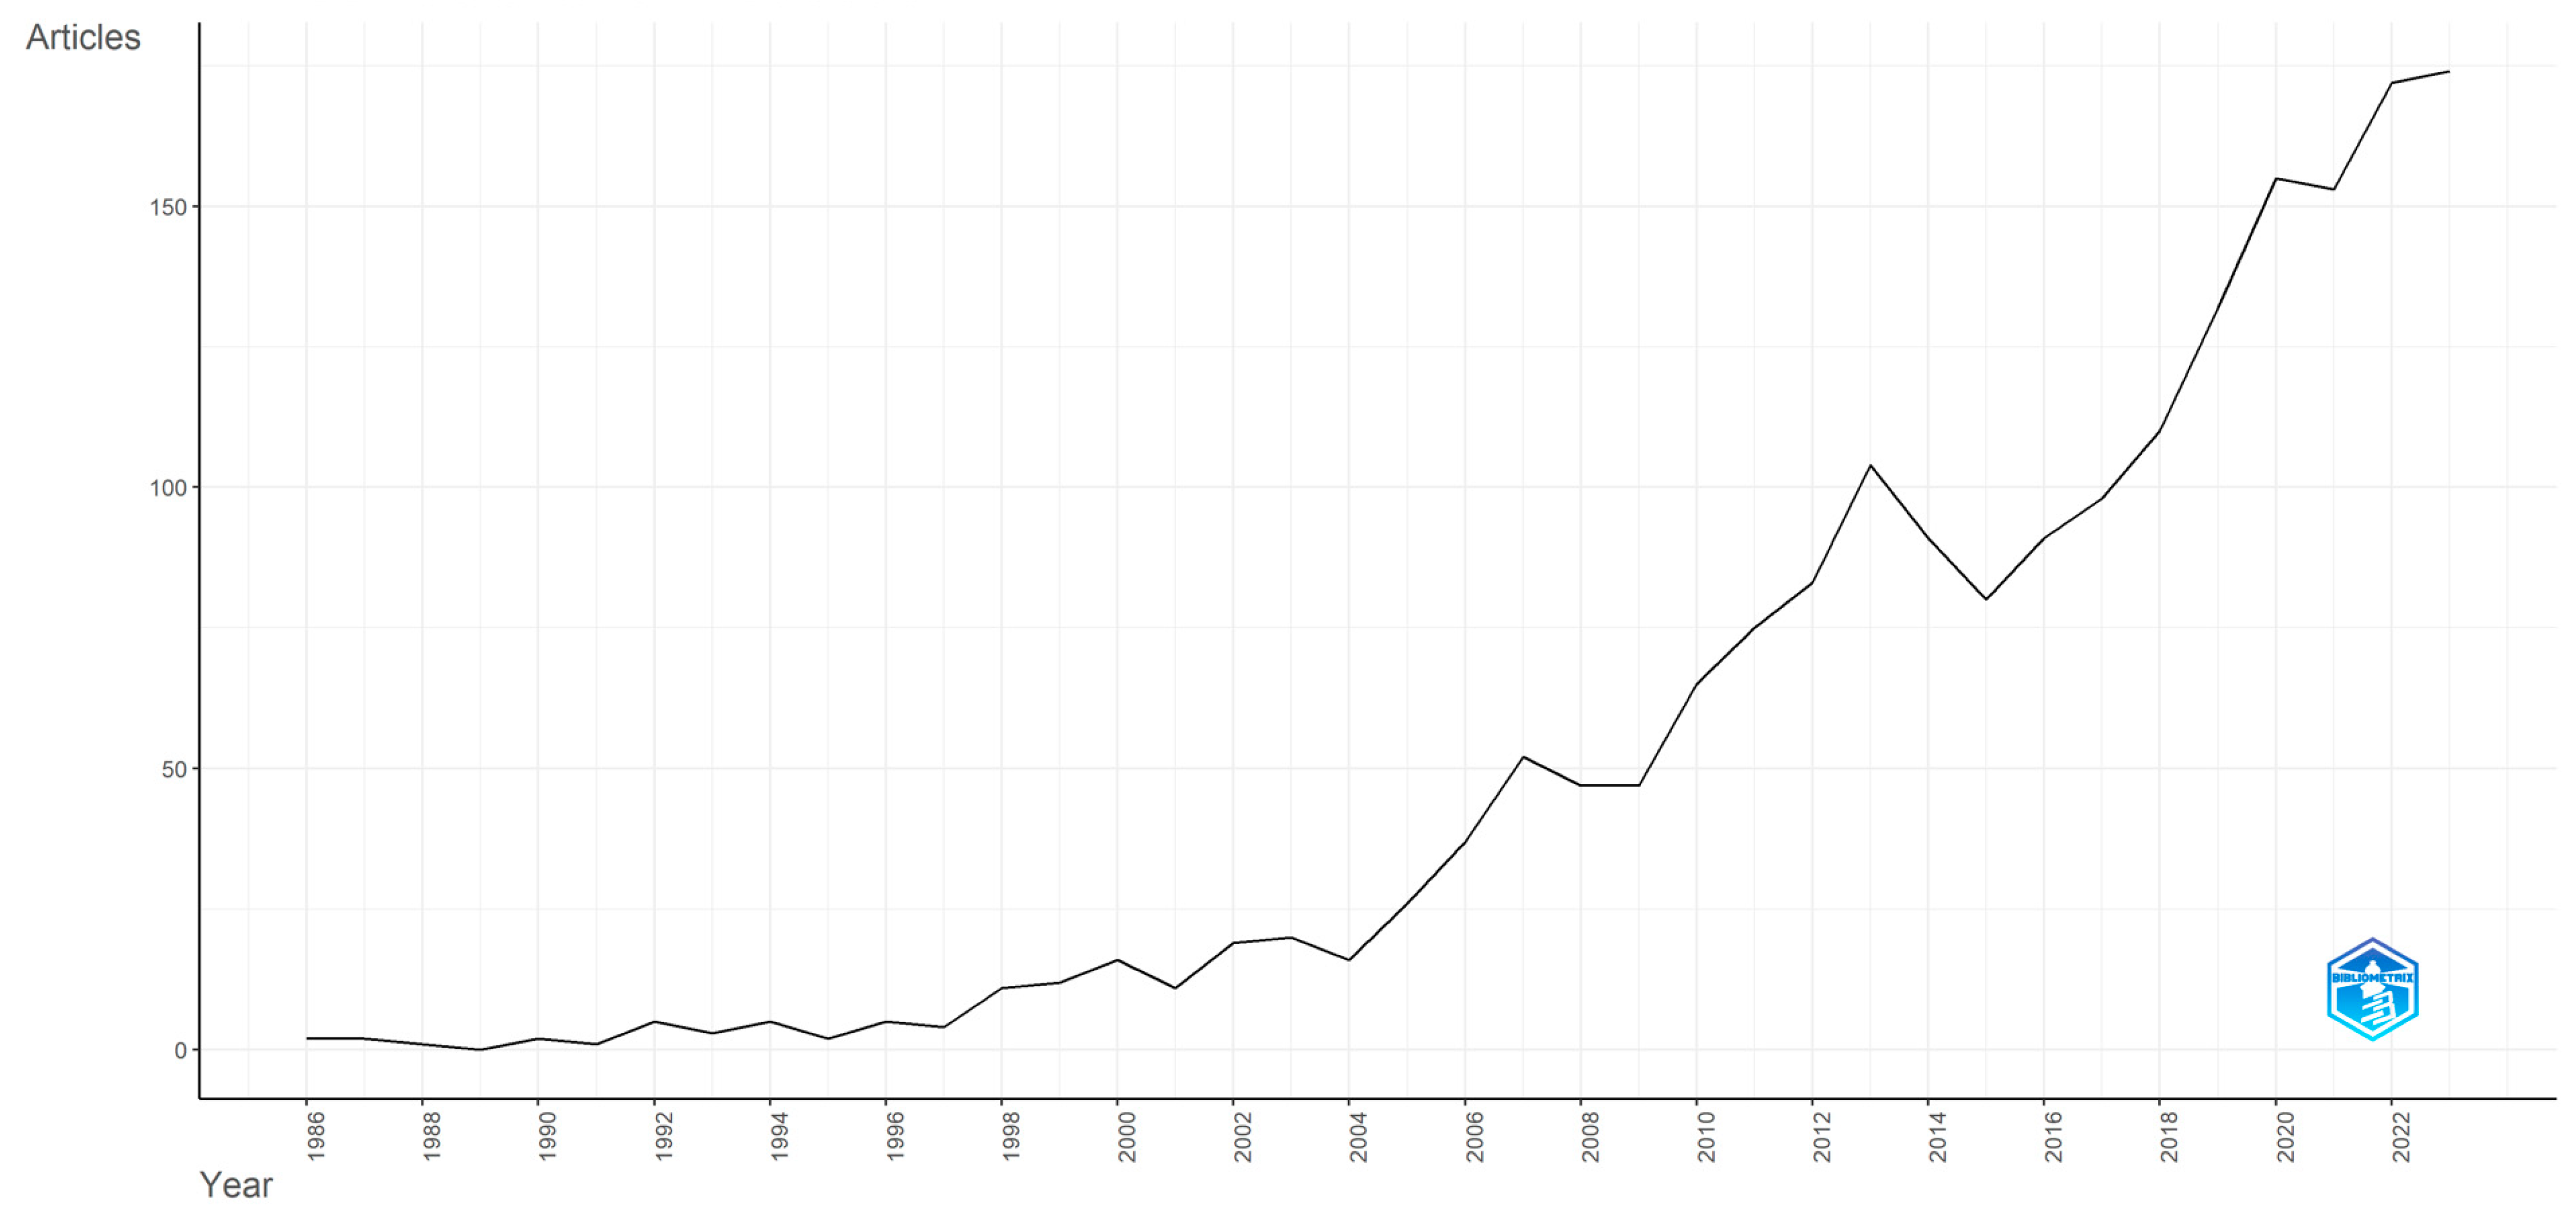
The scientific output for the considered time-period is highlighted with the help of
Figure 1. With regard to the number of articles that have been published annually, a slight fluctuation can be observed between 1992 and 2003, but this period contains only a few articles, ranging from 1 in 1992 to 8 in 2002. However, starting from 2004 onwards, significant interest in the subject’s matter took place, making the number of published articles range between 9 in 2004 and 159 in 2023, leading the trend to gradually increase over the years, most notably for the recent ones, registering a growth rate higher than the one in the late 2000s. This exponential growth for the recent years reflects that the researchers are more engaged and interested in the subject.
It can be observed in
Figure 2 that, throughout the considered period, there was very high fluctuation in the average citations, ranging from 0.1 to 3.9. From 1992 to 1998, the fluctuation was relatively small. Yet, 1999 registered a first peak in the trend with 3.5 citations, as companies began to think about risk indicators, considering the fact that specialists in the area of economics predicted the recession that was to come in the next year. However, in the following years, from 2000 to 2006, it is evident that interest in key performance indicators and key risk indicators decreased, compared to 1999, but still with fluctuations in this timeframe. Despite that, the year 2007 registered the trend’s second and highest peak, with 3.9 citations, as everyone was expecting the next year’s global economic crisis. For the remaining period, between 2008 and 2023, the number of citations still fluctuated, particularly for year 2011, when the global stock market crashed, and the year 2019, considering the start of the COVID-19 pandemic. Considering the dynamic of the average citations over the years, it is notable that the researchers’ interest in the analyzed field is strongly linked with expected major world events that may impact the global economy.
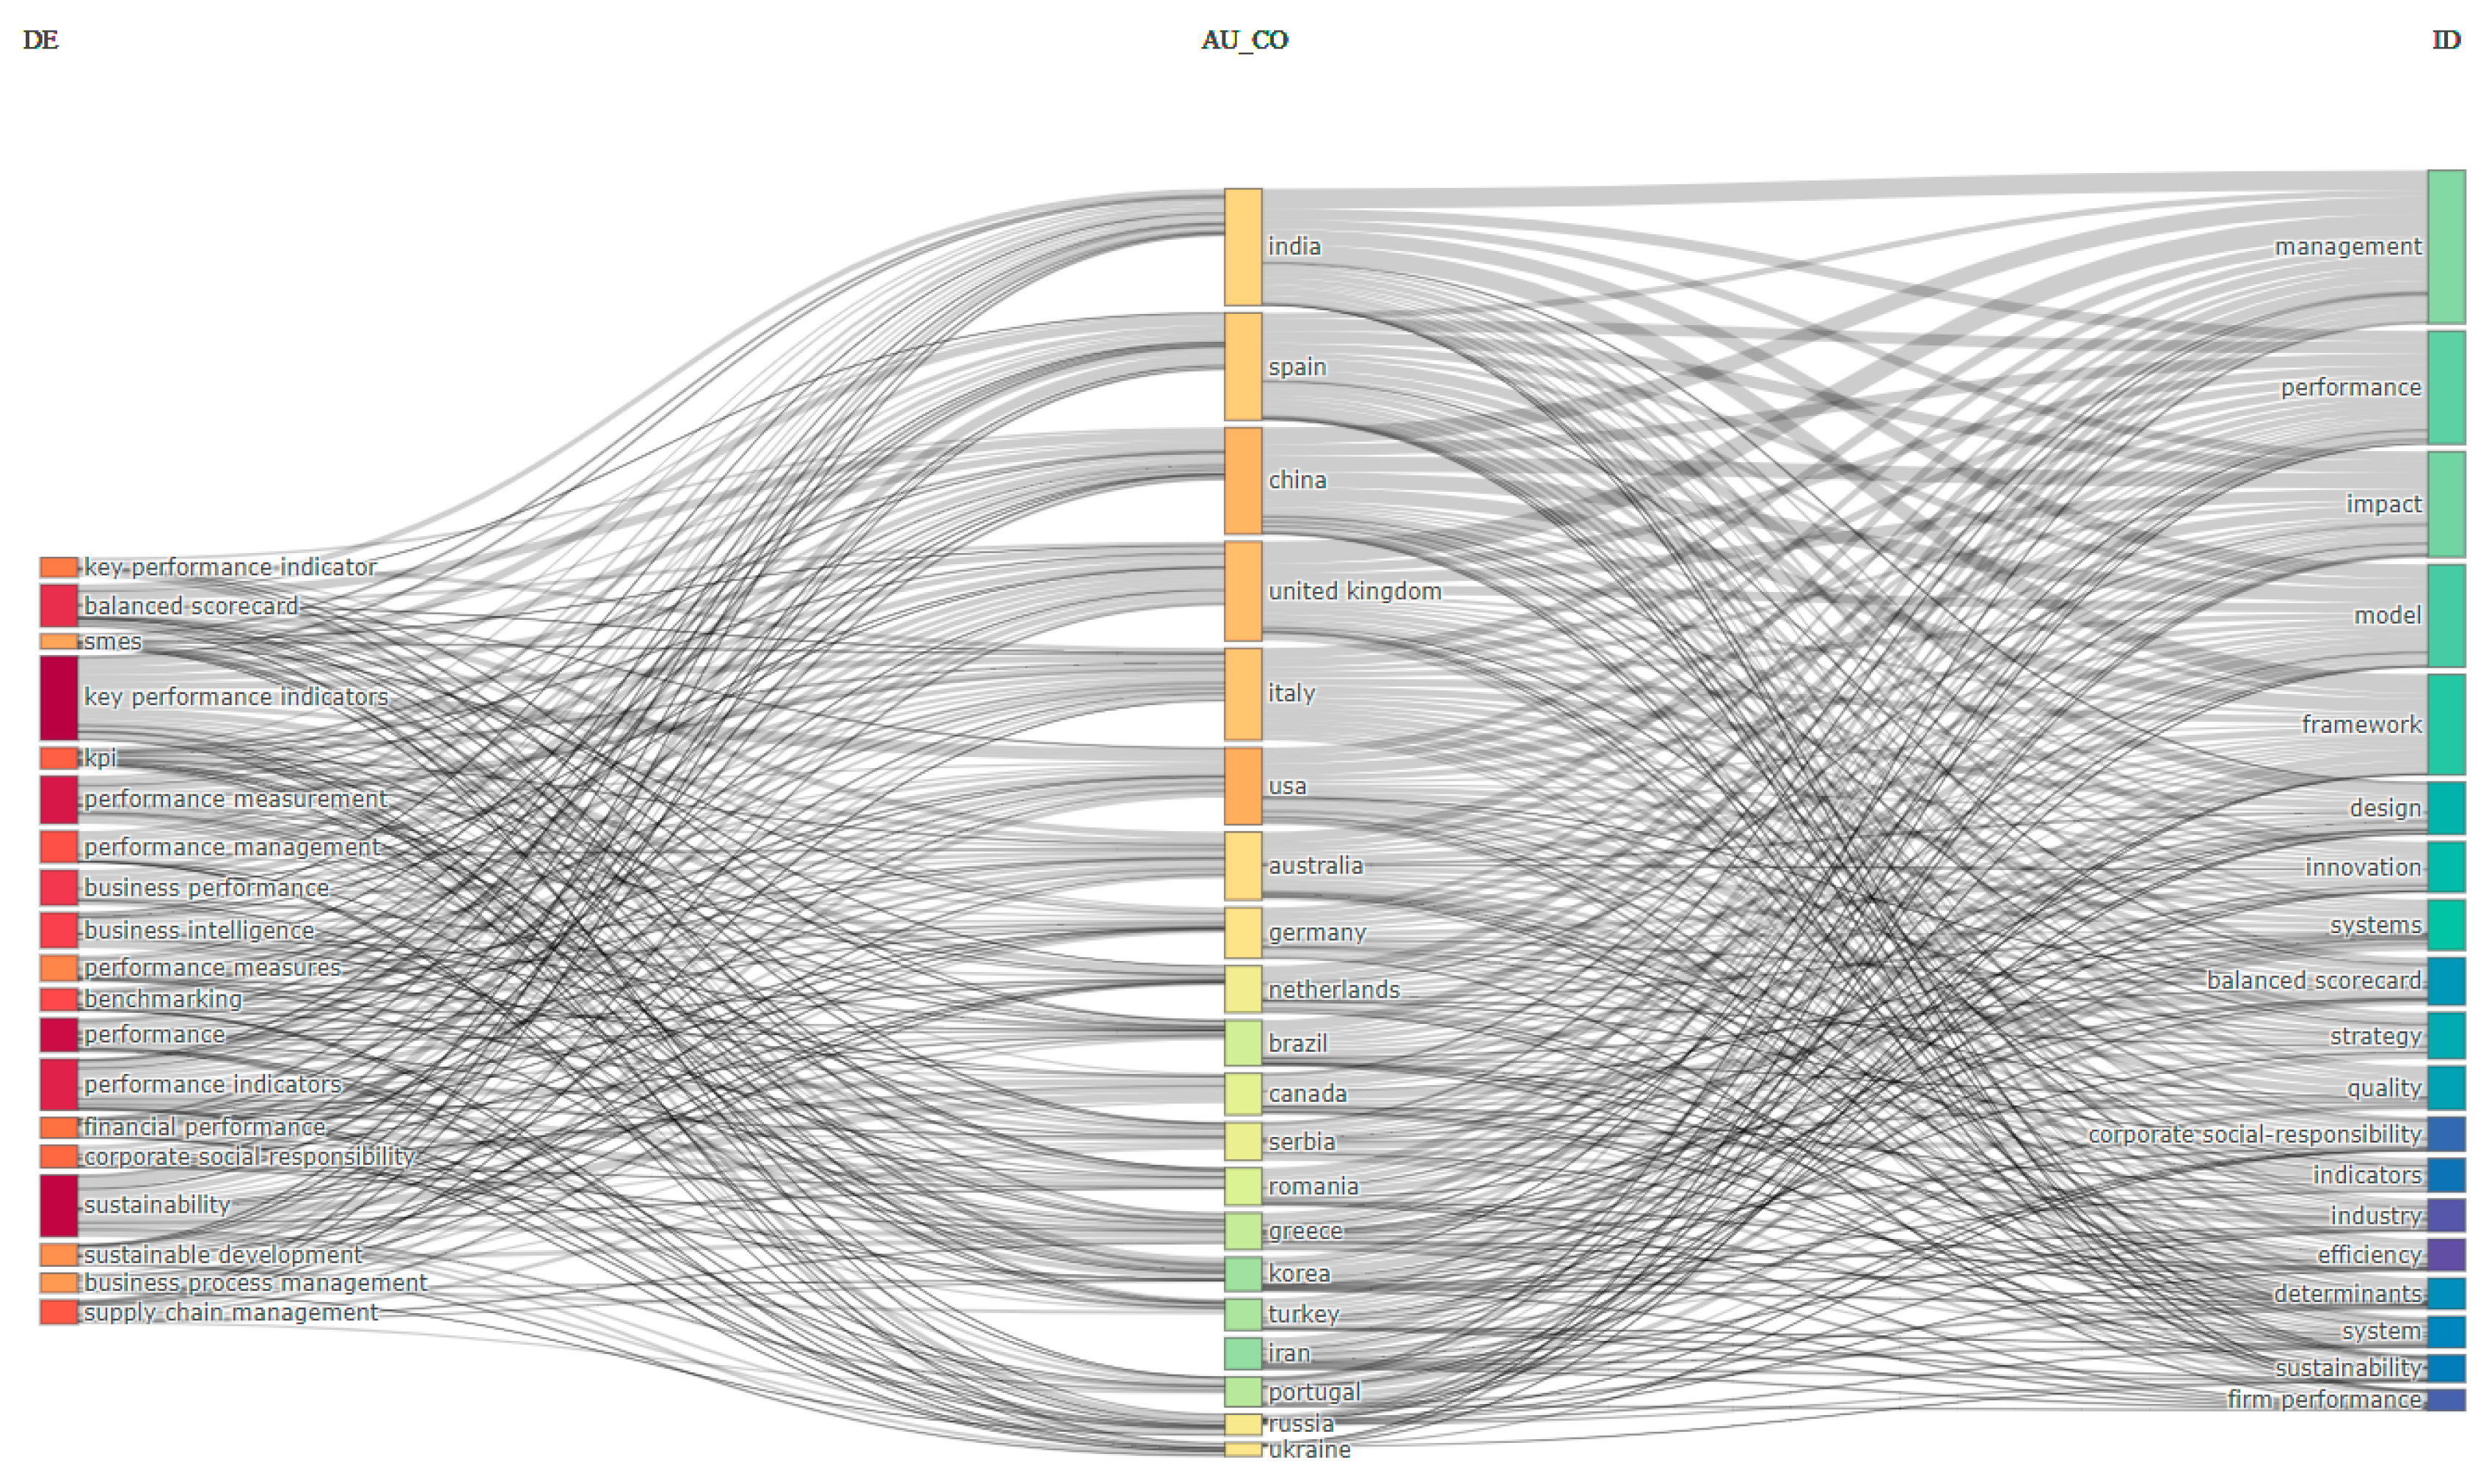
In
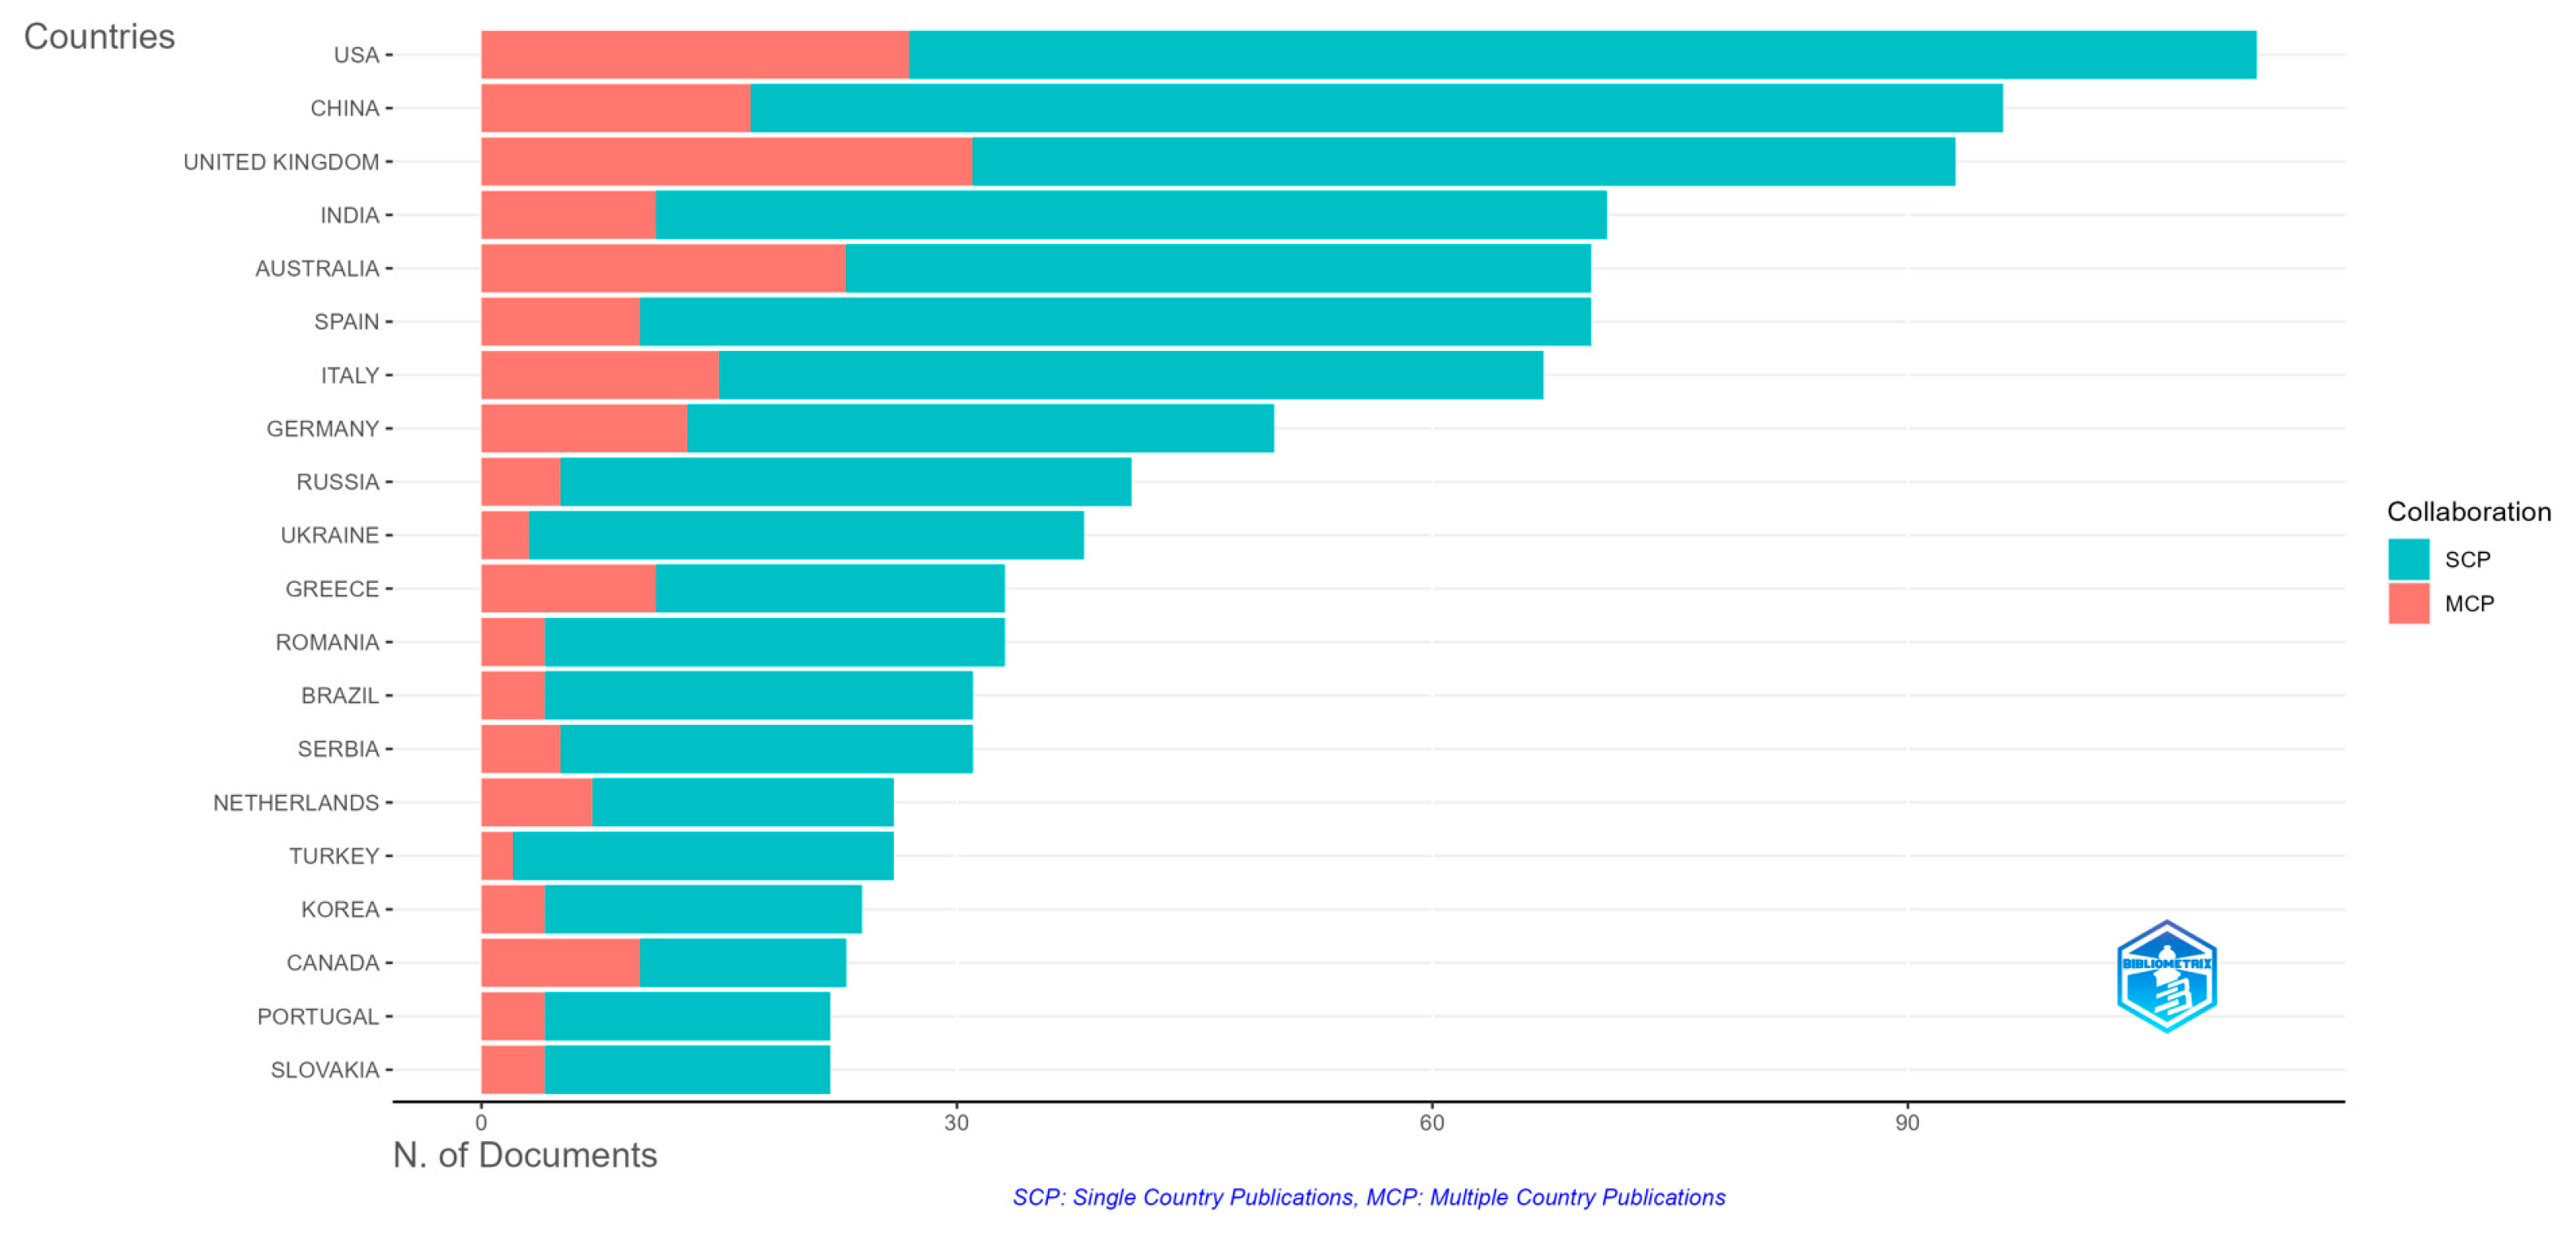
Figure 3, we created a three-field plot describing the keywords, countries and Keywords Plus. The plot’s first column shows how the considered keywords are linked to the countries, allowing for us to examine if a balanced distribution exists or if there are certain countries that dominate in a specific field. The second column orients our focus to the countries that are involved in the research, providing information about how each of them is related to the used keywords and Keywords Plus. The third and last column showcases, similarly to the first one, the association between Keywords Plus and the countries of origin, offering insights on how they are distributed.
3.7. Document Analysis
In this section, we delve into various analytical methods to understand the research landscape regarding key performance indicators (KPIs) and key risk indicators (KRIs). We present the top 10 most globally cited documents, providing insights into the foundational works in this field. Additionally, we utilize word clouds based on authors’ keywords and Keywords Plus to identify the most frequent terms. Our analysis extends to clustering by coupling, co-occurrence networks, and factorial analysis, revealing the structural relationships and thematic clusters within the research. These comprehensive analyses offer a multifaceted view of the key trends and priorities in the literature on KPIs and KRIs.
Table 6 lists the top 10 most globally cited documents. The analysis of these highly cited documents highlights significant contributions to the specialized literature on KPIs and KRIs. The first document, published by
Sun et al. (
2007) in the
Academy of Management Journal, has the highest total number of citations, indicating major influence.
Hanna et al. (
2011) in
Business Horizons presents the highest annual and normalized citations, reflecting a continuous and robust impact. Overall, the analyzed articles come from renowned journals and cover diverse themes, ranging from financial performance and sustainability to supply chain management and corporate governance. This diversity underscores the relevance and complexity of research on KPIs and KRIs, as well as their importance for various aspects of organizational management. We continue with a qualitative analysis of these articles to observe how performance and risk metrics and indicators are utilized.
With regard to the article published by
Sun et al. (
2007), service-oriented organizational citizenship behavior was studied in order to reveal how much it can impact the linkage between performant human resource policies and KPIs, the latter taking into account only turnover and productivity. The authors conducted their analysis on hotels in the People’s Republic of China.
For the second research article (
Hanna et al. 2011), the authors gave insights about the importance of setting and the right KPIs and how to measure these with regard to the online social media world, for platforms such as YouTube, Twitter, or Facebook, in order for them to reach their target audience—that of young consumers. More than this, the researchers treated this matter by approaching the social media context as a mix of both traditional and digital media, suggesting some best practices for these aforementioned online social platforms to increase the potential range of strategic marketing decisions that can be made with the help of KPIs.
From a critical point of view,
Milne and Gray (
2013) emphasized in their research the fact that an analysis of life-supporting ecological systems should also be considered when practices of sustainability reporting are being tackled. Therefore, the authors consider that the corporate or organizational level of sustainability may also be described by the level of environmental, social, and economic performance indicators. Yet, nowadays, from their perspective, even if there are diverse benchmarking approaches that should reinforce the sustainability of a business, it seems that these are not enough to also cover the ecological part that seems to be somehow disregarded in this process, thus arguing about the fact that the benchmarking tools should give more credit to the ecological area.
Ceccagnoli et al. (
2012) studied how partnerships between enterprise software companies and relatively small companies that act as software vendors (ISVs) impact the latter, with the help of KPIs proving that these kinds of partnerships are beneficial for ISVs. The software vendors’ sales rose considerably, and the partnership offers they received from software enterprises did as well.
López et al. (
2007) analyzed how corporate social responsibility (CSR) accounting practices impact business performance, if adopted. The researchers did this by comparing the differences between the KPIs of European organizations that had already adopted some of the CSR practices to those who did not. The authors proved that there was a slight negative impact on the KPIs of companies that adopted CSR practices in comparison to businesses that had not implemented any CSR norms.
Lee et al. (
2008) highlighted how important information technology (IT) is in the context of any business, underscoring the way that IT departments can contribute to the strategic goals of organizations. The scientists highlighted the fact that these kinds of technical departments cannot apply their performance measurement from a monetary unit perspective, but rather from four major ones: financial, internal business process, customer, and growth. Therefore, the authors implied that each perspective should have its own set of KPIs, as all these perspectives are different from a performance point of view. Furthermore, the results that the scientists obtained after constructing a model in which any of the abovementioned perspectives was considered separately in order to rightly evaluate the overall performance of the IT departments proved to offer very valuable insights within the department. Therefore, a detailed productivity tree of the department via performance evaluation should provide enough data for the business to consider the right strategy for further development of the department.
By their study,
Hermann et al. (
2007) provided a tool that can be used by businesses to find out essential information on the environmental impact they have. The authors mentioned that parts of diverse tools, such as environmental performance indicators, multi-criteria analysis, and life cycle assessment were integrated with their solution and environmental performance indicators.
The study published by
Franklin-Johnson et al. (
2016) proposes a new indicator in order to assess the environmental performance with regard to the circular economy, mentioning that the current methodology is quite cumbersome. This new suggested indicator considers the earned recycled lifetime, initial lifetime, and earned refurbished lifetime, and its management is crucial for the decision-making process, but also for making the right KPI assessment with regard to the circular economy, as per the authors’ mentioning. The researchers also state that the indicator should play a major role on a managerial level as well, not only on an organizational one, thus helping in the measurement that a business decision has against the longevity of materials.
The article published by
Varsei et al. (
2014) proposes a framework that can be used by the focal companies to assist them in developing supply chains that are sustainable. Therefore, the authors’ framework excels in detecting and assessing a specter of various key performance, economic, and environmental indicators, thus helping the companies achieve a sustainable supply chain. Certainly, this is of utmost need nowadays, as the researchers believe that there is an increasingly tendency for these focal companies to incorporate the assessment and advancement of sustainability with regard to supply chains in the supply chain’s management, pointing out that the companies may otherwise miss out on an overall better estimation of the supply chain’s sustainability.
The aim that
Turner and Zolin (
2012) had in their paper was to propose a set of critical KPIs in order to help managers who handle big projects give a better prognosis about stakeholder perceptions of success while projects are still ongoing. The researchers mentioned with certainty that some of these projects may be very long-living within an organization, basically increasing the chance that the project’s stakeholders’ definitions of success change over time. Thus, the authors suggested a model that should achieve stakeholder success at any point in the future. The advised model extends the traditional triple constraint that is described by scope, cost, and time, each of them with their own specific KPIs, to also include two KPIs related to the projects’ success and seven KPIs linked to the stakeholders’ satisfaction about the projects. Therefore, the usage of this tool by project managers should provide them with better control over the projects they lead.
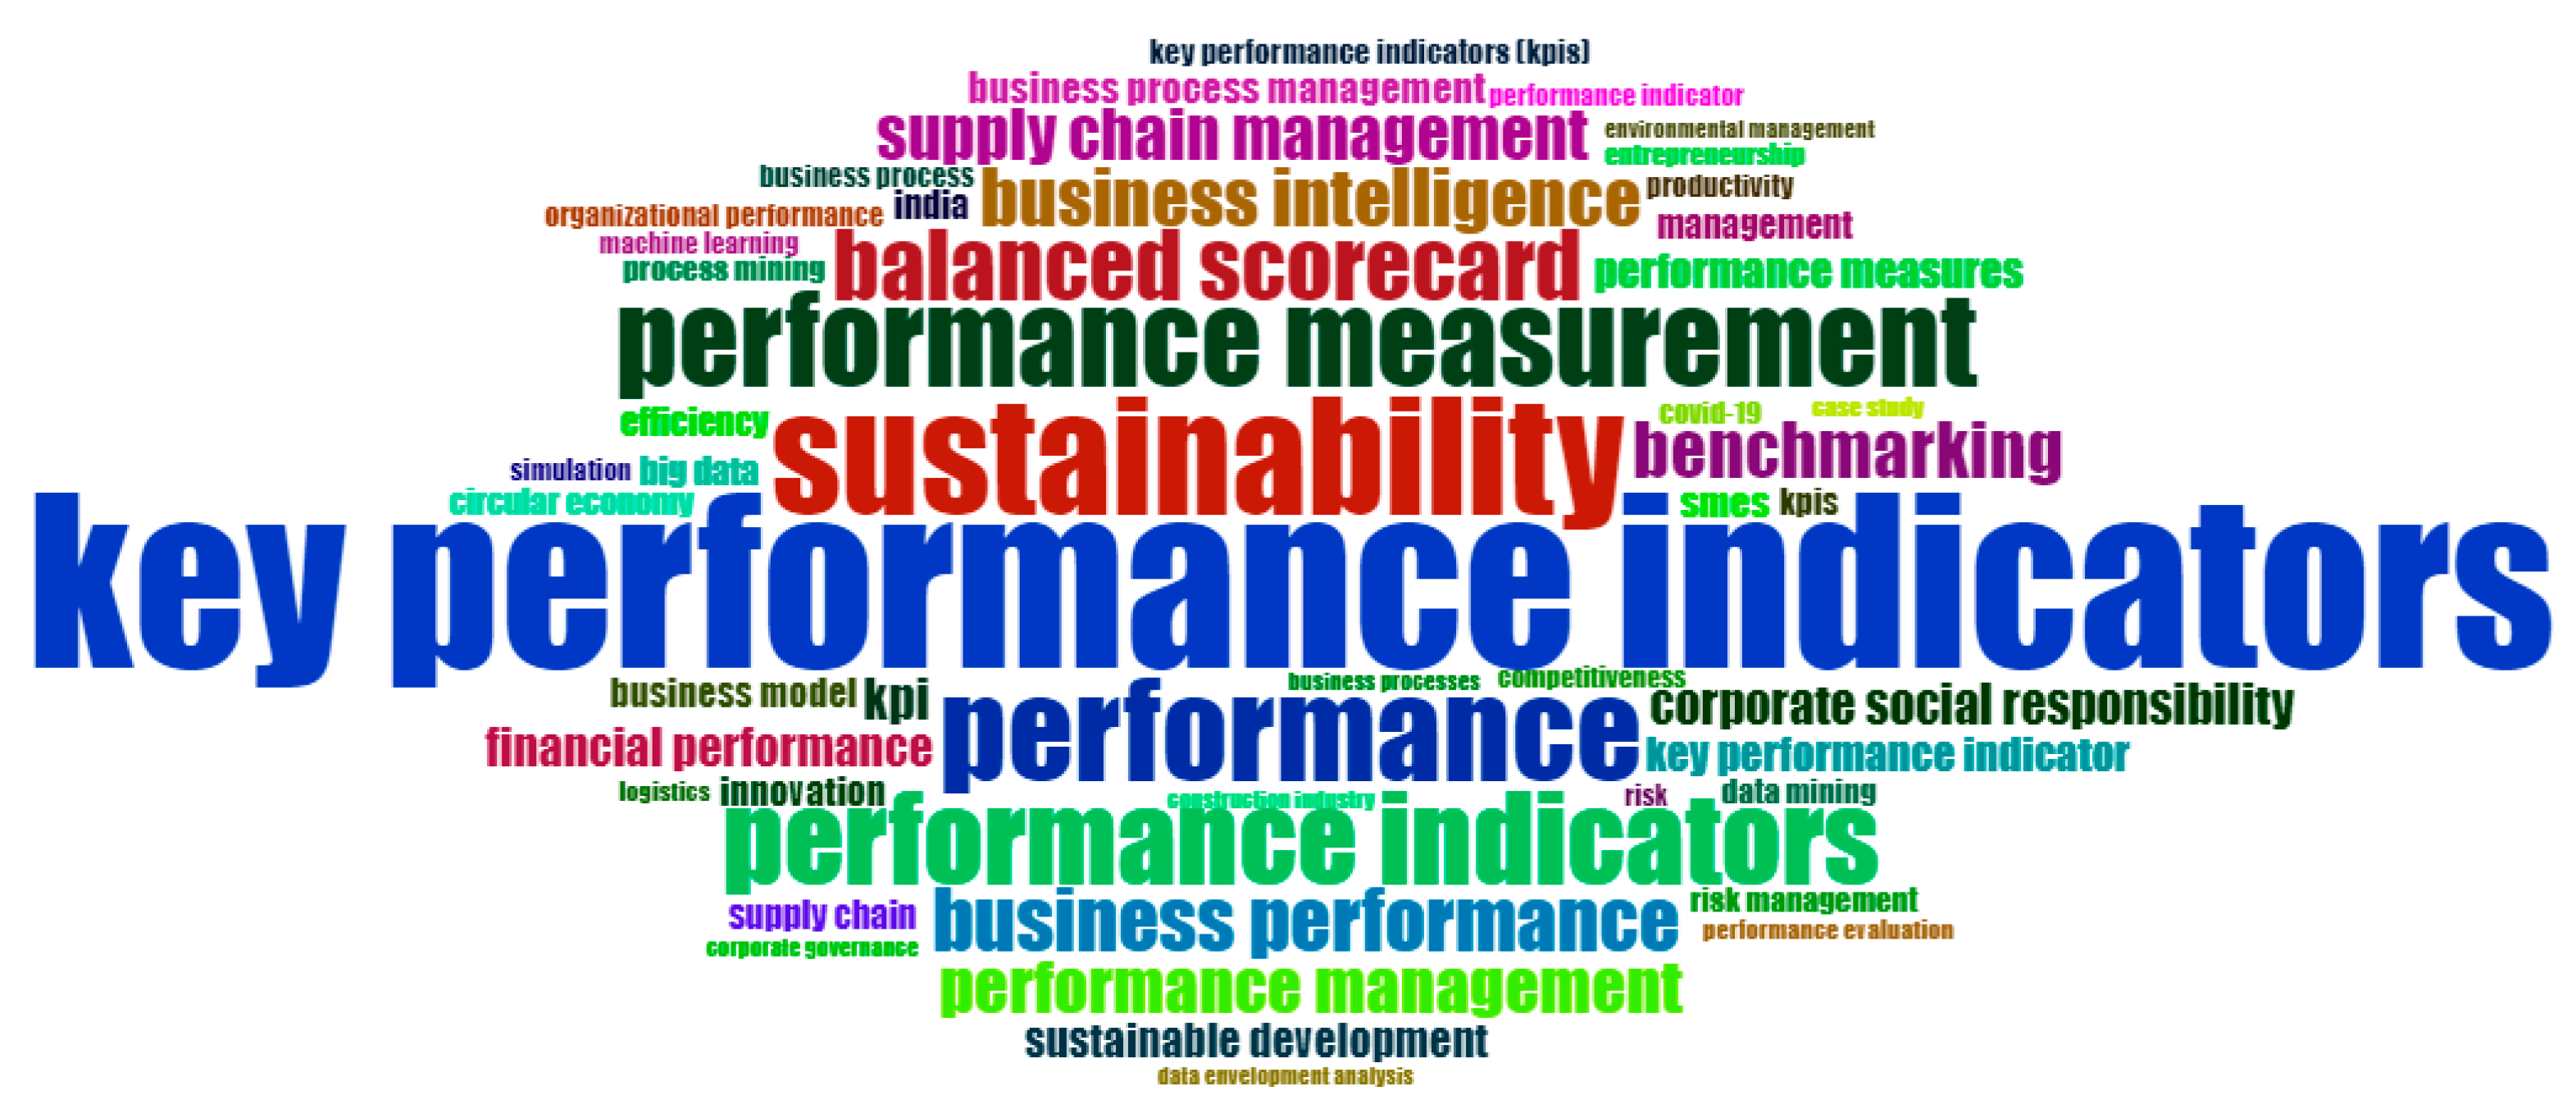
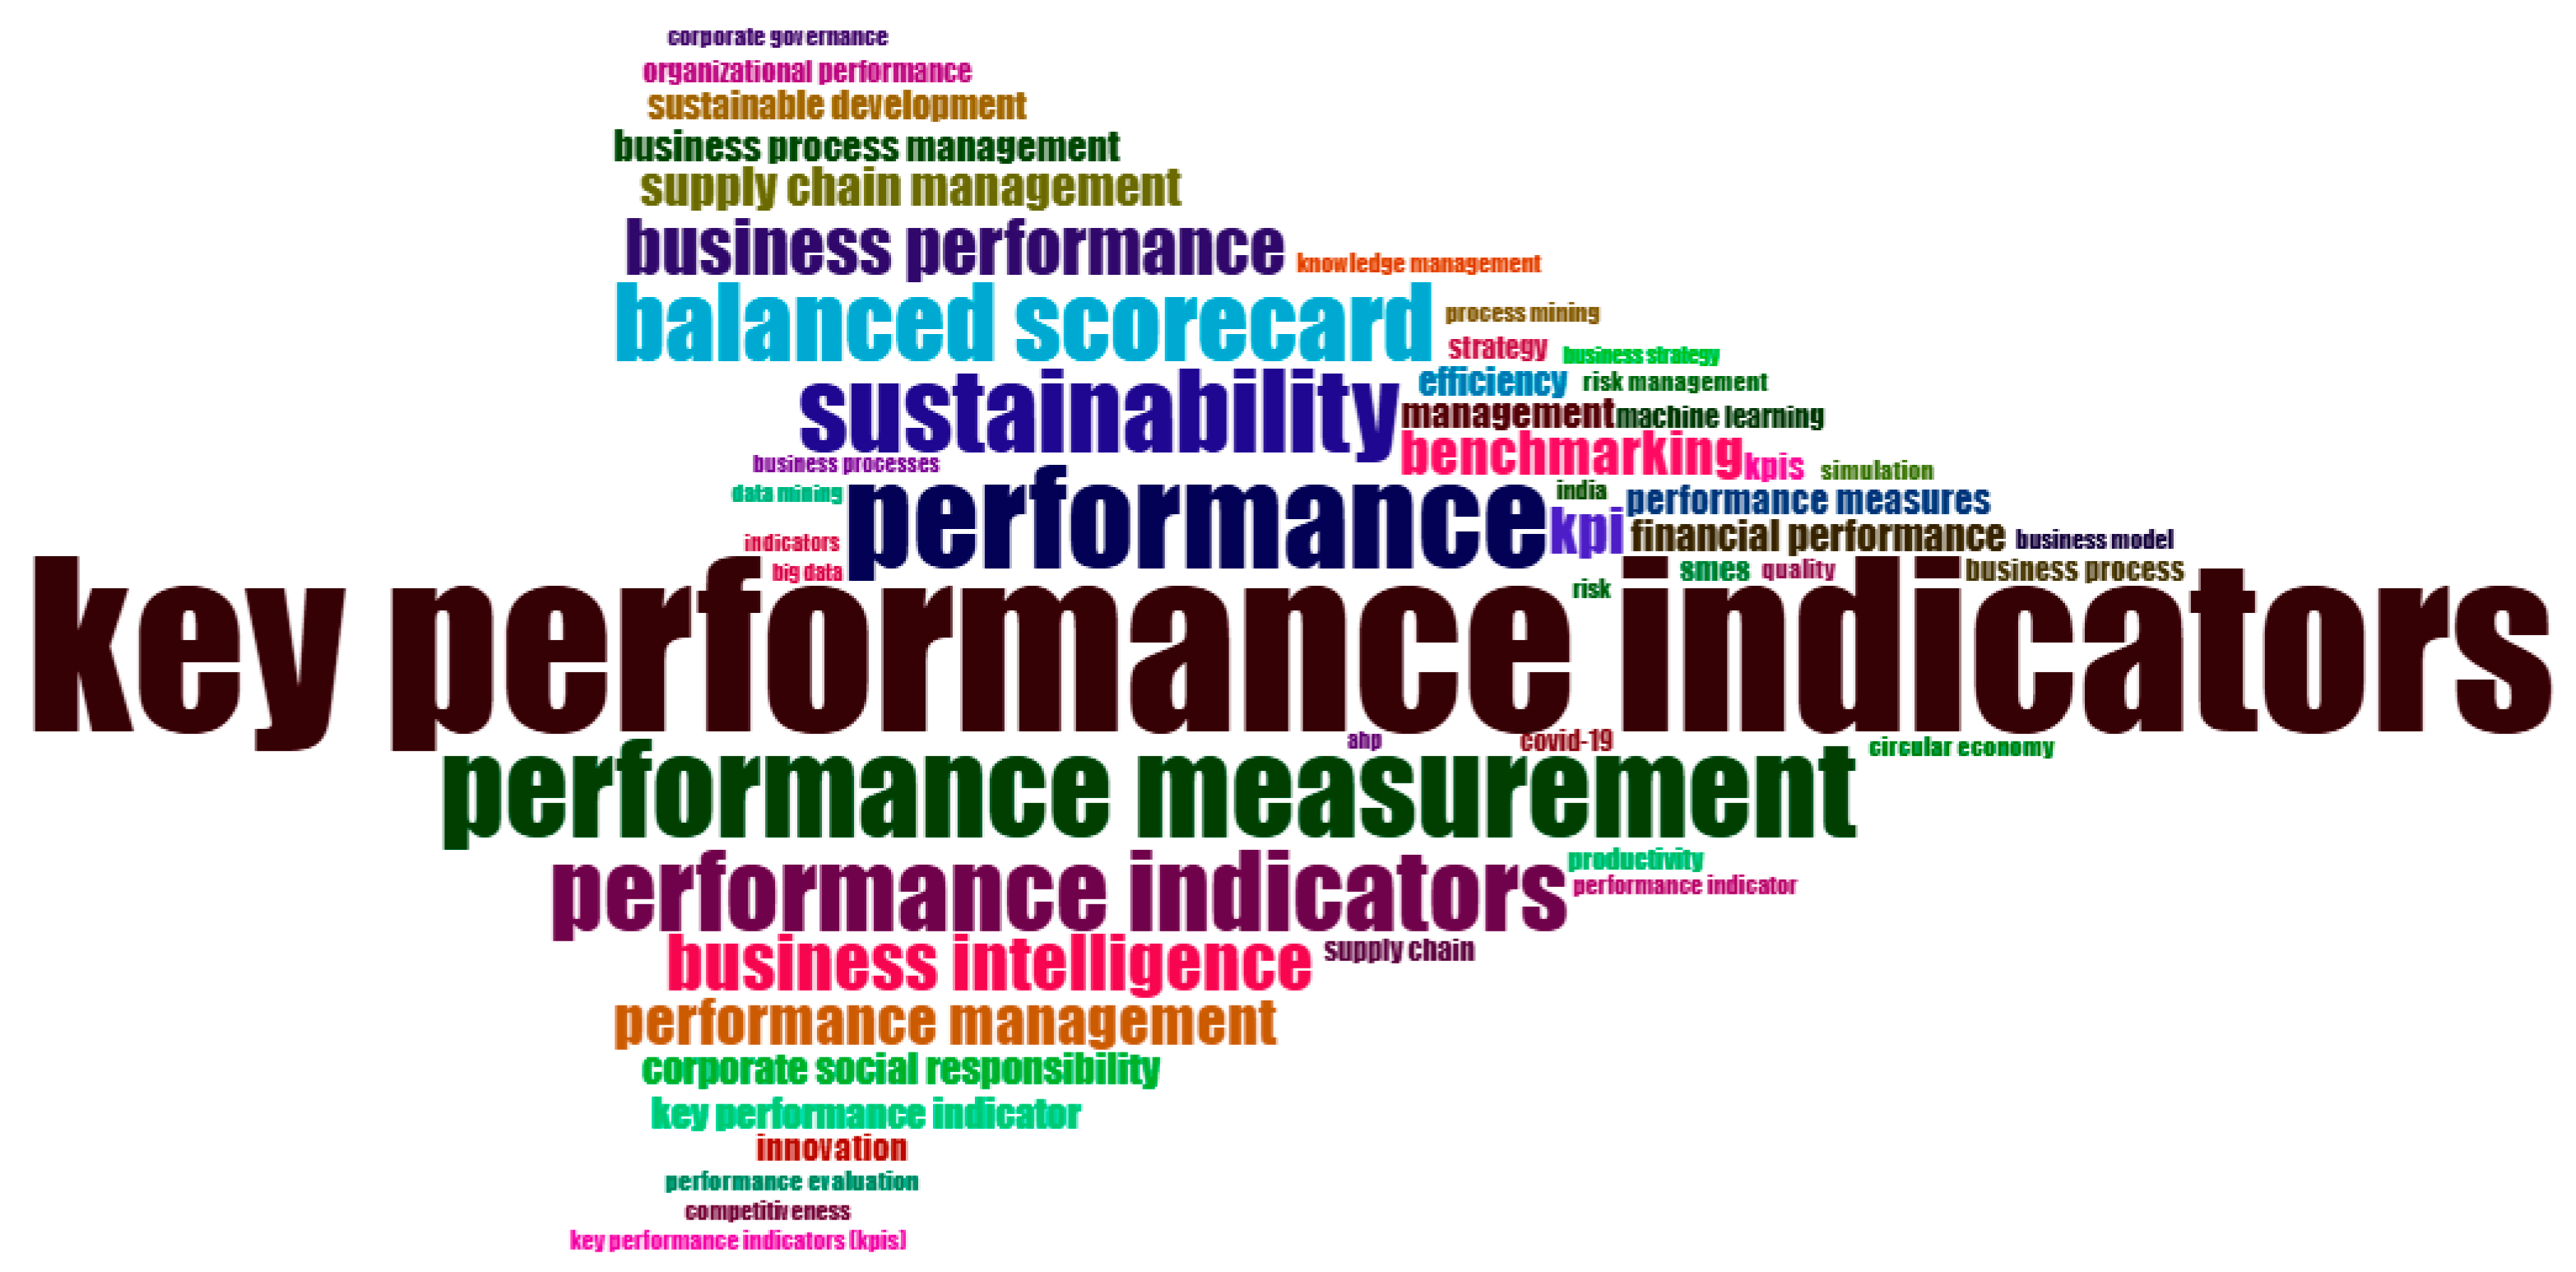
Figure 12 presents the word cloud analysis created based on the authors’ keywords, revealing frequently used terms in the specialized literature on KPIs and KRIs, providing valuable insights into the dominant themes and their alignment with our research hypotheses. The central term “key performance indicators” reflects the focus on KPIs as essential tools for measuring and improving organizational performance. Additionally, the appearance of the keyword “sustainability” highlights the importance of sustainability in organizational performance and the alignment of KPIs with sustainable development goals. The keywords “performance”, “performance measurement”, and “performance indicators” reflect major interest in measuring and evaluating performance in various organizational contexts. Furthermore, “business performance”, “business intelligence”, and “benchmarking” emphasize the link between KPIs and business performance, the use of business intelligence, and benchmarking practices for performance evaluation.
Regarding the authors’ keywords relevant to KRIs, we observe “risk management” and “risk”. These terms highlight the importance of identifying and managing risks within organizations. Risk management is essential for protecting and optimizing business operations and emphasizing the role of KRIs in anticipating and mitigating risks. Additionally, the appearance of the keyword “supply chain management” may indicate that managing risks in supply chains is a major concern. KRIs are used to identify risks in the supply chain and implement mitigation measures to ensure continuity and efficiency in operations. Additionally, the concept of “financial performance” is highly relevant to KRIs because financial risks are a crucial part of KRI assessment. These terms underscore the central role of KRIs in identifying, monitoring, and managing risks from various aspects of business, from supply chains to financial performance and corporate governance. These perspectives provide a deeper understanding of how KRIs are integrated into risk management strategies and highlight their relevance in ensuring organizational success.
The word cloud in
Figure 13, created based on Keywords Plus, provides valuable insights into the dominant themes and their frequency in the literature related to KPIs and KRIs in business. The most frequent term is “management”, indicating that management is a central topic in discussions about KPIs and KRIs. Additionally, key concepts such as “impact” and “performance” highlight the importance of evaluating effects and performance in the context of using KPIs and KRIs. Keywords like “model” and “framework” reflect the extensive use of models and conceptual frameworks in analyzing and applying KPIs and KRIs. More than this, we observe a high frequency of keywords such as “innovation” and “strategy”. This demonstrates the connection between innovation, strategy, and organizational performance. Significant concern is also highlighted for “sustainability” and “corporate social responsibility”.
Additionally, other keywords found in this word cloud include “decision-making”, “quality”, “satisfaction”, “risk”, and “balanced scorecard”. The keyword “decision-making” is highly relevant to our analysis, as the ability to make informed decisions is essential for organizational success, emphasizing the importance of KPIs and KRIs in the decision-making process. KPIs and KRIs provide data and information that support strategic and tactical decision-making. The keyword “quality” highlights that it is a vital aspect of organizational performance, and the use of KPIs is essential for monitoring and improving the quality of products and services. The keyword “satisfaction” indicates the importance of customer and employee satisfaction in evaluating organizational success through KPIs. Satisfaction KPIs help measure satisfaction levels and identify areas needing improvement. The concept of “risk” is crucial in KRI analysis, underscoring the importance of identifying and managing risks to protect and optimize business operations. The appearance of this keyword in the word cloud reflects the focus on risk evaluation and reduction using specific indicators. Finally, “balanced scorecard” is also a keyword observed in our word cloud. The balanced scorecard is a frequently used strategic methodology to align business activities with the organization’s vision and strategy, and its integration into KPI research indicates a structured and holistic approach to performance management.
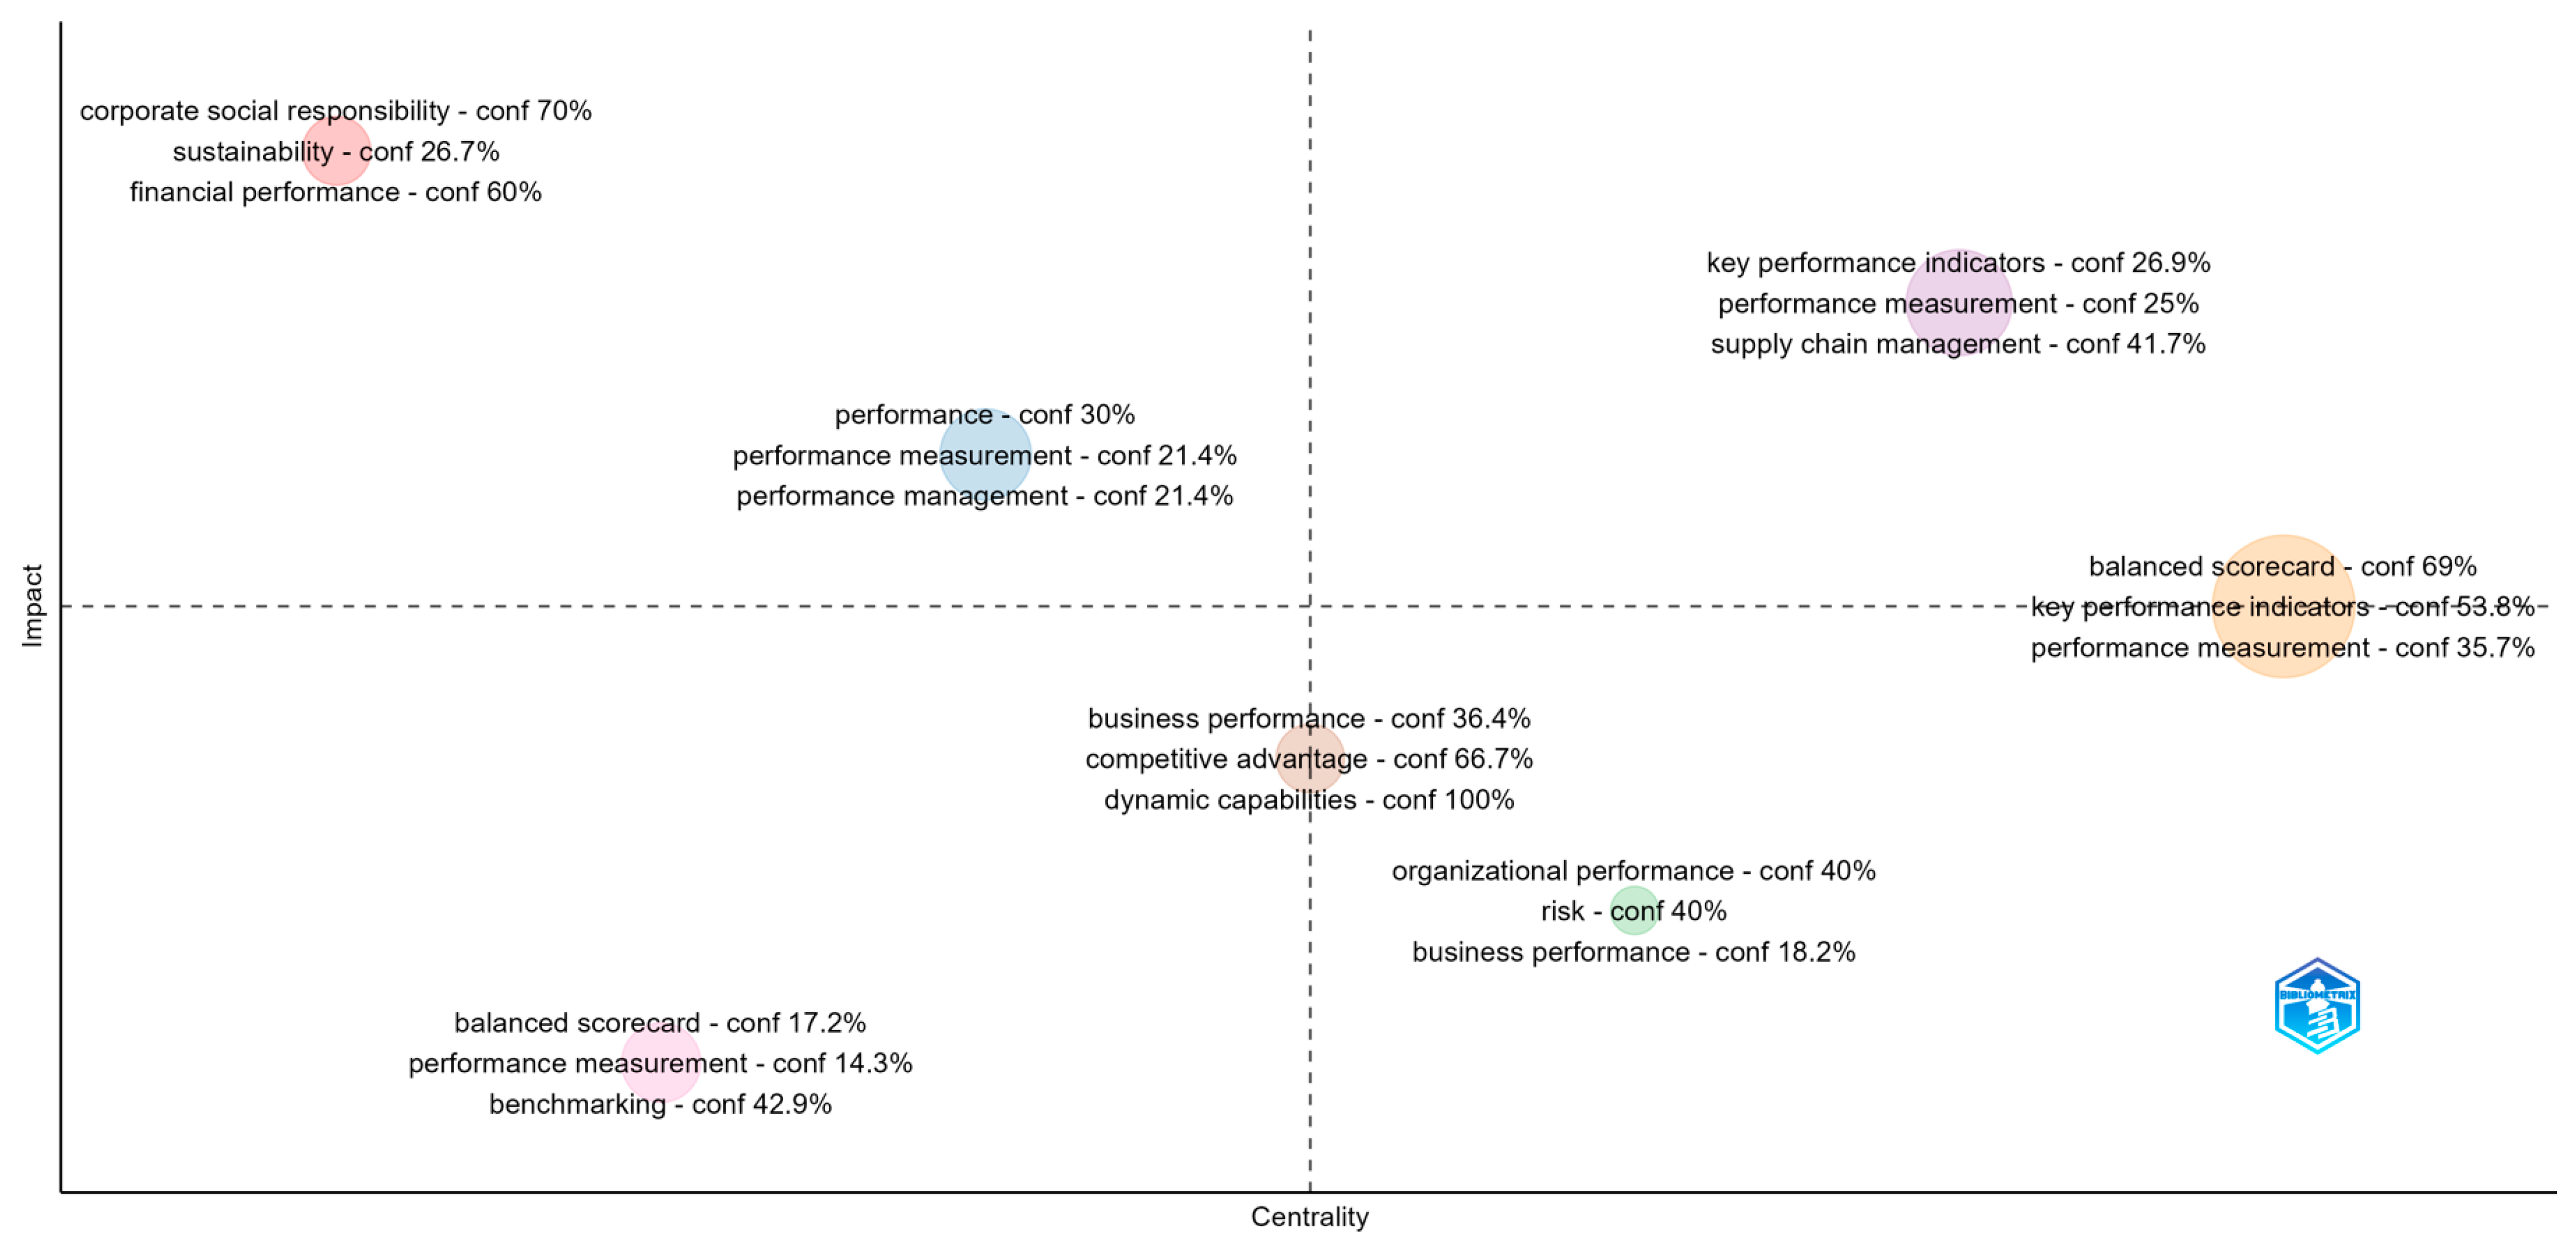
The clustering by coupling graph in
Figure 14 provides a visualization of clusters based on centrality and impact. On the vertical axis, we have impact, and on the horizontal axis, we have centrality. Each cluster is colored differently and represented by a specific set of dominant keywords.
Table 7 presents the values of centrality and impact for each label and formed cluster.
Thus, Cluster 1 (red) focuses on corporate social responsibility and sustainability, with very high impact and moderate centrality, suggesting these themes are essential for KPI and KRI research. Cluster 2 (blue), with a centrality of 0.311 and an impact of 2.725, indicates moderate values, reflecting the importance of performance evaluation and management in the analyzed research. Cluster 3 (green) combines organizational performance with risk and business performance, having relatively high centrality and moderate impact. Cluster 4 (purple) has a high centrality level of 0.439 and high impact, indicating the importance of KPIs and supply chain management. Cluster 5 (orange) has the highest centrality, but a more moderate impact compared to Cluster 4, highlighting the strategic use of these tools. Regarding Cluster 6 (brown), this cluster reflects the importance of business performance and competitive advantage, with moderate centrality and impact. Finally, Cluster 7 (pink) focuses on performance evaluation and benchmarking, with moderate impact and centrality.
Thus, the information in
Figure 14 and
Table 7 shows how various themes are grouped in KPI and KRI research. The most central and impactful themes are KPIs, balanced scorecard, and supply chain management, highlighting their importance in the organizational context. The clusters illustrate the distribution and relevance of different subjects in the specialized literature, providing a clear picture of research priorities.
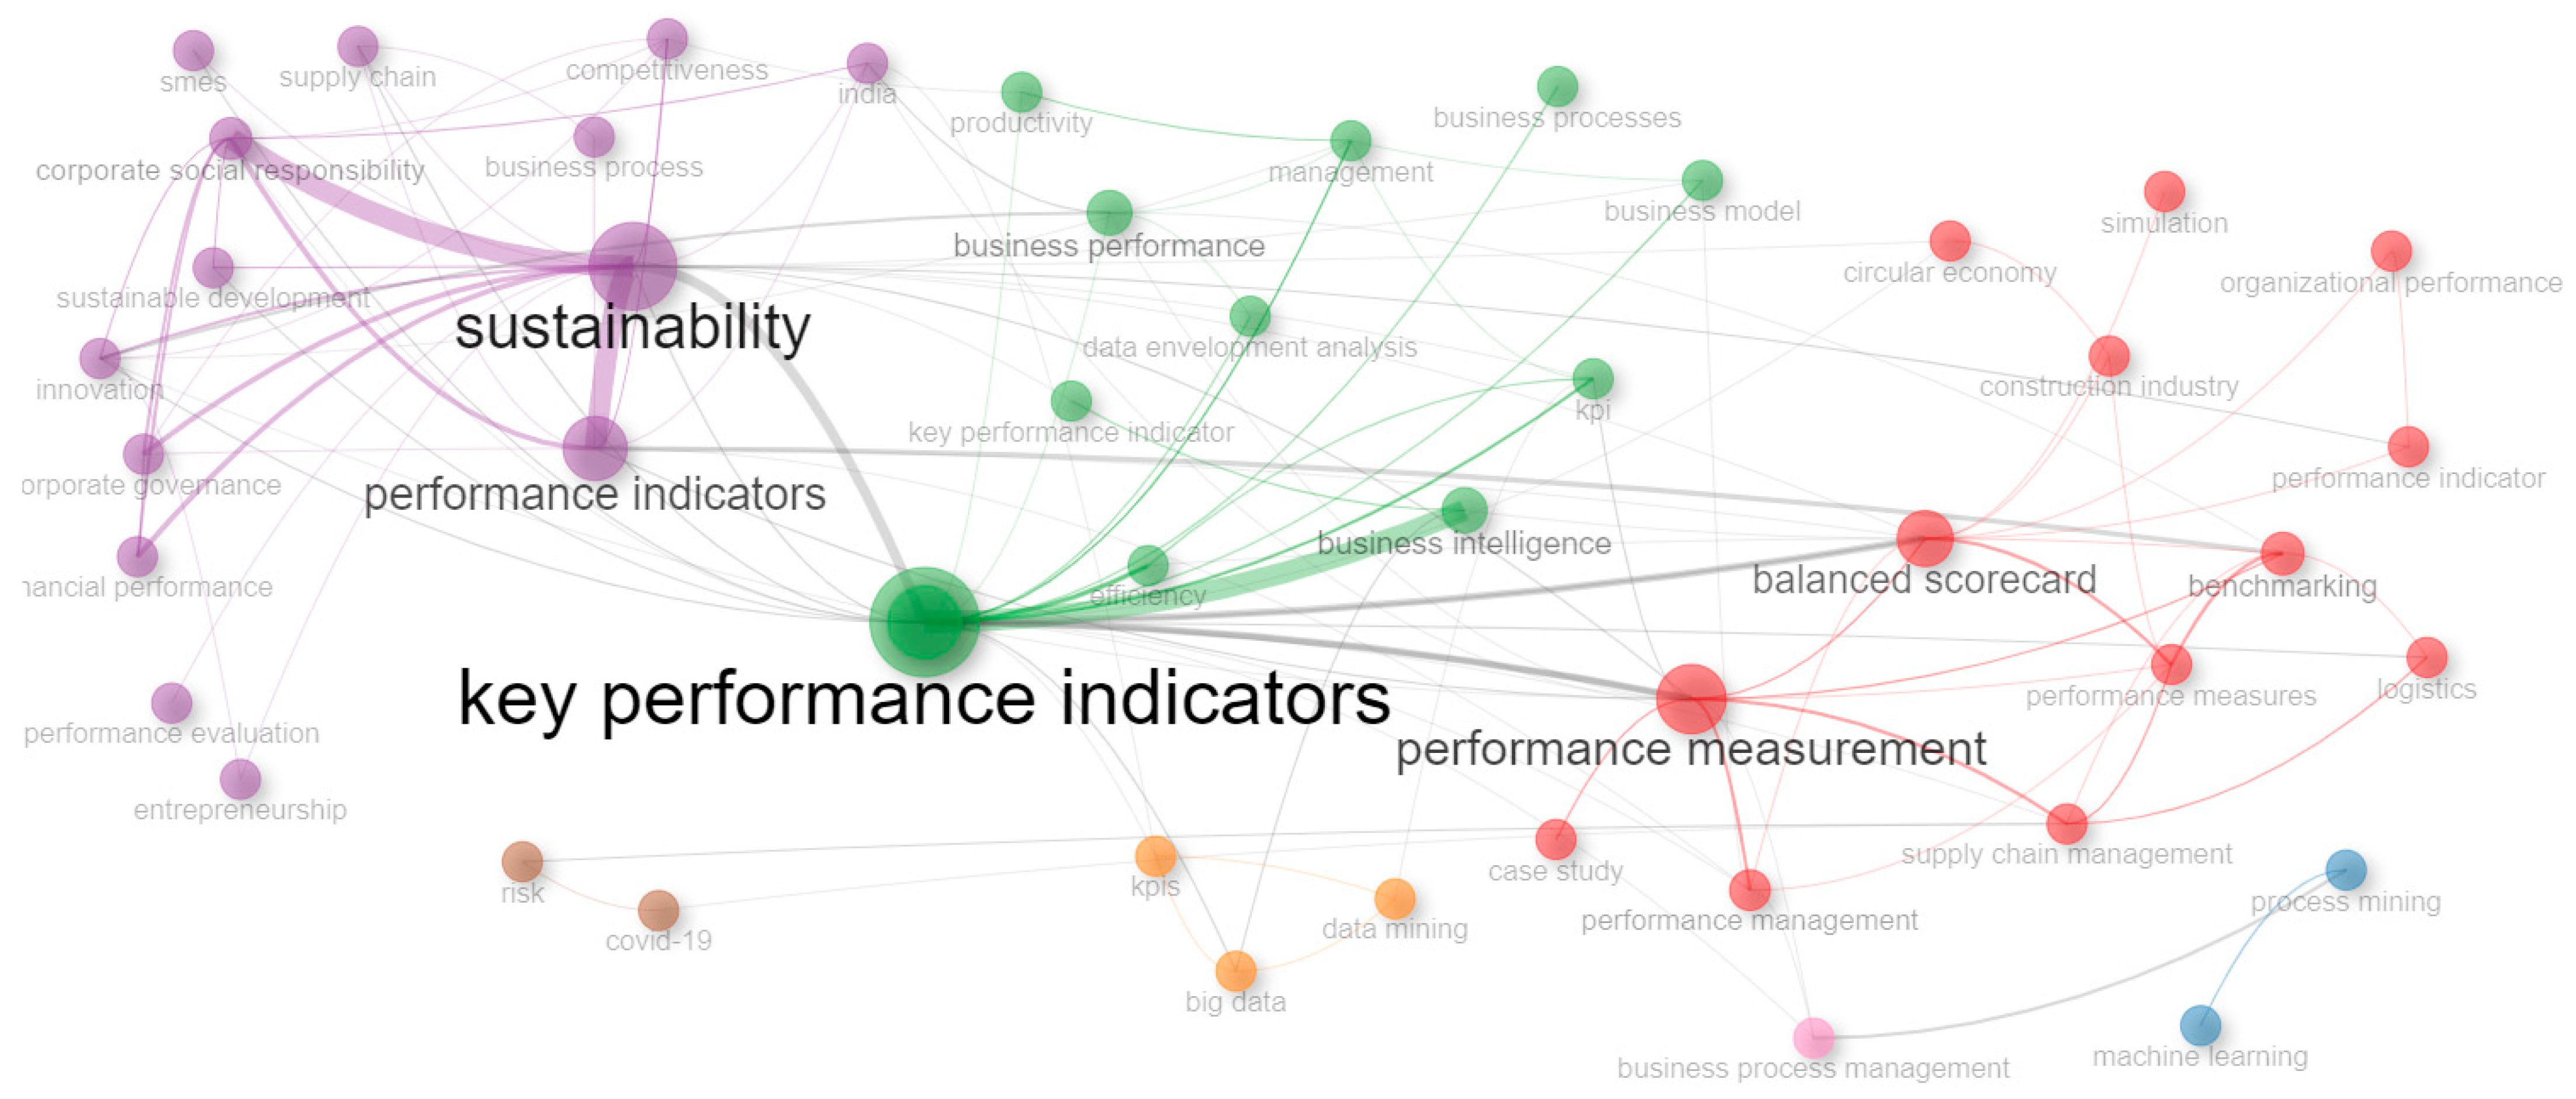
The co-occurrence network created in
Figure 15 is based on the authors’ keywords reveals the structure and relationships among central themes in KPI and KRI research. Each node represents a keyword, and the clusters indicate thematic groups. The values of centrality and impact provide additional information about the importance and interconnectedness of these terms. We observe that seven clusters were formed, which can be interpreted as follows:
- ➢
Cluster 1 (red): Key concepts include “performance measurement”, “balanced scorecard”, “benchmarking”, “performance management”, and “supply chain management”. This cluster has medium centrality and high impact and focuses on performance measurement and management methods, including balanced scorecard and supply chain management, emphasizing the importance of these tools in evaluating organizational performance.
- ➢
Cluster 2 (blue): Includes terms such as “process mining” and “machine learning”. This cluster, with low centrality and moderate impact, reflects the use of advanced technologies such as process mining and machine learning in performance analysis.
- ➢
Cluster 3 (green): Key concepts such as “key performance indicators”, “performance”, “business performance”, and “business intelligence” are identified in this cluster, which has high centrality and impact. The cluster has a clear focus on KPIs and business intelligence, highlighting the role of KPIs in improving business performance and decision-making.
- ➢
Cluster 4 (purple): Terms such as “sustainability”, “performance indicators”, “corporate social responsibility”, and “innovation” are present in this cluster. It is centered on sustainability and corporate social responsibility, indicating concern for the social and environmental impact of organizations, having medium centrality but high impact.
- ➢
Cluster 5 (orange): With medium centrality and low impact, this classification includes terms such as “big data” and “data mining”, reflecting their use in performance analysis and risk management.
- ➢
Cluster 6 (brown): Includes terms such as “COVID-19” and “risk”. It has both low centrality and impact, highlighting the recent concern for risk management in the context of the COVID-19 pandemic (
Munmun et al. 2023).
- ➢
Cluster 7 (pink): Includes the concept of “business process management” and has medium centrality and moderate impact. The cluster emphasizes the importance of managing business processes for improving organizational performance.
The co-occurrence network shows how various themes are interconnected in KPI and KRI research. The most central and impactful themes include performance measurement, balanced scorecard, KPIs, and sustainability, highlighting the importance of these aspects in the organizational context. The clusters show the distribution and relevance of different subjects in the specialized literature, providing a clear picture of research priorities.
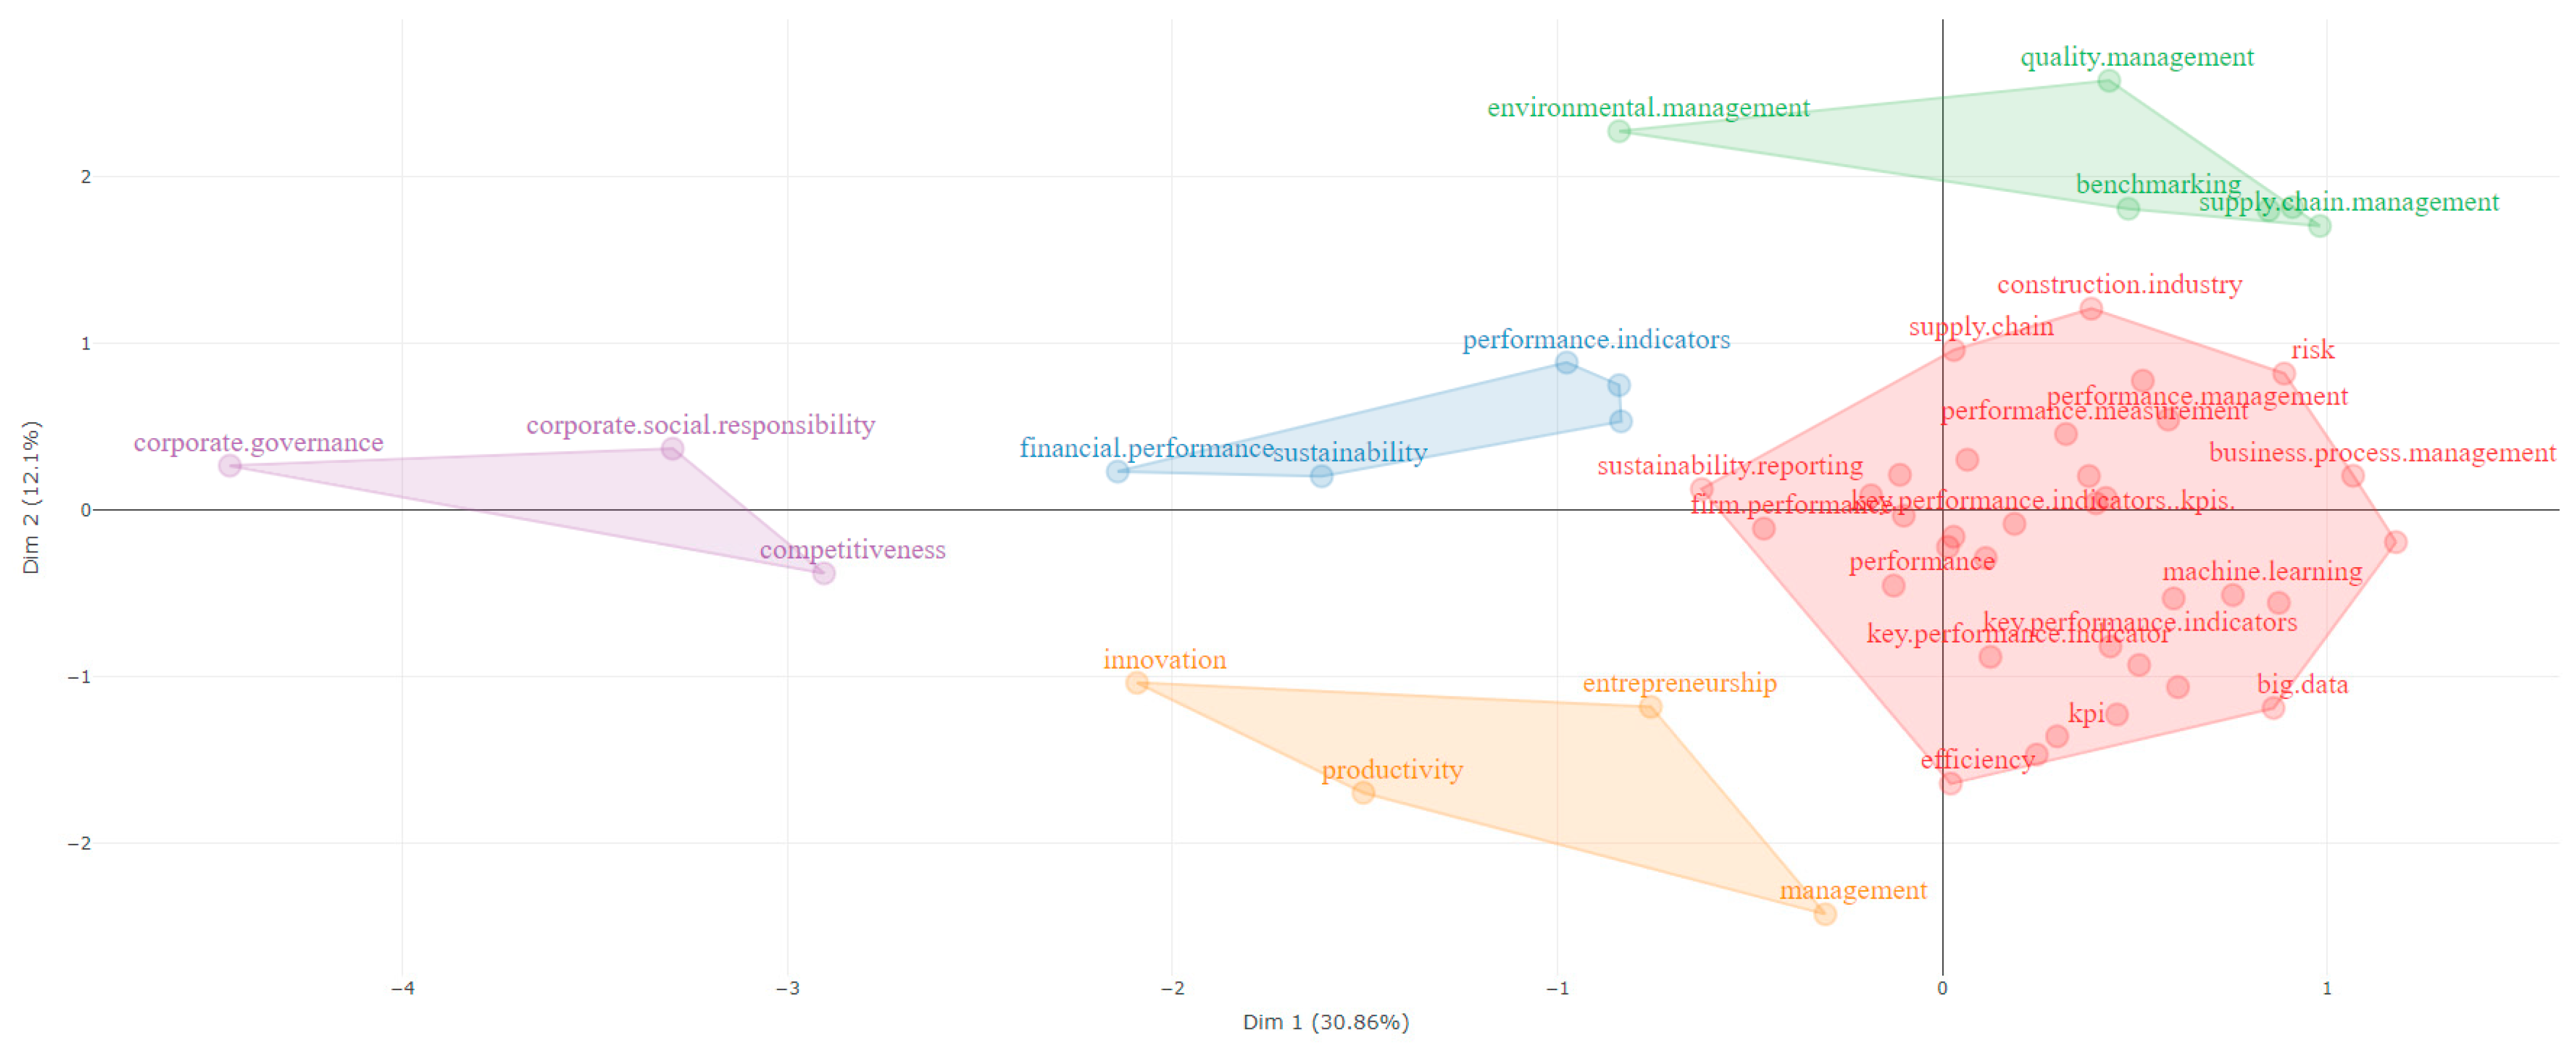
The factorial analysis in
Figure 16 shows how various themes are interconnected and grouped in the research on KPIs and KRIs. Additionally, the factorial analysis of the authors’ keywords highlights the structure and relationships among the different research themes regarding KPIs and KRIs. In this case, using the multiple correspondence analysis (MCA) method, five clusters were formed as follows:
- ➢
Cluster 1 (red) includes keywords such as “key performance indicators”, “performance”, “performance measurement”, “business process management”, “business performance”, “firm performance”, “business intelligence”, etc. This cluster comprises essential terms for performance measurement and management. The positioning of the terms in Dim1 and Dim2 shows that they are closely related to organizational performance evaluation and the use of management tools.
- ➢
Cluster 2 (blue) groups keywords such as “financial performance”, “sustainability”, and “performance indicator”. This cluster is focused on sustainability and financial performance, highlighting the importance of integrating sustainable development goals into organizational performance.
- ➢
Cluster 3 (green) groups keywords like “benchmarking”, “supply chain management”, “environmental management”, etc. This cluster concentrates on supply chain management and benchmarking, indicating performance comparison practices and efficient supply chain management.
- ➢
Cluster 4 (purple) includes keywords such as “corporate social responsibility”, “competitiveness”, and “corporate governance”. This cluster focuses on corporate social responsibility and corporate governance, reflecting concerns about social impact and business competitiveness.
- ➢
Cluster 5 (orange) groups key terms such as “innovation”, “management”, “productivity”, and “entrepreneurship”, highlighting innovation, management, and productivity, and emphasizing the importance of innovation and entrepreneurship in organizational performance.
Thus, we observe that the most prominent themes include performance measurement, sustainability, supply chain management, and corporate social responsibility, underscoring the importance of these aspects in the organizational context.
Figure 17 is a map created in VOSviewer that highlights the most relevant key concepts.
VOSviewer identified 999 relevant key concepts and automatically calculated a relevance score for each term, reflecting its importance in the context of the scientific articles analyzed in our study. Of all the identified terms, the top 60% of most relevant terms were selected based on their calculated relevance scores. This selection was made to focus the analysis on the terms that are most significant and contribute most meaningfully to the understanding of the research domain. Thus, the created map visualizes the structure and relationships among the essential terms, highlighting crucial themes, topics, and connections within the analyzed articles.
The keyword map from
Figure 17 generated 12 clusters as follows:
- ➢
Cluster 1: Technological Integration and AI in business processes—This cluster, with 154 keywords, includes keywords such as “accuracy”, “artificial intelligence”, “business process management”, “customer service”, “digitalization”, “enterprise performance”, “IoT”, “machine learning”, and “predictive model”. These terms highlight the increasing integration of advanced technologies and analytics in enhancing business processes and performance. This cluster underlines the role of digital transformation and smart technologies in optimizing KPIs, suggesting a trend towards more data-driven and technology-enabled business strategies.
- ➢
Cluster 2: Business Environment and Competitive Strategies—Cluster 2, with 92 keywords, features terms like “agricultural enterprise”, “auditor”, “business incubator”, “competitive environment”, “digital transformation”, “economic development”, and “strategic management”. This cluster indicates the importance of external economic factors and competitive dynamics in shaping business strategies and performance metrics. It underscores the necessity for businesses to adapt to economic changes and competitive pressures through strategic management and innovation.
- ➢
Cluster 3: Industrial and Educational Performance—This cluster includes 73 keywords such as “construction industry”, “economic performance”, “education”, and “human factor”. The focus here is on the performance metrics specific to different industries and sectors. The inclusion of terms related to education and human factors highlights the role of human capital and industry-specific knowledge in driving performance.
- ➢
Cluster 4: Business Intelligence and Strategic Planning—Cluster 4, with 65 keywords, contains terms like “agility”, “balanced scorecard”, “business intelligence”, “cloud computing”, and “strategic planning”. This cluster points to the strategic tools and methodologies used in measuring and enhancing business performance. It highlights the use of balanced scorecards and business intelligence as essential tools in strategic planning and decision-making.
- ➢
Cluster 5: Environmental Performance and Sustainability—This cluster, containing 50 keywords, includes terms such as “circular economy”, “environmental performance”, “energy efficiency”, and “social impact”. It underscores the growing underline on sustainability and social responsibility in business performance metrics. This cluster reflects how environmental and social factors are becoming integral to the evaluation of business performance.
- ➢
Cluster 6: Business success and quality management—With 38 keywords, this cluster features terms like “DEA (Data Envelopment Analysis)”, “business success”, “Confirmatory Factor Analysis”, and “quality management system”. It indicates a focus on quality management and success metrics in various industries, particularly in the hotel industry. This cluster points to the use of sophisticated analytical methods to assess and improve business success and quality.
- ➢
Cluster 7: Financial Health and Risk Management—Cluster 7 includes 33 keywords such as “accounting”, “capital”, “financial distress”, “financial ratio”, “ICT investment”, and “intellectual capital”. This cluster highlights the financial metrics and risk factors that are critical to business performance. It emphasizes the importance of financial health, investment in information and communication technologies, and intellectual capital in achieving business success.
- ➢
Cluster 8: Corporate Responsibility and Reporting—Featuring terms like “annual report”, “content analysis”, “corporate social responsibility”, “regulator”, and “sustainability performance”, this cluster underscores the importance of corporate governance, regulatory compliance, and social responsibility in business performance. It highlights the role of transparency and accountability in achieving sustainable business success.
- ➢
Cluster 9: Innovation and Training—This cluster includes terms such as “conceptual framework”, “innovation performance”, “sales performance”, “training”, and “skill”. It underlines the role of innovation, skills development, and training in driving business performance. This cluster suggests that continuous improvement and innovation are key to maintaining a competitive advantage.
- ➢
Cluster 10: Risk Indicators and Economic Crises—With significant terms like “business risk”, “credit risk”, “economic crisis”, “financial risk”, “firm performance”, “operational risk”, “risk management”, and “risk indicator”, this cluster highlights the critical importance of identifying, assessing, and managing risks in business. It underscores the various types of risks that can impact firm performance and the necessity of robust risk management strategies.
- ➢
Cluster 11: Value Creation and Stability—This smaller cluster, with 15 keywords, includes terms like “car company”, “further development”, “value creation”, and “stability”. It focuses on the industrial sector and the factors contributing to business stability and value creation.
- ➢
Cluster 12: Market and Economic Conditions—Containing six keywords, namely, “climate risk”, “economic condition”, “market value”, “nation”, “price”, and “regression analysis”, this cluster emphasizes the broader economic conditions and market factors that influence business performance and risk.
In order to validate the clusters formed and the trends resulting from the previous analyses,
Table 8 was created, in which several works that support the analytical trends were extracted and reviewed. These references support the clusters identified in our bibliometric analysis, providing a comprehensive understanding of the key performance and risk indicators in business contexts.
