Article

Commodity Market Risk: Examining Price Co-Movements in the Pakistan Mercantile Exchange

1
Faisalabad Business School, National Textile University, Faisalabad 37610, Pakistan
2
LSBU Business School, London South Bank University, London SE1 0AN, UK
*
Author to whom correspondence should be addressed.
Risks 2024, 12(6), 86; https://doi.org/10.3390/risks12060086
Submission received: 6 March 2024 / Revised: 27 April 2024 / Accepted: 8 May 2024 / Published: 22 May 2024

Abstract

:
Commodity price co-movements significantly impact investment decisions. High correlations constrain portfolio diversification and limit risk mitigation potential. While international markets often exhibit strong price linkages, understanding national-level dynamics is crucial for effective portfolio optimization. In this paper, we examine the commodity price co-movements within three key sectors—energy, metals, and agriculture—in the specific context of Pakistan. Utilizing data from 13 January 2013 to 20 August 2020 and employing an autoregressive distributed lag (ARDL) model, we reveal a surprising finding: co-movement among these sectors is weak and primarily short-term. This challenges the conventional assumption of tight coupling in national markets and offers exciting implications for investors. Our analysis suggests that Pakistani commodities hold significant diversification potential, opening promising avenues for risk-reduction strategies within the national market.

1. Introduction

The heightened scholarly interest in commodity price research over the past two decades can be attributed to the growing recognition of two fundamental aspects. Firstly, commodities play a pivotal role in shaping economic decision-making processes. This key role stems from the macroeconomic landscape, where commodity price movements serve as critical indicators of the fundamental economic conditions. The research by Cody and Mills (1991) stresses the role of commodity prices as signals for future economic trends, while Clarida et al. (1998) emphasized their informative value regarding inflation, interest rates, and output growth. Additionally, commodity prices play a substantial role in the strategic design of monetary policies and serve as crucial input factors in industrial production, as demonstrated by Bhar and Hamori (2008). Importantly, the link between commodity prices and macroeconomic variables, including inflation rates, interest rates, and trade balances, is particularly evident in futures markets, as observed by Zhang and Ding (2021). In contemporary society, commodity consumption (e.g., energy) serves as the cornerstone of both economic prosperity and social progress (Dospinescu and Dospinescu 2018). Considering these connections, the impact of commodity pricing on policymaking becomes apparent. Zhang and Ding (2021) advocate for leveraging commodity futures price movements for real-time economic oversight, enabling timely adjustments in policies. Furthermore, the work of Janzen et al. (2018) highlights the substantial influence of commodity price swings on the internal and external stability of countries, thereby shaping specific monetary and financial policies.
Secondly, the evolving role of commodities as a distinctive asset class for investment purposes has emerged as a notable catalyst for research in this field. Once traditionally perceived as tangible goods with intrinsic use value, commodities have progressively evolved into an appealing avenue for investment diversification. According to Marshall et al. (2012), commodities have not only gained popularity among commodity customers and manufacturers but have also become a sought-after investment class. Referred to as “financialization”, commodities have obtained growing appeal as an asset class for investors (Tang and Xiong 2012; Wimmer et al. 2021). Due to their typically low correlations with stocks and bonds, commodities serve as valuable instruments for achieving a high level of portfolio diversification (Hollstein et al. 2021). Various researchers (e.g., Cai et al. 2018; Fernández-Avilés et al. 2020; Gagnon et al. 2020; Liu et al. 2023; Mensi et al. 2020; Pham et al. 2023; Zaremba et al. 2021) have explored the role of commodity markets in portfolio diversification. The correlation patterns, risk-return profiles, and hedging capabilities associated with commodity investments have captured the attention of financial analysts, investors, and portfolio managers.
Given the profound significance of commodity prices, numerous studies have explored the co-movement of commodity prices to extract valuable insights for policymakers and investors. Notable among these are the works of (Bouri et al. 2023; Chen et al. 2019; Ding and Zhang 2020; Farid et al. 2023; Flori et al. 2021; Khalfaoui et al. 2021; Umar et al. 2020; Zaremba et al. 2021; Zhang et al. 2019). However, a closer examination reveals that these studies present a somewhat ambiguous picture of commodity price co-movement. For instance, while Zhang et al. (2019), and Zhang and Ding (2021) provided evidence of co-movements, Bouri et al. (2023), Farid et al. (2023), and Mensi et al. (2020) found weak evidence, introducing an element of uncertainty into the existing body of knowledge.
Furthermore, it is noteworthy that most of these studies have predominantly focused on international or developed economies. In contrast, our research concentrates on a relatively nascent emerging market, specifically the Pakistan Mercantile Exchange (PMEX). Specifically, the current study investigates two primary research questions: firstly, whether commodity prices co-move on the PMEX; secondly, whether the relationship between commodities is long-term or short-term. To the best of our knowledge, this market has not been explored in previous studies. This shift in focus allows us to contribute new perspectives and insights into the co-movement of commodity prices in an underexplored context, offering a unique and valuable contribution to the existing body of research.
Established in 2002 and commencing operations in May 2007, the Pakistan Mercantile Exchange (PMEX) stands as the pioneering commodity futures market in the country. Offering a diverse range of domestic and foreign products across various asset classes, the PMEX holds the distinction of being the first institution in Pakistan to provide a centralized and regulated platform for trading in commodity futures. Regulated by the Securities and Exchange Commission of Pakistan (SECP), the PMEX plays a crucial role in shaping the landscape of futures trading in the nation. The PMEX facilitates trading in a comprehensive range of international and domestic commodities, as well as financial futures. The exchange offers a holistic suite of services, encompassing trading, clearing, settlement, and administration, effectively functioning as a one-stop-shop for market participants. Currently, the PMEX boasts a portfolio of more than 20 different commodities, organized into four distinct asset classes: agriculture, energy, metal, and financial futures. In addition to its domestic operations, the PMEX has garnered international affiliations, holding memberships in prominent bodies such as the Future Industry Association (FIA) and the Association of Futures Markets (AFM). This global connectivity positions the PMEX as a key player in the international futures market arena, fostering collaboration and exchange of expertise in the dynamic field of commodity trading.
This study makes several significant contributions. Firstly, it addresses a notable gap in the existing literature by examining the co-movement of commodity prices and the role of market liquidity in Pakistan, with a specific focus on the PMEX. The absence of prior research on commodity prices in Pakistan emphasizes the urgency of this study.
Secondly, this research contributes to the growing body of literature on commodity price co-movements. It expands our understanding of how commodities behave in the Pakistani market.
Thirdly, the findings of this study hold valuable insights for both policymakers and investors. Policymakers should consider formulating sector-specific policies rather than adopting a one-size-fits-all approach. Investors can leverage the PMEX by implementing sector-specific investment strategies. For instance, commodities in the metal sector may serve as hedges against each other, whereas the oil sector may not offer similar opportunities. Additionally, intra-sector hedging prospects are also available.
This paper is structured as follows: First, the relevant literature is reviewed, providing context and a foundation for the study. Then, the data and methodology employed for the analysis are presented in detail. Following this, the results of the study are presented and discussed, exploring their implications. Finally, the paper concludes with our key findings and recommendations.

2. Literature Review

Commodity prices often move together due to shifts in macroeconomic factors impacting demand and/or supply across various commodity categories. These shifts can influence prices in two primary ways. Firstly, macroeconomic changes directly affect commodity demand and supply; for instance, increased industrial production rates boost demand for industrial commodities, like copper and crude oil, as well as non-industrial commodities, like wheat, due to income growth. Secondly, macroeconomic variables shape expectations about future supply and demand, influencing current prices. With storable commodities, expectations about future market conditions drive current pricing through storage demand (Pindyck and Rotemberg 1990). Exploring this co-movement is crucial, as it holds significant welfare implications for both commodity importers and exporters (Byrne et al. 2013). The study by (Cashin et al. 2002) highlighted that movements in commodity prices exhibit cyclical patterns, emphasizing this as a fundamental aspect of their evolution. They emphasize that these repetitive cycles hold significant consequences for many developing nations relying on commodity exports, as price fluctuations can cause income instability for these countries.
In addition to countries, the co-movement of commodity prices holds equal significance for investors, who can utilize these trends for efficient portfolio diversification strategies. Consequently, researchers have extensively examined the role of commodities in diversifying portfolios (e.g., Cai et al. 2018; Fernández-Avilés et al. 2020; Gagnon et al. 2020; Mensi et al. 2020). Studies by (Fernández-Avilés et al. 2020) and (Gagnon et al. 2020) highlight commodities low correlation with other assets and potential diversification benefits for investors. However, the extent of these benefits varies depending on the chosen index, as noted by (Gagnon et al. 2020). Moreover, evidence from the studies of (Daskalaki and Skiadopoulos 2011; Fernandez 2015; Umar et al. 2020) deny the diversification benefits. An additional body of literature investigates the diversification advantages of commodities, particularly in conjunction with the emerging asset class of cryptocurrencies. This is evidenced by studies such as those by (Ji et al. 2019; Mo et al. 2022; Naeem et al. 2020; Okorie and Lin 2020; Aivaz et al. 2023; Bouazizi et al. 2023).
The increased correlations observed in commodity markets are often attributed to the “financialization” trend. This refers to the growing presence of financial institutions and instruments, like derivatives and index funds, in markets traditionally dominated by physical trade (Tang and Xiong 2012). While some argue financialization reduces diversification benefits by tightening market linkages (Tang and Xiong 2012), others suggest it merely reflects existing market features rather than causing the increased co-movements themselves (Zaremba et al. 2021).
Studies like the one by (Rehman and Vo 2021) explore these co-movements, finding low to moderate integration in the short-to-medium term but increased connectedness in the long term, particularly during bearish or normal market conditions. In the study by (Bouri et al. 2023), they also observed weakened short-term correlations and stronger long-term correlations among commodity prices. This suggests short-term diversification benefits that may dwindle in the long run.
One potential limitation exists in the current research, i.e., a focus on developed markets by various researchers (e.g., Abid et al. 2019; Bouri et al. 2023; Fry-McKibbin and McKinnon 2023; Gagnon et al. 2020). This niche focus limits the broader applicability of these findings. The current research on commodity co-movement in emerging markets is insufficient, particularly for countries like Pakistan. The co-movement of commodity prices is poised to exert significant inflationary pressure on countries reliant on importing commodities (Byrne et al. 2013). Given Pakistan’s status as a significant importer of various commodities, such as oil, gold, and silver, the urgency of investigating the co-movement of Pakistani commodities is reinforced.
Recognizing that the existing research on the PMEX, such as the study by (Shear 2021), primarily explores specific aspects like the role of speculative trading, this study aims to fill a critical gap in understanding the broader phenomenon of co-movement across diverse commodities in Pakistan. By investigating these relationships, this research will contribute valuable insights to portfolio diversification strategies and risk management practices in the emerging Pakistani market.

3. Data and Methodology

Currently, the PMEX offers an array of more than 20 commodities, comprising a total of 40-plus future contracts with varying values. These commodities fall into four distinct classes: agriculture, energy, metal and financials. From the agriculture category, we have selected the international cotton commodity. The energy class includes brent crude Oil, crude oil, and natural gas. Within the metal class, our selection encompasses gold, copper, silver, and platinum. For our analysis, we specifically chose the eight most liquid contracts among these commodities, reflecting those with the highest trading activity in the market. Our data collection spans from 13 January 2013 to 20 August 2020 and was sourced from the official PMEX website daily. This dataset provides a comprehensive overview of the market dynamics and price movements over this time frame, allowing for a detailed examination of the selected commodities and their respective contracts.

Model

The autoregressive distributed lag (ARDL) method was introduced by Pesaran et al. (1999) and expanded by Pesaran et al. (2001). The ARDL’s unique strength, i.e., its ability to handle different lag structures across variables (Menegaki 2019) is the primary motivation for the selection of this model. The ARDL method enables the estimation of both long-term and short-term impacts of variables on each other, regardless of whether they are integrated as different orders (I(0), I(1), or a combination of both). It remains resilient to endogeneity concerns, ensuring precise estimates even in the presence of bidirectional causal relationships among the variables. Furthermore, the ARDL approach maintains its robustness even with limited sample sizes (Derouez et al. 2024). Following previous studies on commodity market price dynamics, e.g., (Arfaoui 2018), we employed the ARDL model to investigate the relationship between commodity sport prices and liquidities, considering both the short-run and long-run effects. The following equation presents the general form of the ARDL model for the current study.
Δ Y t = β 0   + i = 1 n β i   Y t i + i = 1 n j = 1 p Φ i j Δ X j t i + j = 0 n δ j   X j t + μ t
where
  • Δ Y t is the first difference of the dependent variable Y t , i.e., spot prices/liquidities of commodities.
  • Y t i are the lagged values of Y t up to lag n.
  • Δ X j t i   are the first differences of the independent variables X j t up to lag p for j = 1, 2, … n, where n is the number of independent variables.
  • X j t   are the current values of the independent variables.
  • β 0   is the intercept term.
  • β i are the coefficients of the lagged dependent variable.
  • Φ i j are the coefficients of the lagged first differences of the independent variables.
  • δ j are the coefficients of the current values of the independent variables.
  • μ t is the error term at time t.
The initial stage of applying the ARDL method involves assessing the integration order, namely whether the variables are integrated as I(0) or I(1) or mix of both. This is determined through unit root tests, i.e., the augmented Dickey–Fuller (ADF) and Phillips–Perron (PP) tests. Following the integration order assessment, the subsequent step entails employing the ARDL bound test to investigate cointegration and analyze the long-term relationships among the variables (Pesaran et al. 2001). The ARDL bound test relies on two bounds, i.e., the lower bound and the upper bound. In the first case, I(0) is the lower bound, whereas in the second, I(1) is the upper bound. A long-run relationship will exist, and the null hypothesis of no cointegration will be rejected if the F statistic value is larger than the upper bound. The no-cointegration hypothesis is supported if the F-statistic value is smaller than the lower bound. The model is inconclusive if F is between the lower I(0) and upper bound I(1). If a long-run relationship is not detected using the ARDL methodology, the analysis can proceed to examine the short-run dynamics.
Next, we examined the correlation between liquidity and spot prices in commodities. We adopted the Amihud liquidity measure, as suggested by Marshall et al. (2012), who found it to be the best among various liquidity proxies. Our liquidity proxy, initially introduced by Amihud (2002), is formulated as follows:
Amihud = R t V O L t
where R t is the return on the asset or commodity, and V O L t is the asset or commodity trading volume at time t. The lower values of Amihud measure show higher liquidity.

4. Results and Discussion

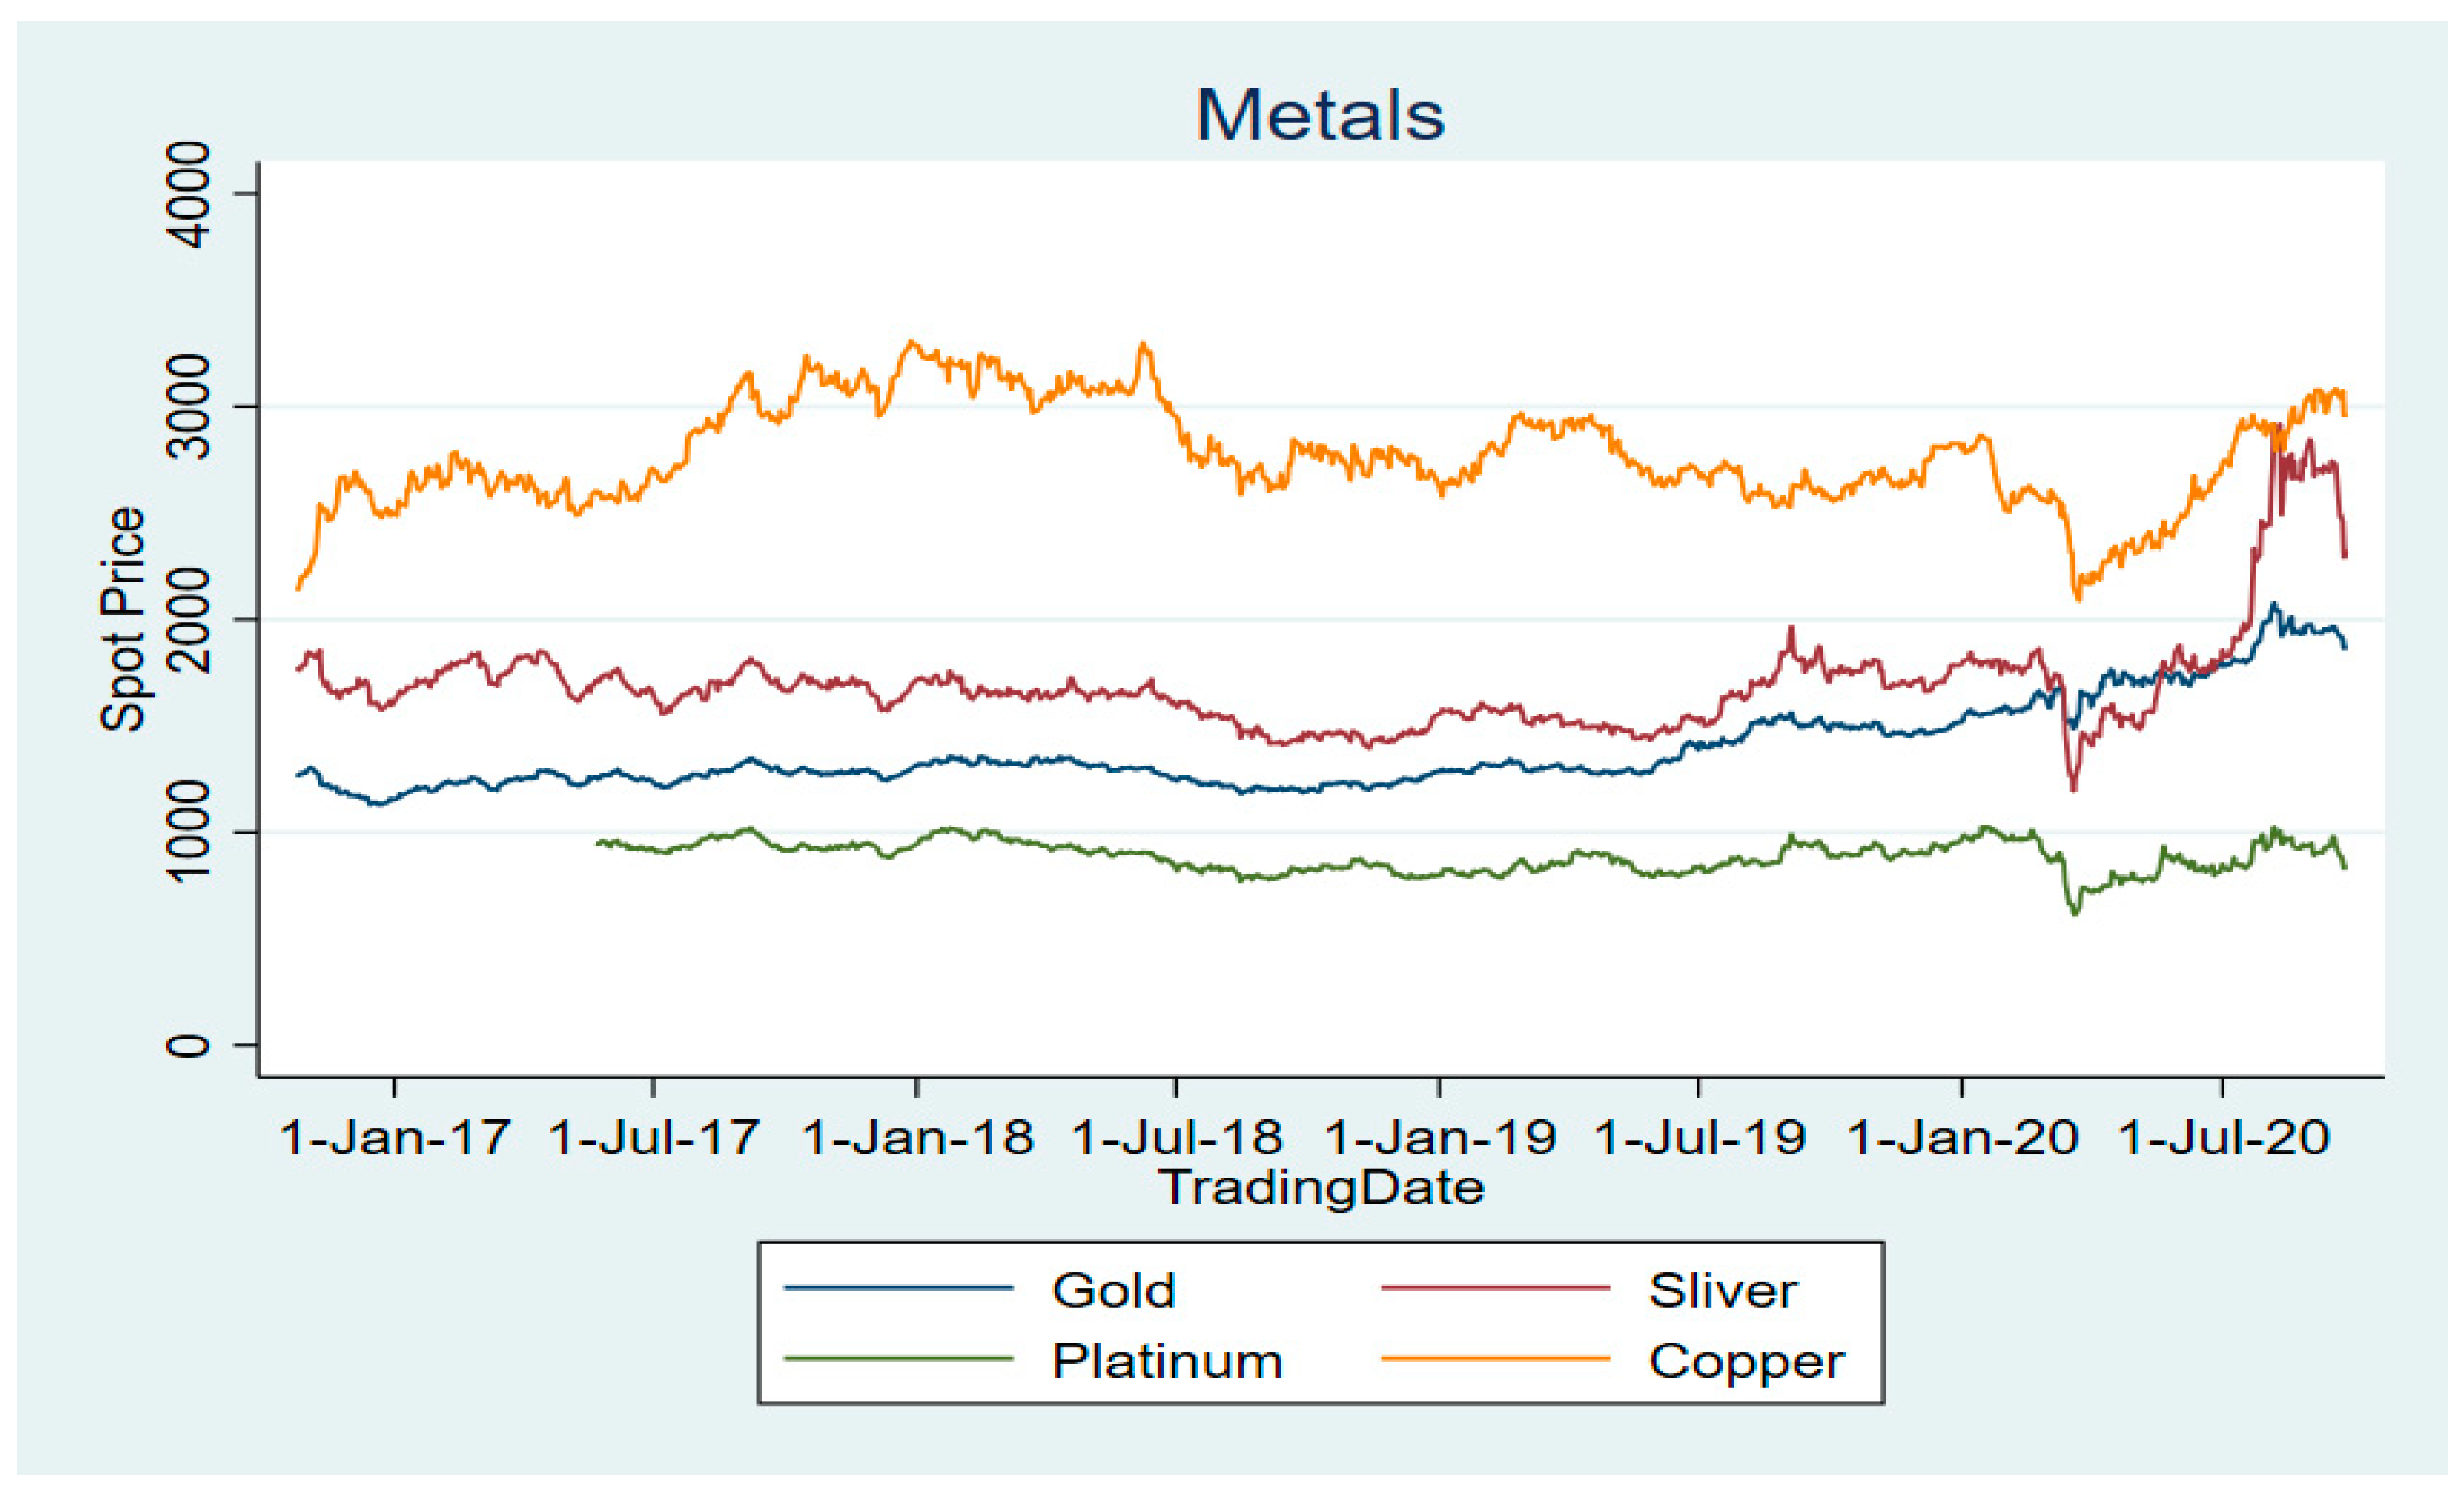
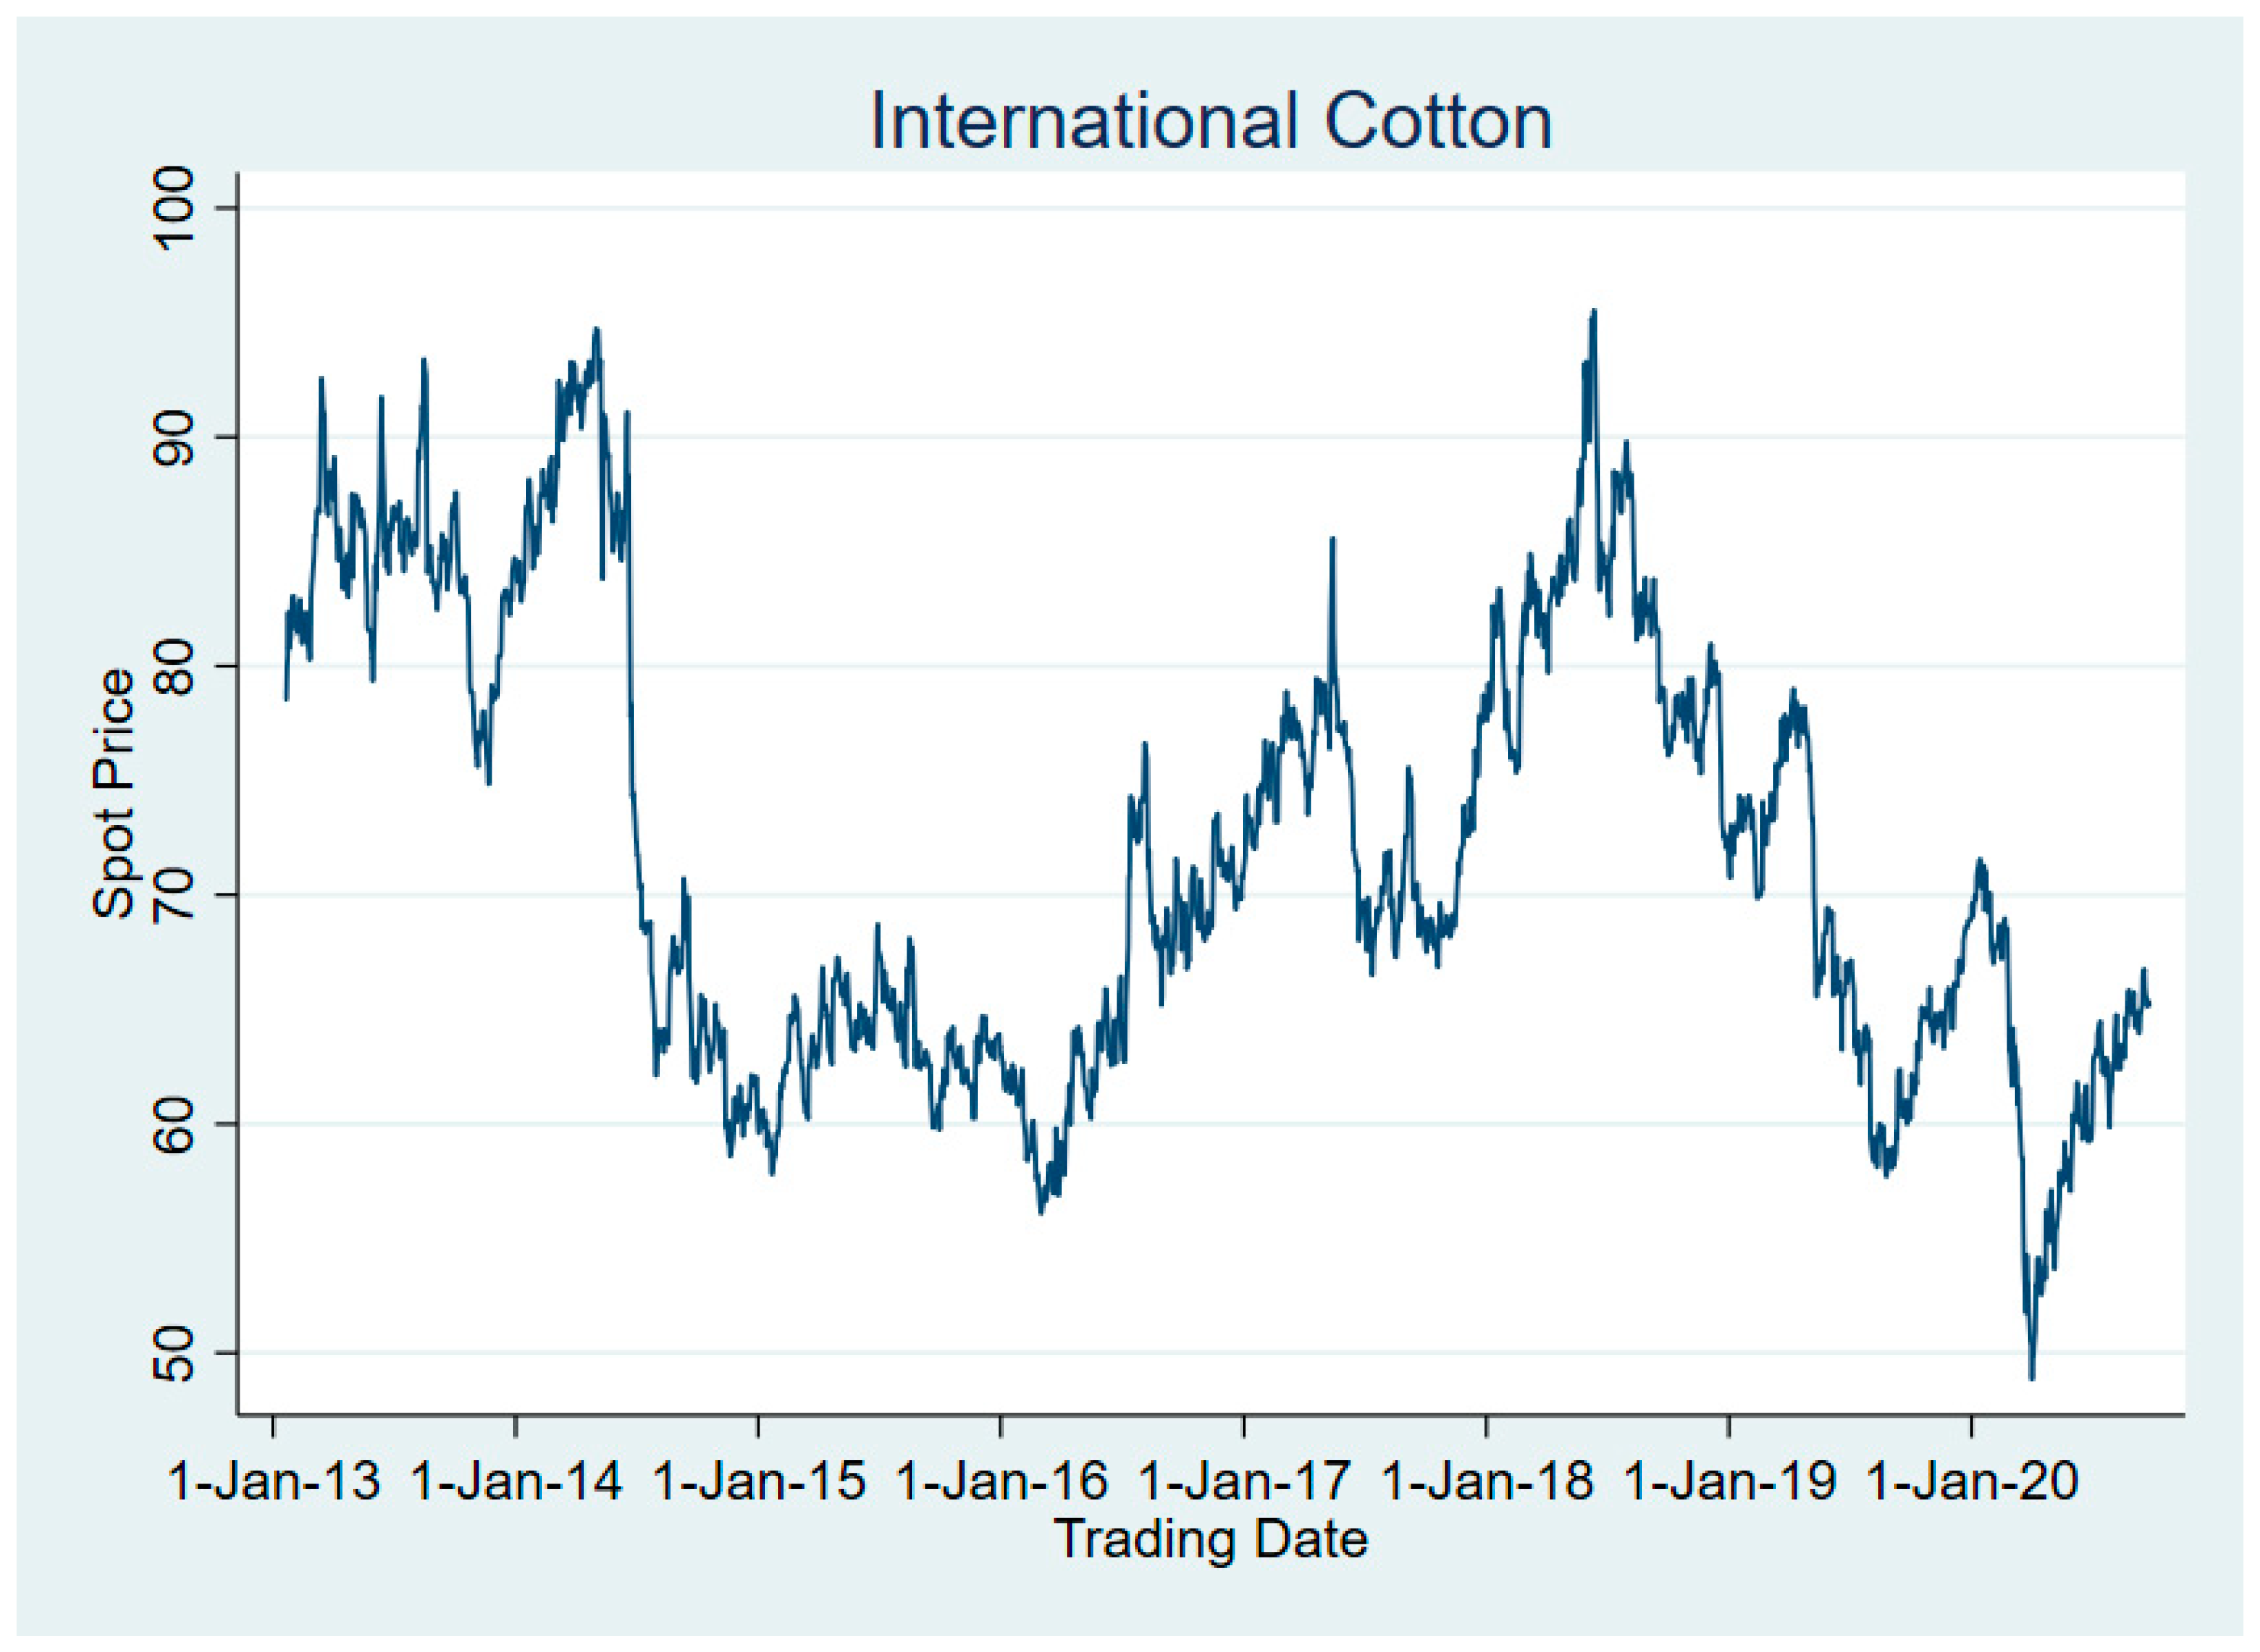
4.1. Commodity Prices Co-Movement

In this section, we present various analytical tests to examine the level of co-movement among our selected commodity prices. Firstly, we plotted sector-wise commodity spot prices in Figure 1, Figure 2 and Figure 3 below. It is evident from Figure 1 that the natural gas price does not follow the oil price closely. This hints toward low co-movement in these two energy-sector commodities. Figure 2 represents the prices of metals. It is evident that the prices of gold and silver closely follow each other. However, the prices of copper and platinum show less co-movement with those of the gold and silver.

4.2. Correlation Analysis

To glean additional insights into the co-movement of prices, we employed correlation analysis. The findings are outlined in Table 1, Table 2 and Table 3. It became apparent that within the energy sector, all commodities exhibited a positive correlation, indicating a shared price co-movement. Notably, the correlation is more pronounced within the subcategories of oil, whereas it is comparatively lower between the natural gas and both oil subcategories.
Table 2 illustrates the results of the correlation analysis of the metal sector. Notably, silver and gold display a significant positive correlation, suggesting strong co-movement in their prices. In contrast, gold exhibits a notably low and negative correlation with both platinum and copper, indicating divergent price movements. Similarly, copper demonstrates a lower correlation with silver. These observed patterns suggest that commodities within the metal sector do not uniformly co-move, highlighting distinct price dynamics within the industry.
  • Pairwise correlations
Table 2. Correlation analysis of metal sector.
Variables(1)(2)(3)(4)
(1) Gold1.000
(2) Silver0.745 *1.000
(3) Platinum0.0630.473 *1.000
(4) Copper −0.137 *0.186 *0.569 *1.000
Note: *** p < 0.01, ** p < 0.05, and * p < 0.1.
Table 3 outlines the results of the correlation analysis of various commodities of all sectors. The key findings mentioned are negative correlations of gold and silver with all commodities in the energy sector, as well as a negative correlation between gold and cotton. This implies that these commodities do not move in the same direction; when one goes up, the others tend to go down.
This result contradicts previous studies (e.g., Zhang et al. 2019) that suggested co-movements among commodities from different sectors. Co-movement generally implies a tendency for the prices of different assets to move together, either positively or negatively. In this case, the negative correlations indicate a divergent movement, suggesting that changes in the prices of gold, silver, cotton, and the energy sector’s commodities are not synchronized. These findings support the findings of Khalfaoui et al. (2021), who found low dependence between energy and non-energy commodities.
  • Pairwise correlations
Table 3. Correlation analysis across sectors.
Variables(1)(2)(3)(4)(5)(6)(7)(8)
(1) Gold1.000
(2) Silver0.745 *1.000
(3) Platinum0.0630.473 *1.000
(4) Copper −0.137 *0.186 *0.569 *1.000
(5) Crude oil −0.648 *−0.287 *0.205 *0.522 *1.000
(6) Brent oil−0.681 *−0.361 *0.112 *0.481 *0.986 *1.000
(7) Natural gas−0.719 *−0.297 *0.0600.401 *0.469 *0.502 *1.000
(8) Cotton−0.129 *0.362 *0.150 *0.516 *0.763 *0.756 *0.625 *1.000
Note: *** p < 0.01, ** p < 0.05, and * p < 0.1.

4.3. Short/Long-Term Co-Movement

To assess the short- and long-term relationships among commodity prices, the autoregressive distributed lag (ARDL) model was employed. The initial step in implementing the model involves conducting a stationarity test. Table 4 provides insights into the stationarity characteristics of various variables, determining whether they necessitate first differencing for suitability in the statistical analysis or if they are inherently stationary at their current levels.
Table 4 reveals that several variables—namely cotton, gold, silver, crude oil, brent oil, and natural gas–are not initially stationary at their current levels. However, the subsequent application of first differencing rendered them stationary, as verified by both the augmented Dickey–Fuller (ADF) and Phillips–Perron (PP) tests. In contrast, platinum and copper exhibited distinct behavior. According to the ADF and Phillips–Perron tests, platinum and copper are stationary at the 5% significance levels, indicating their suitability for analysis without requiring first differencing.
Table 5 presents the results from the cointegration ARDL1 bound test, specifically the F statistic values. The interpretation of these values is central for determining the presence of a long-term relationship or cointegration among the variables. If the F statistic surpasses the upper bound, it signals the existence of a long-term relationship among the variables. Conversely, if the F statistic falls below the lower bound, it indicates that the null hypothesis, asserting no cointegration, remains valid. In all the models examined, the F values consistently fell below the lower bound at both the 5% and 1% significance levels. This outcome implies a lack of evidence supporting co-integration among the spot prices of all commodities, except one model where crude oil is dependent. Consequently, the relationships among them are deemed to be only of a short-term nature based on the findings of the analysis. These findings are line with the findings of Yoon (2022), who found no long-term relationships among different commodity prices.
Table 6 outlines the outcomes of the short-term analysis, aligning with previous findings. The results suggest that, consistent with earlier observations, all commodities examined do not play a role in influencing the pricing of other commodities in the long run, but the majority of the variables have short-term relationships with each other, except natural gas. This implies a degree of independence among the commodities in the long-term, reinforcing the notion that they do not exhibit co-movement within the Pakistani commodity market. These findings contradict the findings of Chen et al. (2019), while these findings support the findings of Bouri et al. (2023). These findings contribute to a robust understanding of the market dynamics, emphasizing the lack of interdependence among the various commodities under consideration.
Table 7 presents the results from the cointegration ARDL bound test for liquidity of commodities, specifically the F statistic values. It is evident that the liquidity of cotton and copper have long-term relationship with the liquidity of other commodities at a 1% level of significance. If we consider the lower levels of significance, then we can find a long-term liquidity cointegration of crude oil and natural gas at a 5% level of significance. The platinum, brent oil, and natural gas liquidity have short-term relationships with other commodities’ liquidities. These findings show that the liquidities of all commodities do not co-move in the long-term.
Table 8 presents the outcomes of examining the interrelation of the liquidity levels across various commodities. It reveals that platinum’s liquidity is influenced by the liquidity of most other commodities. In contrast, crude oil’s liquidity is the least affected by that of the other commodities. Notably, this analysis does not identify a consistent co-movement trend in the liquidities of these commodities, marking a significant deviation from the conclusions drawn by Zhang et al. (2019).
Table 9 displays the ARDL bound test results for the cointegration between prices and liquidity across various commodities. The findings reveal that for all examined commodities, the F-statistic values are below the critical lower bound at the 1% significance level. This suggests that there is insufficient evidence of long-term co-integration between the spot prices and liquidity of the commodities studied. Therefore, it is inferred that their relationships are predominantly short-term.
Table 10 presents the results of the short-run analysis examining the relationship between the price and liquidity of various commodities. Consistent with previous findings, the analysis indicates that the liquidities of the commodities under study do not significantly influence their pricing. This suggests a relative independence among these commodities, supporting the idea that they do not exhibit synchronized movements within the Pakistani commodity market. These results contrast with the findings of (Zhang and Ding 2018; Zhang et al. 2019; Zhang and Ding 2021), which suggest that liquidity does affect commodity spot prices.

5. Discussion

The correlation analysis explored whether commodity prices exhibit co-movement on the PMEX. The findings reveal distinct patterns of correlation among commodities within different sectors, shedding light on their interconnectedness. In the energy sector, all commodities show a positive correlation, signaling shared price movements. Specifically, the oil subcategories exhibit stronger correlations compared to natural gas, implying a higher degree of interdependence among oil commodities. Natural gas, on the other hand, demonstrates weaker correlations, suggesting it may serve as a less effective diversifier within this sector. In contrast, the metal sector displays more varied correlation patterns, with significant positive correlations observed between silver and gold, suggesting strong co-movement in their prices. Gold displays significantly negative correlations with platinum and copper, suggesting that these commodities serve as strong diversifiers against gold. Likewise, copper exhibits a lower correlation with silver, indicating potential diversification opportunities between these two commodities. Additionally, cross-sector analysis uncovered negative correlations of gold and silver with all energy sector commodities, as well as a negative correlation between gold and cotton, indicating distinct diversification opportunities away from gold. These findings indicate varied movements among commodities, consistent with prior research such as that by (Daskalaki et al. 2014) for international markets and by (Gagnon et al. 2020) for the Canadian market. However, the findings contrast with earlier studies, such as that by (Byrne et al. 2013) for international commodities and (Chen et al. 2021) for China, which proposed co-movements across different sectors.
This study employed the autoregressive distributed lag (ARDL) model to investigate whether the relationships among commodities are long-term or short-term. The results show that while some commodities, especially those in the metal sector, have short-term connections, there is little evidence of long-term co-integration among all commodities, except for crude oil in one case. These findings indicate that short-term relationships are prevalent among commodities, suggesting they tend to operate independently in terms of their pricing dynamics over extended periods. The results support the conclusions drawn by (Zaremba et al. 2021), who also found no evidence of long-term co-movements among commodities sourced from the US and UK. In contrast, these results diverge from those of (Bouri et al. 2023), who identified a notable correlation among commodities in the long-run for the Chicago Mercantile Exchange’s commodities.
The examination of liquidity levels across various commodities also provides valuable insights into market dynamics. The results reveal varying degrees of influence among commodities, with platinum’s liquidity being influenced by the liquidity of most other commodities. However, crude oil’s liquidity appears to be less affected by other commodities, suggesting unique liquidity dynamics within the market. This study further examines how liquidity influences commodity prices. It concludes that, except for platinum, there is not a long-term relationship between commodity prices and liquidity. Additionally, the short-term impact of liquidity on prices is less evident, particularly at higher levels of significance. These results challenge previous research, such as that by (Zhang and Ding 2018; Zhang et al. 2019; Zhang and Ding 2021), which highlighted the importance of liquidity in determining commodity prices.
In comparing the findings between the Pakistani commodity market and international markets, several factors contribute to the differences observed. Firstly, the developmental stage of the Pakistani market plays a significant role. Unlike established international commodity markets, Pakistan’s market is still developing and relatively young. Secondly, the unique economic conditions in Pakistan, including its status as a net importer of most commodities, contribute to distinct market behaviors. This economic context influences demand–supply dynamics and price movements within the Pakistani market. Lastly, the lower level of integration between the Pakistani market and global markets is a key factor. This limited linkage means that external factors impacting international markets may have less influence on the Pakistani market, leading to discrepancies in the results.
Our findings yield two significant implications. Firstly, investors should acknowledge the shared price movements among commodities within sectors like energy and metals, leveraging diversification opportunities to manage risks effectively. For example, the diverse co-movement patterns in the metal sector suggest potential for strategic investment choices that balance risk and return. It is crucial to consider both short-term and long-term perspectives, as certain commodities may exhibit different dynamics over time. Understanding the varying degrees of liquidity influence among commodities is also vital for informed trading decisions. Secondly, for policymakers, these findings emphasize the importance of sector-specific approaches in formulating commodity market regulations and interventions. Moreover, contrary to conventional wisdom, liquidity cannot reliably indicate incipient inflation and may not be used to effectively control inflation risk.

6. Conclusions

In this study, we examined the commodity price co-movements within three key sectors—energy, metals, and agriculture—in the specific context of Pakistan. We employed data from 13 January 2013 to 20 August 2020 and used correlation analysis and an autoregressive distributed lag (ARDL) model. In the energy sector, we observed a weak co-movement between oil and natural gas. The metal sector exhibited mixed results, with gold and silver showing a strong positive correlation, whereas gold exhibited a negative correlation with both platinum and copper, indicating divergent price movements. In the agriculture sector, cotton had a negative correlation with gold but a positive correlation with other metals and energy sector commodities. These findings suggest that commodities within and across sectors do not uniformly co-move, highlighting distinct price dynamics within industries.
Our findings contradict some previous studies, such as that of Zhang et al. (2019), suggesting more complex and sector-specific co-movement patterns. The application of the ARDL bound test indicated a lack of long-term co-integration among the spot prices of commodities, with relationships appearing to be predominantly short-term. This reinforces the notion of independent pricing dynamics among different commodities in the Pakistani market, deviating from the results of other studies like that of Chen et al. (2019) and aligning more with Bouri et al. (2023)’s conclusions.
These findings have important implications for portfolio diversification and optimization. The higher correlations among commodities limit diversification benefits. However, the weak linkages observed in Pakistan indicate that including Pakistani commodities in an internationally diversified portfolio could offer greater risk mitigation potential than previously thought.
One shortcoming of our analysis is that we focused on a few sectors. The connectedness of commodities with financial or real estate sector assets was unexplored. Thus, our analysis is unable to reveal the broader market dynamics and interrelations.
Future studies may incorporate more sectors to study the connectedness of asset prices. Another potential area for future research is to explore the impact of national-level factors, such as financialization or government policies, on commodity price co-movements. Comparative analysis with other emerging markets could reveal broader trends and potential changes in co-movement patterns.

Author Contributions

Conceptualization, F.S. and M.B.; methodology, F.S. and M.B.; software, F.S., N.A. and M.B.; validation, N.A. and B.N.A.; formal analysis F.S., N.A. and M.B.; data curation, F.S. and M.B.; writing—original draft preparation, F.S. and B.N.A.; writing—review and editing, F.S. and B.N.A.; supervision, B.N.A. All authors have read and agreed to the published version of the manuscript.

Funding

This research received no external funding.

Data Availability Statement

The data is available upon request.

Conflicts of Interest

The authors declare no conflicts of interest.

Note

1
Optimal lags are based on AIC criteria for all estimations.

References

  1. Abid, Ilyes, Abderrazak Dhaoui, Stéphane Goutte, and Khaled Guesmi. 2019. Hedging and diversification across commodity assets. Applied Economics 52: 2472–92. [Google Scholar] [CrossRef]
  2. Aivaz, Kamer-Ainur, Ionela Florea Munteanu, and Flavius Valentin Jakubowicz. 2023. Bitcoin in Conventional Markets: A Study on Blockchain-Induced Reliability, Investment Slopes, Financial and Accounting Aspects. Mathematics 11: 4508. [Google Scholar] [CrossRef]
  3. Amihud, Yakov. 2002. Illiquidity and stock returns: Cross-section and time-series effects. Journal of Financial Markets 5: 31–56. [Google Scholar] [CrossRef]
  4. Arfaoui, Mongi. 2018. On the spot-futures relationship in crude-refined petroleum prices: New evidence from an ARDL bounds testing approach. Journal of Commodity Markets 11: 48–58. [Google Scholar] [CrossRef]
  5. Bhar, Ramaprasad, and Shigeyuki Hamori. 2008. Information content of commodity futures prices for monetary policy. Economic Modelling 25: 274–83. [Google Scholar] [CrossRef]
  6. Bouazizi, Tarek, Emilios Galariotis, Khaled Guesmi, and Panagiota Makrychoriti. 2023. Investigating the nature of interaction between crypto-currency and commodity markets. International Review of Financial Analysis 88: 102690. [Google Scholar] [CrossRef]
  7. Bouri, Elie, Ramzi Nekhili, and Neda Todorova. 2023. Dynamic co-movement in major commodity markets during crisis periods: A wavelet local multiple correlation analysis. Finance Research Letters 55: 103996. [Google Scholar] [CrossRef]
  8. Byrne, Joseph P., Giorgio Fazio, and Norbert Fiess. 2013. Primary commodity prices: Co-movements, common factors and fundamentals. Journal of Development Economics 101: 16–26. [Google Scholar] [CrossRef]
  9. Cai, Xiao Jing, Zheng Fang, Youngho Chang, Shuairu Tian, and Shigeyuki Hamori. 2018. Co-movements in commodity markets and implications in diversification benefits. Empirical Economics 58: 393–425. [Google Scholar] [CrossRef]
  10. Cashin, Paul, C John McDermott, and Alasdair Scott. 2002. Booms and slumps in world commodity prices. Journal of Development Economics 69: 277–96. [Google Scholar] [CrossRef]
  11. Chen, Zhan-Ming, Liyuan Wang, Xiao-Bing Zhang, and Xinye Zheng. 2019. The co-movement and asymmetry between energy and grain prices: Evidence from the crude oil and corn markets. Energies 12: 1373. [Google Scholar] [CrossRef]
  12. Chen, Peng, Limin He, and Xuan Yang. 2021. On interdependence structure of China’s commodity market. Resources Policy 74: 102256. [Google Scholar] [CrossRef]
  13. Clarida, Richard, Jordi Galı, and Mark Gertler. 1998. Monetary policy rules in practice: Some international evidence. European Economic Review 42: 1033–67. [Google Scholar] [CrossRef]
  14. Cody, Brian J, and Leonard O Mills. 1991. The role of commodity prices in formulating monetary policy. The Review of Economics and Statistics 73: 358–65. [Google Scholar] [CrossRef]
  15. Daskalaki, Charoula, Alexandros Kostakis, and George Skiadopoulos. 2014. Are there common factors in individual commodity futures returns? Journal of Banking & Finance 40: 346–63. [Google Scholar] [CrossRef]
  16. Daskalaki, Charoula, and George Skiadopoulos. 2011. Should investors include commodities in their portfolios after all? New evidence. Journal of Banking & Finance 35: 2606–26. [Google Scholar] [CrossRef]
  17. Derouez, F., A. Ifa, A. A. Aljughaiman, M. Bu Haya, A. Lutfi, M. Alrawad, and S. Bayomei. 2024. Energy, technology, and economic growth in Saudi Arabia: An ARDL and VECM analysis approach. Heliyon 10: e26033. [Google Scholar] [CrossRef] [PubMed]
  18. Ding, Shusheng, and Yongmin Zhang. 2020. Cross market predictions for commodity prices. Economic Modelling 91: 455–62. [Google Scholar] [CrossRef]
  19. Dospinescu, Octavian, and Nicoleta Dospinescu. 2018. A profitability regression model of Romanian stock exchange’s energy companies. Paper presented at the 17th International Conference on Informatics in Economy Education, Research & Business Technologies, Iasi, Romania, May 17–20. [Google Scholar]
  20. Farid, Saqib, Sitara Karim, Muhammad A. Naeem, Rabindra Nepal, and Tooraj Jamasb. 2023. Co-movement between dirty and clean energy: A time-frequency perspective. Energy Economics 119: 106565. [Google Scholar] [CrossRef]
  21. Fernandez, Viviana. 2015. Influence in commodity markets: Measuring co-movement globally. Resources Policy 45: 151–64. [Google Scholar] [CrossRef]
  22. Fernández-Avilés, Gema, José-María Montero, and Lidia Sanchis-Marco. 2020. Extreme downside risk co-movement in commodity markets during distress periods: A multidimensional scaling approach. The European Journal of Finance 26: 1207–37. [Google Scholar] [CrossRef]
  23. Flori, Andrea, Fabio Pammolli, and Alessandro Spelta. 2021. Commodity prices co-movements and financial stability: A multidimensional visibility nexus with climate conditions. Journal of Financial Stability 54: 100876. [Google Scholar] [CrossRef]
  24. Fry-McKibbin, Renée, and Kate McKinnon. 2023. The evolution of commodity market financialization: Implications for portfolio diversification. Journal of Commodity Markets 32: 100360. [Google Scholar] [CrossRef]
  25. Gagnon, Marie-Hélène, Guillaume Manseau, and Gabriel J. Power. 2020. They’re back! Post-financialization diversification benefits of commodities. International Review of Financial Analysis 71: 101515. [Google Scholar] [CrossRef] [PubMed]
  26. Hollstein, Fabian, Marcel Prokopczuk, Björn Tharann, and Chardin Wese Simen. 2021. Predictability in commodity markets: Evidence from more than a century. Journal of Commodity Markets 24: 100171. [Google Scholar] [CrossRef]
  27. Janzen, Joseph P, Aaron Smith, and Colin A Carter. 2018. Commodity price comovement and financial speculation: The case of cotton. American Journal of Agricultural Economics 100: 264–85. [Google Scholar] [CrossRef]
  28. Ji, Qiang, Elie Bouri, David Roubaud, and Ladislav Kristoufek. 2019. Information interdependence among energy, cryptocurrency and major commodity markets. Energy Economics 81: 1042–55. [Google Scholar] [CrossRef]
  29. Khalfaoui, Rabeh, Eduard Baumöhl, Suleman Sarwar, and Tomáš Výrost. 2021. Connectedness between energy and nonenergy commodity markets: Evidence from quantile coherency networks. Resources Policy 74: 102318. [Google Scholar] [CrossRef]
  30. Liu, Zhenhua, Qiang Ji, Pengxiang Zhai, and Zhihua Ding. 2023. Asymmetric and time-frequency volatility connectedness between China and international crude oil markets with portfolio implications. Research in International Business and Finance 66: 102039. [Google Scholar] [CrossRef]
  31. Marshall, Ben R, Nhut H Nguyen, and Nuttawat Visaltanachoti. 2012. Commodity liquidity measurement and transaction costs. The Review of Financial Studies 25: 599–638. [Google Scholar] [CrossRef]
  32. Menegaki, Angeliki N. 2019. The ARDL method in the energy-growth nexus field; best implementation strategies. Economies 7: 105. [Google Scholar] [CrossRef]
  33. Mensi, Walid, Mobeen Ur Rehman, and Xuan Vinh Vo. 2020. Spillovers and co-movements between precious metals and energy markets: Implications on portfolio management. Resources Policy 69: 101836. [Google Scholar] [CrossRef]
  34. Mo, Bin, Juan Meng, and Liping Zheng. 2022. Time and frequency dynamics of connectedness between cryptocurrencies and commodity markets. Resources Policy 77: 102731. [Google Scholar] [CrossRef]
  35. Naeem, Muhammad Abubakr, Saqib Farid, Faruk Balli, and Syed Jawad Hussain Shahzad. 2020. Hedging the downside risk of commodities through cryptocurrencies. Applied Economics Letters 28: 153–60. [Google Scholar] [CrossRef]
  36. Okorie, David Iheke, and Boqiang Lin. 2020. Crude oil price and cryptocurrencies: Evidence of volatility connectedness and hedging strategy. Energy Economics 87: 104703. [Google Scholar] [CrossRef]
  37. Pesaran, M. Hashem, Yongcheol Shin, and Richard J. Smith. 2001. Bounds testing approaches to the analysis of level relationships. Journal of Applied Econometrics 16: 289–326. [Google Scholar] [CrossRef]
  38. Pesaran, M. Hashem, Yongcheol Shin, and Ron P. Smith. 1999. Pooled mean group estimation of dynamic heterogeneous panels. Journal of the American statistical Association 94: 621–34. [Google Scholar] [CrossRef]
  39. Pham, Son Duy, Thao Thac Thanh Nguyen, and Hung Xuan Do. 2023. Natural gas and the utility sector nexus in the U.S.: Quantile connectedness and portfolio implications. Energy Economics 120: 106632. [Google Scholar] [CrossRef]
  40. Pindyck, Robert S, and Julio J Rotemberg. 1990. The excess co-movement of commodity prices. The Economic Journal 100: 1173–89. [Google Scholar] [CrossRef]
  41. Rehman, Mobeen Ur, and Xuan Vinh Vo. 2021. Energy commodities, precious metals and industrial metal markets: A nexus across different investment horizons and market conditions. Resources Policy 70: 101843. [Google Scholar] [CrossRef]
  42. Shear, Falik. 2021. Speculation and returns’ volatility: Evidence from Pakistan Mercantile Exchange. IBA Business Review 15: 75–85. [Google Scholar] [CrossRef]
  43. Tang, Ke, and Wei Xiong. 2012. Index investment and the financialization of commodities. Financial Analysts Journal 68: 54–74. [Google Scholar] [CrossRef]
  44. Umar, Zaghum, Adam Zaremba, and Dennis Olson. 2020. Seven centuries of commodity co-movement: A wavelet analysis approach. Applied Economics Letters 29: 355–59. [Google Scholar] [CrossRef]
  45. Wimmer, Thomas, Jerome Geyer-Klingeberg, Marie Hütter, Florian Schmid, and Andreas Rathgeber. 2021. The impact of speculation on commodity prices: A Meta-Granger analysis. Journal of Commodity Markets 22: 100148. [Google Scholar] [CrossRef]
  46. Yoon, Seong-Min. 2022. On the interdependence between biofuel, fossil fuel and agricultural food prices: Evidence from quantile tests. Renewable Energy 199: 536–45. [Google Scholar] [CrossRef]
  47. Zaremba, Adam, Zaghum Umar, and Mateusz Mikutowski. 2021. Commodity financialisation and price co-movement: Lessons from two centuries of evidence. Finance Research Letters 38: 101492. [Google Scholar] [CrossRef]
  48. Zhang, Yongmin, and Shusheng Ding. 2018. Return and volatility co-movement in commodity futures markets: The effects of liquidity risk. Quantitative Finance 18: 1471–86. [Google Scholar] [CrossRef]
  49. Zhang, Yongmin, and Shusheng Ding. 2021. Liquidity effects on price and return co-movements in commodity futures markets. International Review of Financial Analysis 76: 101796. [Google Scholar] [CrossRef]
  50. Zhang, Yongmin, Shusheng Ding, and Eric M. Scheffel. 2019. A key determinant of commodity price Co-movement: The role of daily market liquidity. Economic Modelling 81: 170–80. [Google Scholar] [CrossRef]
Figure 1. Spot prices of energy sector.
Risks 12 00086 g001
Figure 2. Spot prices of metal sector.
Risks 12 00086 g002
Figure 3. Spot prices of agricultural sector.
Risks 12 00086 g003
Table 1. Correlation analysis of energy sector.
Variables(1)(2)(3)
(1) Crude oil 1.000
(2) Brent oil0.986 *1.000
(3) Natural gas0.469 *0.502 *1.000
Note: *** p < 0.01, ** p < 0.05, and * p < 0.1.
Table 4. Unit root tests.
VariablesADF TestPP Test
At Level1st DifferenceAt Level1st Difference
Cotton−2.334−45.477 ***−2.319−45.474 ***
Gold−0.883−48.078 ***−0.860−48.073 ***
Silver−2.039−50.561 ***−2.022−50.505 ***
Platinum−2.990 **−27.446 ***−3.198 **−27.426 ***
Copper−3.007 **−34.078 ***−2.963 **−34.043 ***
Crude oil−1.293−29.629 ***−1.388−29.661 ***
Brent oil−1.098−29.328 ***−1.211−29.381 ***
Natural gas−2.399−29.817 ***−2.305−29.821 ***
Note: *** and ** represent 1% and 5% levels of significance, respectively.
Table 5. Co-integration tests.
Model for EstimationF-StatisticsLower–Upper Bound
at 1%
Lower–Upper Bound
at 5%
Cotton2.4263.15–4.432.45–3.61
Gold1.8433.15–4.432.45–3.61
Silver2.0163.15–4.432.45–3.61
Platinum1.3963.15–4.432.45–3.61
Copper2.3333.15–4.432.45–3.61
Crude oil1.8923.15–4.432.45–3.61
Natural gas1.0763.15–4.432.45–3.61
Table 6. The ARDL model estimations for spot prices, with dependent variables listed in the first column, and independent variables in the subsequent columns.
Dependent VariableCottonGoldSilverPlatinumCopperCrude OilNatural Gas
Cotton---0.0105.620--
(0.004)(0.000)
Gold--27.9520.156−28.430−0.856-
(0.000)(0.000)(0.006)(0.001)
Silver0.0280.014-0.0080.5770.012-
(0.004)(0.000)(0.000)(0.011)(0.050)
Platinum1.0050.18619.196-69.4540.954-
(0.004)(0.000)(0.000)(0.000)(0.001)
Copper0.0060.0000.0130.001-0.005-
(0.000)(0.006)(0.011)(0.000)(0.000)
Crude oil-−0.0140.3970.0148.048--
(0.001)(0.050)(0.001)(0.000)
Natural gas-------
Note: Only significant values have been reported in the table. Insignificant values are represented by “-”. p values are in parentheses.
Table 7. Co-integration tests for liquidity.
Model for EstimationF-StatisticsLower–Upper Bound
at 1%
Lower–Upper Bound
at 5%
Cotton6.8992.96–4.262.32–3.50
Gold2.6872.96–4.262.32–3.50
Silver3.0292.96–4.262.32–3.50
Platinum2.1052.96–4.262.32–3.50
Copper46.5622.96–4.262.32–3.50
Crude oil3.8542.96–4.262.32–3.50
Brent oil0.3252.96–4.262.32–3.50
Natural gas3.7062.96–4.262.32–3.50
Table 8. The ARDL model estimations for liquidity, with dependent variables listed in the first column and independent variables in the subsequent columns.
Dependent VariablesCottonGoldSilverPlatinumCopperCrude OilBrent OilNatural Gas
Cotton--3.6028.811----
(0.022)(0.087)
Gold--0.009 0.0020.134 (0.000)
0.000 (0.028)(0.094)(0.049)
Silver-15.688--0.025---
0.000(0.055)
Platinum0.002−2.1110.048-0.010--0.002
(0.087)(0.006)(0.035)(0.004)(0.079)
Copper 12.6030.874-----
(0.028)0.000-
Crude oil ------0.0030.000
(0.003)(0.004)
Brent oil-----15.943-−0.011
-----(0.003)-(0.041)
NATURAL GAS−0.193−124.3313.199---−2.032-
(0.029)(0.063)(0.084)(0.041)
Note: Only significant values are reported in the table. Insignificant values are represented by “-”. p values are in parentheses.
Table 9. Co-integration tests for price and liquidity.
Model for EstimationF-StatisticsLower–Upper Bound at 1%Lower–Upper Bound at 5%
Cotton1.5572.79–4.102.22–3.39
Gold0.3642.79–4.102.22–3.39
Silver1.3832.79–4.102.22–3.39
Platinum2.3752.79–4.102.22–3.39
Copper0.6532.79–4.102.22–3.39
Crude oil1.2952.79–4.102.22–3.39
Brent oil1.2552.79–4.102.22–3.39
Natural gas1.2252.79–4.102.22–3.39
Table 10. The ARDL model estimations for spot prices and liquidity, with dependent variables (spot price) listed in the first column and independent variables (commodities’ liquidities) in the subsequent columns.
Dependent VariablesCottonGoldSilverPlatinumCopperCrude OilBrent OilNatural Gas
Cotton-455.200−16.724−45.974----
(0.068)(0.004)(0.070)
Gold-------−7.923
(0.043)
Silver-------0.160
(0.013)
Platinum------111.1817.140
(0.012)(0.032)
Copper-−19.622−0.455-----
(0.012)(0.086)
Crude oil−0.862----680.108--
(0.071)(0.084)
Brent oil ----9.373--
(0.094)
Natural gas−0.075-------
(0.015)
Note: Only significant values are reported in the table. Insignificant values are represented by “-”. p values are in parentheses.
Disclaimer/Publisher’s Note: The statements, opinions and data contained in all publications are solely those of the individual author(s) and contributor(s) and not of MDPI and/or the editor(s). MDPI and/or the editor(s) disclaim responsibility for any injury to people or property resulting from any ideas, methods, instructions or products referred to in the content.

