1. Introduction
Fraud (
Müller et al. 2014) refers to activities, techniques, or organizations that fail to conform to laws established for the welfare of the civilization’s youth. Very little has changed since the initial swindle, which transpired in approximately 300 BC. Time went on, civilization (
Koepke and Baten 2005) evolved, colonization (
Annus 2012) occurred, the commerce (
Varian 1987) surged and plummeted, but humankind’s (
Ryan and Deci 2001) most fundamental motivation remained constant. Evolution’s principles cannot be modified, no matter how sophisticated con artists are. The problem appears to come from the fact that authoritarian regimes can accomplish this, as Russia did in 2008, by erecting non-quantifiable, spectacular government bureaucracy (
Dahlström and Lapuente 2022) obstructions that rationally assume and come to the realization that every objective, impartial, and feasible oversight is an impossible challenge of an intruder, or, as occurred in Ukraine in 2004, both stakeholders of a disagreement can paddock theirs by possessing a cadre of observers affirming or disputing the authenticity of the other’s observations.
Benford’s law (
Cai et al. 2020) can supply us with dependable data points on the overwhelming bulk of forgeries that transpire in our everyday routines, such as vote rigging, GDP falsification, credit card fraud, and income embezzlement.
The first digit law is a logarithmic (
Dehaene et al. 2008) likelihood function hypothesis for the first digits of a randomized, vast, and diversified sample. It is also known as the law of aberrant numerals or Benford’s law. The number’s first significant digit is the first non-zero digit on the far left, such as 1 for 18,297, 9 for 9099, and 0 for 0.00789545. According to the proposed Benford’s law, the chances of a given number occurring as the initial figure decrease logarithmically as the digit’s value increases from 1 to 9. The expected probability is indicated in the table below.
Mark J. Nigrini (
Nigrini 2012) was the first to use Benford’s exploratory investigation and embezzlement monitoring technique. His evaluation included cutting-edge relevant theories on Benford’s law and the intricate legal procedures surrounding fraud judgments. In his book
Investigative Analytics, published by Wiley Publishing, Mark J. Nigrini discusses utilizing tests like Benford’s rule to detect prejudices, inaccuracies, and deception in economic and electioneering data. He was hailed by the
Wall Street Journal and the national media and produced multiple research projects on Benford’s law.
As per Arno Berger as well as Theodore P. Hill’s research paper (
Berger and Hill 2020) on the unpredictability of Benford’s law, to provide accurate and persuasive findings, this principle ought to be restricted to a small number of unique datasets; alternatively, it presents a more significant number of problems than positives.
In his research report, Hill, Theodore (
Hill 1995) endeavored to outline the various implications of Benford’s law in fields like computer design, computer simulation, and the monitoring of unethical conduct in accounting reporting.
Jan H. P. Eloff’s (
Mbona and Eloff 2021) examination of Innocent Mbona was centered on providing a solution to combat malicious social networking site bots. The study found that while an equal option on an evil bot compendium violated Benford’s law, a regular intelligent sample evenly resembled it. According to the study mentioned above, the recognized possibilities in Benford’s law domain are coherent and, as a result, correspond to the data obtained by PCA as well as the randomly assigned forest methodology on a corresponding dataset.
Aleksandar Toi and Jernej Vičič’s research emphasizes implementing Benford’s law to collaborative intellectual networks (
Tošić and Vičič 2021). The report provided a unique way to assess the academic organization’s performance. The report thoroughly examines the disparities among Slovenia’s diverse and varied scientific disciplines.
Zipf’s law was initially developed to study abnormal word occurrences in linguistics, asserting that given a lexicon or analysis of the data of natural language happenings, the occurrence frequency of any phrase is inversely related to its rank in the frequency distribution table. Thus, the most commonly encountered word will occur roughly twice as consistently as the second most occurring phrase, three times as frequently as the third most occurring phrase, and so on. In the Brown Corpus of American English text, for example, the word “the” is the most commonly occurring phrase, accounting for nearly 7.0% of all happenings of the terms. The statute is designated after American cognitive scientist George Kingsley Zipf. He did not give birth to that logic or, more accurately, the law. Jean-Baptiste Estoup, a French stenographer, had acknowledged this sequence long before Zipf did. We would extend the applicability of Zipf’s Law apart from linguistics in criminology.
Silicon Valley Bank was a California state-chartered banking system headquartered in Santa Clara. It had offices in California as well as Massachusetts. Silicon Valley Bank Group owned the financial institution, a market capitalization bank investment group with operations in 15 US states and over a dozen overseas countries. Being a Bay Area regional bank, Silicon Valley Bank offered tailored solutions exclusively to the demands of the technology industry. It quickly became the largest financial institution by holdings in Silicon Valley and the chosen bank of 50 percent of all private equity startup companies. After central bank-endorsed raises in interest rates as during the 2021–2023 wage growth surge, the nation experienced a liquidity crisis on its reserves in March 2023, leading to its dissolution and confiscation by the “California Department of Financial Protection and Innovation,” its regulatory, on 10 March 2023. The “California Department of Financial Protection and Innovation” designated the “Federal Deposit Insurance Corporation” as the bank’s receiver, citing insufficient assets and financial distress. This was the second-largest banking collapse in US annals, following the collapse of Washington Mutual in 2008.
This research aims to investigate the presence of traces of any non-uniformity in the data put forward by the Silicon Valley Corporation. On a much clearer note, the main research problem subjected to here, in this article is the investigation for “Data Morphing”, in the SVB Data. Even though Benford’s Law cannot work well if the data are coarse grained, and the Stock Price data are clearly coarse-grained data, but still the time horizon for which the validation is subjected to is of 36 years, and a total of nearly 9000 entries were observed from the actual data that were put by the Silicon Valley Corporation; according to Mark J. Nigrini, Beford’s Law is well suited to work in such a longer time frame even if the data are not fine grained. The results convoluted by the Benford’s’ Law have been cross validated by Zipf’s law. Though Zipf’s Law find its usage mostly in the domains of linguistical statistics, its definition can be improved to be applied on numerical data as well.
2. Remembrance—A Dive into the Past
During the “
dot-com bubble”, a surge of information technology startups produced an infusion of revenue for Silicon Valley Bankers, known for its propensity (
Dutta et al. 2023a) to finance managers and unlucrative shareholders. In 1995, amongst 2000 clients were telecommunications pioneers
Cisco Systems (
Chen 2017) and
Bay Networks (
Bay Networks 1998). The Silicon Valley Bank relocated its offices from San Jose to Santa Clara that year. The stock price of the holding firm rose throughout the bubble but plunged 50% after it crashed. The bank expanded its presence in technological hotspots (
Yang and Yu 2020) around the globe. Ken Wilcox became CEO in 2000 and decided to keep the company’s exclusive emphasis on technology providers (
Dutta et al. 2023b;
Dutta and Saha 2022) instead of broadening into a commercial and industrial financial institution. Silicon Valley Bank explicitly joined the personal financial services sector in 2002, capitalizing on existing knowledge and ties with affluent pioneering investors and entrepreneurs. In 2003, the financial institution funded multiple high global trade deployments to Bengaluru as well as Bombay, Tel Aviv, Shanghai, and Beijing, introducing with them a deputation of two dozen Silicon Valley venture capitalist classes to satisfy financial institutions, business owners, and government representatives in preparation for the attempting to open worldwide operations. In 2004, it unveiled an internationalization strategy campaign with new offices in Bangalore, London, Beijing, and Israel. During the 2007–2008 financial crisis, the federal government invested
$235 million in Silicon Valley Bank Financial Group in compensation for preference shares and incentives underneath the “
Troubled Asset Relief Program” (
Puente and Wilson 2013). It repaid the US Treasury
$10 million in payments over two years, then utilized the profits of a
$300 million stock offering to purchase back the government’s stake. In April 2011, Greg Becker took over as CEO, succeeding Wilcox. In 2012, Silicon Valley Bank teamed with “
Shanghai Pudong Development Bank” (
Li 2020) to establish SPD Silicon Valley Bank, a distinct Shanghai-based financial institution that lends to indigenous entrepreneurs. The financial institution, held equally by the two corporations, has been approved by Chinese financial regulators to function in RMB, making it one of only a few American-owned institutions to do so. Silicon Valley Bank’s active participation in funding new venture capital mergers and acquisitions provided it with trade secrets about such takeovers, and Mounir Gad, an erstwhile vice president of finance and board member at the bank, agreed to plead guilty in June 2021 to breaching the laws governing insider trading in 2015 and 2016 once he nudged off a companion about three startup buyouts.
With the institution highly engaged in long-term Treasury securities, Silicon Valley Bank started to sustain heavy losses in 2022 as interest rates increased and the technology sector experienced a significant dip in development. Silicon Valley Bank reported anticipated mark-to-market liabilities in addition to $15 billion regarding equity securities to expiration as of the end of the year. A confluence of circumstances, notably inadequate risk assessment and a banking collapse pushed by technology industry investors prompted the institution to fail in early March 2023. Utilization of social networking sites was said to have played a role during both the initial banking collapse and its repercussions, with all those concerned by the possible loss of money pleading with authorities to guarantee that unprotected balances remained restored.
Investigators from FDIC (
Maura-Pérez and Romero-Perez 2021) came to Silicon Valley Bank’s headquarters early on March 10 to analyze the company’s financial performance. Some hours later, the “California Department of Financial Protection and Innovation” issued an order suspending Silicon Valley Bank and appointing the Federal Deposit Insurance Corporation as administrator, alleging insufficient cash and bankruptcy. The Federal Deposit Insurance Corporation subsequently established the Deposit Insurance National Bank of Santa Clara to restore the bank’s facilities the following Monday and allow access to safeguarded assets. Greg Becker, the CEO of Silicon Valley Bank, formerly was a member of the board of trustees of the “
Federal Reserve Bank of San Francisco” but resigned from that post. On 12 March, the first bidding of Silicon Valley Bank assets drew a solitary bid from an unnamed buyer; following that, PNC Financial Services and RBC Bank declined to make bids. The Federal Deposit Insurance Corporation turned down this proposal and intended to run second bidding to solicit proposals from major financial institutions following the announcement that the bank’s systemically important categorization authorizes the Federal Deposit Insurance Corporation to cover all depositors. The Federal Deposit Insurance Corporation announced via a press statement on 13 March 2023 that the agency had shifted Silicon Valley Bank holdings to a new bridge financial institution, Silicon Valley Bridge Bank, and selected
Tim Mayopoulos as CEO. Silicon Valley Bridge Bank is an FDIC-insured institution, and all Silicon Valley Bank depositors will become shareholders of the new bridge financial institution. The Federal Deposit Insurance Corporation stated that the goal is to offer an entirely new degree of safety to Silicon Valley Bank clients, which includes maintaining conventional banking hour shifts and anticipated banking transactions such as internet transactions, ATM access to customer deposits, and check writing, and the Federal deposit insurance corporation asserted that Silicon Valley Bank’s official inspections will evident and loan consumers should continually make reimbursements. The FDIC further stated that their responsibility does not include protecting Silicon Valley Bank, stockholders, or uninsured debt holders. Silicon Valley Bank’s erstwhile parent company, Silicon Valley Bank Financial Group, declared bankruptcy under
Chapter 11 on 17 March 2023. The remaining subsidiaries, Silicon Valley Bank Capital and Silicon Valley Bank Securities, were not included in the bankruptcy. Silicon Valley Bridge Bank, better known as Silicon Valley Bank Private, is not included in the insolvency petition because it is no longer linked with Silicon Valley Bank Financial Group. The repercussions have generated what organizational investors and entrepreneurs have described as a significant gap in the ecosystem, the real influence of which on entrepreneurs and technological enterprises is unknown. The Federal deposit insurance corporation announced on 26 March 2023, that “
First Citizens BancShares” will buy Silicon Valley Bank’s commercial banking business. As part of the agreement, First Citizens purchased approximately
$119 billion in accounts and
$72 billion in Silicon Valley Bank loans, which were depreciated by
$16.5 billion, whereas roughly
$90 billion of Silicon Valley Bank securities remained in the administration. The following day, Silicon Valley Bank’s 17 branches were relaunched as “
Silicon Valley Bank, a part of First Citizens Bank,” with all Silicon Valley Bank depositors turning First Citizens customers.
3. Benford’s Law
Benford’s law was discovered in the 1800s when Canadian-American astrophysicist Simon Newcomb (
Newcomb 1881) noted that the initial entries in his log file, specifically those beginning with “1”, were significantly poorer than the later ones. This revelation triggered his thinking impetus that finally manifested as a notion. The probability of a single number
λ being the initial digit, according to the law put forward by Newcomb, is equal to log(
λ + 1) − log(
λ).
In the early 1900s, a researcher called Frank Benford witnessed a similar scenario. He investigated the definitions on a wide assortment of data sets at the period and was surprised to find that practically all of these correlated with the notion. Benford employed around 20,000 specimens for his investigation, which was a vast number to analyze. Nonetheless, Benford was subsequently awarded credit for this. In brief, Benford’s law acknowledges that a variety of methodologies or performance measures that offer ascent to figures such as investment gains, a neighborhood of metropolitan areas, identifiers of locations, firm profits, and locations of emplacements (
Dutta et al. 2023c) and residences define dynamics (
Dutta et al. 2022) in the digits that might otherwise show up counterintuitive where more minor points are far more ubiquitous than larger ones. The Benford’s law mathematical formulation is
where,
= Probability of Occurrence of the digit
as the
’th digit
.
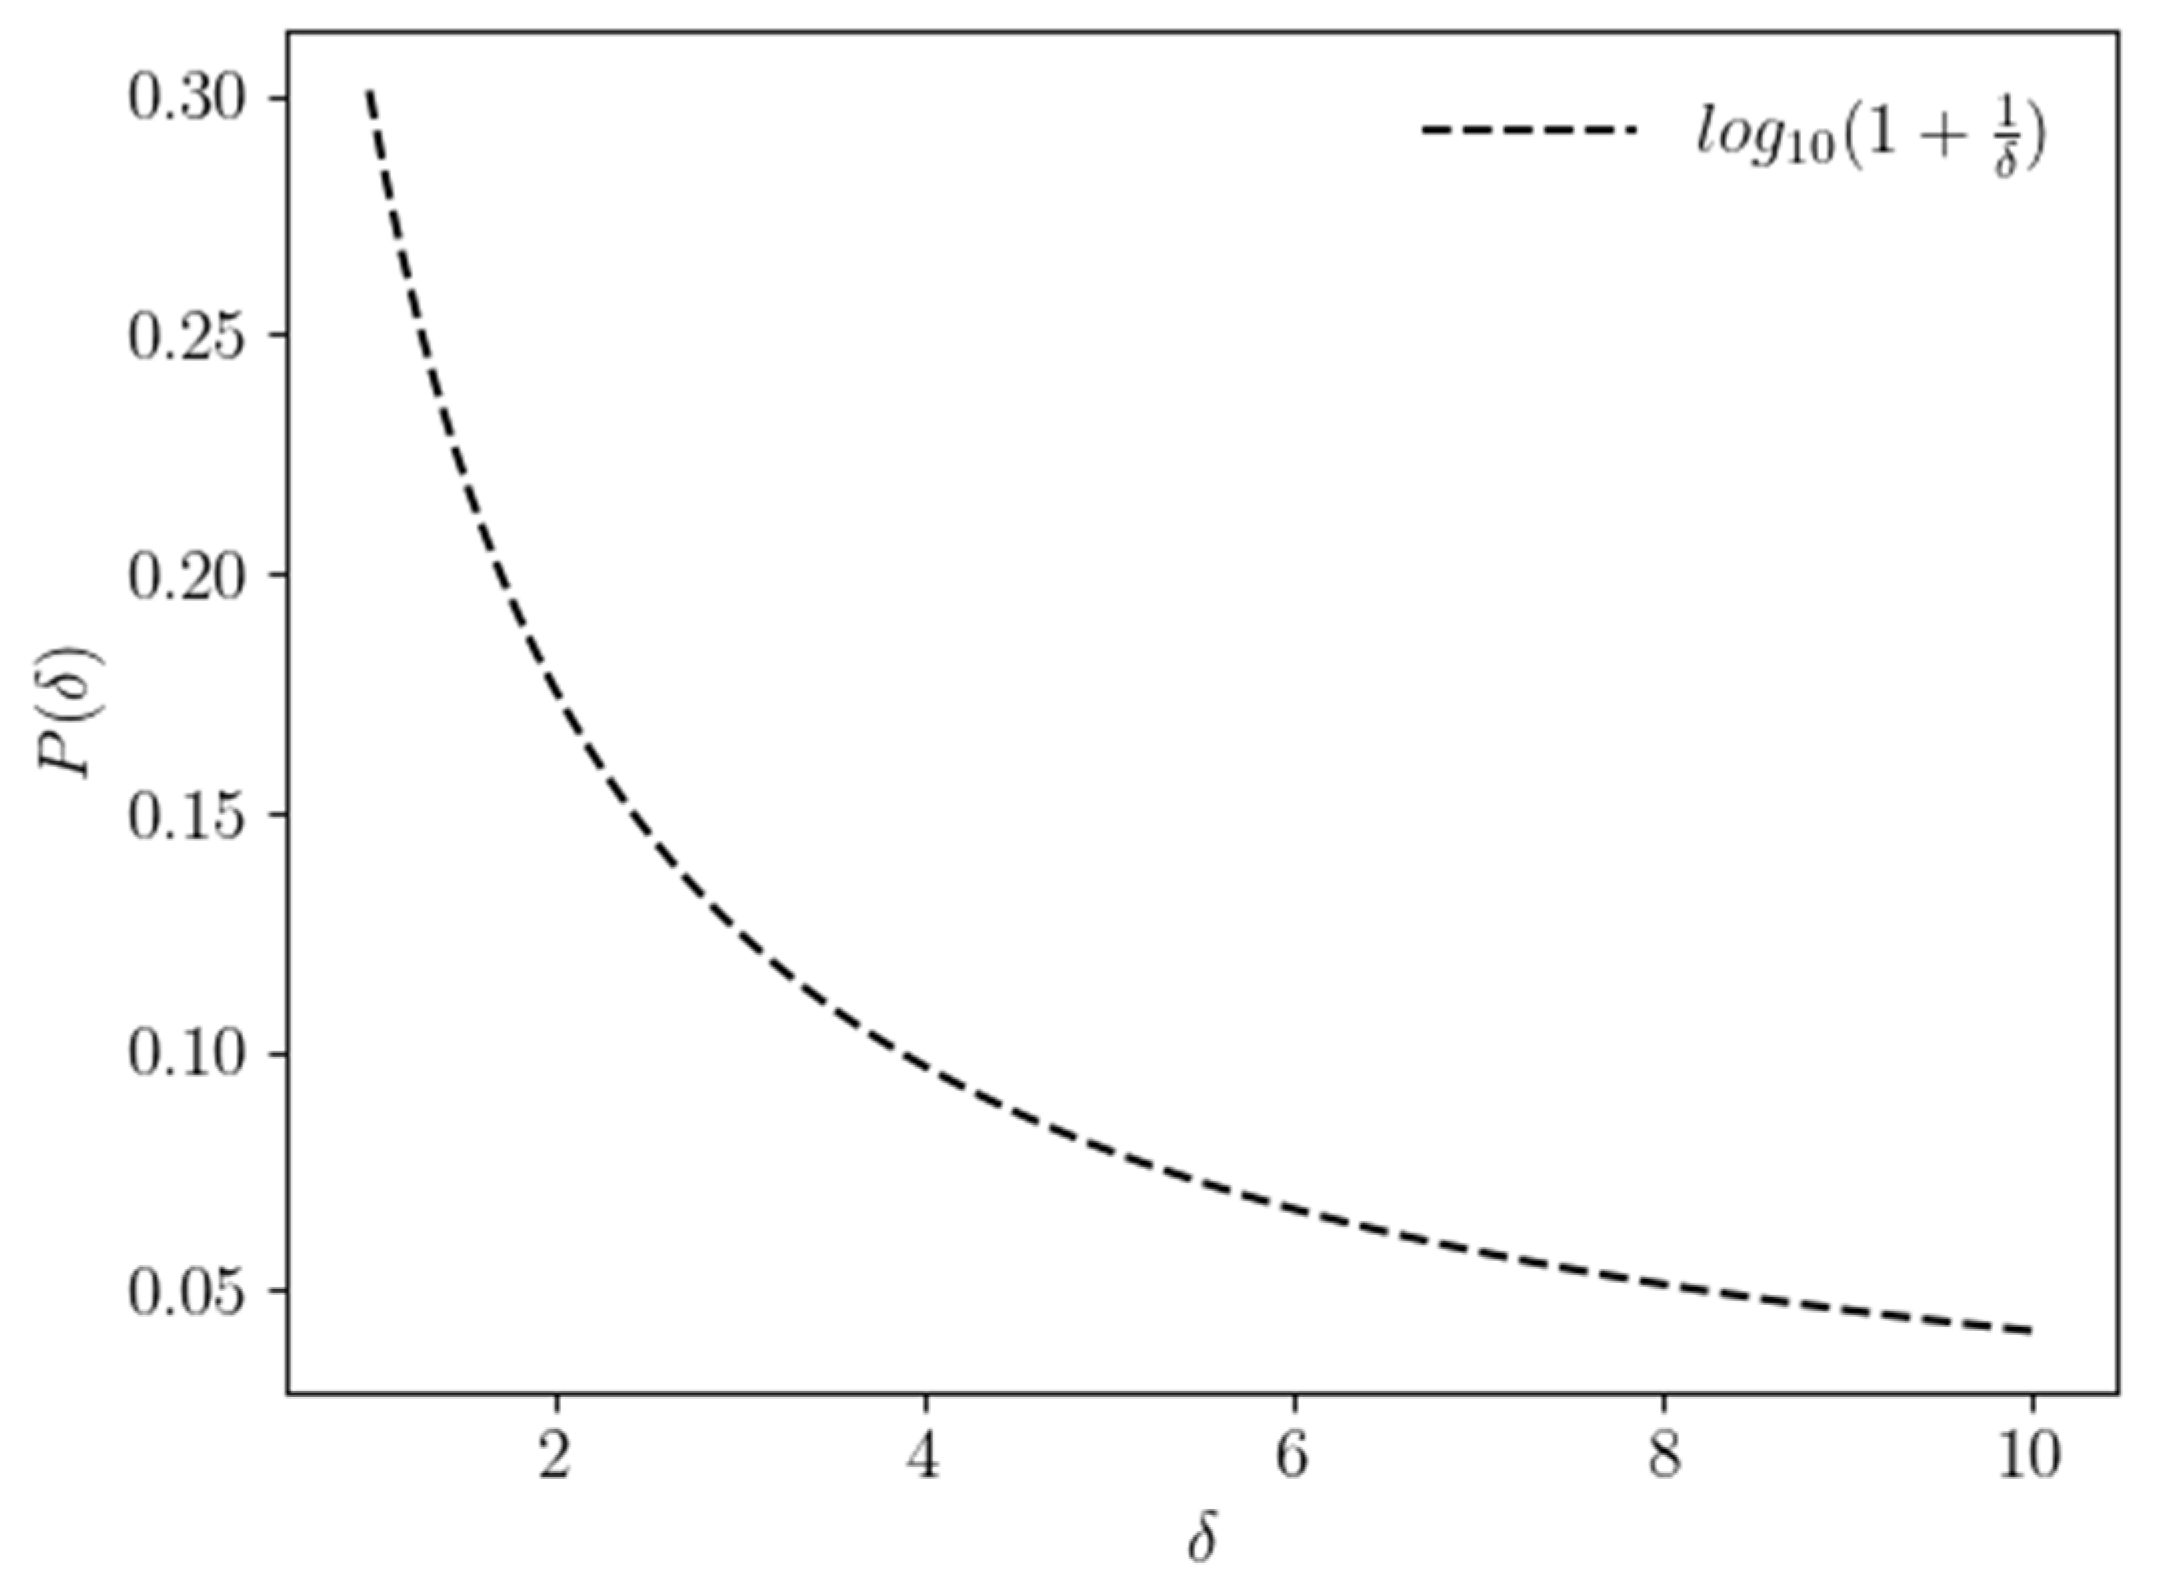
The graphical representation for Benford’s law subjected to the initial digits is shown in
Figure 1.
Figure 1.
Graphic depicting Benford’s law, with the initial values,
δ, on the
x-axis and their related chance on the
y-axis. In the picture above,
P(
δ) is constrained on the
y-axes, while
δ is denied on the
x-axes. The following ogives were created using the points shown in
Table 1.
Figure 1.
Graphic depicting Benford’s law, with the initial values,
δ, on the
x-axis and their related chance on the
y-axis. In the picture above,
P(
δ) is constrained on the
y-axes, while
δ is denied on the
x-axes. The following ogives were created using the points shown in
Table 1.
The formulation mentioned above works only for the occurrence of digit
δ as the first digit only, though another advanced formulation has been generated that tells us about the probability of occurrence of digit
δ as the
ζ’th digit. The phrase is written as follows:
π(
δ) = Probability of Occurrence of the digit
δ as the
ζ’th digit ∋∀ 0 ≤
δ ≤ 9 ∀
ζ > 1.
Generally speaking, Benford’s law is as follows:
In the late 1900s, Hal Varian, an analyst, advocated applying Benford’s law to monitor for deceit in socioeconomic statistics (
Oakes and Rossi 2002), and this was accomplished. So why not? Benford’s law grew to prominence for an excellent purpose. After all, its operational scope was so extensive. Benford’s law has applications in many different fields, including the following:
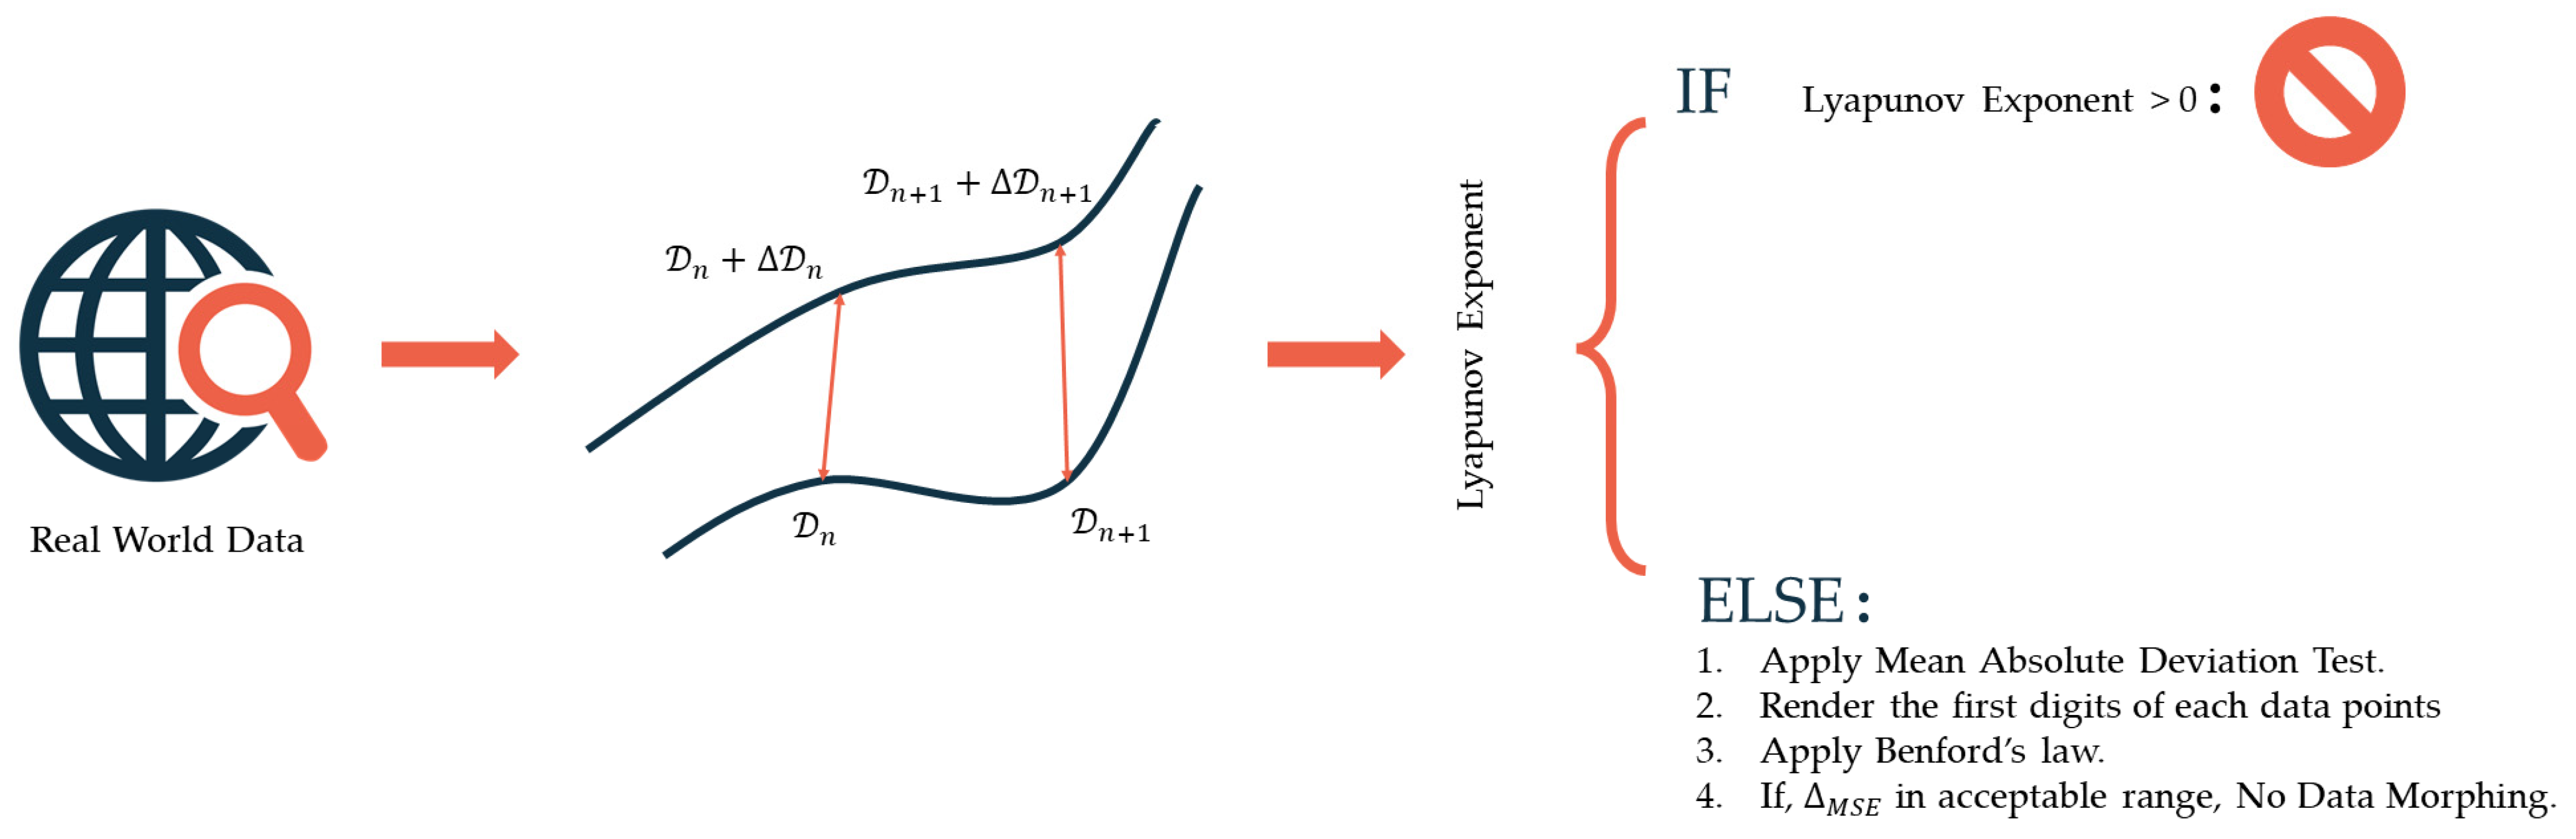
5. Results and Discussions
In this section, we will reach a conclusion about the collapse following some well-fledged scientific paradigms, especially Benford’s Law. The main answer we would be looking to in the research is the probability of data morphing in the Silicon Valley Corporation dataset. According to the generalized framework, mentioned before, first we would start off with the data collection, and this would then be followed by several tests to check the applicability of the Benford’s law and the related statistics in the dataset drawn from real world instance—here, the collapse of the Silicon Valley Bank. We have collected the Silicon Valley Bank stock value between 1987 and 2023. The data are time series data with a daily frequency (one market day). As mentioned in the framework, following the data acquisition, the Lyapunov Exponent needs to be accounted. Here, the largest Lyapunov Exponent was calculated to be
−0.251. Thus, there might be chances of morphological fallacies. Thus, the validatory steps of the framework are brought into action. To apply Benford’s Law in any dataset, we must perform some tests to confirm whether the collection (
Kanti Kumar et al. 2023) is fit. We have conducted three tests on the display, namely.
Mean Absolute Deviation Test: The direct deviation from the origin. Suppose we have a dataset,
. It is mean absolute deviation (
Yitzhaki and Lambert 2011) is
To adopt Benford’s law appropriately, a collection must meet the mean absolute deviation requirement within a particular range.
Table 2 shows the conformity range (
Campbell-Meiklejohn et al. 2012) from a paper by Mark. J. Nigrini.
Mantissa Arc Test: We may use this investigation to find the centroid of a set of mantissas that have wholly or partially distributed together around a unit circle. The pivot point, or the average vector, is the vector that results if the mantissa of integers is spread evenly over the unit circle with central coordinates (0, 0).
Test: If there is a discrepancy between conceptual stats and the actual data, it can be determined using Pearson’s chi-squared test (
Cash 1979), a fitting experiment. Assuming that the null hypothesis is true as n approaches infinity, the
dispersion is as follows:
where
are the probabilities given by the null hypothesis and
. If the pixels on the scatter diagram are roughly identical to zero, the “Difference” graph, or scatter plot, represents the distinction between artificial likelihood and the proposed equation’s likelihood remarkably conforms to the collection’s legitimacy. Based on this scatter graph, we may examine the dataset’s fairness by deciding if it contributes or diverts attention using our ability option. The mean absolute deviation analysis provides the most reliable method for determining the degree to which the data match Benford’s law. If the MAD test produces a score of “non-conformity” rather than “moderate conformity,” the chi-square as well as the Mantissa Arc tests serve to measure extra compliance. The Silicon Valley Corporation data have been tested to follow these tests quite well, and they are within the prescribed conformality. Next, since the data have successfully passed the tests for applicability of the Benford’s Law, we would start the next steps in the algorithm that begin with rendering the first digit of the data points from the dataset.
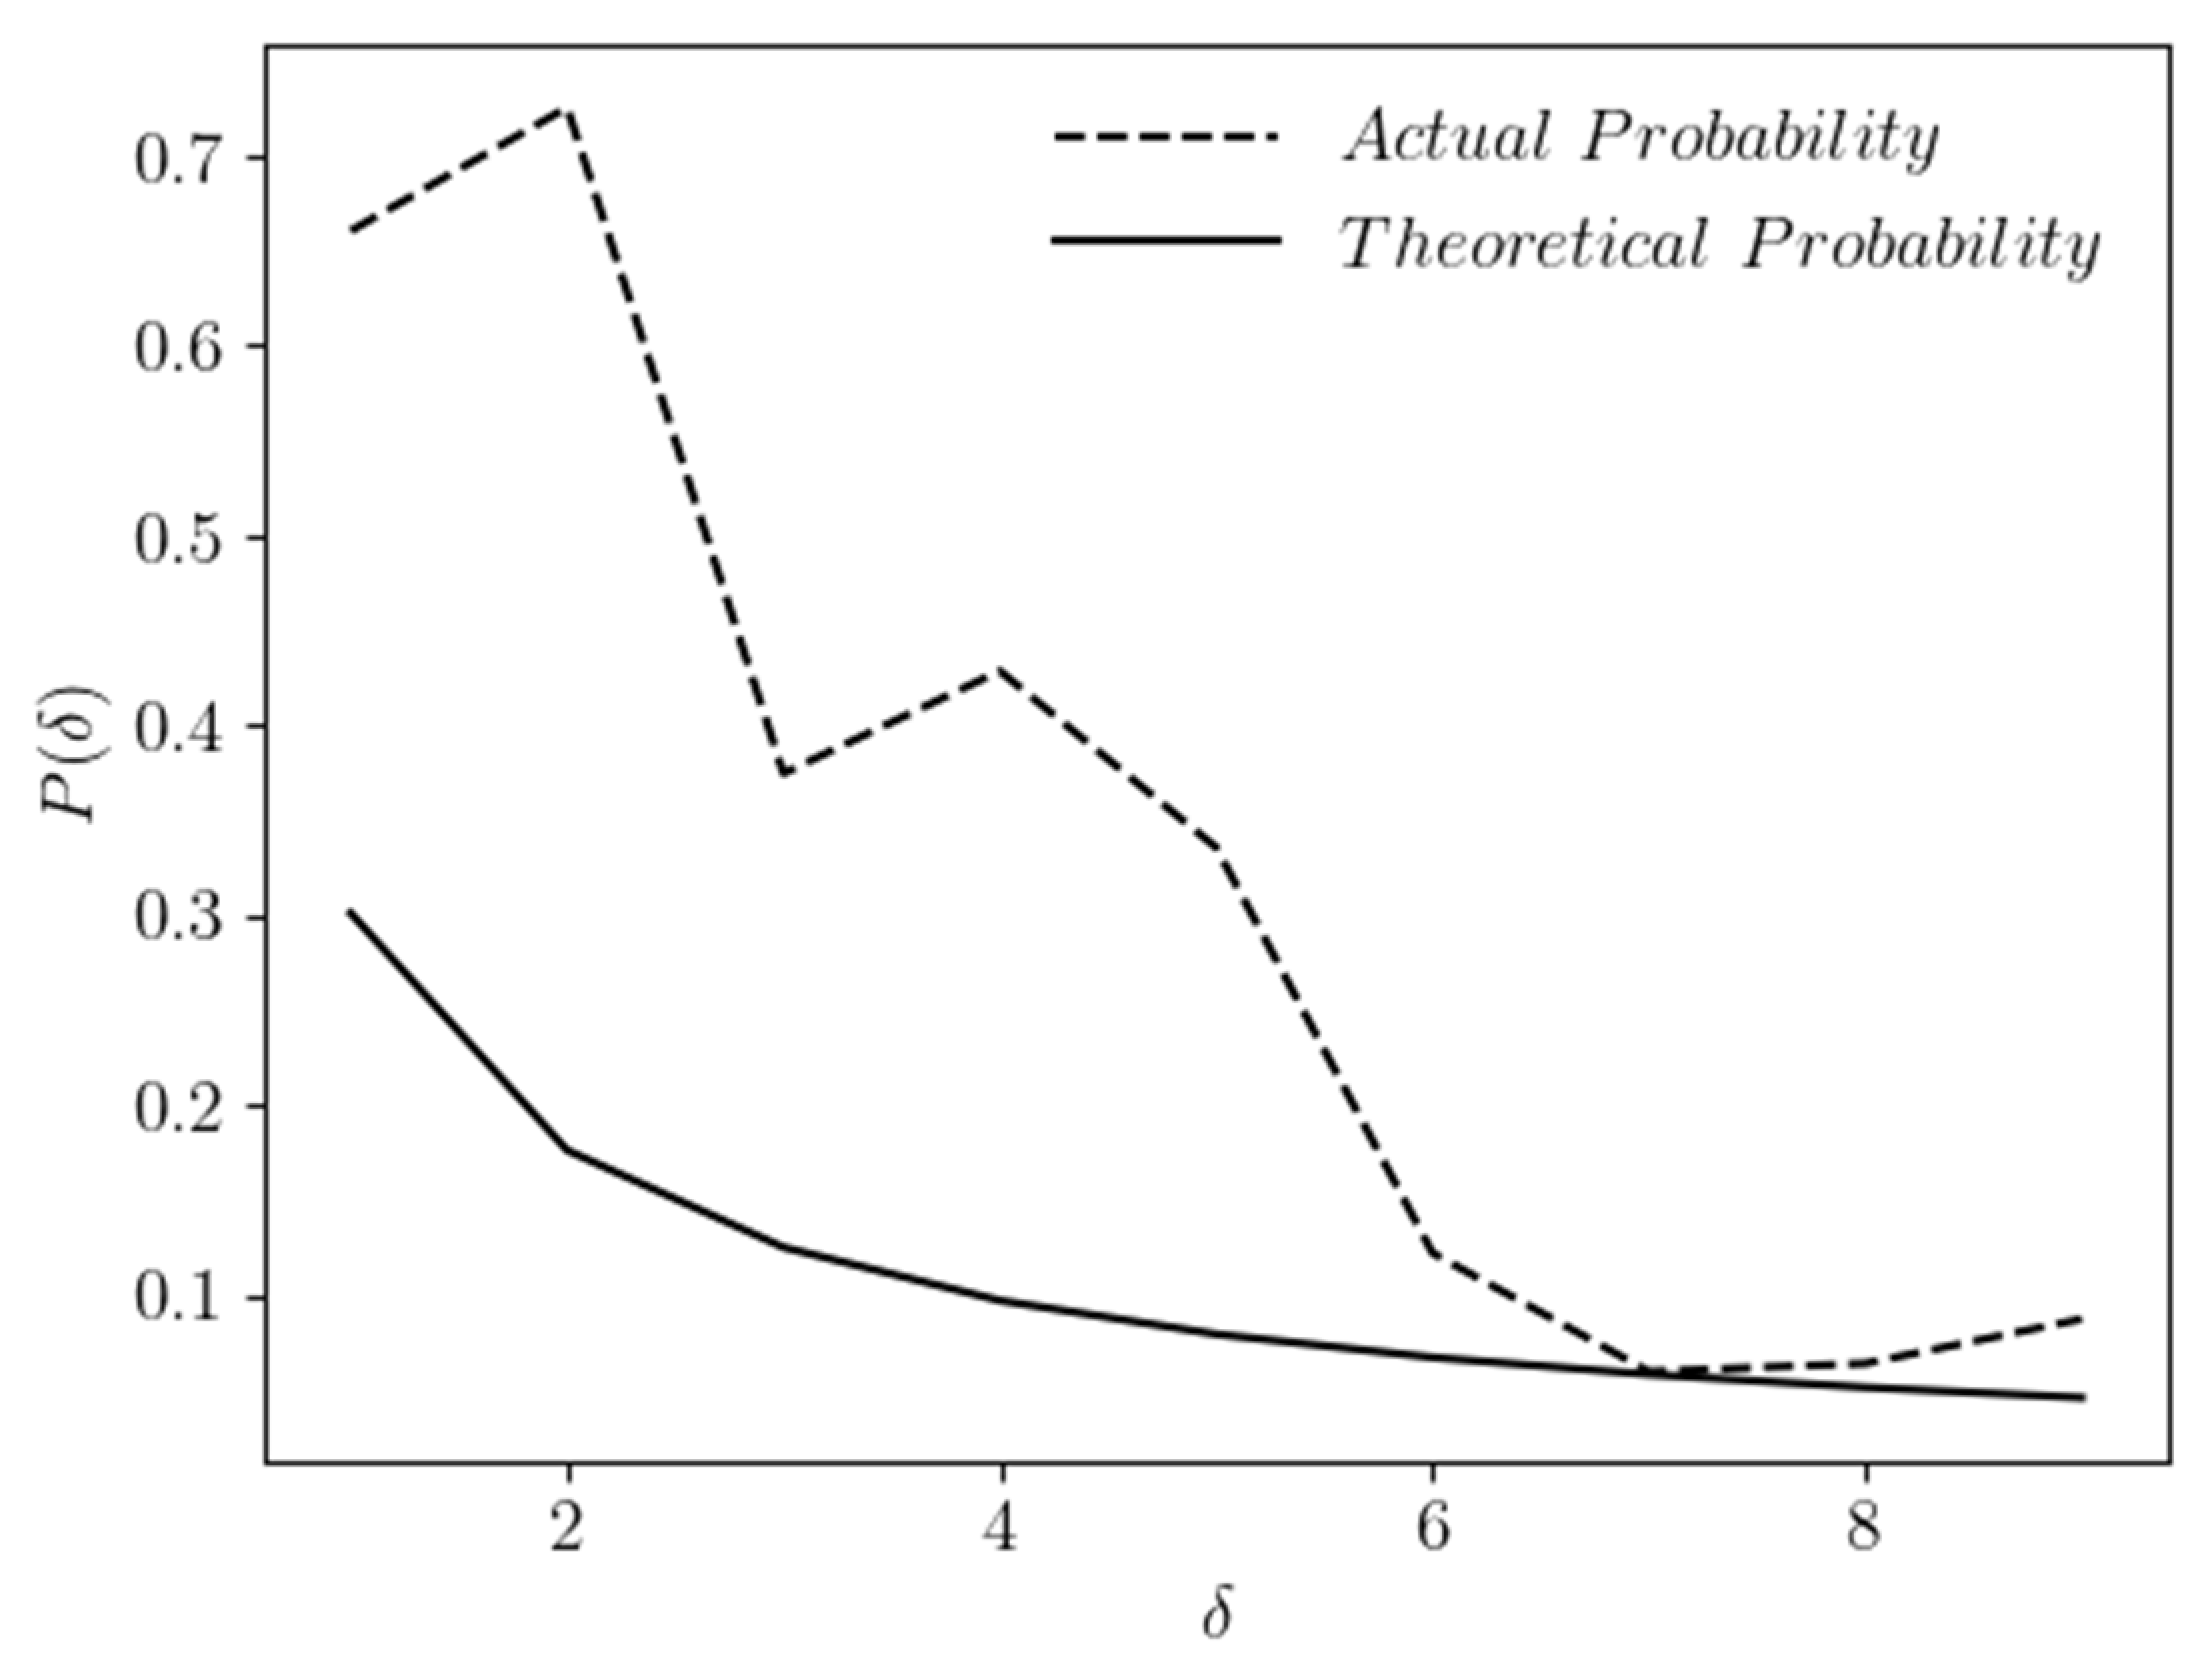
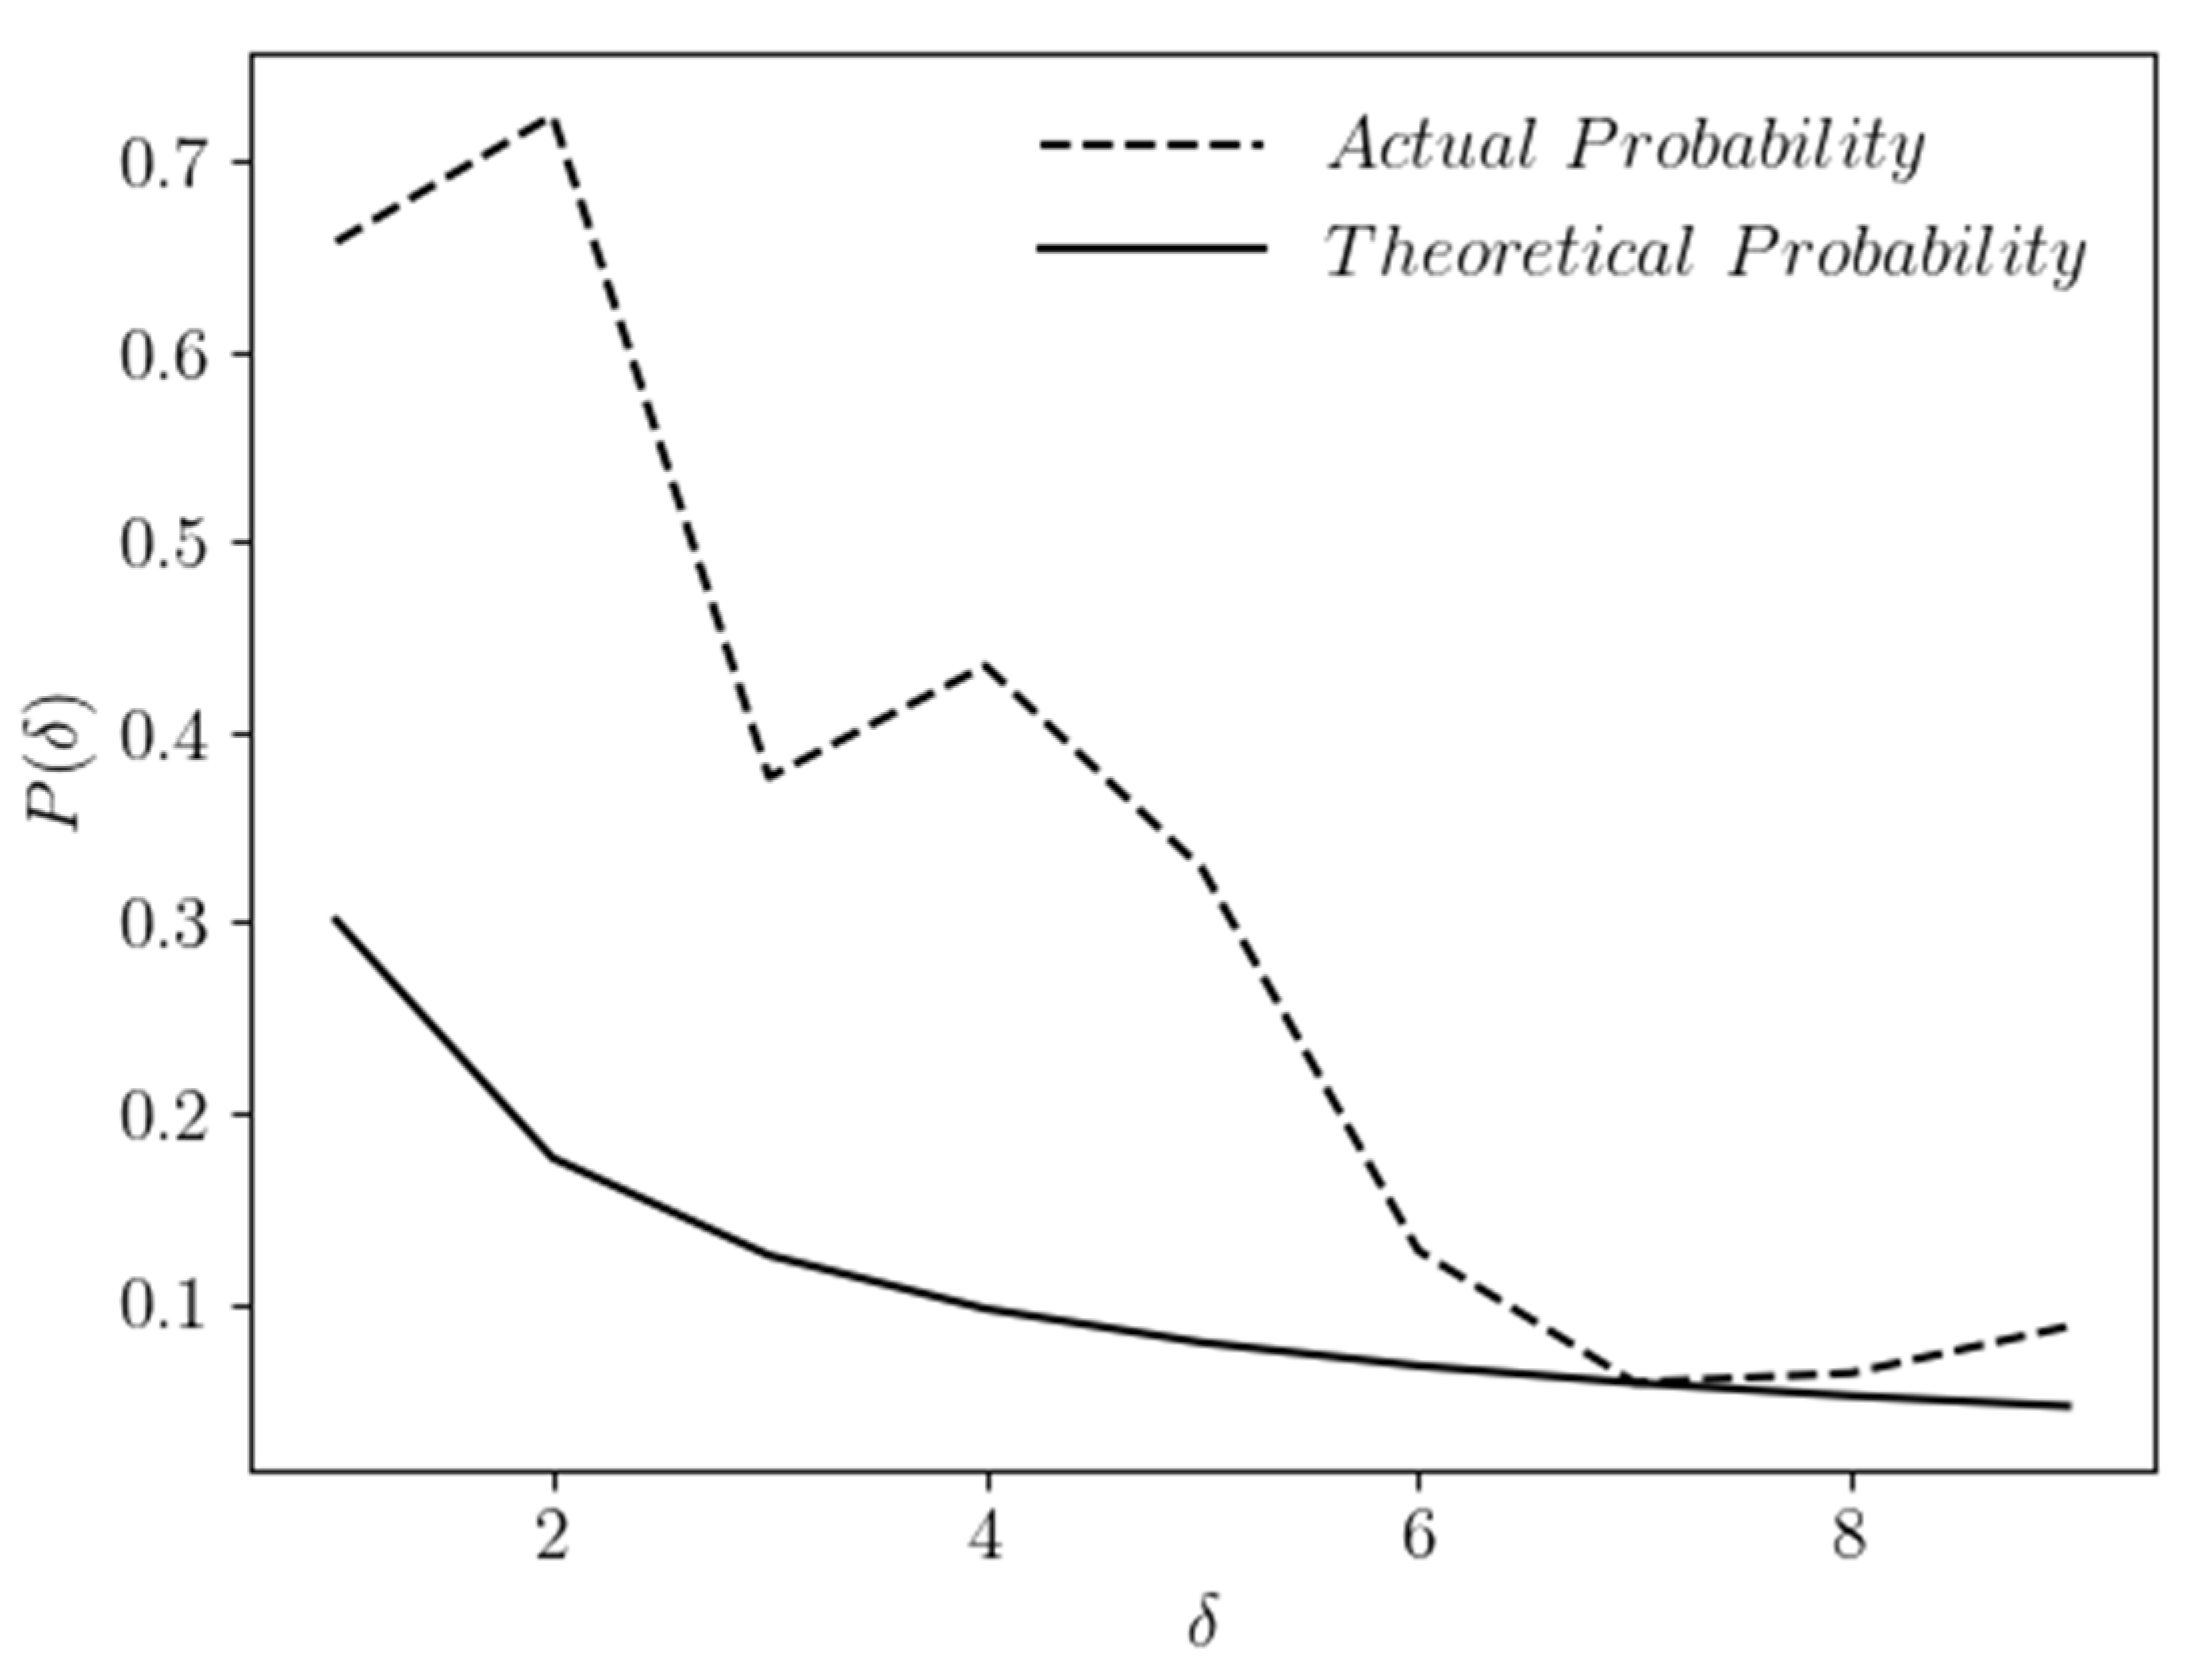
5.1. The SVB Stock Price Opening Value
The beginning price refers to the price at which an asset is traded initially on a marketplace at the commencement of a transaction day.
Table 3 shows a few instances of the stock opening price between 1987 and 2023.
Adding up all the entries of the frequency column, we get,
Then, using the equation
we estimated the artificial likelihood or, more accurately, the realistic likelihood and contrasted it to the mathematical likelihood by Benford’s Law. The theoretical probabilities have been demonstrated in
Table 1.
The mean squared error,
turns out to be
0.67412459 (>0.5), which is not in the acceptable range.
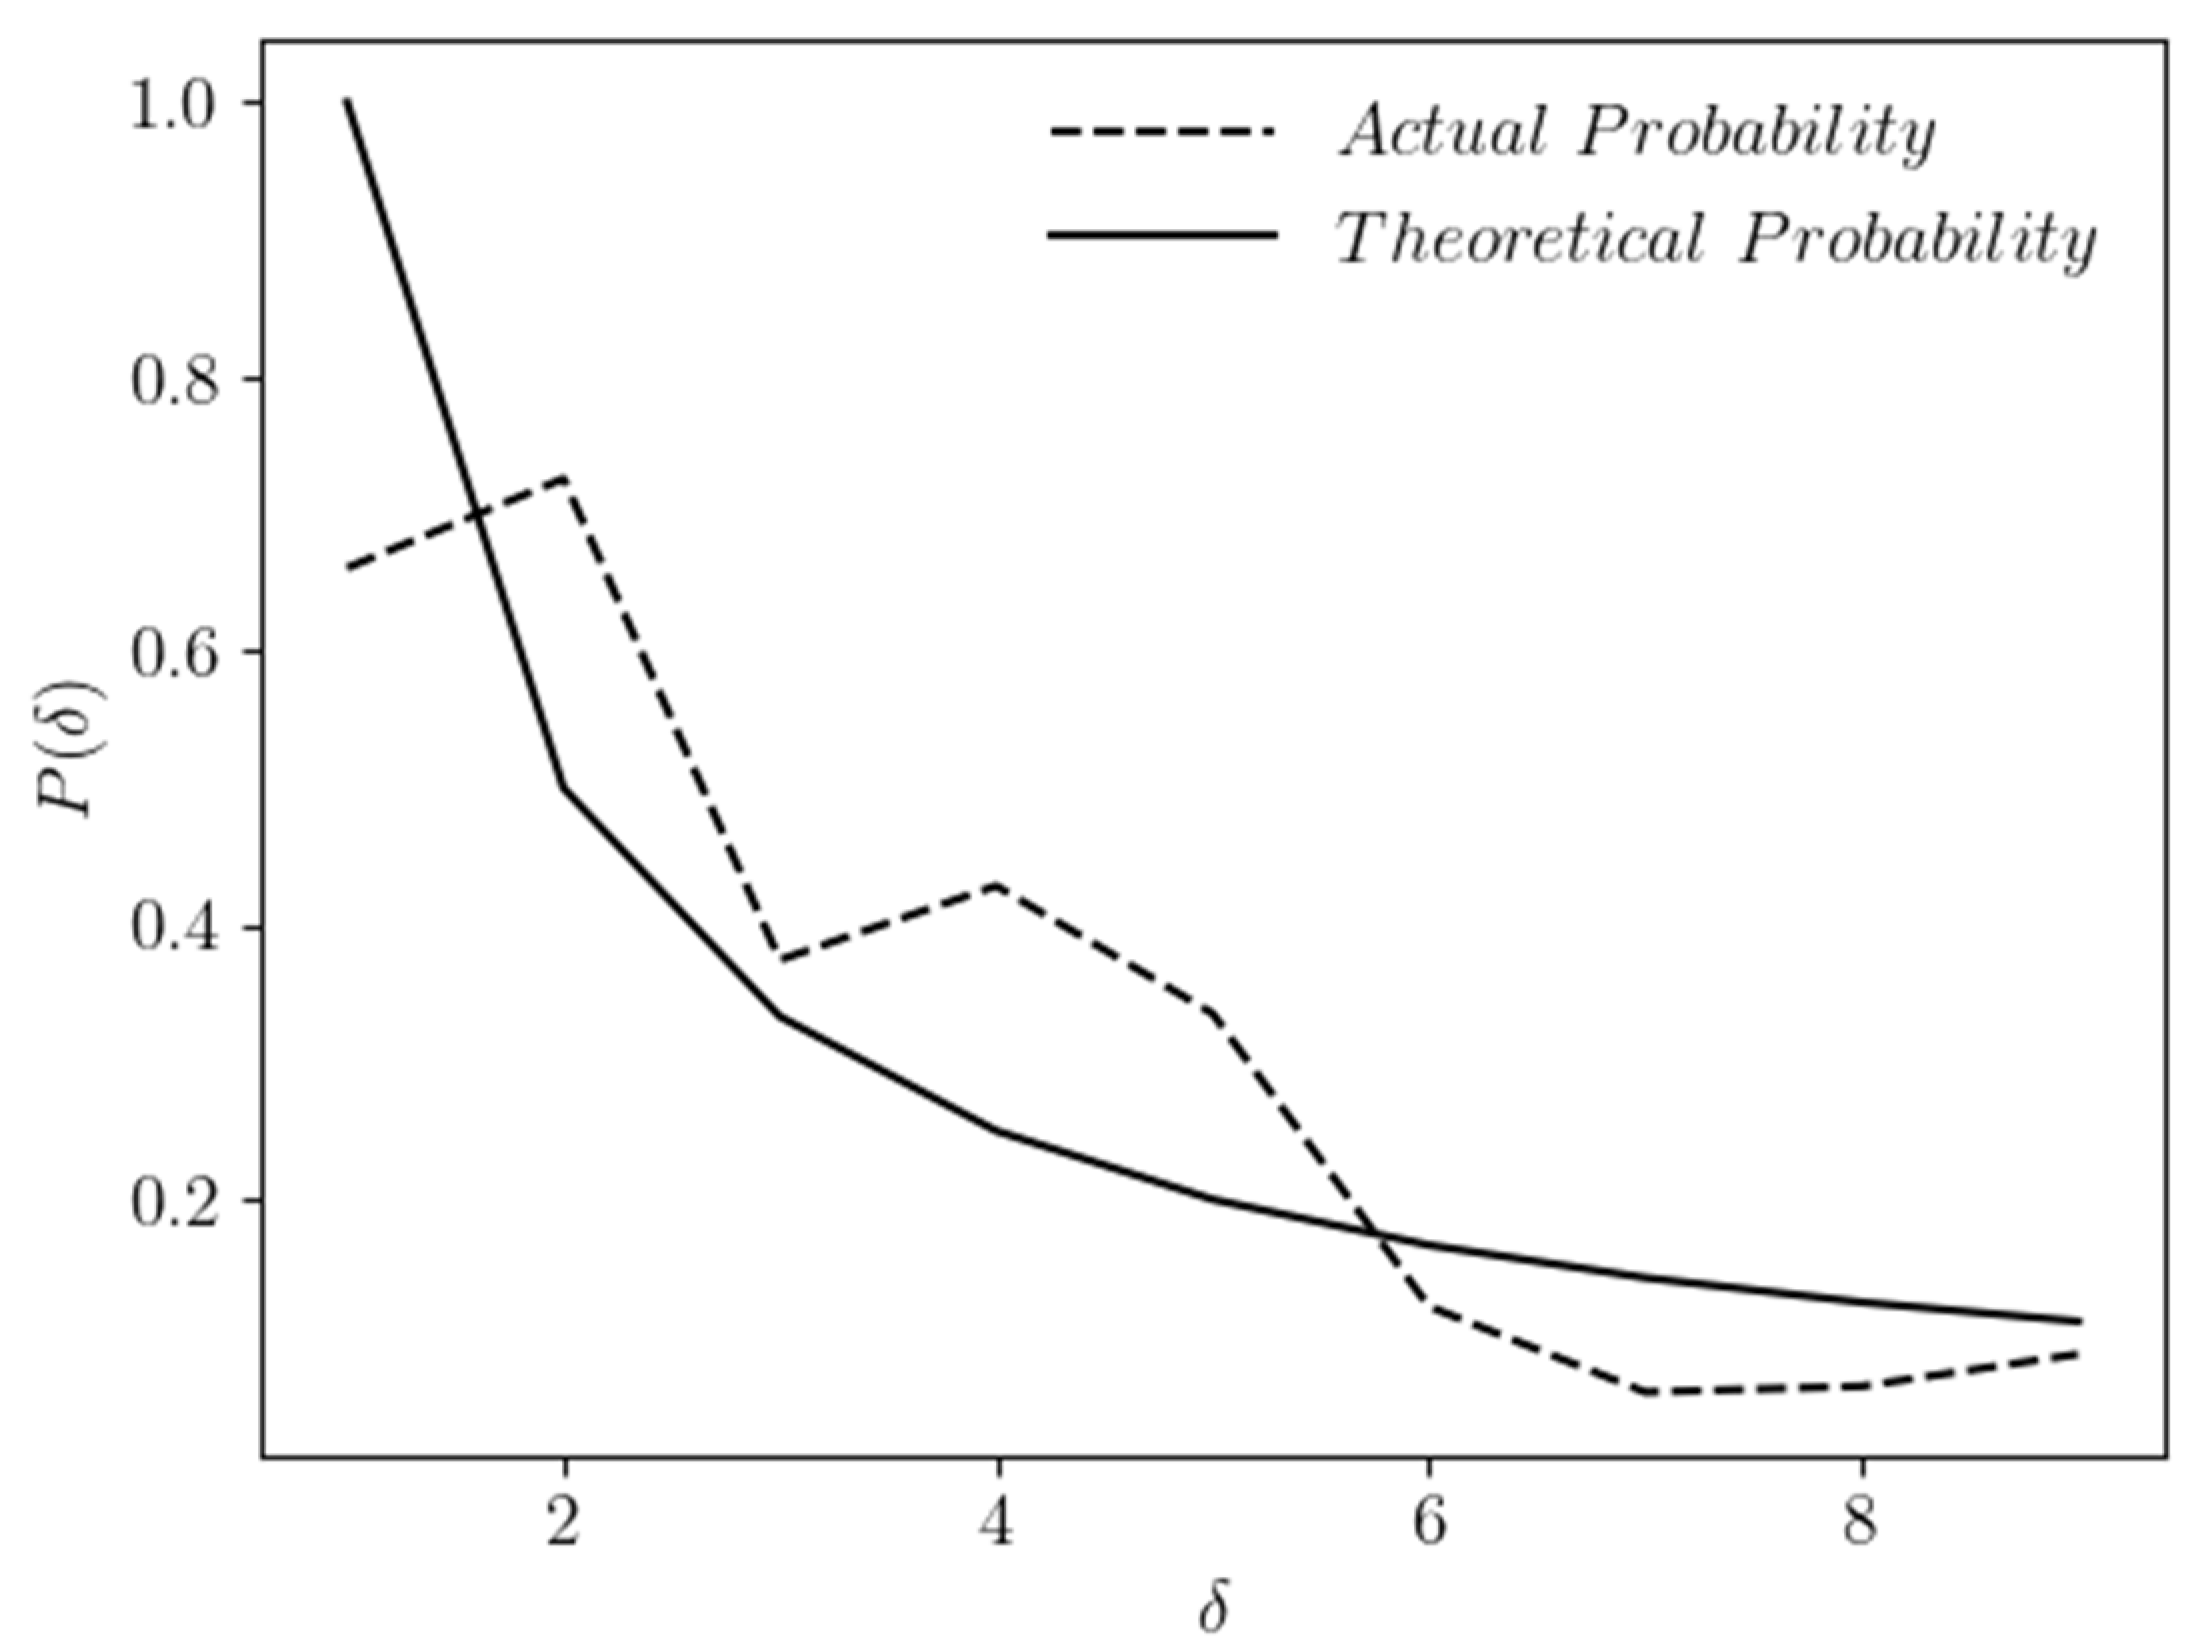
Figure 4 shows the contrast of the same formulating Zipf’s Law.
Here, the mean squared error is again way behind the permissible range.
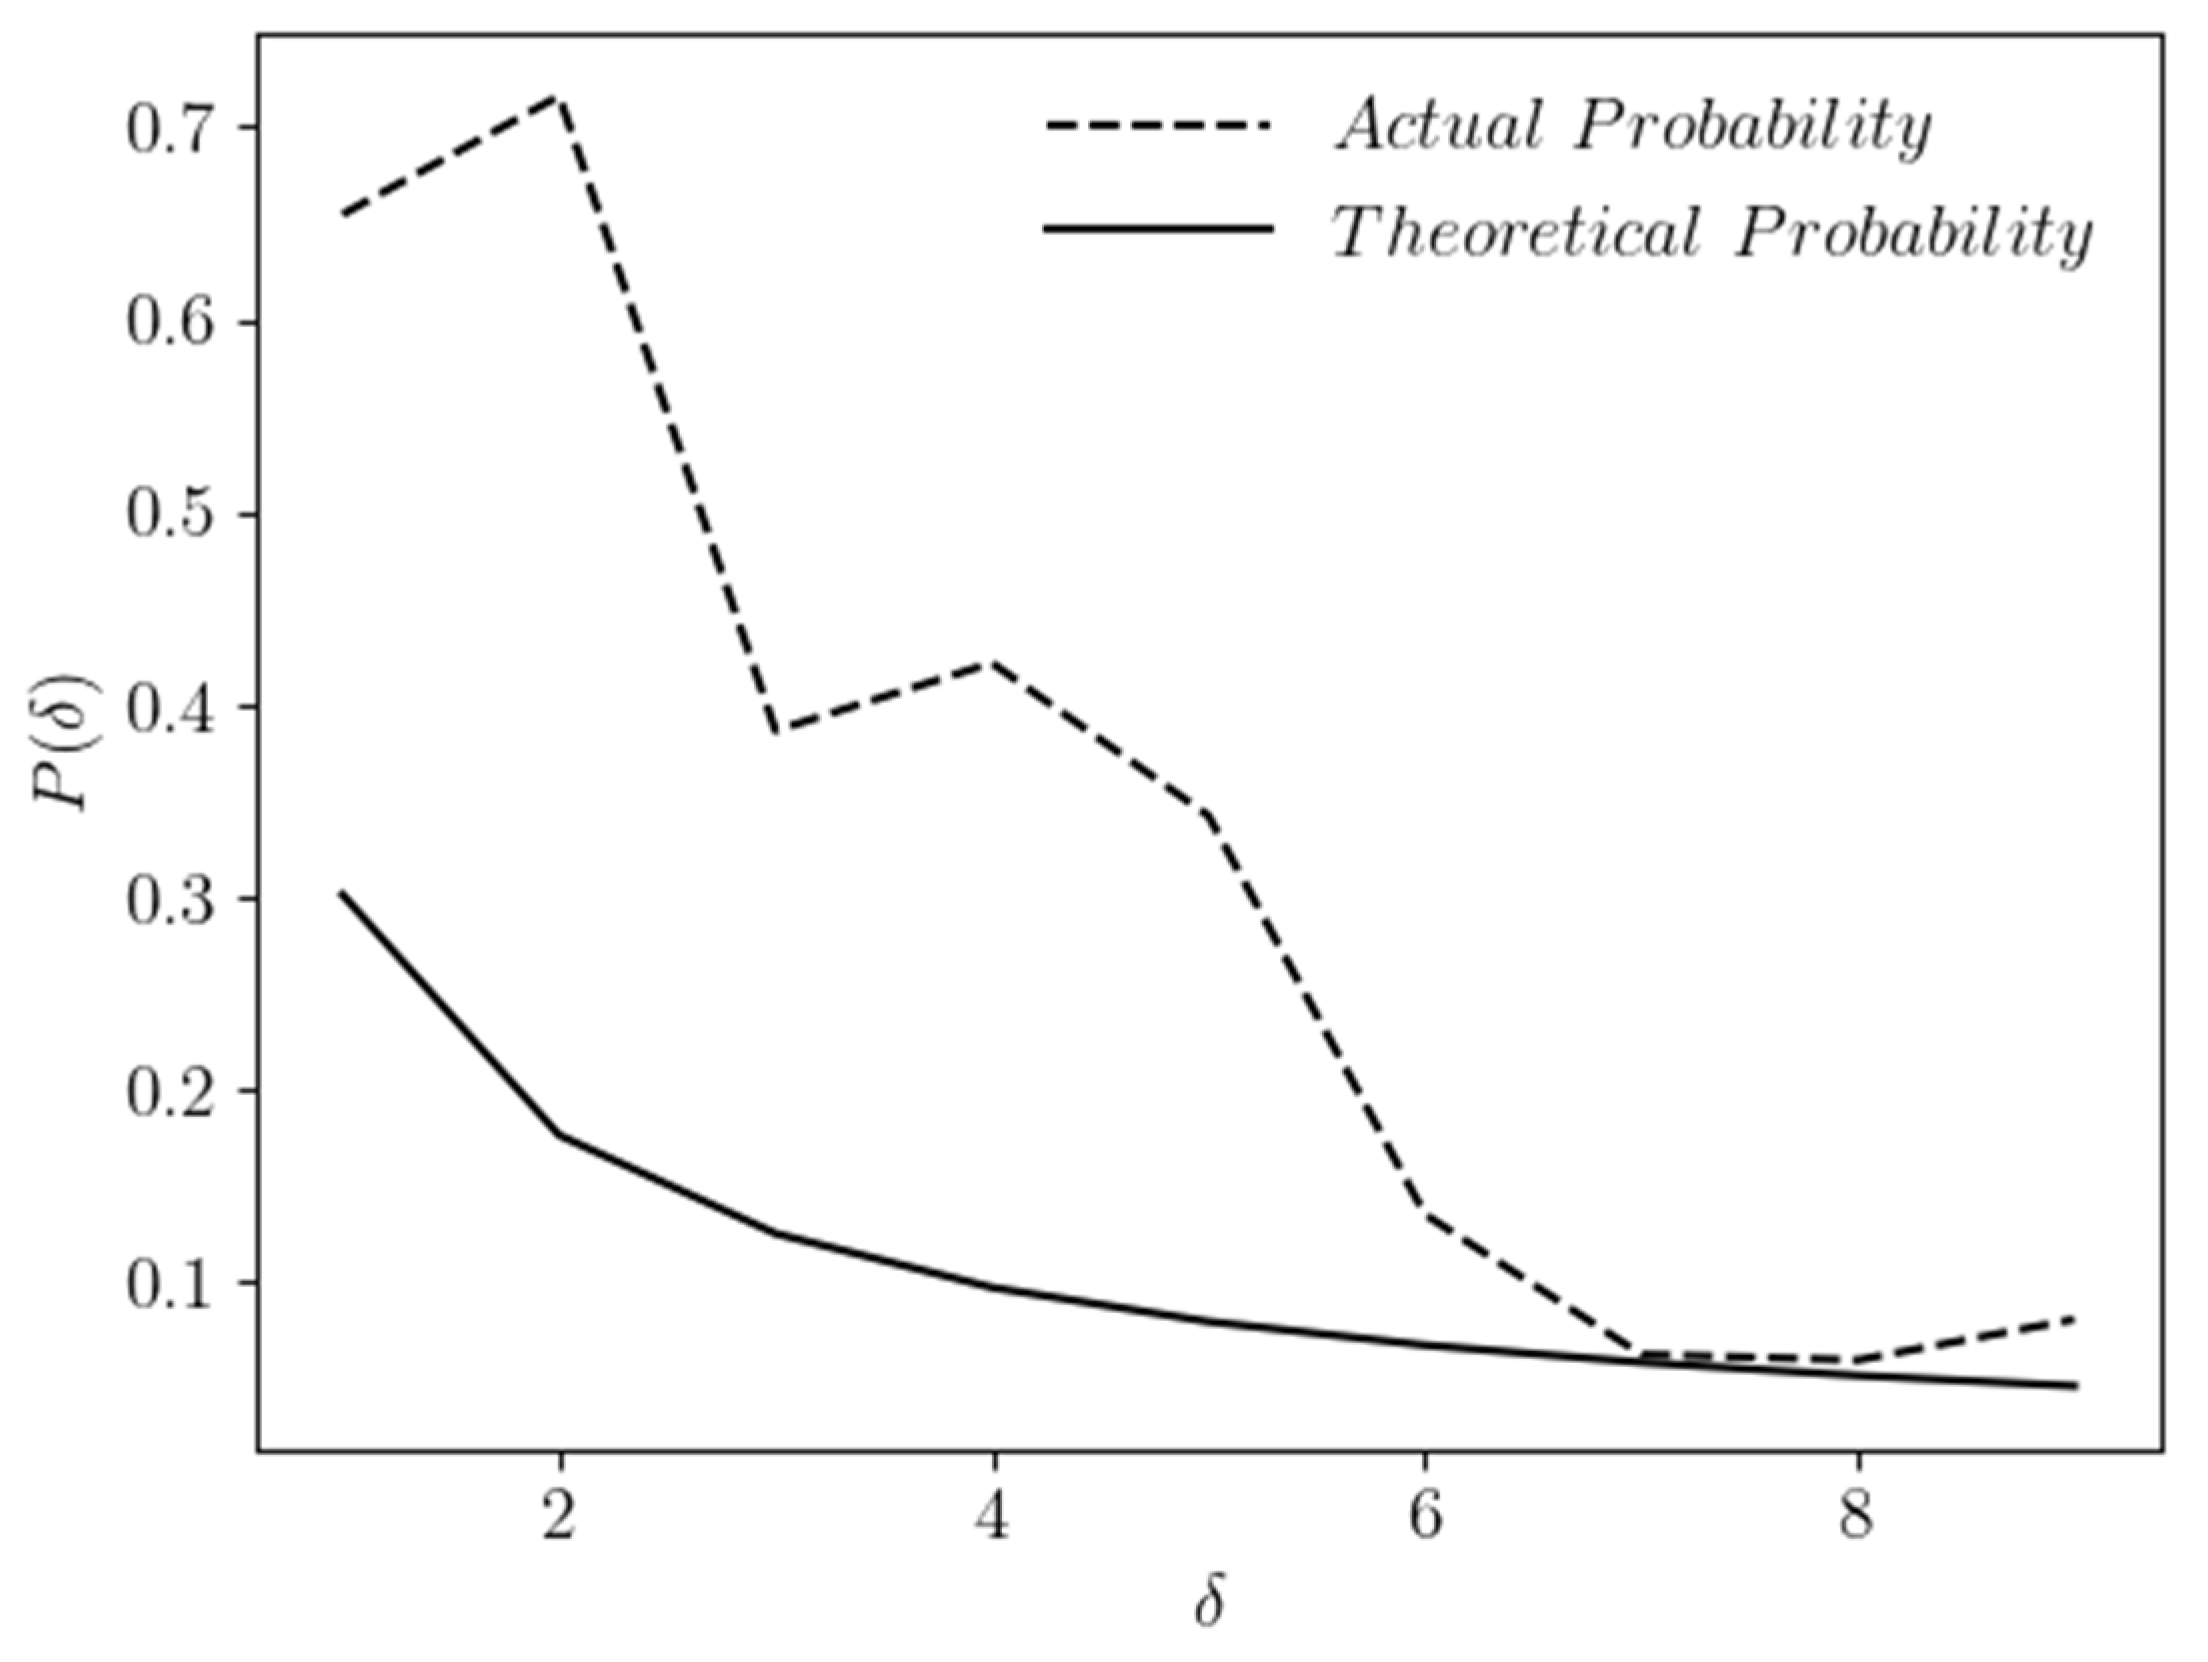
5.2. The SVB Stock Price Closing Value
The final transaction price of security well before the exchange formally shuts for regular trading is known as the closing price or cash value.
Table 5 shows a few instances of the stock closing price between 1987–2023.
Adding up all the entries of the frequency column, we obtain,
Then, using the equation
we estimated the artificial likelihood or, more accurately, the realistic likelihood and contrasted it to the mathematical likelihood by Benford’s Law. The theoretical probabilities have been demonstrated in
Table 1.
The mean squared error,
turns out to be
0.672226388 (>0.5), which is not in the acceptable range.
Figure 6 shows the contrast of the same formulating Zipf’s Law.
Here, the mean squared error is again way behind the permissible range.
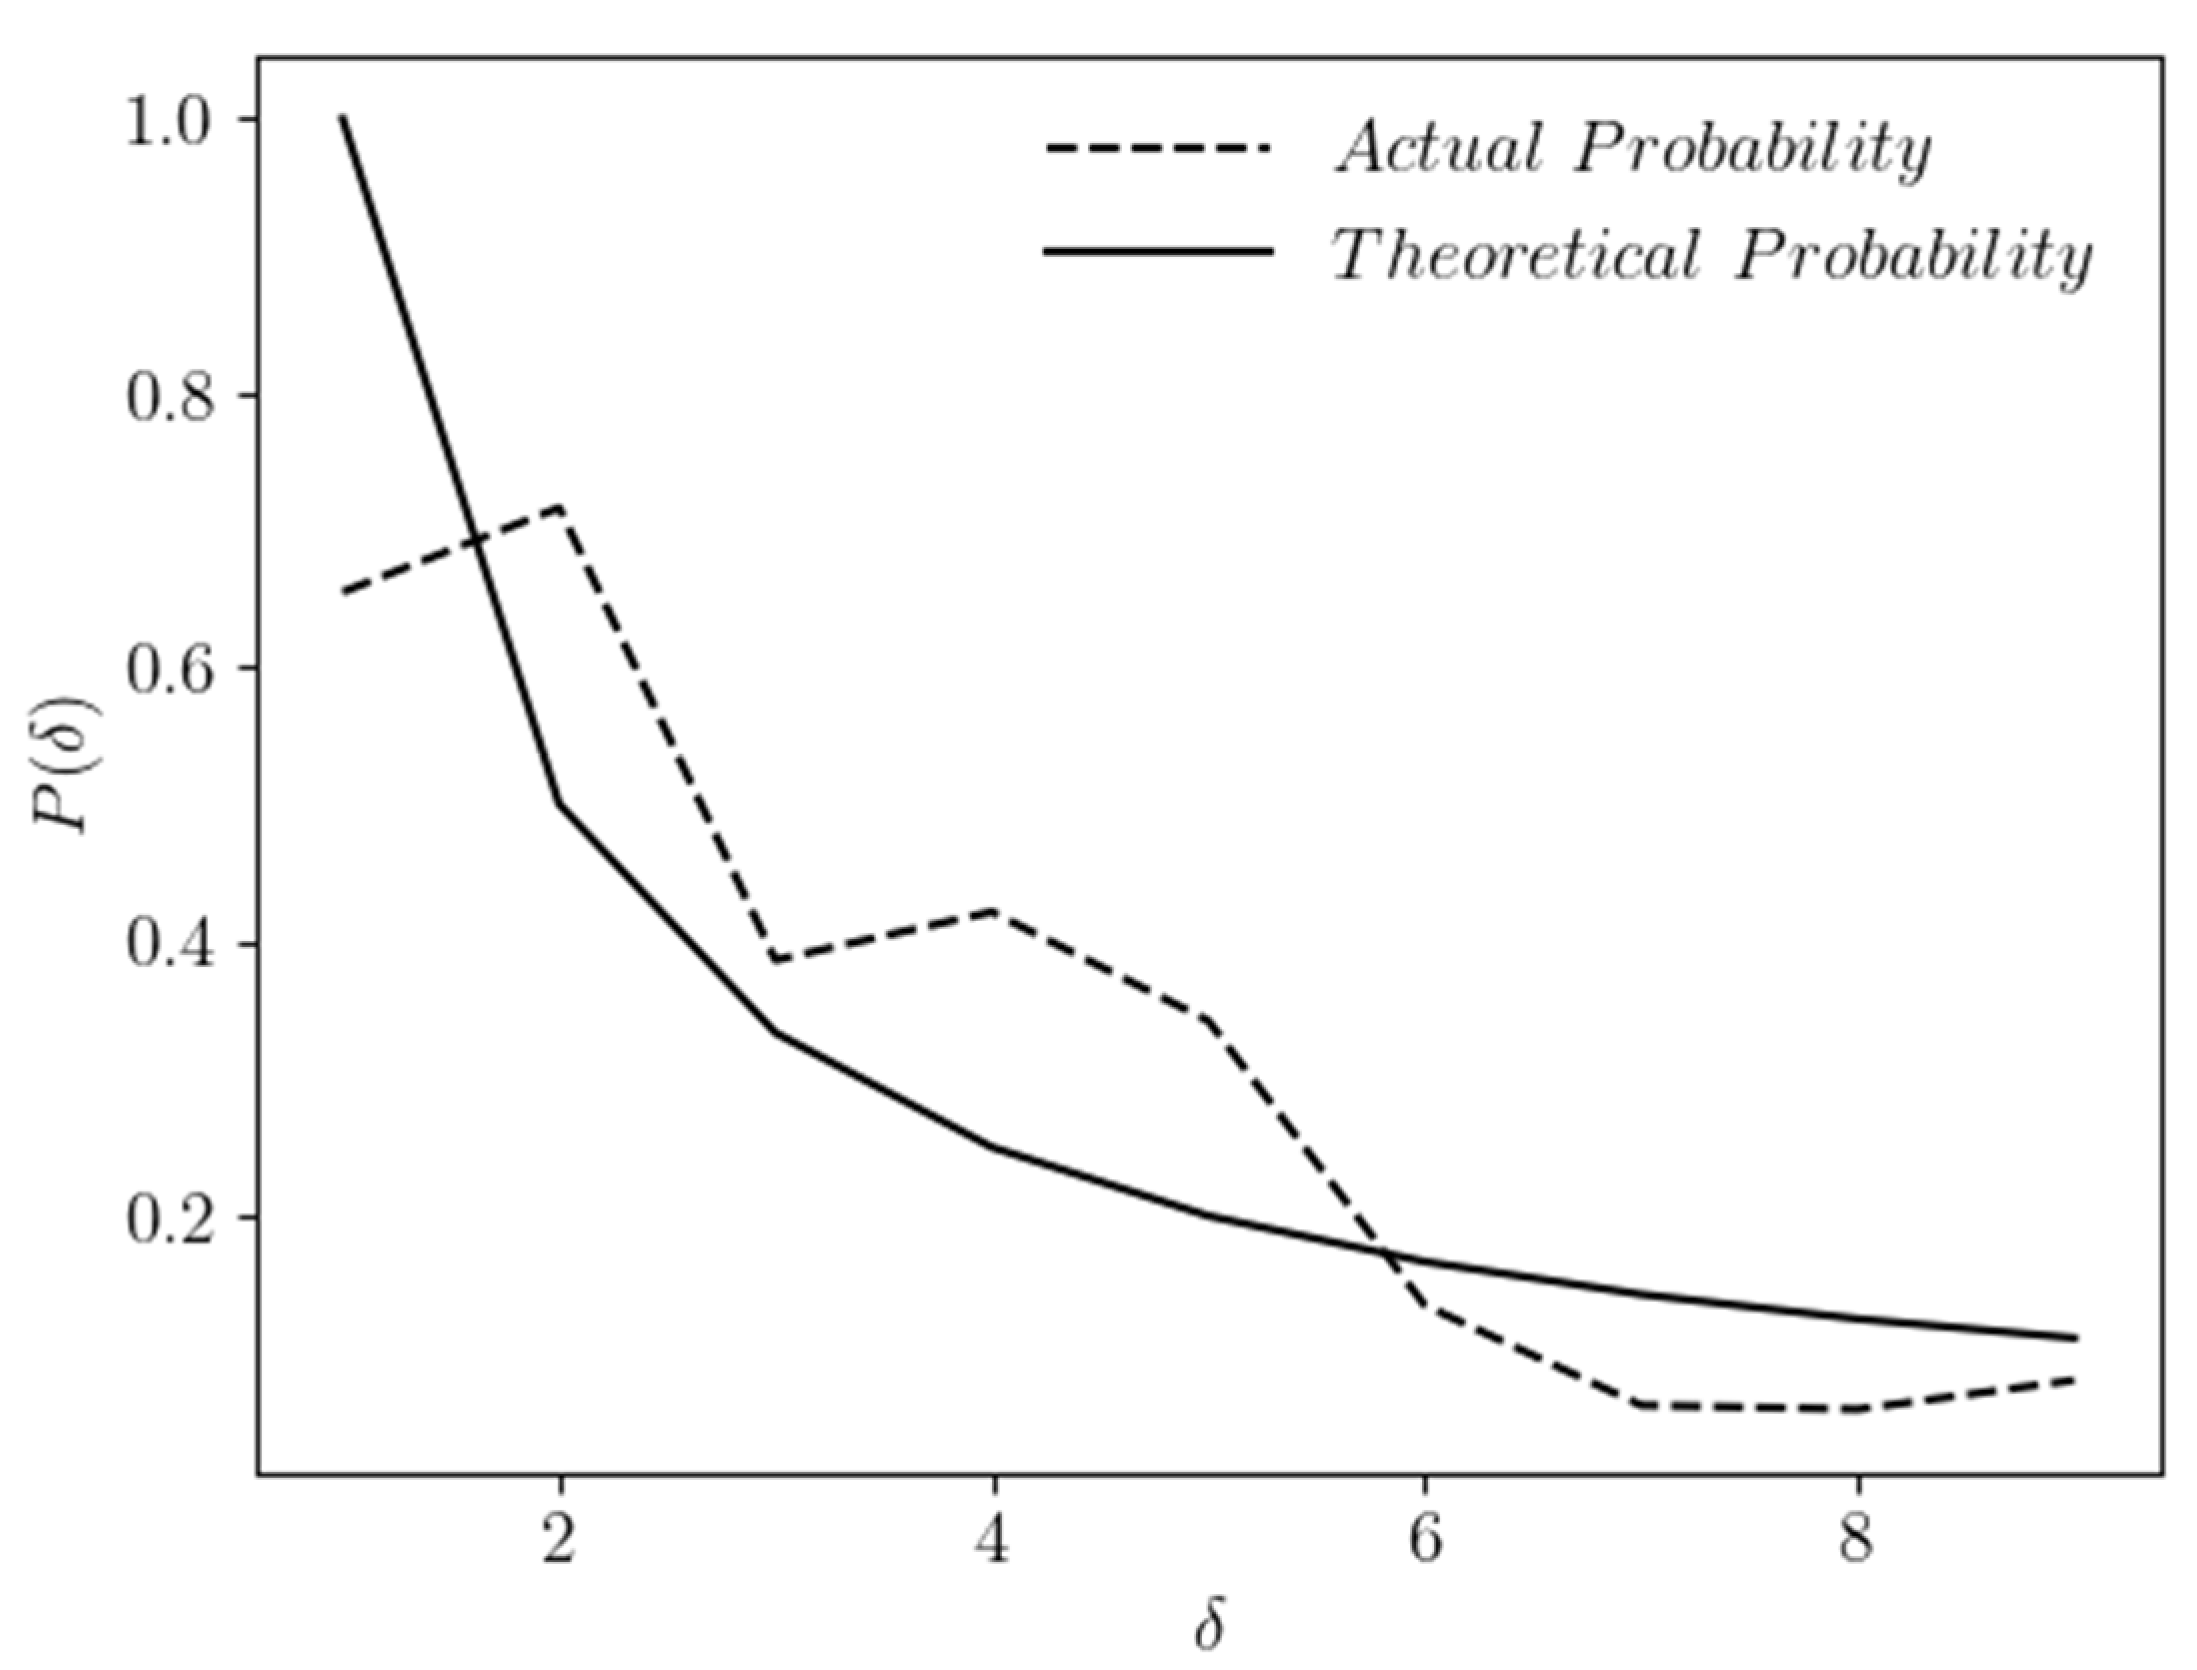
5.3. The SVB Stock Price Highest Value
Table 7 shows a few instances of the stock’s highest price between 1987–2023.
Adding up all the entries of the frequency column, we get,
Then, using the equation
we estimated the artificial likelihood or, more accurately, the realistic likelihood and contrasted it to the mathematical likelihood by Benford’s Law. The theoretical probabilities have been demonstrated in
Table 1.
The mean squared error,
turns out to be
0.665344714 (>0.5), which is not in the acceptable range.
Figure 8 shows the contrast of the same formulating Zipf’s Law.
Here, the mean squared error is again way behind the permissible range.
Since each of the opening, closing, and the highest stock prices of the Silicon Valley Bank are showing a sufficient amount of deviation from the permissible range of [0, 0.5), there a good chance of data being morphed in the stock price data, though it is not sufficient to blame any of the responsible authorities. But the authors through this research would like to extend their request to the concerned authorities to undertake investigation in this concern.
6. Conclusions
The Silicon Valley Bank has now been declared insolvent (
Ferrary and Granovetter 2009). In conclusion, the utilization of Benford’s Law in the course of the investigation into the collapse of the Silicon Valley Bank has unearthed a few of the possible factors that contributed to the failure of the bank. Our investigation revealed suspicious discrepancies between the bank’s financial data and the anticipated distribution of digits, suggesting the presence of fraud or other financial irregularities (
Bentley et al. 2012). Benford’s Law is a well-established statistical method for identifying possible fraud or manipulation in financial data, that is fine grained, or even if it is corase grained, the time horizon should be considerably high, so we decided to apply it here to detect the presence of data morphing in the 36-year-long finacial data from the Silicon Valley Bank (
Bales and Burghof 2023). Although the results of this study cannot be used to place blame on any particular authority in the absence of hard evidence, they can serve as incentive (
Sanderson 2023;
Eckhardt 2023) for further investigation by the relevant authorities (
Jones and Sudlow 2022) into the anomalous fluctuations in the stock price and departures from the likelihood plot that the Law of Benford suggests. The mean squared error is greater than 0.5 for the stock market’s open, close, and peak price at any given time, indicating poor conformity. The Zipfian Distribution is used as a reference, as it too displayed abnormalities outside of the acceptable norm when it was examined. Statistical analysis techniques, such as Benford’s Law, should be incorporated into the auditing and monitoring processes at financial organizations moving forward. Financial institutions should also improve their risk management practices, increase their transparency and accountability, and work together with regulatory agencies to guarantee they are following all applicable rules and industry standards. The findings of this research highlight the importance of statistical analysis tools like Benford’s Law in spotting banking fraud and averting future financial collapses.
6.1. Policy Recommendation
The following policy suggestions can be made based on the results of the study comparing the collapse of the Silicon Valley Bank to Benford’s Law: audits and monitoring procedures should be in place at financial institutions on a regular basis to guarantee the reliability of financial data. This will aid in the early detection of any fraudulent or otherwise questionable actions. Benford’s Law and other forms of statistical analysis should be incorporated into the auditing procedures of all financial organizations. This can aid in the detection of possible fraud or financial irregularities that might not be uncovered by more conventional auditing methods. In order to better recognize and respond to risks that could cause financial instability, financial institutions should improve their risk management practices. Internal safeguards and risk management procedures should be well-established. Providing timely and accurate information about financial performance and risk management practices is a great way for financial institutions to increase their transparency and responsibility to stakeholders. The result will be an increase in people’s faith in the organization. To guarantee that they are following the rules and industry standards, financial institutions should work together with regulatory agencies. Risks can be identified and dealt with before they escalate into a crisis if this is done. Financial institutions can strengthen their security and lessen the possibility of a collapse like Silicon Valley Bank’s by adopting the policies proposed here.
6.2. Limitations and Future Research
Benford’s Law is a statistical occurrence that has been utilized to aid in the detection of fraudulent activity in relation to financial data. Benford’s Law provides a unique lens through which to examine what went wrong at the Silicon Valley Bank. On the other hand, there are some constraints that should be taken into consideration with this investigation. The accessibility and dependability of the data is one of the most significant constraints. The reliability of the results depends on how precise and comprehensive the data were that were used to conduct the research. In addition, the scope of the data that were used in the research might be considered a limitation of the study. It is possible that the study will only take into account a limited number of factors and variables, and as a result, it will fail to take into account other aspects that could have played a role in the decline of the bank. The possibility of influencing variables is yet another drawback to this study. The bank’s performance may have been influenced by variables apart from Benford’s Law. The bank’s decline could have been caused, in part, by external factors like a weakening economy or a shift in customer preferences. Researchers in the future could take these caveats into account and expand upon this study by using more robust data and analytic techniques. The results may be more applicable to the banking industry as a whole if the sample size is increased or if multiple institutions are compared. In addition to Benford’s Law, other statistical methods for spotting financial deception could be investigated in future studies. The authors also suggest future work on the topic to obtain a more definitive conclusion using any additional indicators that may be far enough in the future to eliminate the risk. Other statistical laws, such as Pareto’s, Weber’s, and so on, could be incorporated into the framework as a future effort.


 ,
, 


