
Development of Risk Management Mechanism and the System of Risk Metrics to Evaluate and Enhance the Long-Term Orientation of the Strategies of Non-Financial Companies


Abstract
:1. Introduction
2. Results
2.1. Literature Review
2.2. Research Methodology
- Calculate the individual metrics from Table 1 for each year of observation, t.
- In each year of observation and each individual metric we sort the firms from the lowest to the highest value. Then, we split the sorted list into the deciles. Finally, depending on relationship between HI and the factor, we assigned each firm the category from 1 to 10 for the particular factor.
- For each firm and each individual metric, we calculated the average score across the years of observations.
- Finally, we constructed the SKRI. Given the absence of relative benchmarks we weighted each of the factors equally. Thus, our SKRI index relied on ordinal ranking of firms on each metric (relative to firms in the sample) to form a composite score for each company in the sample across the observed time interval.where FSi is the score of i-th factor across years of observations
- All companies in the sample were classified as “short-sighted” or “far-sighted”, based on whether their individual SKRI value were below or above the median value of SKRI across the whole set of companies. Finally, we constructed the ranking of “long-term strategic focus” (LTSF), which shows the relative degree of long termism of each company (Table 2).
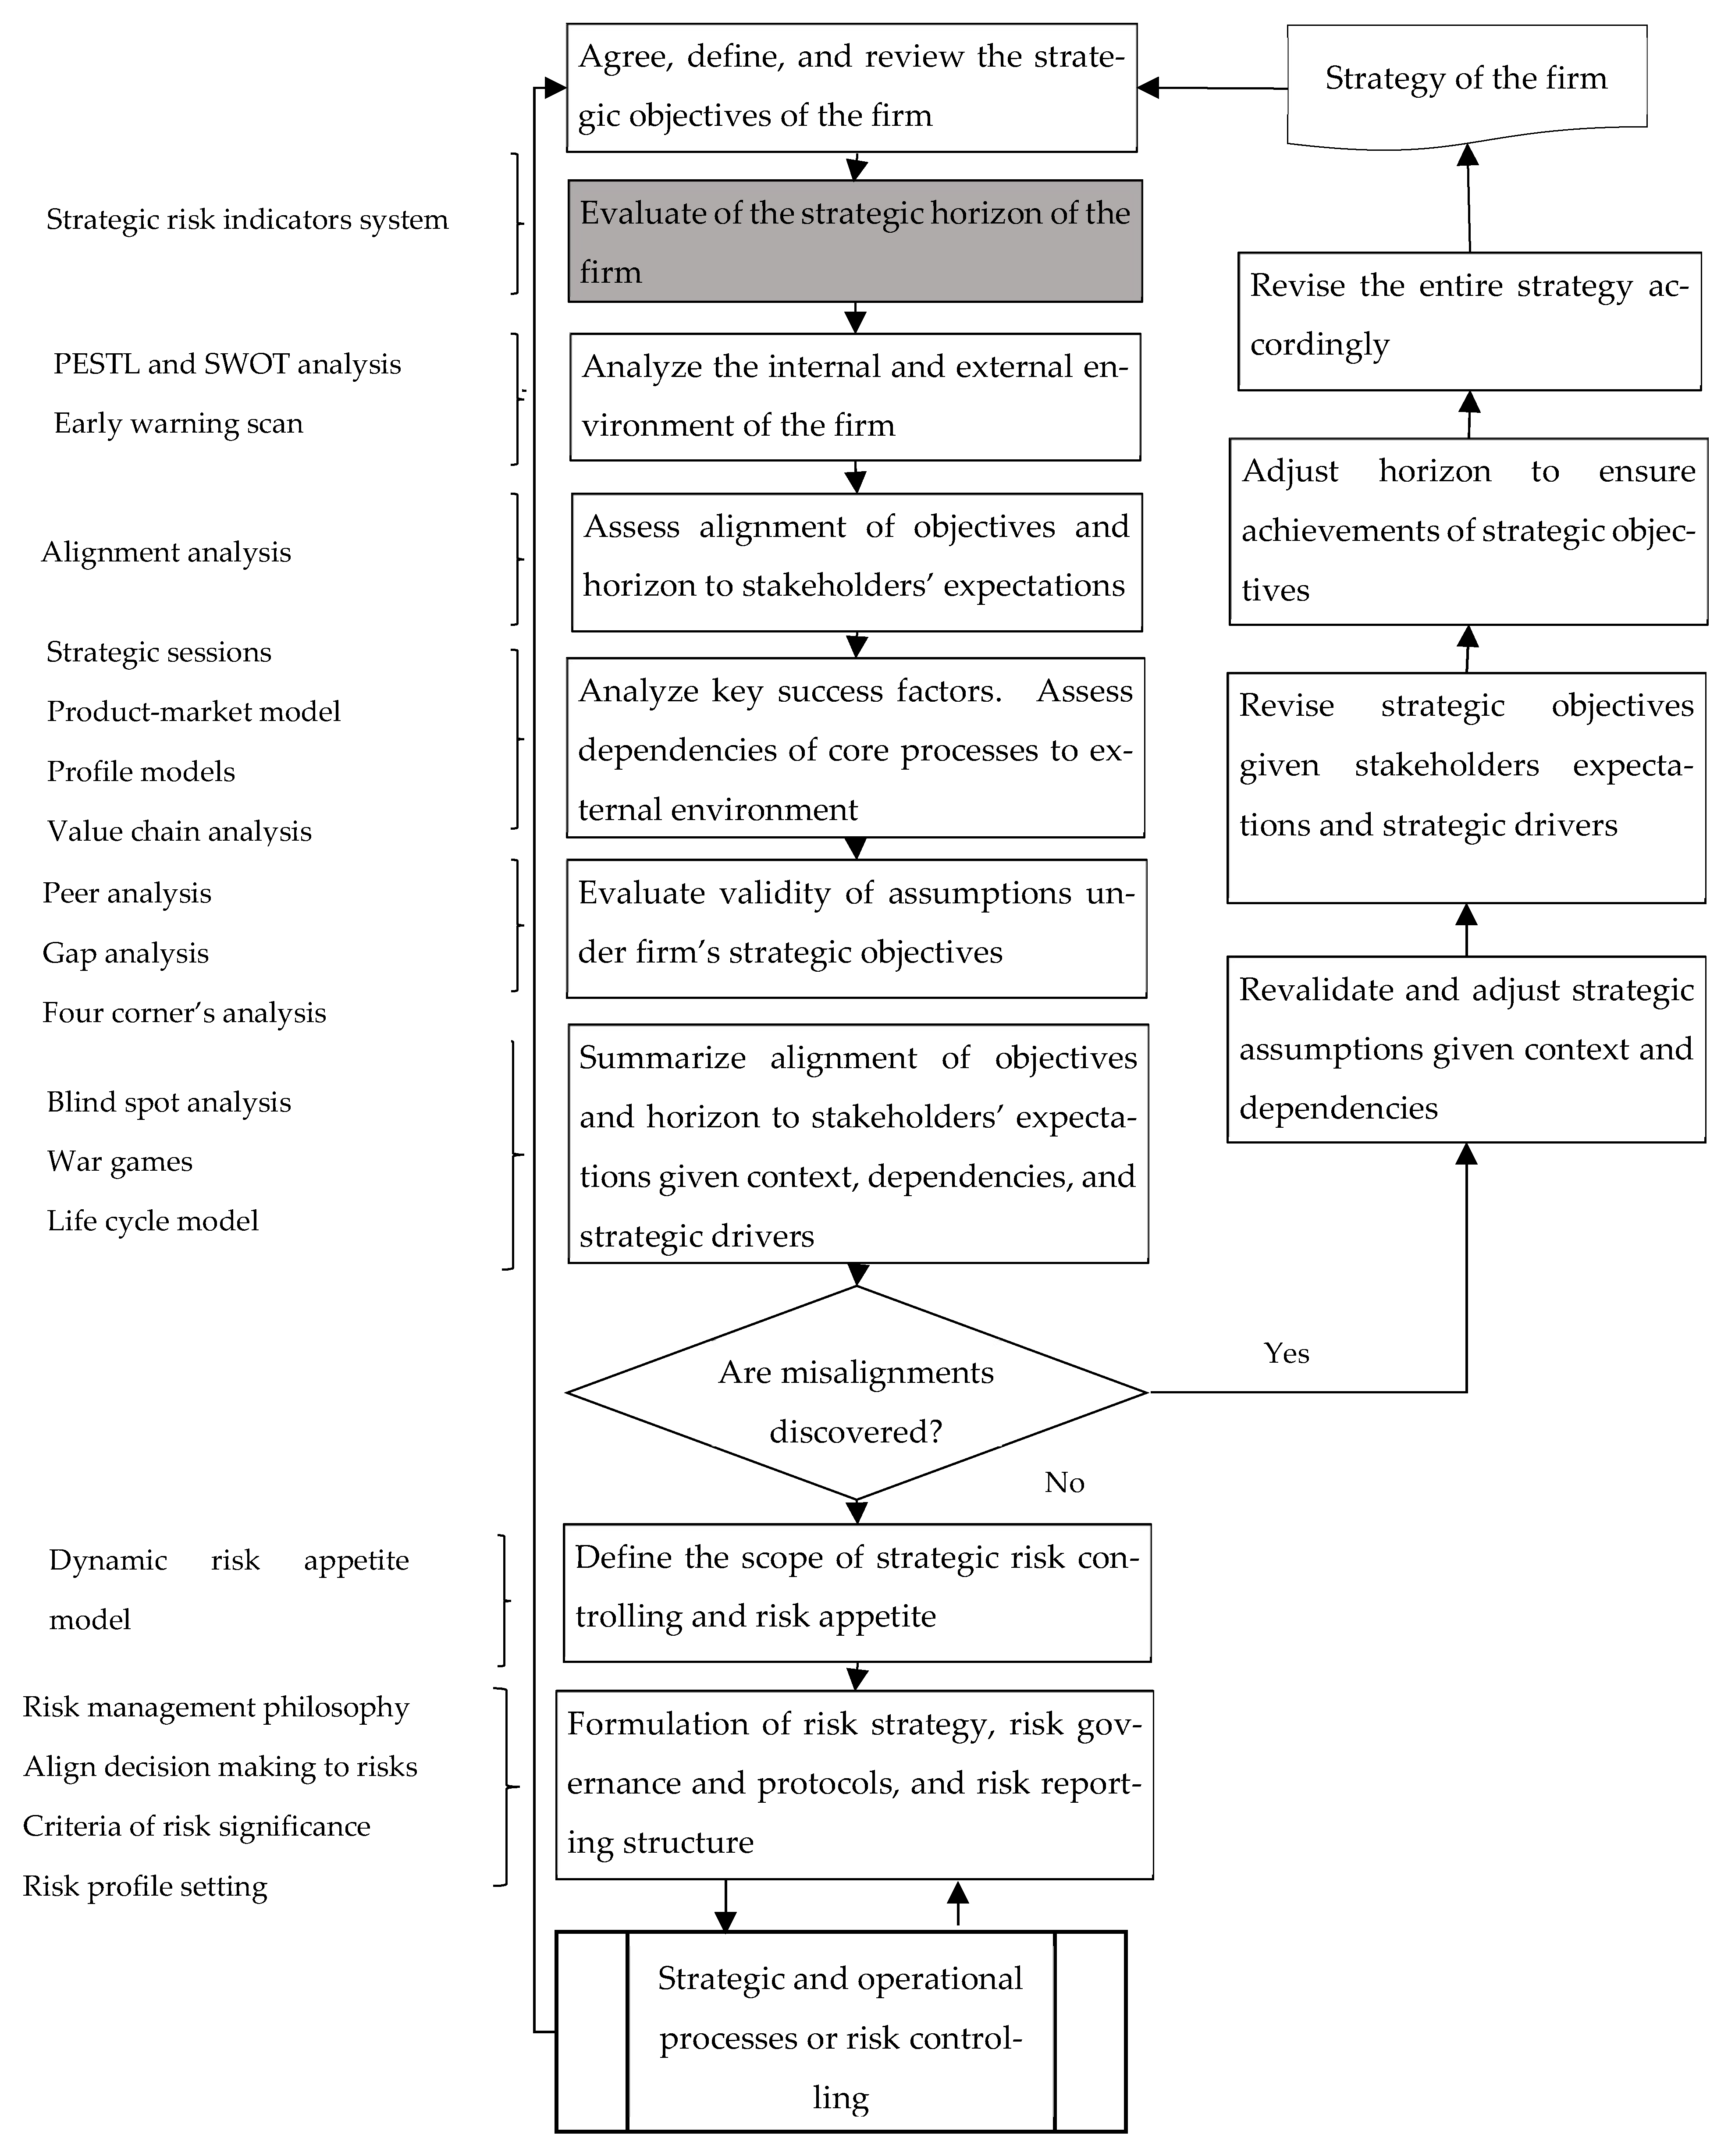
2.3. The Risk Controlling Mechanism
2.4. The Data
2.5. Analysis of Long-Term Strategic Orientation Factors for Russian Industrial Companies
3. Discussion
4. Conclusions
Author Contributions
Funding
Conflicts of Interest
References
- Agrawal, Mayank, Karel Eloot, Matteo Mancini, and Alpesh Patel. 2020. Industry 4.0: Reimaging Manufacturing Operations after COVID-19. McKinsey and Company. Available online: https://www.mckinsey.com/business-functions/operations/our-insights/industry-40-reimagining-manufacturing-operations-after-covid-19 (accessed on 20 May 2022).
- Allee, Kristian D., Brad A. Badertscher, and Teri Lombardi Yohn. 2020. Private versus public corporate ownership: Implications for future changes in profitability. Journal of Management Accounting Research 32: 27–55. [Google Scholar] [CrossRef]
- Barton, Dominic, James Manyika, Timothy Koller, Timothy Robert Palter, Jonathan Godsall, and Joshua Zoffer. 2017. Measuring the Economic Impact of Short-Termism. McKinsey Global Institute [Discussion Paper]. Available online: https://www.mckinsey.com/~/media/mckinsey/featured%20insights/long%20term%20capitalism/where%20companies%20with%20a%20long%20term%20view%20outperform%20their%20peers/mgi-measuring-the-economic-impact-of-short-termism.ashx (accessed on 20 May 2022).
- Birkel, S. Hendrik, Johannes W. Veile, Julian M. Müller, Evi Hartmann, and Kai-Ingo Voigt. 2019. Development of a Risk Framework for Industry 4.0 in the Context of Sustainability for Established Manufacturers. Sustainability 11: 384. [Google Scholar] [CrossRef]
- Bradley, Chris, Angus Dawson, and Sven Smit. 2013. The Strategic Yardstick You Can’t Afford to Ignore. McKinsey and Company. Available online: https://www.mckinsey.com/business-functions/strategy-and-corporate-finance/our-insights/the-strategic-yardstick-you-cant-afford-to-ignore (accessed on 20 May 2022).
- Chan, Louis K. C., Jason Karceski, and Josef Lakonishok. 2003. The Level and Persistence of Growth Rates. Journal of Finance 58: 643–84. [Google Scholar] [CrossRef]
- Cohn, Jonathan B., Umit G. Gurun, and Rabin Moussawi. 2020. A project-level analysis of value creation in firms’ financial management. Financial Management 49: 423–46. [Google Scholar] [CrossRef]
- DeLoach, Jim. 2018. Managing the Effects of Short-Termism on Risk Management. Available online: https://www.corporatecomplianceinsights.com/managing-the-effects-of-short-termism-on-risk-management/ (accessed on 20 May 2022).
- Funston, Frederick, and Stephen Wagner. 2010. Surviving and Thriving in Uncertainty. Creating the Risk Intelligent Enterprise. New York: John Wiley & Sons. 368p. [Google Scholar]
- Gong, Yujing, and Kung-Cheng Ho. 2021. Corporate Social Responsibility and Managerial Short-termism. Asia-Pacific Journal of Accounting and Economics 28: 604–30. [Google Scholar] [CrossRef]
- Gonzalez, Angelica, and Paul André. 2014. Board effectiveness and short-termism. Journal of Business Finance and Accounting 41: 185–209. [Google Scholar] [CrossRef]
- Gresko, Aleksandr Aleksandrovich, Elena Nikolaevna Likhosherst, Konstantin Sergeevich Solodukhin, and Andrei Yakovlevich Chen. 2019. Fuzzy Multiperiod Model of Choosing Strategies for the Organization Interaction with Stakeholder Groups in the Stakeholder Network with Multiple «Power Centers». International Journal of Innovative Technology and Exploring Engineering (IJITEE) 8: 2143–52. [Google Scholar]
- Grishunin, Sergei, N. Mukhanova, and S. Suloeva. 2018. Development of concept of risk controlling for industrial enterprise. Organizer of Production 26: 45–56. [Google Scholar] [CrossRef]
- Hopkin, Paul. 2017. Fundamentals of Risk Management. Understanding, Evaluating and Implementing Effective Risk Management. New York: Kogan Page Publishers. 489p. [Google Scholar]
- Horvath & Partners. 2004. Balanced Scorecard Umsetzen. Stuttgart: Schaeffer-Poeschel. 480p. [Google Scholar]
- Hynek, Josef, Václav Janeček, and Libuše Svobodová. 2009. Problems Associated with Investment in Advanced Manufacturing Technology from the Management Point of View. WSEAS Transactions on Systems 8: 753–62. [Google Scholar]
- Ikenberry, David, Josef Lakonishok, and Theo Vermaelen. 1995. Market underreaction to open market share repurchases. Journal of Financial Economics 39: 181–208. [Google Scholar] [CrossRef]
- Ivashkovskaya, I. V., and E. B. Kukina. 2009. Determinants of economic profit of large Russian companies. Journal of Corporate Finance Research 4: 18–33. [Google Scholar]
- Kędzior, J., and M. Rozkrut. 2014. Short-Termism in Business: Causes, Mechanisms and Consequences [Discussion Paper]. Available online: https://assets.ey.com/content/dam/ey-sites/ey-com/en_pl/topics/eat/pdf/03/ey-short-termism_raport.pdf (accessed on 20 May 2022).
- Keum, D. Daniel. 2020. Innovation, Short-termism and Cost of Strong Corporate Governance. Strategic Management Journal 42: 3–29. [Google Scholar] [CrossRef]
- Kozhina, Ksenia, and Tatiana Kudryavtseva. 2021. Analysis of the Essence of Basic Concepts of Digital Economy. In Proceedings of Digital Economy, Smart Innovations and Technology Conference. St Petersburg: St. Petersburg State Polytechnical University, pp. 85–87. [Google Scholar]
- Krause, Timothy A., and Yiuman Tse. 2016. Risk Management and Firm Value: Recent Theory and Evidence. International Journal of Accounting & Information Management 24: 250–279. [Google Scholar]
- Lefley, Frank, and Joseph Sarkis. 1997. Short-termism and the appraisal of AMT capital projects in the US and UK. International Journal of Production Research 35: 341–68. [Google Scholar] [CrossRef]
- Maglio, Roberto, Andrea Rey, Francesco Agliata, and Rosa Lombardi. 2020. Connecting Earnings Management and Corporate Social Responsibility: A Renewed Perspective. Corporate Social Responsibility and Environmental Management 27: 1108–1116. [Google Scholar] [CrossRef]
- Marginson, David, and Laurie Mcaulay. 2008. Exploring the Debate on Short-Termism: A Theoretical and Empirical Analysis. Strategic Management Journal 29: 273–92. [Google Scholar] [CrossRef]
- Marginson, David, Laurie Mcaulay, Melvin Roush, and Tony Van Zijl. 2010. Performance Measures and Short-Termism: An Exploratory Study. Accounting and Business Research 40: 353–70. [Google Scholar] [CrossRef]
- Meyer, Chris, and Stan Davis. 2003. It’s Alive. The Coming Convergence of Information, Biology and Business. New York: Crown Business. 356p. [Google Scholar]
- Miller, Kent D. 2002. Knowledge Inventories and Managerial Myopia. Strategic Management Journal 23: 689–706. [Google Scholar] [CrossRef]
- Nikolov, Atanas Nik. 2018. Managerial short-termism: An integrative perspective. Journal of marketing Theory and Practice 26: 260–79. [Google Scholar] [CrossRef]
- Pishalkina, Ilona, and Svetlana Suloeva. 2020. Modern Methods and Models of the Risk Management System with Considering to the Specificity of Industrial Enterprises. Organizer of Production 28: 69–79. [Google Scholar]
- Pogach, Jonathan. 2018. Short-termism of executive compensation. Journal of Economic Behavior and Organization 148: 150–70. [Google Scholar] [CrossRef]
- Roychowdhury, Sugata. 2006. Earnings management through real activities manipulation. Journal of Accounting and Economics 42: 335–70. [Google Scholar] [CrossRef]
- Tang, Kelly, and Christopher Greenwald. 2016. Long-Termism Versus Short-Termism: Time for the Pendulum to Shift? [White Paper]. Available online: https://integratedreporting.org/wp-content/uploads/2017/03/SPLong-TermismversusShort-termism.pdf (accessed on 20 May 2022).
- Worthington, Andrew C., and Tracey West. 2001. Economic Value-Added: A Review of the Theoretical and Empirical Literature. Asian Review of Accounting 9: 67–86. [Google Scholar] [CrossRef] [Green Version]
- Zaytsev, Andrey, Dmitriy Rodionov, Nikolay Dmitriev, and Oleg Kichigin. 2020. Comparative Analysis of Results of Using Assessment Methods for Intellectual Capital. Paper presented at the International Scientific Conference on Digital Transformation on Manufacturing, Infrastructure and Service 2019, St. Petersburg, Russia, April 28–29. [Google Scholar]

| Factor | Way of Calculation/Evaluation | Rationale | The Feature of Far-Sighted Firm | Relationship between SKRI and Factor |
|---|---|---|---|---|
| Strategic financial metrics | ||||
| Investments | t—reporting period (year) | Long-term firms consistently invest much more than require sustaining current operations | >1 | Direct |
| Earning quality | Long-term firms will generate earnings that reflect cash flow and not accounting decisions | ~0 | Inverse | |
| Margin growth | Growth rate of net income—Growth rate of revenue | Long-term firm grow net income by growth in sales rather than by manipulation by expenses | ~0 | Inverse |
| Earning-per-share (EPS) growth | Growth rate of EPSt-Growth rate of net incomet | Long-term firms do not artificially boost EPS (e.g., by share buyback) but focus on fundamentals of value creation | ~0 or negative | Inverse |
| Corporate governance | ||||
| Quality of auditor | The place of firm’s auditor in ranking of audit companies, published by Russian RAEX agency | Long-term firms use reputable auditors as they do not need to manipulate accounting records | Top places in the ranking | Direct |
| Quality of corporate governance | Percentage of compliance with corporate governance requirements (Corporate governance code of Central bank of Russia) according to the self-assessment of companies | Corporate governance systems of long-term firms comply to regulatory requirements | ~100% | Direct |
| Formalization of company’s strategy | The presence of a formalized strategy and financial targets for the period of more than 2 years. The strategic goals correspond to the scale of business | Long-term firms disclose their strategy and financial targets to investors. The strategic goals correspond to the scale of business | Compliance to the statement | Direct |
| Transparency of ownership | The composition of the ultimate beneficiaries is fully disclosed; the ownership structure is transparent to investors | Long-term firms fully disclose the ownership structure of the firm | Compliance to the statement | Direct |
| Susceptibility to accounting manipulations | ||||
| Days in inventory growth (DII) | Long-term firms will maintain inventory level consistent to shipment to customers (reflected in direct cost) | ~1 | Inverse | |
| Days in accounts receivable growth (DSRI) | Long-term firms will maintain accounts receivable level consistent to sales | ~1 | Inverse | |
| Asset quality index (AQI) | CA—current assets Net PPE—residual value of property, plant, and equipment TA—total assets of the firm | Long-term firms consistently maintain stable ratio of long-term assets other than PPE and do not use other long-term assets as a source of cost deferral | ~0 or negative | Inverse |
| Sustainable financial policy | ||||
| Share of permanent capital | Long-term firms finance growth in assets by long-term (permanent) capital | Close to 1 | Direct | |
| Retained cash flow margin | Long-term firms consistently retain sufficient cash for future development after liability and dividend payments | Above market or industry peers | Direct | |
| Environmental issues | ||||
| Formalization of environmental management system | The presence of (1) ISO 14001 certified system of environmental management; (2) existence of strategy or policy of environmental protection; (3) existence realization of ecological requirements to suppliers and buyers; (4) realization of environmental educational program for stakeholders, society, and employees; and (5) serious ecological incidents and accidents in the last 5 years | Long-term firms maintain and constantly improve environmental management system, which covers the entire supply chain. Realization of this system helped to reduce the number of ecological incidents and accidents | Compliance to the statement (maximum 5 points) | Direct |
| Environmental impact assessment | Reduction in unit-based emission in air, water, and soil; recycling of packaging; and realization of program aimed in biodiversity | Long-term firms perform efforts to reduce emissions, recycle of packaging and performing programs to sustain biodiversity | Maximum of 5 points | Direct |
| Climate change actions | Existence of environmental impact reduction/climate change adaptation programs and participation in international voluntary initiatives in the field of sustainable development/combating climate change/voluntary certification | Long-term firms develop and perform environmental impact reduction and climate change adaptation programs | Maximum of 3 points | Direct |
| Usage of resources | Reduction in unit-based water consumption and energy intensity consumptions | Long-term firms develop and perform programs to reduce per unit consumptions of water and energy | Maximum 2 points | Direct |
| Social investments and inclusive culture | ||||
| Contribution to society | Realization of (1) social investments in regions of presence; (2) policies of interactions with local communities; (3) sustainable charity programs | Long-term firms develop and realize policies and efforts to contribute to society and local communities | Maximum 3 points | Direct |
| Human capital | (1) Reduction in unit-based injuries and accidents at work; (2) availability of continuous training and employee development programs; (3) providing a wide range of programs and activities for social support of employees | Long-term firms invest in employees’ well-being and maintain zero tolerance policies to injuries at work | Maximum 3 points | Direct |
| Inclusive work environment | Existence of (1) feedback mechanism for employees; (2) employment programs for persons with disabilities; (3) gender balance practices (including management); (4) requirements for suppliers/contractors in the field of human rights/ethics of doing business | Long-term firms create work environment, which foster feedback, inclusive culture, gender balance, and working with responsible partners | Maximum 4 points | Direct |
| LTSF Level | Group Name | Definition of the Group |
|---|---|---|
| 3 | Foresight company | SKRI > UT M—median of SKRI UB—upper bound |
| 2 | Far-sighted company | |
| 1 | Myopic company | LB—lower bound |
| 0 | Blind company |
| Factor | Units | Mean | Median | Standard Deviation | Maximum | Minimum |
|---|---|---|---|---|---|---|
| EVA | RUBm | −11,260 | 46 | 114,407 | 613,748 | −1,401,295 |
| Total Assets | RUBm | 635,935 | 58,660 | 2,159,628 | 20,810,440 | 130 |
| Revenue | RUBm | 357,206 | 39,265 | 1,092,750 | 8,576,000 | 1 |
| Cash flow from operations | RUBm | 73,587 | 2959 | 230,777 | 2,058,000 | −16,012 |
| WACC | % | 9.0 | 8.2 | 4.2 | 30.7 | 1.8 |
| NOPAT | RUBm | 43,520 | 9640 | 138,250 | 1,661,341 | −946,766 |
| Invested capital | RUBm | 608,700 | 116,894 | 1,867,100 | 21,920,062 | −2100 |
| EBITDA margin | % | 20.0 | 19.5 | 19.4 | 83.9 | −139.4 |
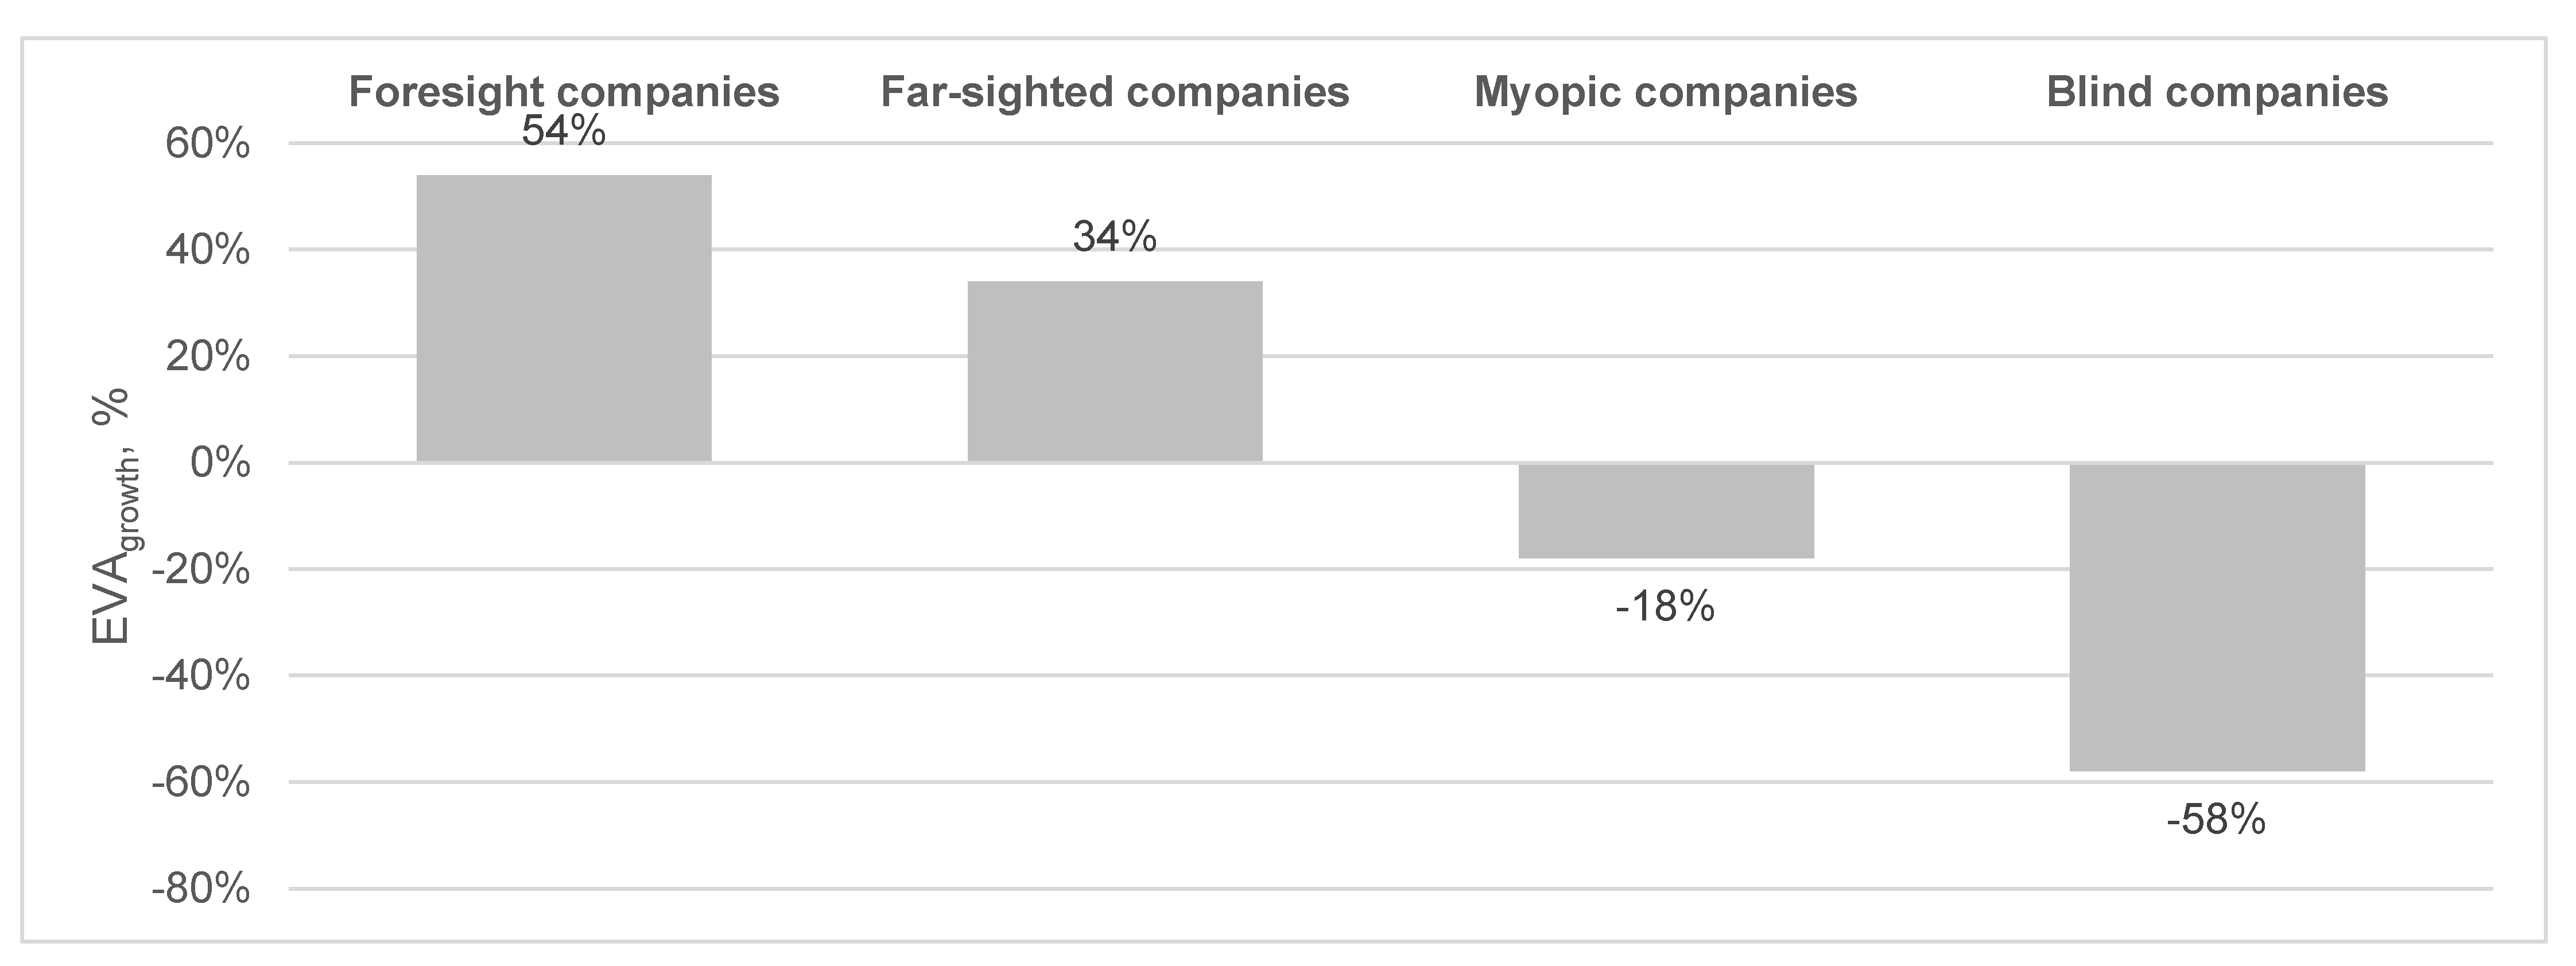
| Factors | Foresight Companies | Far-Sighted Companies | Myopic Companies | Blind Companies |
|---|---|---|---|---|
| Revenue (RUBm) | 498,597 | 227,737 | 131,159 | 6221 |
| Assets (RUBm) | 866,756 | 285,645 | 132,706 | 22,353 |
| EVA (RUBm) | 508 | 7 | 900 | 8 |
| CAGR of revenue growth (%) | 5.5 | 6.1 | 3.0 | 4.1 |
| Return of capital employed (ROIC, %) | 7.80 | 8.75 | 8.45 | 8.65 |
| Cost of capital (%) | 7.78 | 8.00 | 8.45 | 8.50 |
| EVA spread (ROIC-cost of capital), % | −0.02 | −0.51 | 1.00 | 0.40 |
| NOPAT margin, % | 2.86 | 3.14 | 0.95 | 3.43 |
| EBITDA margin, % | 31% | 28% | 16% | 14% |
| EBIT margin, % | 22% | 16% | 13% | 6% |
| Assets turnover (x) | 0.61 | 0.74 | 0.72 | 0.74 |
| Earnings quality (x) | 0.11 | 0.09 | 0.02 | 0.04 |
| Margin growth (x) | 0.04 | 0.08 | 0.02 | 0.37 |
| EPS growth (x) | 0.01 | 0.00 | 0.00 | 0.05 |
| DSRI (x) | 0.95 | 1.04 | 0.99 | 0.98 |
| DII (x) | 1.00 | 1.02 | 1.02 | 0.99 |
| AQI (x) | 0.99 | 1.01 | 0.96 | 1.08 |
| Corporate governance index (x) | 10 | 10 | 8 | 5 |
| Share of permanent capital (x) | 0.78 | 0.70 | 0.60 | 0.64 |
| Financial leverage (debt/equity, x) | 1.7 | 2.4 | 2.8 | 5.4 |
| ESG disclosure score (x) | 45 | 33 | 21 | 12 |
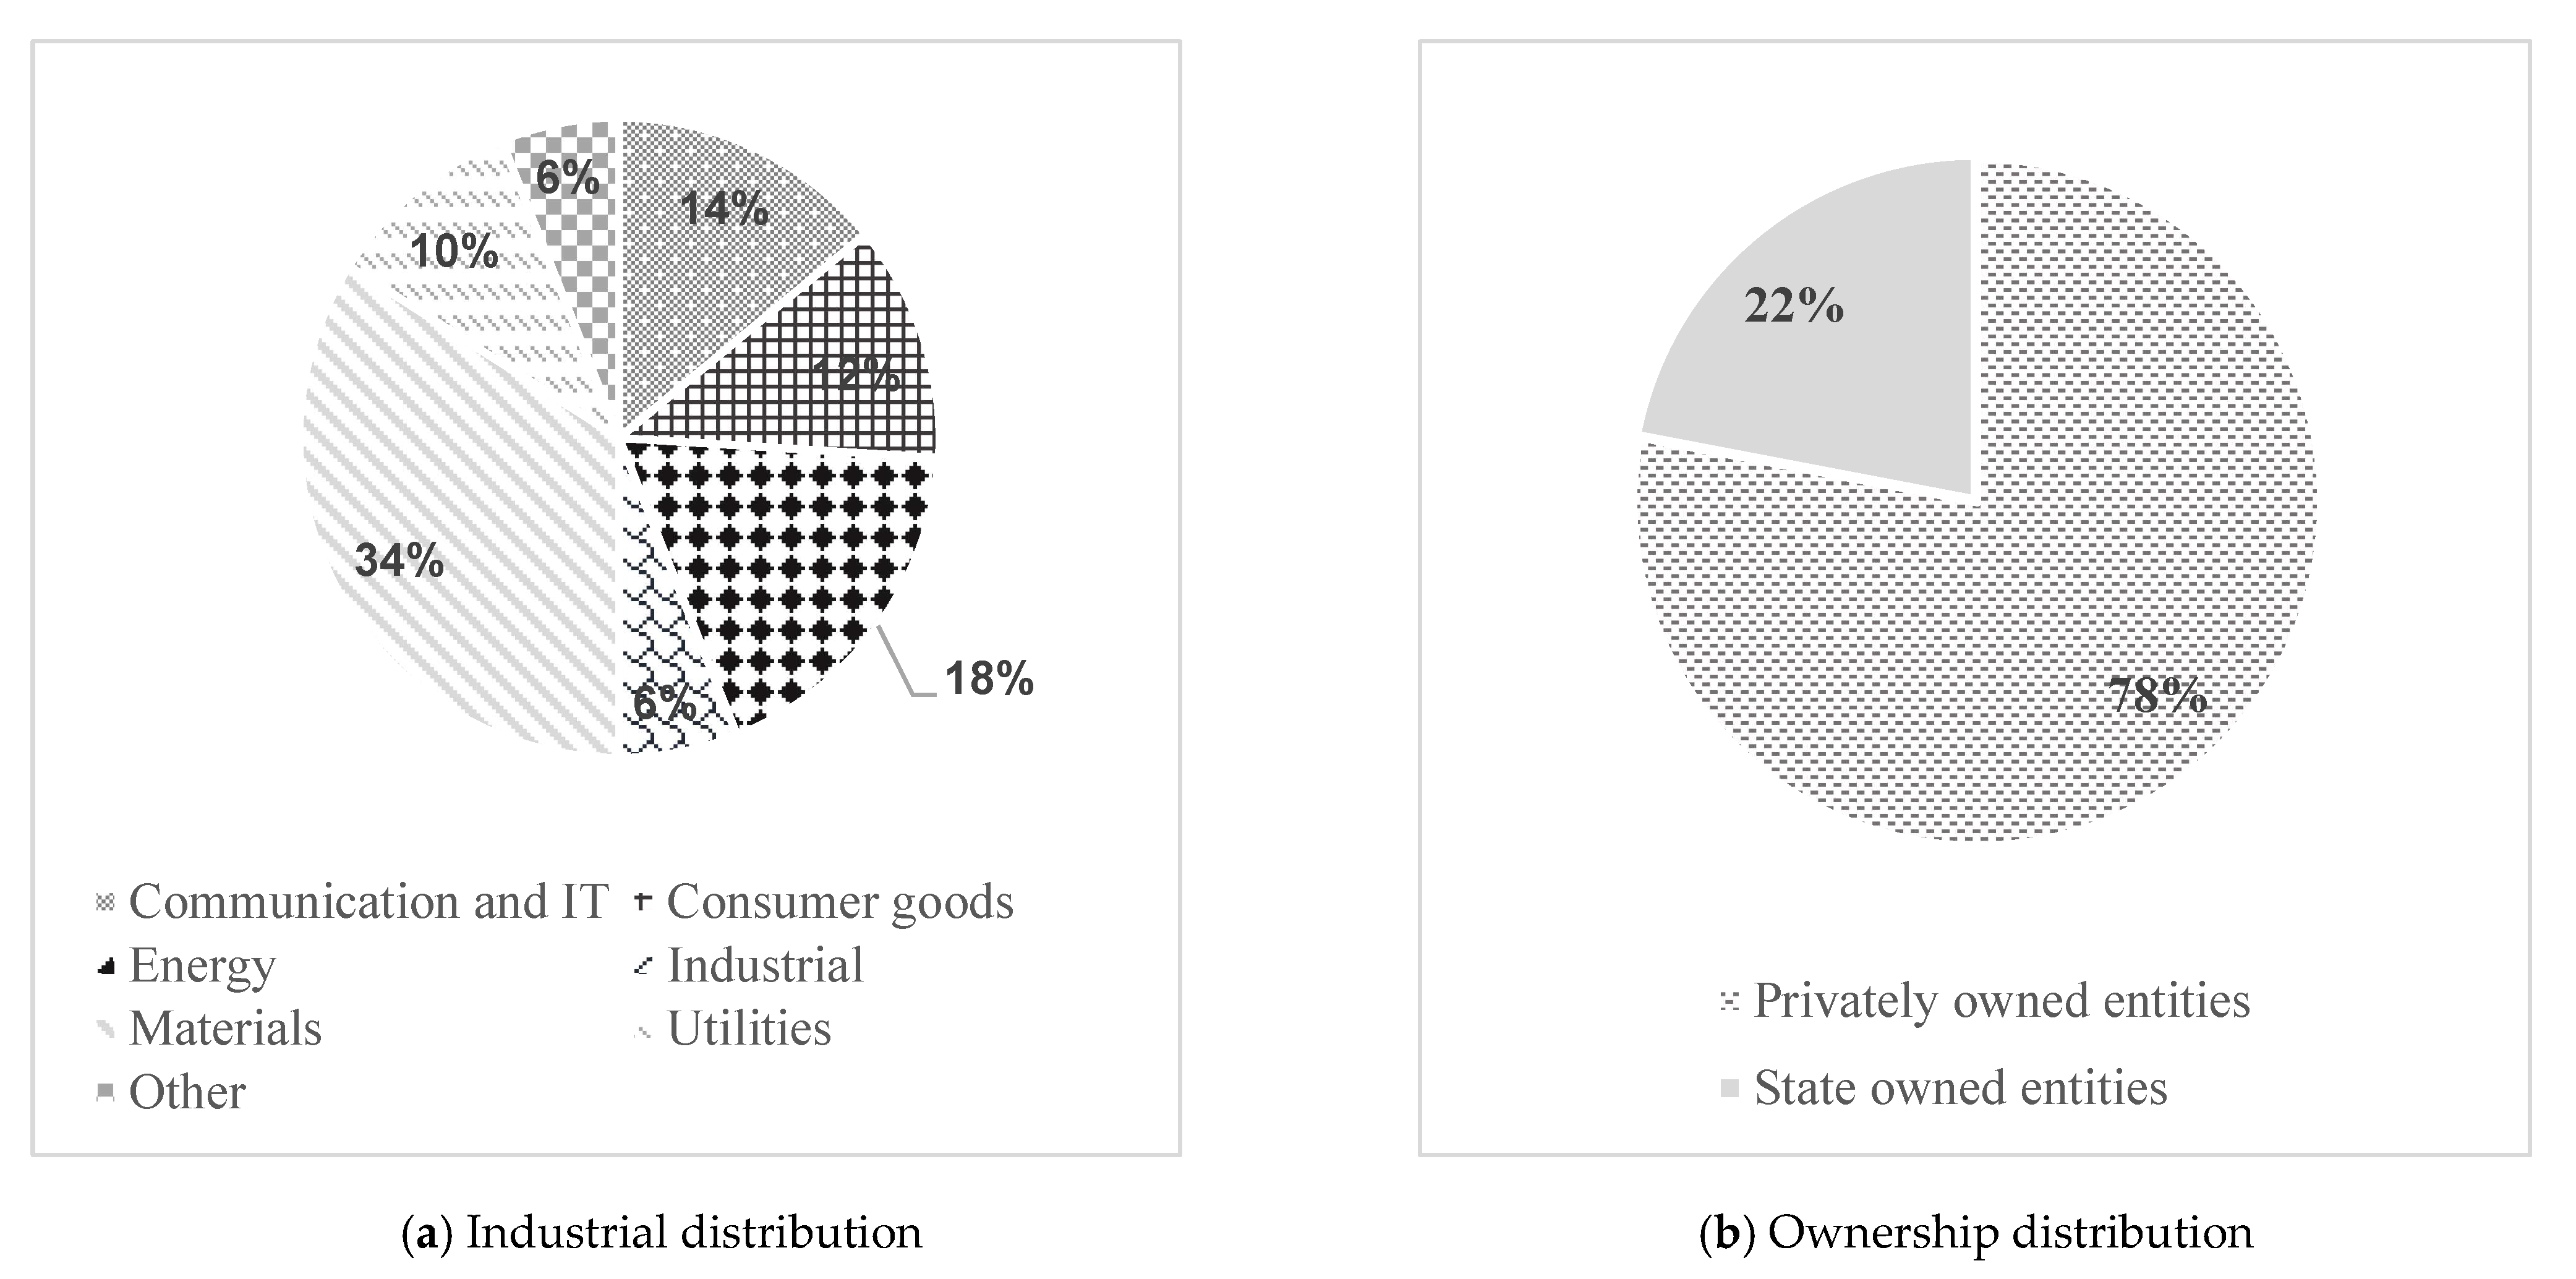
| Industry | Total # of Firms | Foresight Companies (#), LTSF = 3 | Far-Sighted Companies (#), LTSF = 2 | Myopic Companies (#), LTSF = 1 | Blind Companies (#), LTSF = 0 |
|---|---|---|---|---|---|
| Communication and IT | 7 | 0 | 4 | 1 | 2 |
| Consumer goods and healthcare | 7 | 0 | 2 | 3 | 2 |
| Oil and gas | 9 | 4 | 2 | 3 | 0 |
| Industrial | 3 | 0 | 0 | 2 | 1 |
| Materials | 17 | 3 | 7 | 5 | 2 |
| Real estate | 2 | 0 | 0 | 1 | 1 |
| Utilities | 5 | 3 | 1 | 1 | 0 |
Publisher’s Note: MDPI stays neutral with regard to jurisdictional claims in published maps and institutional affiliations. |
© 2022 by the authors. Licensee MDPI, Basel, Switzerland. This article is an open access article distributed under the terms and conditions of the Creative Commons Attribution (CC BY) license (https://creativecommons.org/licenses/by/4.0/).
Share and Cite
Grishunin, S.; Suloeva, S.; Burova, E. Development of Risk Management Mechanism and the System of Risk Metrics to Evaluate and Enhance the Long-Term Orientation of the Strategies of Non-Financial Companies. Risks 2022, 10, 182. https://doi.org/10.3390/risks10090182
Grishunin S, Suloeva S, Burova E. Development of Risk Management Mechanism and the System of Risk Metrics to Evaluate and Enhance the Long-Term Orientation of the Strategies of Non-Financial Companies. Risks. 2022; 10(9):182. https://doi.org/10.3390/risks10090182
Chicago/Turabian StyleGrishunin, Sergey, Svetlana Suloeva, and Ekaterina Burova. 2022. "Development of Risk Management Mechanism and the System of Risk Metrics to Evaluate and Enhance the Long-Term Orientation of the Strategies of Non-Financial Companies" Risks 10, no. 9: 182. https://doi.org/10.3390/risks10090182
APA StyleGrishunin, S., Suloeva, S., & Burova, E. (2022). Development of Risk Management Mechanism and the System of Risk Metrics to Evaluate and Enhance the Long-Term Orientation of the Strategies of Non-Financial Companies. Risks, 10(9), 182. https://doi.org/10.3390/risks10090182