
The Role of Financial Situation in the Relationship between Environmental Initiatives and Competitive Priorities of Production Companies in Poland


Abstract
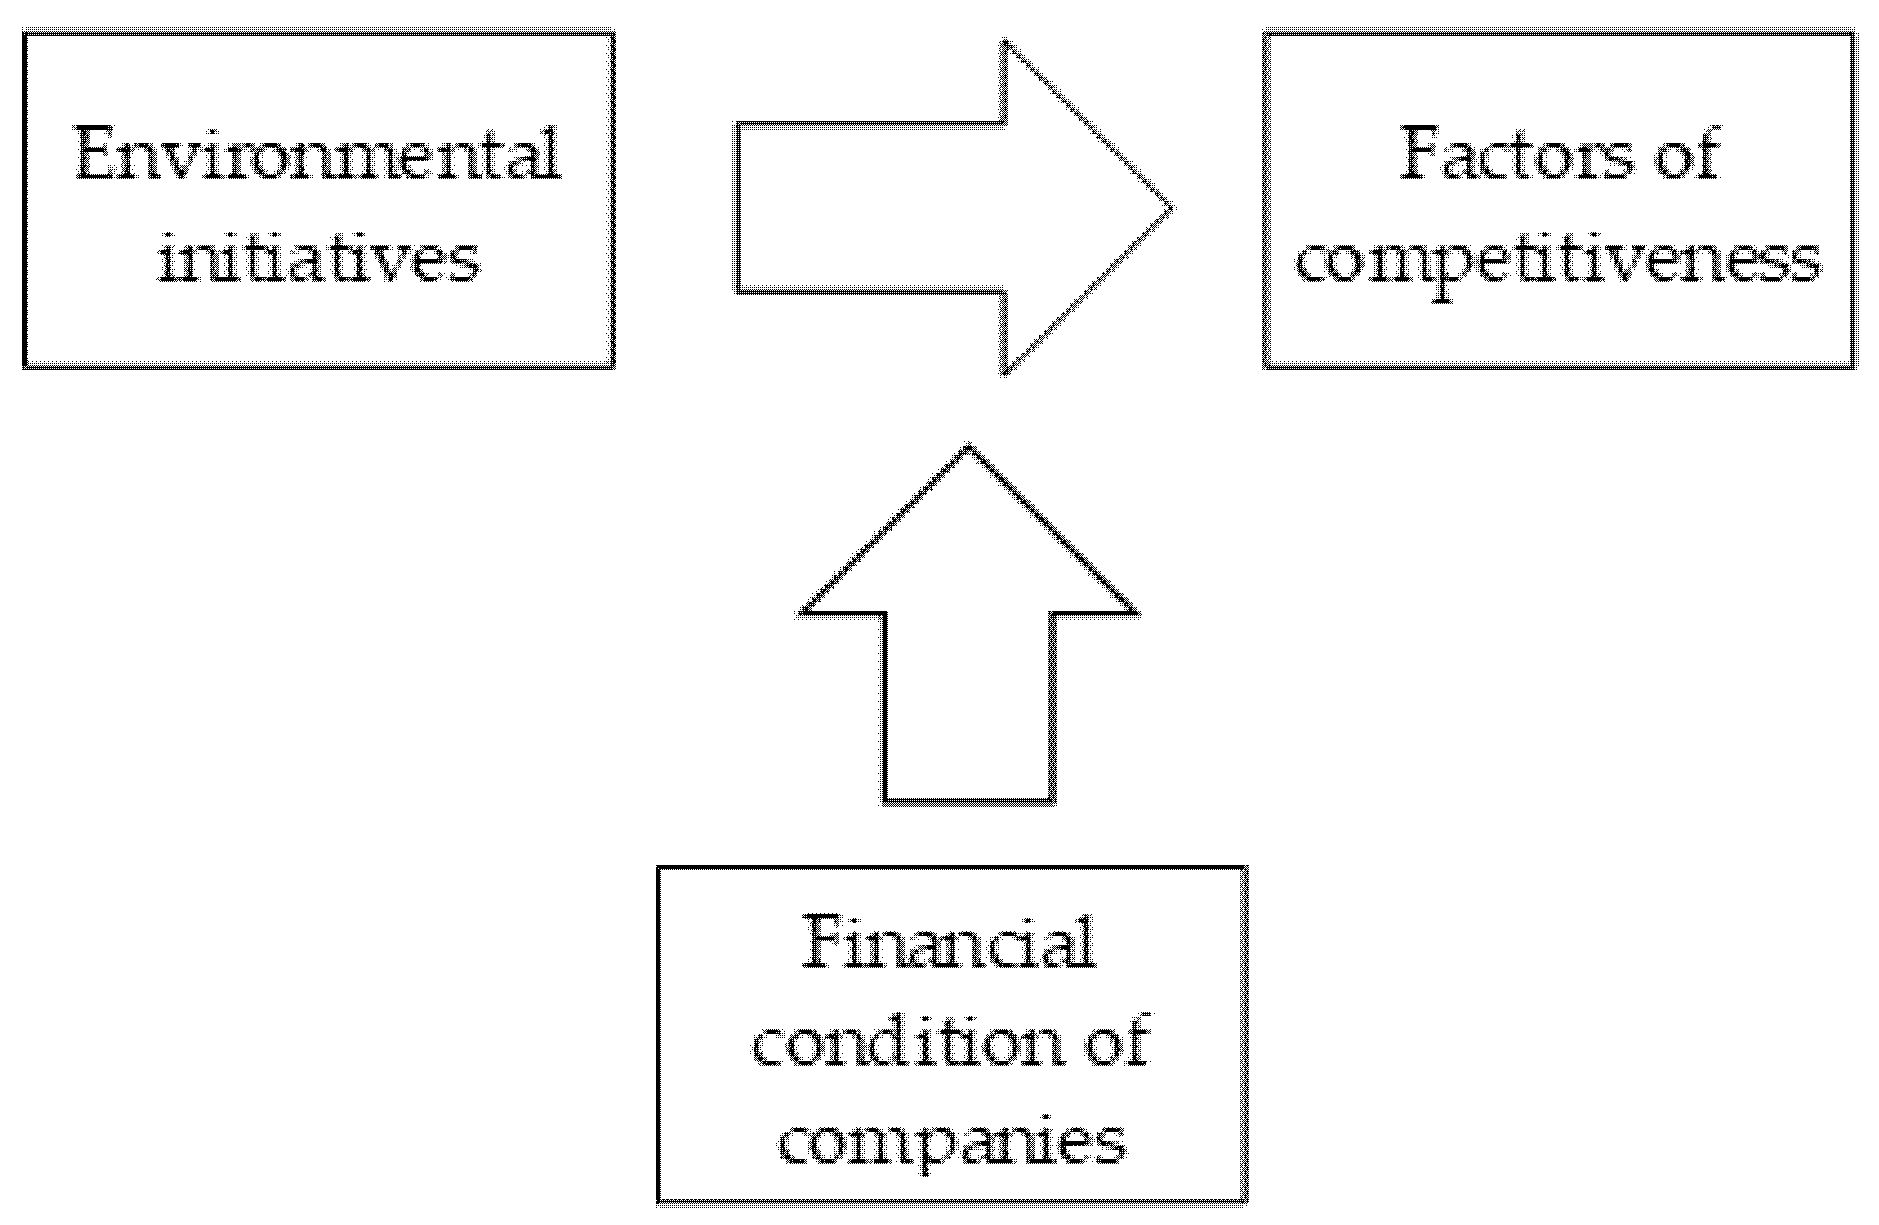
1. Introduction
2. Literature Review
3. Data and Method
4. Results and Discussion
4.1. Sample Selection
4.2. Sample Characteristics
4.3. Companies’ Environmental Initiatives
4.4. SEM Results
5. Conclusions
6. Limitations
Funding
Institutional Review Board Statement
Informed Consent Statement
Data Availability Statement
Conflicts of Interest
| 1 | Detailed results of the models CFA1–CFA4 and SEM1–SEM4 with the modification indices were presented in (Fura 2020). |
References
- Abban, Abdul Rashid, and Mohammad Zahid Hasan. 2021. The causality direction between environmental performance and financial performance in Australian mining companies—A panel data analysis. Resource Policy 70: 101894. [Google Scholar] [CrossRef]
- Adda, Godfrey, Ghulam Ahmed Bin Dokor, John Bosco Azigwe, and Nii Afotey Odai. 2021. Management commitment and corporate sustainability integration into small and medium-scale enterprises: A mediation effect of strategic decision-making. Economics, Management and Sustainability 6: 6–22. [Google Scholar] [CrossRef]
- Adomako, Samuel, and Mai Dong Tran. 2022. Sustainable environmental strategy, firm competitiveness, and financial performance: Evidence from the mining industry. Resource Policy 75: 102515. [Google Scholar] [CrossRef]
- Bortolotti, Thomas, Pamela Danese, Barbara B. Flynn, and Pietro Romano. 2015. Leveraging fitness and lean bundles to build the cumulative performance sand cone model. International Journal of Production Economics 162: 227–41. [Google Scholar] [CrossRef]
- Boyer, Kenneth K., and Marianne W. Lewis. 2002. Competitive priorities: Investigating the need for trade-offs in operations strategy. Production and Operations Management 11: 9–20. [Google Scholar] [CrossRef]
- Bozarth, Cecil C., and Robert B. Handfield. 2007. Wprowadzenie do Zarządzania Operacjami i Łańcuchem Dostaw: Kompletny Podręcznik Logistyki i Zarządzania Dostawami. Gliwice: Helion. [Google Scholar]
- Cai, Shaohan, and Zhilin Yang. 2014. On the relationship between business environment and competitive priorities: The role of performance frontiers. International Journal of Production Economics 151: 131–45. [Google Scholar] [CrossRef]
- Central Statistical Office. 2017. Statistical Yearbook of Industry—Poland; Warsaw: Central Statistical Office. Available online: https://stat.gov.pl/obszary-tematyczne/roczniki-statystyczne/roczniki-statystyczne/rocznik-statystyczny-przemyslu-2017,5,11.html (accessed on 25 June 2019).
- Chen, Lujie, Andreas Feldmann, and Ou Tang. 2015. The relationship between disclosures of corporate social performance and financial performance: Evidences from GRI reports in manufacturing industry. International Journal of Production Economics 170: 445–56. [Google Scholar] [CrossRef]
- Chwiłkowska-Kubala, Anna, Szymon Cyfert, Kamila Malewska, Katarzyna Mierzejewska, and Witold Szumowski. 2021. The Relationships among Social, Environmental, Economic CSR Practices and Digitalization in Polish Energy Companies. Energies 14: 7666. [Google Scholar] [CrossRef]
- Díaz-Garrido, Eloísa, María Luz Martín-Peña, and José María Sánchez-López. 2011. Competitive priorities in operations: Development of an indicator of strategic position. CIRP Journal of Manufacturing Science and Technology 4: 118–25. [Google Scholar] [CrossRef]
- Emerging Markets Information Service. 2018. Available online: https://www.emis.com/pl (accessed on 21 January 2018).
- Feldman, Stanley J., Peter A. Soyka, and Paul G. Ameer. 1997. Does improving a firm’s environmental management system and environmental performance result in a higher stock price? The Journal of Investing 6: 663–80. [Google Scholar] [CrossRef]
- Fura, Barbara. 2020. Wpływ Inicjatyw Środowiskowych na Konkurencyjność Przedsiębiorstw Produkcyjnych w Polsce. Prace Naukowe Wydziału Ekonomii, Seria: Monografie i Opracowania, 26. Rzeszów: Wyd. Uniwersytetu Rzeszowskiego. [Google Scholar]
- Govindan, Kannan, Devika Kannan, and K. Madan Shankar. 2014. Evaluating the drivers of corporate social responsibility in the mining industry with multi-criteria approach: A multi-stakeholder perspective. Journal of Cleaner Production 84: 214–32. [Google Scholar] [CrossRef]
- Grzebyk, Mariola, and Małgorzata Stec. 2015. Sustainable Development in EU Countries: Concept and Rating of Levels of Development. Sustainable Development 23: 110–123. [Google Scholar] [CrossRef]
- Hayes, Robert. H., and Steven C. Wheelwright. 1984. Restoring Our Competitive Edge: Competing through Manufacturing. New York: John Wiley & Sons. [Google Scholar]
- Hershberger, Scott L., and George A. Marcoulides. 2013. The problem of equivalent structural models. In Structural Equation Modeling: A Second Course. Charlotte: Information Age Publishing, pp. 3–39. [Google Scholar]
- Jabbour, Charbel José Chiappetta, Eliciane Maria Da Silva, Ely Laureano Paiva, and Fernando Cesar Almada Santos. 2012. Environmental management in Brazil: Is it a completely competitive priority? Journal of Cleaner Production 21: 11–22. [Google Scholar] [CrossRef]
- Konarski, Roman. 2009. Modele Równań Strukturalnych. Teoria i Praktyka. Warszawa: Wyd. Naukowe PWN. [Google Scholar]
- Lahouel, Béchir Ben, Lotfi Taleb, Younes Ben Zaied, and Shunsuke Managi. 2022. Business case complexity and environmental sustainability: Nonlinearity and optimality from an efficiency perspective. Journal of Envionmental Management 301: 113870. [Google Scholar] [CrossRef] [PubMed]
- López-Gamero, María D., José F. Molina-Azorín, and Enrique Claver-Cortés. 2009. The whole relationship between environmental variables and firm performance: Competitive advantage and firm resources as mediator variables. Journal of Environmental Management 90: 3110–21. [Google Scholar] [CrossRef] [PubMed]
- Mączyńska, Elżbieta. 1994. Ocena kondycji przedsiębiorstwa (Uproszczone metody). Życie Gospodarcze 38: 42–45. [Google Scholar]
- Melnyk, Steven A., Robert P. Sroufe, and Roger Calantone. 2003. Assessing the impact of environmental management systems on corporate and environmental performance. Journal of Operational Management 21: 329–51. [Google Scholar] [CrossRef]
- Montabon, Frank, Robert Sroufe, and Ram Narasimhan. 2007. An examination of corporate reporting, environmental management practices and firm performance. Journal of Operational Management 25: 998–1014. [Google Scholar] [CrossRef]
- Nishitani, Kimitaka, and Katsuhiko Kokubu. 2020. Can firms enhance economic performance by contributing to sustainable consumption and production? Analyzing the patterns of influence of environmental performance in Japanese manufacturing firms. Sustainable Production and Consumption 21: 156–69. [Google Scholar] [CrossRef]
- Nomenclature of Territorial Units for Statistics 1—NUTS 1. 2021. Available online: https://stat.gov.pl/statystyka-regionalna/jednostki-terytorialne/klasyfikacja-nuts/klasyfikacja-nuts-w-polsce/ (accessed on 29 January 2021).
- Ociepa-Kubicka, Agnieszka, Iwona Deska, and Ewa Ociepa. 2021. Organizations towards the evolution of environmental management tools ISO 14001 and EMAS. Energies 14: 4870. [Google Scholar] [CrossRef]
- Porter, Michael E. 1990. The Competitive advantage of nations. Harvard Business Review 90: 73–91. [Google Scholar]
- Porter, Michael E., and Claas Van der Linde. 1995. Toward a new conception of the environment-competitiveness relationship. Journal of Economic Perspectives 9: 97–118. [Google Scholar] [CrossRef]
- Rosseel, Yves. 2012. Lavaan: An R package for structural equation modeling. Journal of Statistical Software 48: 1–36. [Google Scholar] [CrossRef]
- Russell, Suzana N., and Harvey H. Millar. 2014. Competitive priorities of manufacturing firms in the Caribbean. IOSR Journal of Business and Management 16: 72–82. [Google Scholar] [CrossRef]
- Russo, Michael V., and Paul A. Fouts. 1997. A Resource-Based Perspective on Corporate Environmental Performance and Profitability. Academic Management Journal 40: 534–59. [Google Scholar]
- Schermelleh-Engel, Karin, Helfried Moosbrugger, and Hans Müller. 2003. Evaluating the Fit of Structural Equation Models: Tests of Significance and Descriptive Goodness-of-Fit Measures. Methods of Psychological Research Online 8: 23–74. [Google Scholar]
- Schoenherr, Tobias. 2012. The role of environmental management in sustainable business development: A multi-country investigation. International Journal of Production Economics 140: 116–28. [Google Scholar] [CrossRef]
- Shrivastava, Paul. 1994. Environmental technologies and competitive advantage. Strategic Management Journal 16: 183–200. [Google Scholar] [CrossRef]
- Skinner, Wickham. 1969. Manufacturing Missing Link in Corporate Strategy. Harvard Business Review 47: 136–45. [Google Scholar]
- The R Project for Statistical Computing. 2019. Available online: https://www.r-project.org/ (accessed on 25 May 2019).
- Trujillo-Gallego, Mariana, William Sarache, and Miguel Afonso Sellitto. 2021. Identification of practices that facilitate manufacturing companies’ environmental collaboration and their influence on sustainable production. Sustainable Production and Consumption 27: 1372–91. [Google Scholar] [CrossRef]
- Tzouvanas, Panagiotis, Renatas Kizys, Ioannis Chatziantoniou, and Roza Sagitova. 2020. Environmental and financial performance in the European manufacturing sector: An analysis of extreme tail dependency. British Accounting Review 52: 100863. [Google Scholar] [CrossRef]
- Wagner, Marcus, Nguyen Van Phu, Théophile Azomahou, and Walter Wehrmeyer. 2002. The relationship between the environmental and economic performance of firms: An analysis of the European paper industry. Corporate Social Responsibility and Environmental Management 9: 133–46. [Google Scholar] [CrossRef]
- Walley, Noah, and Bradley Whitehead. 1994. It’s not easy being green. Harvard Business Review 72: 46–52. [Google Scholar]
- Wiengarten, Frank, Mark Pagell, and Brian Fynes. 2013. ISO 14000 certification and investments in environmental supply chain management practices: Identifying differences in motivation and adoption levels between Western European and North American companies. Journal of Production Economics 56: 18–28. [Google Scholar] [CrossRef]
- Wieprow, Joanna Małgorzata, and Justyna Barlik. 2017. Application of discriminant models in predicting a company’s risk of bankruptcy. Central European Review of Economics and Management 1: 121–34. [Google Scholar] [CrossRef][Green Version]
- Wysocki, Jacek. 2021. Innovative green initiatives in the manufacturing SME sector in Poland. Sustainability 13: 2386. [Google Scholar] [CrossRef]
- Xie, Xuemei, Saixing Zeng, Zhipeng Zang, and Hailiang Zou. 2017. Identifying the factors determining cooperative innovation effect in emerging economies: Evidence from Chinese firms. Chinese Managenent Studies 11: 366–86. [Google Scholar] [CrossRef]
- Yang, Chen-Lung, Shu-Ping Lin, Ya-hui Chan, and Chwen Sheu. 2010. Mediated effect of environmental management on manufacturing competitiveness: An empirical study. International Journal of Production Economics 123: 210–20. [Google Scholar] [CrossRef]


| Macro-Region | Sample [%] | Population [%] |
|---|---|---|
| Southern | 18.33 | 18.38 |
| North-Western | 17.44 | 19.40 |
| South-Western | 10.51 | 10.91 |
| Northern | 16.03 | 18.28 |
| Central | 8.46 | 7.83 |
| Eastern | 13.59 | 9.12 |
| Mazowieckie Voivodeship macro-region | 15.64 | 16.07 |
| Total | 100 | 100 |
| No. | Exogenous Latent Variable | Direction of Relationship | Endogenous Latent Variable | Estimate | Std. Err. | z-Value | p-Level | Std. lv. | Std. All | RMSEA | SRMR |
|---|---|---|---|---|---|---|---|---|---|---|---|
| SEM1* | Environmental initiatives | ----→ | quality | 0.533 | 0.034 | 15.789 | 0.000 | 0.515 | 0.515 | 0.011 | 0.022 |
| SEM2* | Environmental initiatives | ----→ | delivery | 0.598 | 0.031 | 19.456 | 0.000 | 0.554 | 0.554 | 0.053 | 0.034 |
| SEM3* | Environmental initiatives | ----→ | flexibility | 0.547 | 0.028 | 19.440 | 0.000 | 0.596 | 0.596 | 0.025 | 0.022 |
| SEM4* | Environmental initiatives | ----→ | cost | 0.089 | 0.039 | 2.298 | 0.022 | 0.100 | 0.100 | 0.000 | 0.016 |
| Group | Exogenous Latent Variable | Direction of Relationship | Endogenous Latent Variable | Estimation | Std. Err. | z-Value | p-Level | Std. lv. | Std. All | RMSEA | SRMR |
|---|---|---|---|---|---|---|---|---|---|---|---|
| Financial situation: very good and good | Environmental initiatives | ----→ | quality | 0.577 | 0.042 | 13.576 | 0.000 | 0.552 | 0.552 | 0.000 | 0.023 |
| Environmental initiatives | ----→ | delivery | 0.651 | 0.037 | 17.574 | 0.000 | 0.587 | 0.587 | 0.044 | 0.032 | |
| Environmental initiatives | ----→ | flexibility | 0.548 | 0.036 | 15.024 | 0.000 | 0.593 | 0.593 | 0.000 | 0.019 | |
| Environmental initiatives | ----→ | cost | 0.128 | 0.052 | 2.445 | 0.014 | 0.133 | 0.133 | 0.000 | 0.018 | |
| Financial situation: very bad and bad | Environmental initiatives | ----→ | quality | Impossible to estimate due to the insufficient number of the lowest indications of the j1 variable category | |||||||
| Environmental initiatives | ----→ | delivery | 0.516 | 0.051 | 10.193 | 0.000 | 0.500 | 0.500 | 0.046 | 0.043 | |
| Environmental initiatives | ----→ | flexibility | 0.545 | 0.041 | 13.239 | 0.000 | 0.603 | 0.603 | 0.064 | 0.038 | |
| Environmental initiatives | ----→ | cost | 0.023 | 0.057 | 0.410 | 0.682 | 0.028 | 0.028 | 0.000 | 0.029 | |
Publisher’s Note: MDPI stays neutral with regard to jurisdictional claims in published maps and institutional affiliations. |
© 2022 by the author. Licensee MDPI, Basel, Switzerland. This article is an open access article distributed under the terms and conditions of the Creative Commons Attribution (CC BY) license (https://creativecommons.org/licenses/by/4.0/).
Share and Cite
Fura, B. The Role of Financial Situation in the Relationship between Environmental Initiatives and Competitive Priorities of Production Companies in Poland. Risks 2022, 10, 52. https://doi.org/10.3390/risks10030052
Fura B. The Role of Financial Situation in the Relationship between Environmental Initiatives and Competitive Priorities of Production Companies in Poland. Risks. 2022; 10(3):52. https://doi.org/10.3390/risks10030052
Chicago/Turabian StyleFura, Barbara. 2022. "The Role of Financial Situation in the Relationship between Environmental Initiatives and Competitive Priorities of Production Companies in Poland" Risks 10, no. 3: 52. https://doi.org/10.3390/risks10030052
APA StyleFura, B. (2022). The Role of Financial Situation in the Relationship between Environmental Initiatives and Competitive Priorities of Production Companies in Poland. Risks, 10(3), 52. https://doi.org/10.3390/risks10030052