Article

An Empirical Analysis for the Determination of Risk Factors of Work-Related Accidents in the Maritime Transportation Sector

by
Vicky Zampeta
* and
Gregory Chondrokoukis
Department of Industrial Management & Technology, University of Piraeus, 185 34 Piraeus, Greece
*
Author to whom correspondence should be addressed.
Risks 2022, 10(12), 231; https://doi.org/10.3390/risks10120231
Submission received: 20 October 2022 / Revised: 26 November 2022 / Accepted: 29 November 2022 / Published: 5 December 2022

Abstract

:
The main objective of this study is to highlight the internal risk factors associated with maritime transportation accidents and the important role of presenting them in the dataset at the time of the incident. Since the study period involves a pre- and post-pandemic timeline, we refer to COVID-19, although it is not part of our analysis. The issue at hand is the appropriate statistical analysis and investigation of the possible correlations between the cause of the incident and internal factors/indicators that may affect the safety of crews on sea routes. We developed a comprehensive study based on advanced econometric modeling, utilizing multifactorial models of robust regression, structural equation modeling (SEM), and Gaussian/mixed-Markov graphical models (GGMs, MGMs) and applying them to a newly compiled dataset covering the 2014–2022 period. Our results bring to the fore important factors that can determine the causes of various accidents and injuries suffered by workers, ranging from work location to work activity and even the rank of the seafarers on board. We do not consider the external factors associated with a maritime transportation accident, as the risk of an accident in this sector due to external factors (i.e., weather conditions, defaults, failures, etc.) is limited. Reducing the number of injuries to seafarers will result not only in better seafarer health but also a reduction in the operating costs of shipping companies due to the reduced insurance premiums they will have to pay. It will also lead to a reduction in the amounts disbursed by Protection and Indemnity (P&I) Clubs to compensate seafarers. In future research, we will use external factors to determine seafaring risks related to, for example, weather conditions, the quality of ships, technology, safety measures, regulations, and more.

1. Introduction

Maritime transportation continues to act as an engine of global trade. It is essential to many businesses and recognized as one of the main drivers of globalization. Maritime accidents pose significant challenges to workers in the maritime transportation sector, and they significantly deter their health and labor productivity. The COVID-19 pandemic (e.g., the infection caused by the severe acute respiratory syndrome coronavirus 2 (SARS-CoV-2)) has significantly shaped the world of work and has brought new challenges to seafarers, who faced travel limitations and were restricted from leaving their ships and return home, thus leaving them subject to increased health risks. The occupational health and safety of maritime workers is becoming a key priority, yet it is much more challenging nowadays compared with pre-pandemic times (International Labour Organization 2020). The pandemic first hit the cruise industry and rapidly spread to the entire maritime sector (Moriarty et al. 2020). Maritime workers were significantly affected when they were forced to assume new roles and tasks essential to enforcing quarantines, such as distributing medicines and delivering meals, alongside their usual work activities (Dragicevic 2020).

Factors Deterring the Occupational Health of Maritime Workers in the Last Decade and during the COVID-19 Pandemic

Maritime accidents can be classified into three categories, namely, (i) accidents associated with maritime disasters (e.g., collisions between ships, explosions), (ii) “on-duty” accidents (e.g., fractures and burns while performing work activities), and (iii) “off-duty” accidents (e.g., falls, trips, slips) (Roberts et al. 2014).
Moreover, mental health challenges are extremely important issues, and they notably increased during the COVID-19 pandemic (Shan 2021). These issues can cause depression, anxiety, or even suicide among maritime workers, and are usually associated also with “an increased likelihood of injury and illness on board” (Lefkowitz and Slade 2019).
The relevant literature highlights that research on maritime accidents needs to be multi-disciplinary, based on advanced research methods that can capture the complex interlinkages between the technological progress in the naval industry, human behavior, the natural environment, and shipping market features (Luo and Shin 2019).
Current research aims to enhance and assess the main factors influencing maritime worker health and the injuries these workers suffer in maritime accidents. Therefore, we developed a comprehensive study based on advanced econometric modeling that utilizes multifactorial regression models and structural equation modeling applied to a newly compiled dataset covering the 2014–2022 period. Our results bring to the fore important factors that can help determine the causes of various accidents and injuries suffered by workers, ranging from work location to work activity and the rank of the seafarers on board.

2. Literature Review

In academic research, regression-based approaches, also known as first-generation techniques, are used to test hypotheses. These include multiple regression models, discriminant analysis, logistic regression, and ANOVA. These methods have three limitations, restricting their applicability in some circumstances (Haenlein and Kaplan 2004). These three limitations are as follows:
  • One dependent and several independent variables are required, namely, the postulation of a simple model structure.
  • We must assume that all variables are considered observable.
  • We must make the conjecture that all the variables have been measured without error.
In comparison with real-life problems, many researchers have advanced arguments regarding these limitations. Jacoby (1978) and Shugan (2002) addressed the issue of studying the impact of one or two variables and studying defined variables that imply omitting some aspect of reality. The authors would like to remark on mediating and moderating effects that we have not observed in other regression-based approaches.
Regarding the second restriction, theories on unobservable characteristics can only be considered once they have prior standalone validation, such as confirmatory factor analysis (Hair et al. 2021). The third limitation is well-known from econometrics and statistics lectures; each observation has two errors: the random error and the systematic error.
In least-squares techniques, one difficulty is that the value combinations of the explanatory variables can produce observations with far greater influence than others. Research on the robust estimation of least squares has provided new proposals aimed at protecting against distortions caused by anomalous data and good efficiency when these data come from an ideal Gaussian model (Li 2006). One of the innovations of robust regression is accelerating the analysis process by limiting the effect of some types of outliers and calling attention to unusual data. In a regression model, if there are unusual observations, they can sometimes severely distort estimates from regression using OLS (Andersen 2022; Western 1995).
Structural equation modeling (SEM), the second-generation technique, was proposed to overcome these limitations. Whereas regression-based approaches have only one dependent and many independent variables, SEM allows for simultaneous modeling with multiple dependent and independent variables. In SEM, researchers can use unobserved variables, and measurement errors are integrated into the model. There are two approaches to constructing SEM: the covariance-based approach and the variance-based approach. Westland (2019) categorized the products of SEM statistical analysis algorithms into three groups: pairwise canonical correlations between pairs, multivariate canonical correlation matrices, and systems of regression approaches that fit data to networks of observable variables. Although the author stated that there are three groups, he also mentioned a fourth category, developed for new social network analysis, which allows for both visualization and network-specific statistics.
In the literature, two models are mainly used: covariance-based SEM (CB-SEM) and partial least squares SEM (PLS-SEM, also called PLS path modeling) (Westland 2019). Path models can then be represented graphically by a path diagram (also called an arrow scheme). These diagrams visually present the relationship between the variables. A PLS path model consists of two elements: the structural model and the measurement model. The structural model displays the relationships (paths) between the constructs. The measurement model specifies the relationships between the observed variables underlying the latent variables. Using standard notation (Bollen 1989; Stein et al. 2012), we represent general SEM using the following equations.

3. Materials and Methods

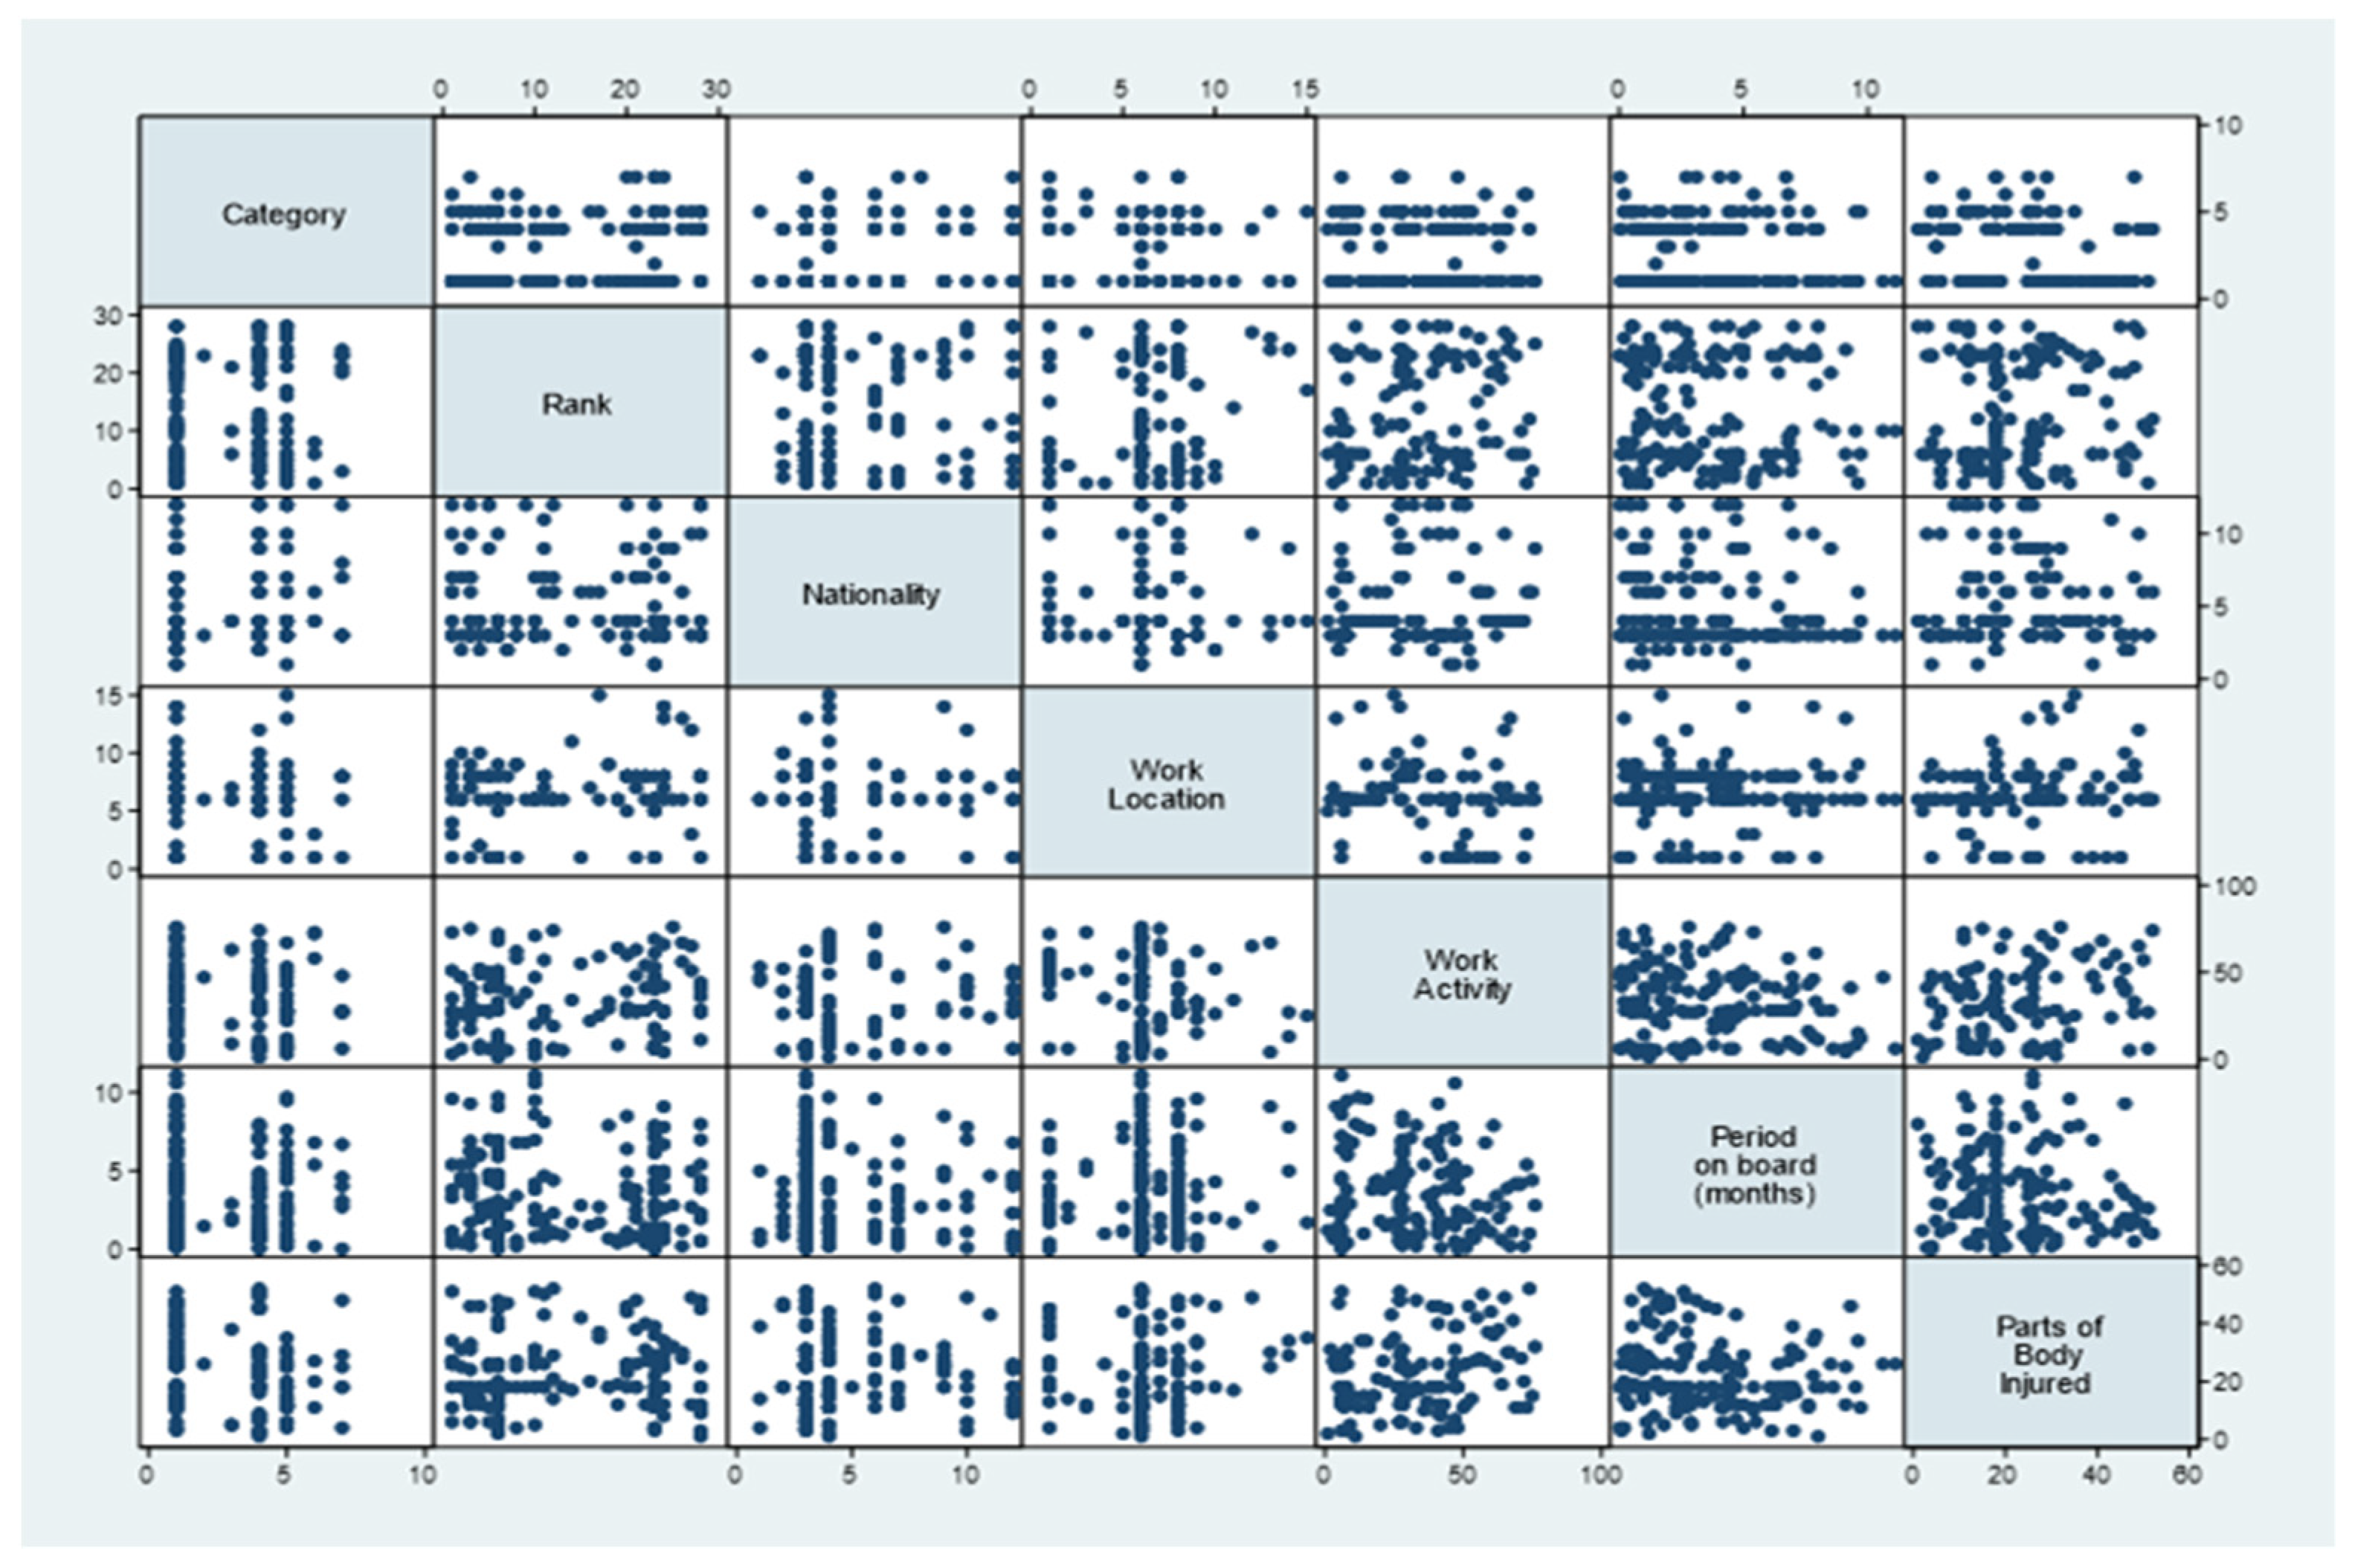
Data/Indicators Used in the Empirical Analysis

The dataset compiled for the empirical analysis covers an important number of maritime accidents observed during the 2014–2022 period and comprises several key indicators/credentials that characterize the shaping factors of maritime accidents (various injuries to workers and work-related accidents in the maritime transportation sector). All indicators were encoded using the econometric package Stata 16. They were transformed from strings into numerals to be used as variables in our econometric models and to be processed accordingly in the framework of the various advanced modeling procedures applied in this study. In total, for the entire analyzed period, there are 166 observations per variable employed in the econometric models (dataset in Appendix A).
The set of indicators used in this empirical analysis utilizes the following factors:
-
Category: first aid case (FAC), medical treatment case (MTC), restricted work case (RWC), lost work case (LWC), fatality, illness, non-work related.
-
Rank: cook; electrician; fitter; ordinary seaman; 2nd, 3rd, 4th engineer; chief engineer; able seaman; wiper; 2nd, 3rd officer; bosun; oiler; engine cadet; pumpman; as. Steward.
-
Nationality: Romanian, Greek, Filipino, Ukrainian, Russian, Brazilian, Latvian.
-
Work location: engine room, accommodations, cabin, deck, manifold, galley, s/g room, cargo control room.
-
Work activity: e.g., handling weather-tight doors; repairs in ER-SW cooler pipeline; unplugging the reefers for discharging; walking in accommodations; while repairing the oven slightly cut his finger; engine maintenance; slipped on the deck and slightly hit the small of his back; stepped on a VS mantel and hit his leg; while working in the engine room, during the deployment of the gangway net, during a routine inspection in the engine room; etc.
-
Period on board: expressed in months.
-
Parts of body injured: categorized into hand injuries (fingers, hand/wrist), feet injuries (feet/ankle, knees, and legs), and body injuries (eyes, head, back, chest, and shoulder).
To assess the impact of several specific factors related to maritime activity—such as rank, nationality of workers, work location, type of work activity, and period on board—upon the health of onboard workers/work-related accidents in the maritime transportation sector (approximated using various worker injuries), we processed two sets of multiple regression models and estimated them through several different estimation methods to obtain robust estimates and avoid spurious correlations.
Descriptive statistics of the encoded numerical variables configured in the empirical analysis are detailed in Table 1.
A panel correlation of the specific variables employed in the empirical analysis is presented in Figure 1, below. It should be noted that there is a high degree of correlation between the work activity, period on board, and worker injuries (number of injuries and parts of body injured).
As detailed in Figure 2 (below), most of the injuries are in the first aid case (FAC), followed by the medical treatment case (MTC) and lost work case (LWC). An important increase is registered after 2021 and 2022 in restricted work cases (RWC).
To observe the distribution of our data/the main indicators used in the empirical analysis and to observe whether the data follow a normal distribution, we designed Kernel density estimates per each indicator, as presented in Figure 3.

4. Research Methodology

Our research methodology is based on two approaches to modeling cross-sectional data via modern and advanced econometric techniques, namely, multiple regression modeling and structural equation modeling (SEM). Multiple regression models are estimated through various estimation methods to ensure robust results, such as robust regression, random and fixed effects, two-stage least squares, Poisson regression, and dynamic GMM (Arellano–Bond). Robust regression is mainly processed to capture the deterring factors of maritime employee health/maritime accidents (approximated using hand, feet, and body injuries). Robust regression is based on calculating Cook’s distance and then running two types of iterations (Huber, biweight), thus providing robust estimates while also dropping the possible outliers in the sample. Multiple regression models are configured as in Equation (1):
P a r t s   o f   b o d y   i n j u r e d   ( H I F H W /   B I B C S R /   B I B C S R ) = β 0 + β 1 R a n k   + β 2 N a t i o n a l i t y + β 3 W o r k l o c a t i o n + β 4 W o r k a c t i v i t y + β 5 P e r i o d _ o n _ b o a r d + ε i t
where “β are the regression parameters (coefficients), i = 1, …, m, t is the number of observed time periods”.
Structural equation modeling complements robust regression models, which are processed through the maximum likelihood, allowing us to capture and assess the direct, indirect, and total linkages between specific variables selected in our models. SEM progresses our research because it combines path analysis, factor analysis, and regression, thus providing the opportunity to estimate/capture multiple causal associations between variables. Moreover, structural equation modeling implies a “variance-covariance matrix, aiming to identify how variables are related to each other, namely the direct and indirect effects of one variable on another, having their origin in path analysis” (Cristea and Noja 2019). The general system of equations for our SEM models is presented in Equation (2), below, and the graphical configuration is detailed in Figure 4.
{ b 11 y 2 t + + b 1 m y m t + c 11 x 1 t + + c 1 n x n t = ε 1 t b 21 y 2 t + + b 2 m y m t + c 21 x 1 t + + c 2 n x n t = ε 2 t b m 1 y m t + + b m m y m t + c m 1 x n t + + c m n x n t = ε m t
where “t is the number of observed time periods, bij represents the yij endogenous variable’s parameters, cij are the xij exogenous variable’s parameters, i = 1, …, m, j = 1, …, n; ε comprises the error term (residuals)” (Cristea and Noja 2019).

5. Empirical Results

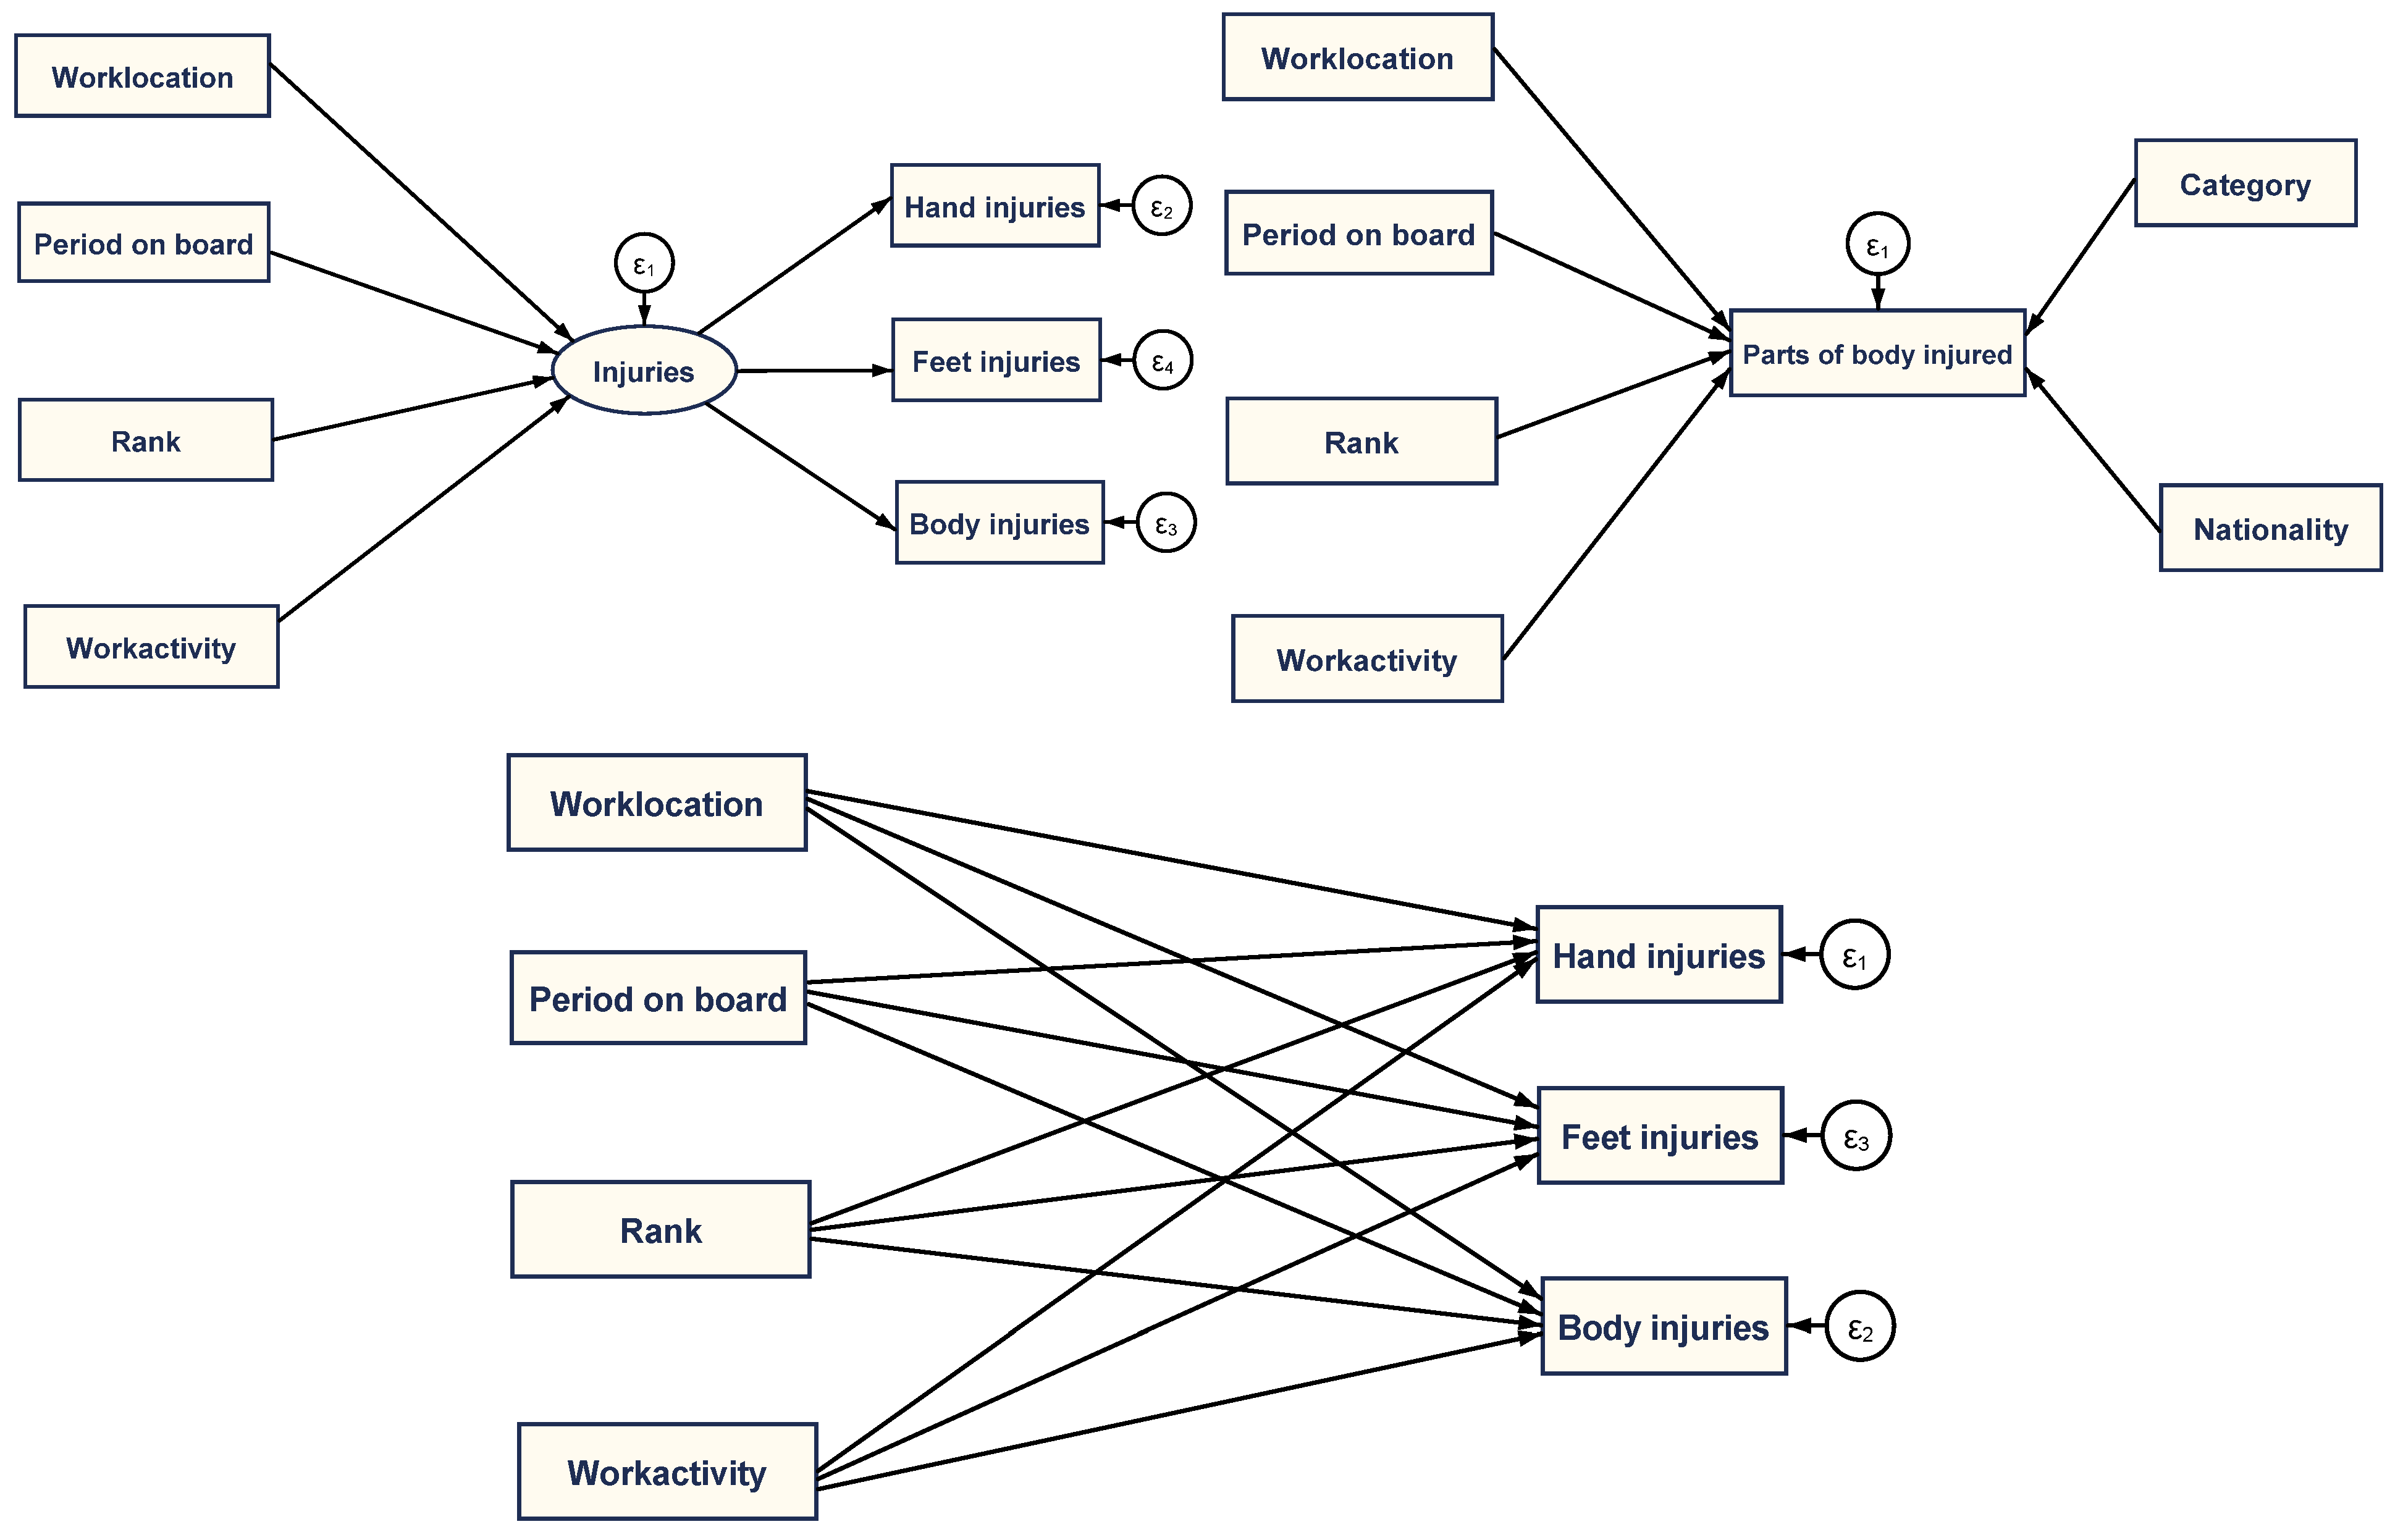
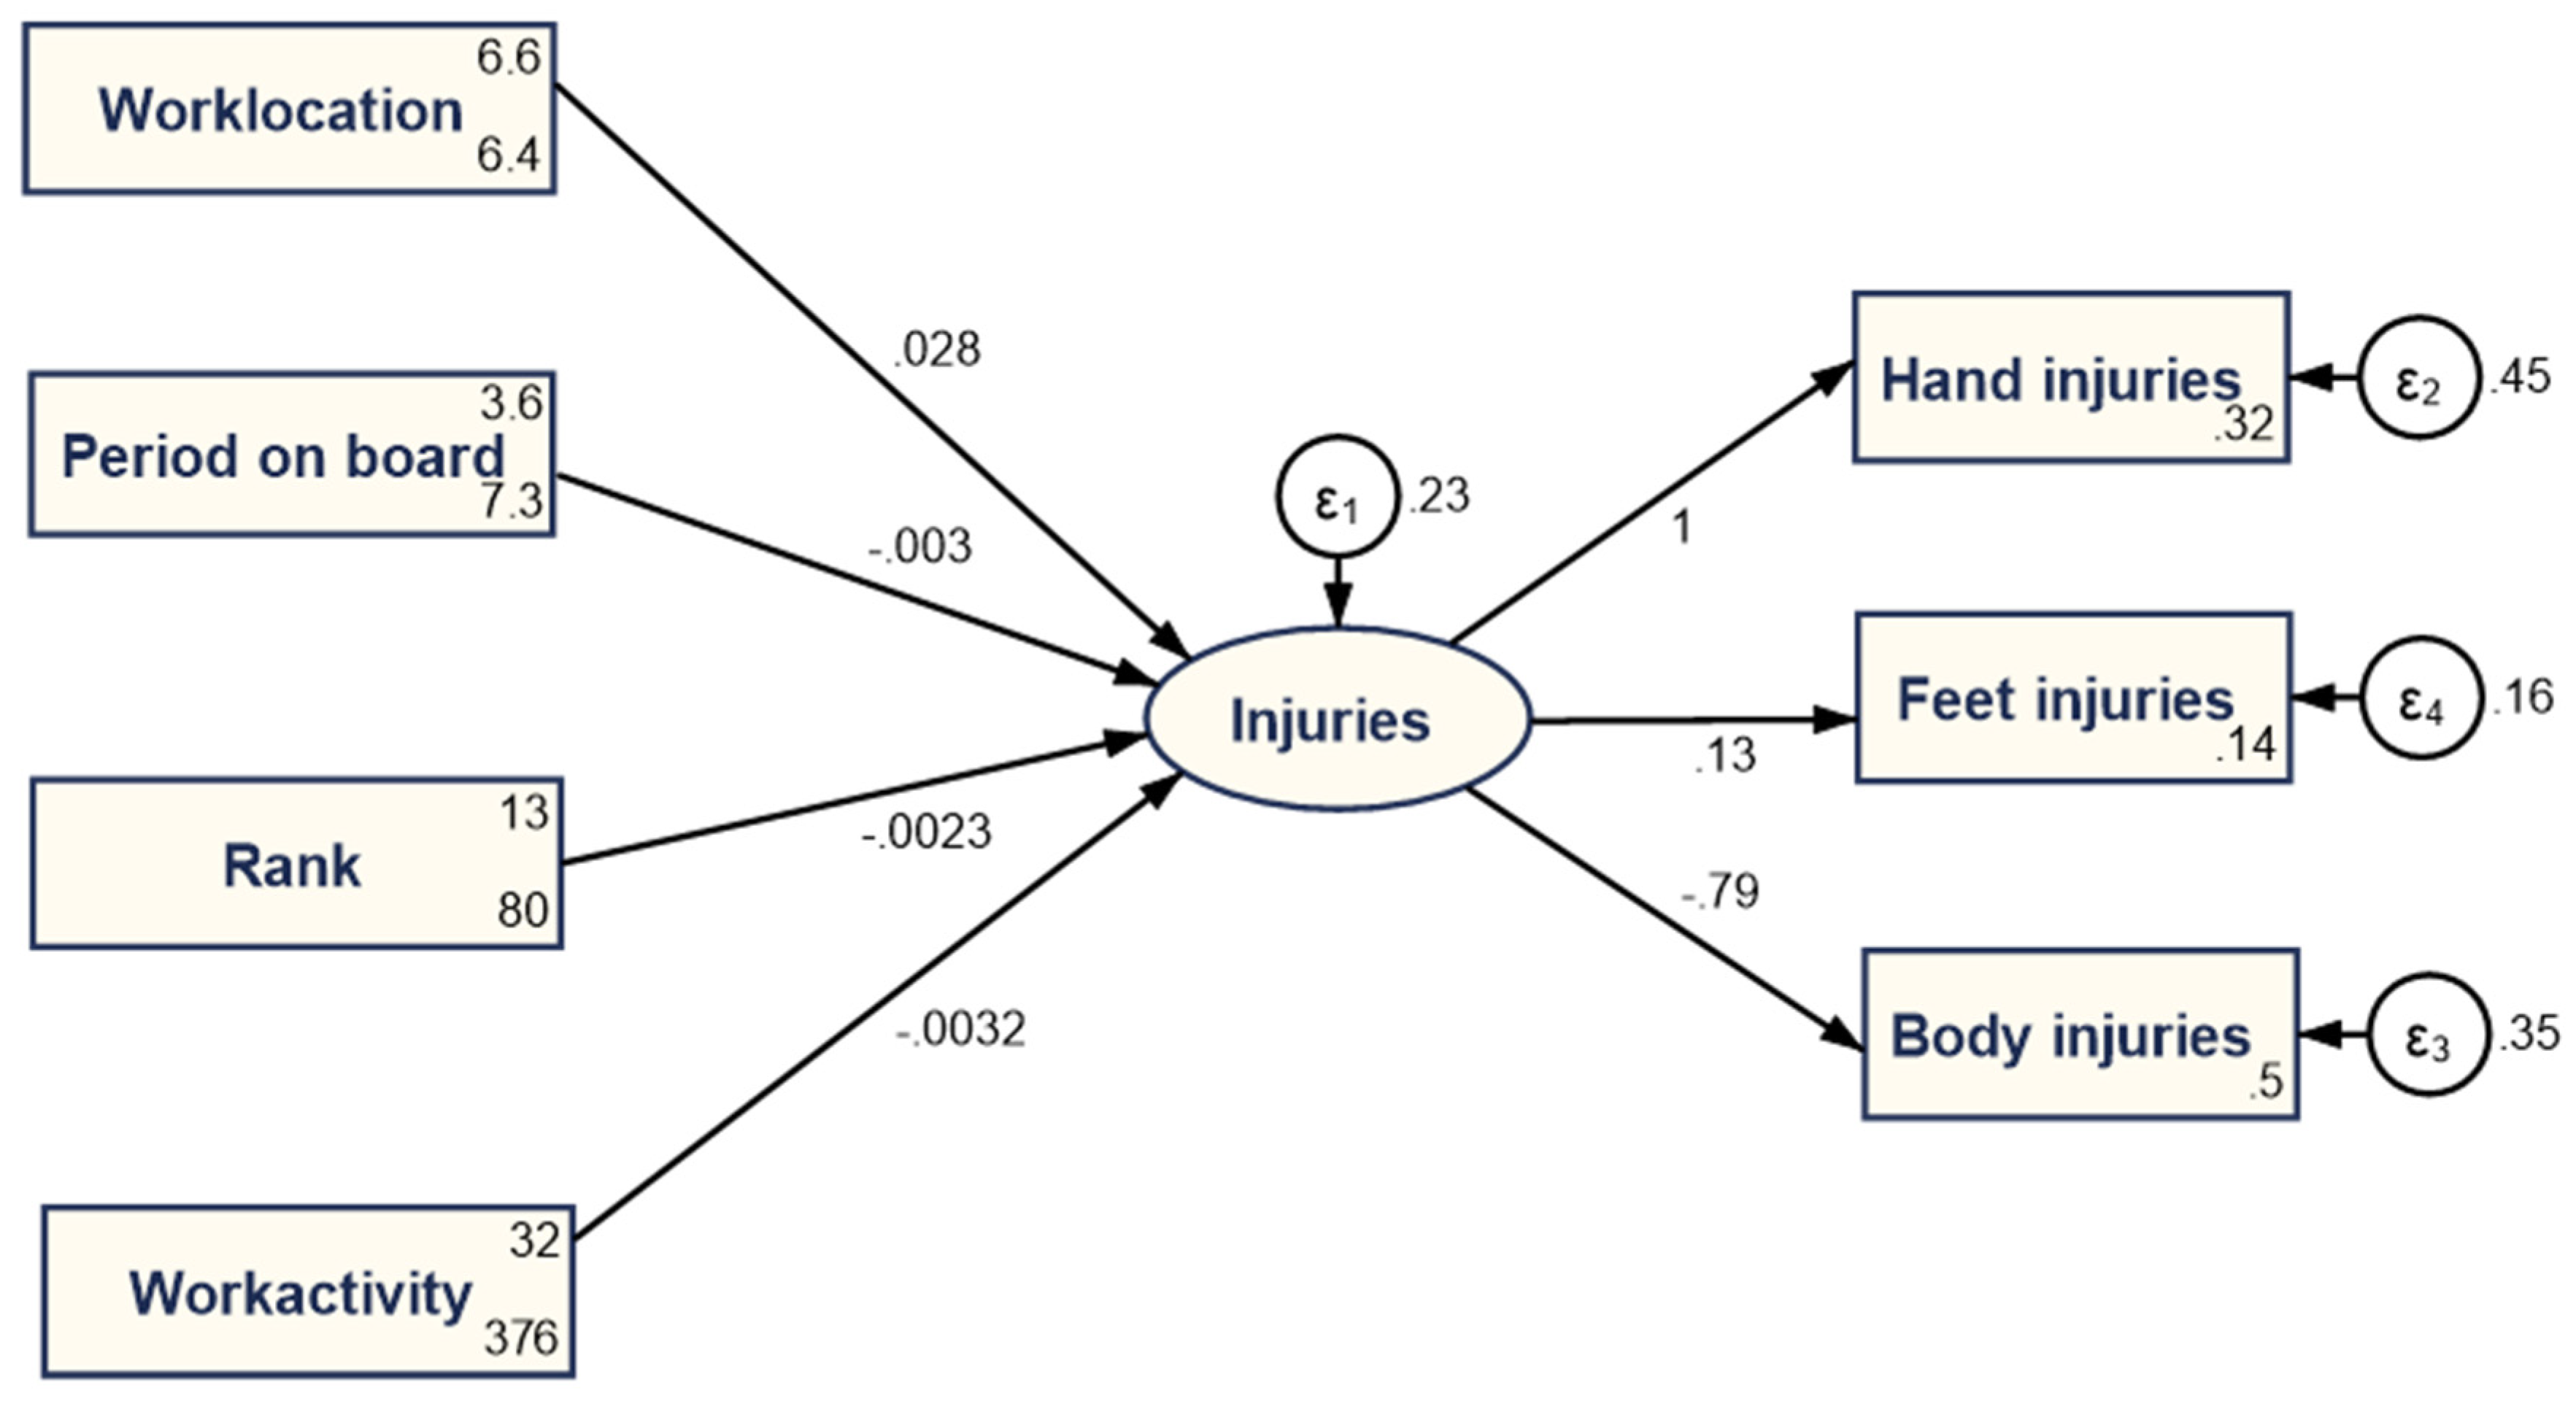
5.1. Results of Structural Equation Modeling (SEM)—Discussion

To assess the impact of several specific factors related to the maritime activity—including rank, the nationality of workers, work location, the type of the work activity, and the period on board—upon the health of onboard workers/work-related accidents in the maritime transportation sector (approximated using various worker injuries), we processed two sets of multiple regression models and estimated them via several different estimation methods to provide robust estimates and avoid spurious correlations. Detailed results are presented in Table 2 and Table 3.
The first set of results obtained after processing the multiple regression models using robust regression with Huber and biweight iterations (Table 2), as well as through five other estimation procedures (Table 3), demonstrate that work activity is the main factor that determines injuries in maritime workers (estimated coefficients are positive and statistically significant at the 1% and 0.1% thresholds). This shows that work activities have the greatest risk of accidents in maritime transportation among the internal factors examined in the present research. External factors such as weather conditions, the quality of the ship, technology, etc., are not included in our analysis because the main objective of this research is to determine the factors used for compensation and insurance premium purposes.
Work locations are associated with an increase in bodily injuries to maritime workers, while an increase in the number of months spent on the ship (period on board) leads to a decrease in the number of injuries to maritime workers since they gain experience in the workplace and perform better in work-related activities. Work location has been proven to be a primary factor for the objectives of this research, which will lead to higher insurance premiums being paid by shipping companies to protect employees and prevent possible damages.

5.2. Results of Structural Equation Modeling (SEM)—Discussion

The second set of results obtained after processing the structural equation models confirms the previous results of multifactorial regression. The SEM 1 model was processed through the maximum likelihood estimation method (MLE), and the results are presented below in Figure 5 and Table 4.
Analyzing the results, it can be observed that the structural part of the model associated with the injuries latent variable shows that particular work locations are associated with an increase in the injuries suffered by maritime workers, while more work activity tends to slightly decrease these injuries (both coefficients are statistically significant at a 5% threshold). The body injuries estimated coefficients have the highest level of statistical significance and tend to shape the amplitude of injuries suffered by maritime workers (in this case, where injuries are captured as a latent variable resulting from specific types of accidents at the level of hands, feet, and body). Period on board has a negative estimated coefficient, as in the case of the multiple regression models, yet it is less significant from a statistical point of view in the case of SEM 1. Based on the findings from this method of analysis, work activity and work location are identical to the results from the previous method, as expected.
In the case of the second structural equation model (SEM 2), the results are presented in Figure 6 and Table 5. In this particular case, the model comprises only measured variables. We also introduced the influence of categories upon various types of injuries (parts of body injured is a merged variable between hand, feet, and body injuries).
In this configuration, the SEM results highlight that work activity is essential in determining the number of various types of body injuries suffered by maritime workers (positive estimated coefficient, 0.138; highly statistically significant at 1%). Work location remains positive, as in the case of the previous results, while period on board remains negative, as well as nationality and category, yet it is less significant from a statistical point of view.
Finally, the third structural equation model (SEM 3) captures the multiple causal associations between all variables (specific types of injuries and various deterring factors/determinants) considered in this empirical analysis. The results obtained are detailed in Figure 7 and Table 6, above. In this particular setting, work location tends to stand out as a main determinant of hand injuries (positive coefficient and statistically significant at 5% level), yet all the other coefficients have small values and are less significant from a statistical perspective, thus revealing that causalities exist. Still, specific/tailored configurations and associated measures are needed to isolate the incidents/limit injuries and, hence, ensure the general health and well-being of maritime workers.

6. Conclusions

By exploring the shaping factors of maritime worker injuries, this research sheds light on the essential factors and activities that drive maritime accidents. These can be improved to strengthen worker occupational health, particularly during these challenging pandemic and post-pandemic times. Although the illness associated with the COVID-19 pandemic was not considered among the types of accidents associated with internal factors, we have referred to it because the study period involves a pre- and post-pandemic timeline. The current quantitative study strengthens the findings in this scientific field via robust estimates obtained after designing and applying different modern, advanced econometric techniques. Therefore, to the best of our knowledge, the study is one of the first to address such a topical subject innovatively and comprehensively, using updated information and advanced econometric procedures that are essential to progress the knowledge in this scientific field.
Some limitations of the research are due to the limited availability of certain data that are necessary to accurately capture the complexity and amplitude of maritime accidents. Future research will aim to expand the dataset by considering additional data from various ships and to account for the mental health challenges of maritime workers, the latter being tightly related to physical injuries and can influence the overall health and well-being of maritime workers, as well as their productivity. This is known to have spillover effects on the overall activity of the maritime industry.

Author Contributions

V.Z. conceptualized and designed the study, gathered the research data, undertook data curation and analysis, and wrote the original draft of the article. G.C. was responsible for supervision, the final draft, and conclusions. All authors have read and agreed to the published version of the manuscript.

Funding

This work has been partly supported by the University of Piraeus Research Center.

Data Availability Statement

The detailed dataset supporting the results presented in this study is available upon request from the corresponding author. Names of ships are presented in the Appendix A.

Conflicts of Interest

The authors declare no conflict of interest.

Appendix A

Data set (name of vessels as numbers).
Risks 10 00231 g0a1

References

  1. Andersen, Robert. 2022. Modern Methods for Robust Regression. Thousand Oaks: SAGE Publications Inc. Available online: https://us.sagepub.com/en-us/nam/book/modern-methods-robust-regression (accessed on 13 September 2022).
  2. Bollen, Kenneth A. 1989. Structural Equations with Latent Variables. New York: John Wiley & Sons, Inc. [Google Scholar]
  3. Cristea, Mirela, and Gratiela Georgiana Noja. 2019. European Agriculture under the Immigration Effects: New Empirical Evidence. Agricultural Economics (Zemědělská Ekonomika) 65: 112–22. [Google Scholar] [CrossRef] [Green Version]
  4. Dragicevic, Nina. 2020. What We Learned about COVID-19 from the Diamond Princess. Available online: https://www.cbc.ca/documentaries/the-nature-of-things/what-we-learned-about-covid-19-from-the-diamond-princess-1.5814190 (accessed on 20 June 2022).
  5. Haenlein, Michael, and Andreas M. Kaplan. 2004. A Beginner’s Guide to Partial Least Squares Analysis. Understanding Statistics 3: 283–97. [Google Scholar] [CrossRef]
  6. Hair, Joseph F., Jr., G. Tomas M. Hult, Christian M. Ringle, Marko Sarstedt, Nicholas P. Danks, and Soumya Ray. 2021. Partial Least Squares Structural Equation Modeling (PLS-SEM) Using R A Workbook. Cham: Springer. [Google Scholar] [CrossRef]
  7. International Labour Organization. 2020. Pillar 3: Protecting Workers in the Workplace. Available online: https://www.ilo.org/global/topics/coronavirus/impacts-and-responses/WCMS_739049/lang--en/index.htm (accessed on 1 July 2022).
  8. Jacoby, Jacob. 1978. Consumer Research: A State-of-the-Art Review. Journal of Marketing 42: 87–96. [Google Scholar] [CrossRef]
  9. Lefkowitz, Rafael Y., and Martin D. Slade. 2019. Seafarer Mental Health Study. Available online: https://www.seafarerstrust.org/wp-content/uploads/2019/11/ST_MentalHealthReport_Final_Digital-1.pdf (accessed on 14 June 2022).
  10. Li, Guoying. 2006. Robust Regression. In Exploring Data Tables, Trends, and Shapes. New York: John Wiley & Sons, Ltd., pp. 281–343. [Google Scholar] [CrossRef]
  11. Luo, Meifeng, and Sung-Ho Shin. 2019. Half-century research developments in maritime accidents: Future directions. Accident Analysis and Prevention 123: 448–60. [Google Scholar] [CrossRef] [PubMed]
  12. Moriarty, Leah F., Mateusz M. Plucinski, Barbara J. Marston, Ekaterina V. Kurbatova, Barbara Knust, Erin L. Murray, Nicki Pesik, Dale Rose, David Fitter, Miwako Kobayashi, and et al. 2020. Public Health Responses to COVID-19 Outbreaks on Cruise Ships—Worldwide, February–March. Morbidity and Mortality Weekly Report 69: 347. [Google Scholar] [CrossRef] [PubMed]
  13. Roberts, Stephen E., D. Nielsen, Andrzej Kotłowski, and Bogdan Jaremin. 2014. Fatal accidents and injuries among merchant seafarers worldwide. Occupational Medicine 64: 259–66. [Google Scholar] [CrossRef] [Green Version]
  14. Shan, Desai. 2021. Occupational health and safety challenges for maritime key workers in the global COVID-19 pandemic. International Labour Review 161: 267–87. [Google Scholar] [CrossRef]
  15. Shugan, Steven. 2002. Editorial: Marketing Science, Models, Monopoly Models, and Why We Need Them. Marketing Science 21: 223–28. [Google Scholar] [CrossRef]
  16. Stein, Catherine M., Nathan J. Morris, and Nora L. Nock. 2012. Structural Equation Modeling. In Statistical Human Genetics: Methods and Protocols. Edited by Robert C. Elston, Jaya M. Satagopan and Shuying Sun. Methods in Molecular Biology. Totowa: Humana Press, pp. 495–512. [Google Scholar] [CrossRef]
  17. Western, Bruce. 1995. Concepts and Suggestions for Robust Regression Analysis. American Journal of Political Science 39: 786–817. [Google Scholar] [CrossRef]
  18. Westland, J. Christopher. 2019. Structural Equation Models From Paths to Networks, 2nd ed. Cham: Springer. [Google Scholar]
Figure 1. Panel correlation of specific variables. Source: Own data process in Stata.
Risks 10 00231 g001
Figure 2. (a) Panel evolution of specific variables—parts of body injured. (b) Panel evolution of specific variables—period on board. Source: Own data process in Stata.
Risks 10 00231 g002
Figure 3. Kernel distribution of main variables used in the empirical analysis. Source: Own data process in Stata.
Risks 10 00231 g003aRisks 10 00231 g003b
Figure 4. General configuration of the structural equation models. Source: Authors’ research.
Risks 10 00231 g004
Figure 5. SEM 1, first model of structural equation modeling.
Risks 10 00231 g005
Figure 6. SEM 2, second model of structural equation modeling. Source: Own data process in Stata.
Risks 10 00231 g006
Figure 7. SEM 3, third model of structural equation modeling. Source: Own data process in Stata.
Risks 10 00231 g007
Table 1. Descriptive statistics.
NMeanSDMinMax
Category1662.6385541.90742317
Rank16613.180728.962744128
Nationality1664.9337352.879679112
Work location1666.5542172.533427115
Work activity16631.7530119.45887176
Period on board, months1663.5589162.7030460.0311.1
Parts of body injured16622.3818212.04538152
Source: Own data process in Stata.
Table 2. Results of panel regression—impact on specific factors.
(1)(2)(3)
Hand injuries: fingers, hand, wrist (HIFHW)Feet injuries: ankle, knees, legs (FAKL)Body injuries: back, chest, shoulder, ribs (BIBCSR)
Rank−0.00400
(0.00421)
0.00279
(0.00321)
−0.0000646
(0.00440)
Nationality0.0182
(0.0130)
0.00121
(0.00991)
−0.0214
(0.0136)
Work location0.0271
(0.0150)
0.00427
(0.0114)
−0.0235
(0.0157)
Work activity−0.00292
(0.00196)
−0.000700
(0.00149)
0.00269
(0.00204)
Period on board months (POBM)−0.00361
(0.0139)
0.00532
(0.0106)
−0.00452
(0.0145)
_cons0.252
(0.155)
0.0832
(0.118)
0.661 *
(0.162)
N166166166
R20.48650.39680.2387
Standard errors in parentheses; * p < 0.001. Source: Own research.
Table 3. Results of panel models (robust regression, random and fixed effects, two-stage least squares regression, Poisson regression, and dynamic GMM (Arellano–Bond)).
(1)(2)(3)(4)(5)(6)
Parts of body injuredParts of body injuredParts of body injuredParts of body injuredParts of body injuredParts of body injured
RREG
(robust regression)
RE (Random effects)FE (fixed effects)2SLS (IV regression)Poisson regressionArellano–Bond
(dynamic GMM)
Rank−0.000693
(0.110)
−0.0134
(0.105)
−0.0174
(0.107)
−0.0134
(0.105)
−0.000303
(0.00192)
0.0769
(0.116)
Nationality−0.100
(0.339)
−0.203
(0.323)
−0.160
(0.326)
−0.203
(0.323)
−0.00711
(0.00591)
−0.566
(0.371)
Work location0.479
(0.394)
0.443
(0.375)
0.418
(0.384)
0.443
(0.375)
0.0204 **
(0.00680)
0.0270
(0.441)
Work activity0.138 **
(0.0511)
0.139 **
(0.0486)
0.140 **
(0.0503)
0.139 **
(0.0486)
0.00606 ***
(0.000880)
0.134 *
(0.0564)
Period on board months−0.322
(0.363)
−0.444
(0.345)
−0.486
(0.346)
−0.444
(0.345)
−0.0230 ***
(0.00640)
−0.765
(0.399)
L. parts of body injured 0.0195
(0.0867)
_cons15.65 ***
(4.069)
17.83 ***
(3.875)
17.96 ***
(3.887)
17.83 ***
(3.875)
2.822 ***
(0.0934)
21.86 ***
(4.771)
Lnalpha −3.851 ***
(0.723)
N165165165165165113
R20.056 0.0700.067
Standard errors in parentheses; * p < 0.05, ** p < 0.01, *** p < 0.001. Source: Authors’ research.
Table 4. Detailed results of SEM 1—first model of structural equation modeling.
(1)
SEM Model 1
Injuries
Period on board months−0.00302
(0.00689)
Rank−0.00229
(0.00285)
Work location0.0284 *
(0.0114)
Work activity−0.00320 *
(0.00142)
Hand injuries (fingers, hand, wrist)
Injuries1
(.)
_cons0.322 **
(0.102)
Body injuries (back, chest, shoulder, ribs)
Injuries−0.792 **
(0.274)
_cons0.504 ***
(0.0871)
Feet injuries (ankle, knees, legs)
Injuries0.133
(0.299)
_cons0.140 ***
(0.0316)
var(e.Hand injuries (fingers, hand, wrist))0.455
(.)
var(e.Body injuries (back, chest, shoulder, ribs))0.350
(.)
var(e.Feet injuries (ankle, knees, legs))0.163
(.)
var(e.Injuries)0.225
(.)
N166
Standard errors in parentheses; * p < 0.05, ** p < 0.01, *** p < 0.001. Source: Own research.
Table 5. Detailed results of SEM 2—second model of structural equation modeling.
(1)
SEM Model 2
Parts of body injured
Period on board months−0.467
(0.267)
Rank0.0109
(0.0984)
Work location0.411
(0.310)
Work activity0.138 *
(0.0458)
Nationality−0.127
(0.259)
Category−0.810
(0.431)
_cons19.58 **
(3.742)
var(e.Parts_of_body_injured)132.3 **
(13.26)
N166
Standard errors in parentheses; * p < 0.01, ** p < 0.001. Source: Own research.
Table 6. Detailed results of SEM 3—third model of structural equation modeling.
−1
SEM Model 3
Hand injuries (fingers, hand, wrist)
Period on board months−0.00552
−0.0129
Rank−0.00356
−0.00395
Work location0.0277 *
−0.0137
Work activity−0.00277
−0.0018
_cons0.334 *
−0.131
Body injuries (back, chest, shoulder, ribs)
Period on board months−0.00227
−0.0134
Rank−0.000582
−0.00417
Work location−0.0242
−0.0134
Work activity0.00252
−0.00199
_cons0.564 ***
−0.139
Feet injuries (ankle, knees, legs)
Period on board months0.00519
−0.0102
Rank0.00282
−0.00301
Work location0.00431
−0.0122
Work activity−0.000691
−0.0016
_cons0.0887
−0.122
/
var(e.Hand injuries (fingers, hand, wrist))0.221
(.)
var(e.Body injuries (back, chest, shoulder, ribs))0.242
(.)
var(e.Feet injuries (ankle, knees, legs))0.127
(.)
N166
Standard errors in parentheses; * p < 0.05, *** p < 0.001. Source: Own research.
Publisher’s Note: MDPI stays neutral with regard to jurisdictional claims in published maps and institutional affiliations.

