Comparison of Different Nutritional Screening Approaches and the Determinants of Malnutrition in Under-Five Children in a Marginalized District of Punjab Province, Pakistan

 ,
,  ,
,  and
and 
Abstract
1. Introduction
2. Materials and Methods
2.1. Study Area
2.2. Sampling and Research Design
2.3. Data Collection and Ethical Consideration
2.4. Measurements, Terminologies, and Variables
2.5. Statistical Analysis
3. Results
4. Discussion
5. Conclusions
Author Contributions
Funding
Institutional Review Board Statement
Informed Consent Statement
Data Availability Statement
Acknowledgments
Conflicts of Interest
References
- Stevens, G.A.; Finucane, M.M.; Paciorek, C.J.; Flaxman, S.R.; White, R.A.; Donner, A.J.; Ezzati, M. Nutrition Impact Model Study Group Trends in mild, moderate, and severe stunting and underweight, and progress towards MDG 1 in 141 developing countries: A systematic analysis of population representative data. Lancet 2010, 380, 824–834. [Google Scholar] [CrossRef]
- United Nation International Children’s Emergency Fund. Levels and Trends in Child Malnutrition. 2014. Available online: http://www.unicef.org/media/files/Levels_and_Trends_in_Child_Mortality_2014.pdf (accessed on 30 November 2021).
- Di Cesare, M.; Bhatti, Z.; Soofi, S.B.; Fortunato, L.; Ezzati, M.; Bhutta, Z.A. Geographical and socioeconomic inequalities in women and children’s nutritional status in Pakistan in 2011: An analysis of data from a nationally representative survey. Lancet Glob. Health 2015, 3, e229–e239. [Google Scholar] [CrossRef]
- Sen, J.; Mondal, N.; Dey, S. Assessment of the nutritional status of children aged 5–12 years using upper arm composition. Ann. Hum. Biol. 2011, 38, 752–759. [Google Scholar] [CrossRef] [PubMed]
- Nandy, S.; Svedberg, P. The Composite Index of Anthropometric Failure (CIAF): An alternative indicator for malnutrition in young children. In Handbook of Anthropometry; Springer: New York, NY, USA, 2012; pp. 127–137. [Google Scholar]
- Bose, K.; Mandal, G.C. Proposed new anthropometric indices of childhood undernutrition. Malays. J. Nutr. 2010, 16, 131–136. [Google Scholar]
- Nandy, S.; Miranda, J.J. Overlooking undernutrition? Using a composite index of anthropometric failure to assess how underweight misses and misleads the assessment of undernutrition in young children. Soc. Sci. Med. 2008, 66, 1963–1966. [Google Scholar] [CrossRef]
- Svedberg, P. Poverty and Under-Nutrition: Theory, Measurement and Policy; Oxford University Press: Oxford, UK, 2000; Available online: https://doi.org/10.1093/0198292686.001.0001 (accessed on 29 August 2021).
- Svedberg, P. How many people are malnourished? Annu. Rev. Nutr. 2011, 31, 263–283. [Google Scholar] [CrossRef]
- McDonald, C.M.; Olofin, I.; Flaxman, S.; Fawzi, W.W.; Spiegelman, D.; Caulfield, L.E. Nutrition Impact Model Study. The effect of multiple anthropometric deficits on child mortality: Meta-analysis of individual data in 10 prospective studies from developing countries. Am. J. Clin. Nutr. 2013, 97, 896–901. [Google Scholar] [CrossRef]
- WHO. Child Growth Standards and the Identification of Severe Acute Malnutrition in Infants and Children: A Joint Statement by the World Health Organization and the United Nations Children’s Fund (UNICEF); WHO Press: Geneva, Switzerland, 2009; Available online: https://www.who.int/toolkits/child-growth-standards/standards/body-mass-index-for-age-bmi-for-age (accessed on 29 August 2021).
- UNICEF. Mid-Upper Arm Circumference (MUAC) Measuring Tapes. Technical Bulletin No.13, Revision 2. 2009. Available online: https://www.unicef.org/supply/media/1421/file/mid-upper-arm-circumference-measuring-tapes-technical-bulletin.pdf (accessed on 29 August 2021).
- Khan, F.J.; Javed, Y. Delivering Access to Safe Drinking Water and Adequate Sanitation in Pakistan; PIDE Work Paper; Pakistan Institute of Development Economics: Islamabad, Pakistan, 2007; Volume 30, pp. 1–47. Available online: https://pide.org.pk/pdfpideresearch/wp-0030-delivering-access-to-safe-drinking-water-and-adequate-sanitation-in-Pakistan.pdf (accessed on 29 August 2021).
- Srinivasan, K.; Mohanty, S.K. Household deprivation and its linkages with reproductive health utilisation. Econ. Political Wkly. 2008, 43, 67–76. [Google Scholar]
- Shahid, M.; Ahmed, F.; Ameer, W.; Guo, J.; Raza, S.; Fatima, S.; Qureshi, G.M. Prevalence of child malnutrition and household socioeconomic deprivation: A case study of marginalized district in Punjab, Pakistan. PLoS ONE 2022, 17, e0263470. [Google Scholar] [CrossRef]
- Shahid, M.; Cao, Y.; Ahmed, F.; Raza, S.; Guo, J.; Malik, N.I.; Rauf, U.; Qureshi, M.G.; Saheed, R.; Maryam, R. Does Mothers’ Awareness of Health and Nutrition Matter? A Case Study of Child Malnutrition in Marginalized Rural Community of Punjab, Pakistan. Front. Public Health 2022, 10, 792164. [Google Scholar] [CrossRef]
- Olukemi, F.S. Assessing the prevalence of Undernutrition using the composite index of anthropometric failure (CIAF) among young children in a rural community in Oyo state, Nigeria. Niger. J. Nutr. Sci. 2014, 35, 19–24. [Google Scholar]
- Al-Sadeeq, A.H.; Bukair, A.Z.; Al-Saqladi, A.W.M. Assessment of undernutrition using Composite Index of Anthropometric Failure among children aged <5 years in rural Yemen. East. Mediterr. Health J. 2018, 24, 1119–1126. [Google Scholar] [CrossRef] [PubMed]
- Anwar, F.; Gupta, M.K.; Prabha, C.; Srivastava, R.K. Malnutrition among rural Indian children: An assessment using web of indices. Int. J. Public Health Epidemiol. 2013, 2, 78–84. [Google Scholar]
- Brahmbhatt, K.R.; Hameed, S.; Naik, P.M.; Prasanna, K.S.; Jayram, S. Role of new anthropometric indices, validity of MUAC and Weech’s formula in detecting under-nutrition among under-five children in Karnataka. Int. J. Biomed. Adv. Res. 2013, 3, 896–900. [Google Scholar] [CrossRef]
- Gupta, V.; Mohapatra, D.; Kumar, V. Nutritional assessment among children (under five years of age) using various anthropometric indices in an urban area of district Rohtak, Haryana, India. Int. J. Biomed. Res. 2015, 6, 629–634. [Google Scholar] [CrossRef]
- Dasgupta, A.; Parthasarathi, R.; Biswas, R.; Geethanjali, A. Assessment of under nutrition with composite index of anthropometric failure (CIAF) among under-five children in a rural area of West Bengal. Ind. J. Commun. Health 2014, 26, 132–138. [Google Scholar]
- Stiller, C.K.; Golembiewski, S.K.E.; Golembiewski, M.; Mondal, S.; Biesalski, H.K.; Scherbaum, V. Prevalence of undernutrition and anemia among santal adivasi children, Birbhum District, West Bengal, India. Int. J. Environ. Res. Public Health 2020, 17, 342. [Google Scholar] [CrossRef]
- Roy, K.; Dasgupta, A.; Roychoudhury, N.; Bandyopadhyay, L.; Mandal, S.; Paul, B. Assessment of under nutrition with composite index of anthropometric failure (CIAF) among under-five children in a rural area of West Bengal, India. Int. J. Contemp. Pediatr. 2018, 5, 1651–1656. [Google Scholar] [CrossRef]
- Mandal, S.; Pal, J.; Parthasarathi, R.; Biswas, R. An assessment of nutritional status of children aged 0–14 years in a slum area of Kolkata. Int. J. Med. Public Health 2014, 4, 159–162. [Google Scholar]
- Rastogi, S.; Maheshwari, C.; Raghav, S.K.; Lala, M.K. Assessing burden of under-nutrition among under-five children of urban slum by using composite index of anthropometric failure in Ahmedabad city, Gujarat, India. Natl. J. Community Med. 2017, 8, 496–500. [Google Scholar]
- Boregowda, G.S.; Soni, G.P.; Jain, K.; Agrawal, S. Assessment of under nutrition using composite index of anthropometric failure (CIAF) amongst toddlers residing in Urban slums of Raipur City, Chhattisgarh, India. J. Clin. Diagn. Res. JCDR 2015, 9, LC04–LC06. [Google Scholar] [CrossRef] [PubMed]
- Sen, J.; Dey, S.; Mondal, N. Conventional nutritional indices and Composite Index of Anthropometric Failure: Which seems more appropriate for assessing under-nutrition among children? A cross-sectional study among school children of the Bengalee Muslim Population of North Bengal, India. Ital. J. Public Health 2011, 8, 172–185. [Google Scholar]
- Titoria, R.; Ponnusamy, P.; Mehra, S. Identification of undernutrition in under five children: Z score or a composite index of anthropometric failure? Int. J. Community Med. Public Health 2019, 6, 3150. [Google Scholar] [CrossRef]
- Bordom, J.H.; Billot, L.; Gueguen, R.; Deschamps, J.P. New growth charts for Libyan preschool children. East. Mediterr. Health J. 2008, 14, 1400–1412. [Google Scholar]
- Yarbrough, C.; Habicht, J.P.; Malina, R.M.; Lechtig, A.; Klein, R.E. Length and weight in rural Guatemalan Ladino children: Birth to seven years of age. Am. J. Phys. Anthropol. 1975, 42, 439–447. [Google Scholar] [CrossRef]
- Sacker, A.; Kelly, Y.J. Ethnic differences in growth in early childhood: An investigation of two potential mechanisms. Eur. J. Public Health 2012, 22, 197–203. [Google Scholar] [CrossRef][Green Version]
- Wamani, H.; Åstrøm, A.N.; Peterson, S.; Tumwine, J.K.; Tylleskär, T. Boys are more stunted than girls in sub-Saharan Africa: A meta-analysis of 16 demographic and health surveys. BMC Pediatr. 2007, 7, 17. [Google Scholar] [CrossRef]
- Kshatriya, G.K.; Acharya, S.K. Gender disparities in the prevalence of undernutrition and the higher risk among the young women of Indian tribes. PLoS ONE 2016, 11, e0158308. [Google Scholar] [CrossRef]
- Castel, H.; Shahar, D.; Harman-Boehm, I. Gender differences in factors associated with nutritional status of older medical patients. J. Am. Coll. Nutr. 2006, 25, 128–134. [Google Scholar] [CrossRef]
- Khatun, M.; Stenlund, H.; Hörnell, A. BRAC initiative towards promoting gender and social equity in health: A longitudinal study of child growth in Matlab, Bangladesh. Public Health Nutr. 2004, 7, 1071–1079. [Google Scholar] [CrossRef]
- Pravana, N.K.; Piryani, S.; Chaurasiya, S.P.; Kawan, R.; Thapa, R.K.; Shrestha, S. Determinants of severe acute malnutrition among children under 5 years of age in Nepal: A community-based case–control study. BMJ Open 2017, 7, e017084. [Google Scholar] [CrossRef] [PubMed]
- Tariq, J.; Sajjad, A.; Zakar, R.; Zakar, M.Z.; Fischer, F. Factors associated with undernutrition in children under the age of two years: Secondary data analysis based on the Pakistan demographic and health survey 2012–2013. Nutrients 2018, 10, 676. [Google Scholar] [CrossRef] [PubMed]
- Khan, R.E.A.; Bari, K.M.; Raza, M.A. Socioeconomic determinants of child mortality: Evidence from Pakistan Demographic and Health Survey. Bus. Rev. 2019, 13, 34–50. [Google Scholar] [CrossRef]
- Nair, M.; Ohuma, E.; Ariana, P.; Webster, P.; Gray, R. Effect of the Mahatma Gandhi National Rural Employment Guarantee Act on malnutrition of children aged between 1 and 12 months in Rajasthan, India: A mixed methods study. Lancet 2012, 380, S9. [Google Scholar] [CrossRef]
- Shahid, M. Interaction of household wealth and women’s working status on child malnutrition: Evidence from PDHS-2013. Pak. Perspect. J. 2020, 25, 71–84. [Google Scholar] [CrossRef]
- Cunningham, K.; Headey, D.; Singh, A.; Karmacharya, C.; Rana, P.P. Maternal and child nutrition in Nepal: Examining drivers of progress from the mid-1990s to 2010s. Glob. Food Sec. 2017, 13, 30–37. [Google Scholar] [CrossRef]
- Shafiq, A.; Hussain, A.; Asif, M.; Hwang, J.; Jameel, A.; Kanwel, S. The effect of “women’s empowerment” on child nutritional status in Pakistan. Int. J. Environ. Res. Public Health 2019, 16, 4499. [Google Scholar] [CrossRef]
- Shahid, M.; Qureshi, M.G.; Ahmed, J.F. Socio-economic Causes of malnutrition among pre-school children in Pakistan: A gender-disaggregated analysis. Glob. Econ. Rev. 2020, 5, 47–59. [Google Scholar] [CrossRef]
- Aguayo, V.M.; Badgaiyan, N.; Qadir, S.S.; Bugti, A.N.; Alam, M.M.; Nishtar, N.; Galvin, M. Community management of acute malnutrition (CMAM) programme in Pakistan effectively treats children with uncomplicated severe wasting. Matern. Child Nutr. 2018, 14, e12623. [Google Scholar] [CrossRef]
- Shahid, M.; Leghari, I.U.; Ahmed, F. Socio-economic correlates of children’s nutritional status: Evidence from Pakistan Demographic and Health Survey 2017-18. Glob. Econ. Rev. 2020, 1, 221–233. [Google Scholar] [CrossRef]
- Nuruddin, R.; Hadden, W.C. Are pre-school girls more likely to be under-nourished in rural Thatta, Pakistan? A cross-sectional study. Int. J. Equity Health 2015, 14, 151. [Google Scholar] [CrossRef] [PubMed]
- Khalid, H.; Martin, E.G. Female-headed households associated with lower childhood stunting across culturally diverse regions of Pakistan: Results from A cross-sectional household survey. Matern. Child Health J. 2017, 21, 1967–1984. [Google Scholar] [CrossRef] [PubMed]
- Panda, B.K.; Mohanty, S.K.; Nayak, I.; Shastri, V.D.; Subramanian, S.V. Malnutrition and poverty in India: Does the use of public distribution system matter? BMC Nutr. 2020, 6, 41. [Google Scholar] [CrossRef] [PubMed]
- Ahmed, F.; Shahid, M. Understanding food insecurity experiences, dietary perceptions and practices in the households facing hunger and malnutrition in Rajanpur District, Punjab Pakistan. Pak. Perspect. 2019, 24, 116–133. [Google Scholar]
- Shahid, M.; Ameer, W.; Malik, N.I.; Alam, M.B.; Ahmed, F.; Qureshi, M.G.; Zhao, H.; Yang, J.; Zia, S. Distance to Healthcare Facility and Lady Health Workers’ Visits Reduce Malnutrition in under Five Children: A Case Study of a Disadvantaged Rural District in Pakistan. Int. J. Environ. Res. Public Health 2022, 19, 8200. [Google Scholar] [CrossRef]
- Shafiq, A.; Hussain, A.; Asif, M.; Jameel, A.; Sadiq, S.; Kanwel, S. Determinants of gender disparity in nutritional intake among children in Pakistan: Evidence from PDHS. Children 2020, 9, 7. [Google Scholar] [CrossRef]
- Khan, G.N.; Turab, A.; Khan, M.I.; Rizvi, A.; Shaheen, F.; Ullah, A.; Hussain, A.; Hussain, I.; Ahmed, I.; Yaqoob, M.; et al. Prevalence and associated factors of malnutrition among children under-five years in Sindh, Pakistan: A cross-sectional study. BMC Nutr. 2016, 2, 69. [Google Scholar] [CrossRef]
- Shahid, M.; Cao, Y.; Shahzad, M.; Saheed, R.; Rauf, U.; Qureshi, M.G.; Hasnat, A.; Bibi, A.; Ahmed, F. Socio-economic and environmental determinants of malnutrition in under three children: Evidence from PDHS-2018. Children 2022, 9, 361. [Google Scholar] [CrossRef]
- Ahmed, F.; Malik, N.I.; Malik, N.; Qureshi, M.G.; Shahzad, M.; Shahid, M.; Zia, S.; Tang, K. Key challenges to optimal therapeutic coverage and maternal utilization of CMAM Program in rural Southern Pakistan: A qualitative exploratory study. Nutrients 2022, 14, 2612. [Google Scholar] [CrossRef]
- Ahmed, F.; Malik, N.I.; Shahzad, M.; Ahmad, M.; Shahid, M.; Feng, X.L.; Guo, J. Determinants of infant young child feeding among mothers of malnourished children in South Punjab, Pakistan: A qualitative study. Front. Public Health 2022, 10, 834089. [Google Scholar] [CrossRef]
- Ahmed, F.; Leghari, I.U.; Alam, M.B.; Shahid, M. Sociocultural construction of the ritual and practice of ghutti (pre-lacteal): An ethnographic study in Rajanpur, Punjab Pakistan. Ann. King Edw. Med. Univ. 2019, 25, 1–8. [Google Scholar]


| District | Sub-Districts (Tehsils) | UC | ~Sample from Each UC |
|---|---|---|---|
| Rahimyar Khan | Khanpur Sample size = 96 | BaghoBahar | 26 |
| Azeem Shah | 34 | ||
| Kotla Pathan | 36 | ||
| Liaquatpur Sample size = 81 | Ghooka | 25 | |
| Shadani | 26 | ||
| TrindaGurgaij | 30 | ||
| Rahimyar Khan Sample size = 115 | Bahishti | 34 | |
| Sonak | 46 | ||
| Chak No. 84/P | 35 | ||
| Sadiqabad Sample size = 92 | Kot Sanger Khan | 33 | |
| Muhammad Pur | 32 | ||
| Roshan Bhet | 27 | ||
| Total | Tehsils = 4 | UCS = 12 | 384 |
| Indicators | Description | Stunting | Wasting | Underweight |
|---|---|---|---|---|
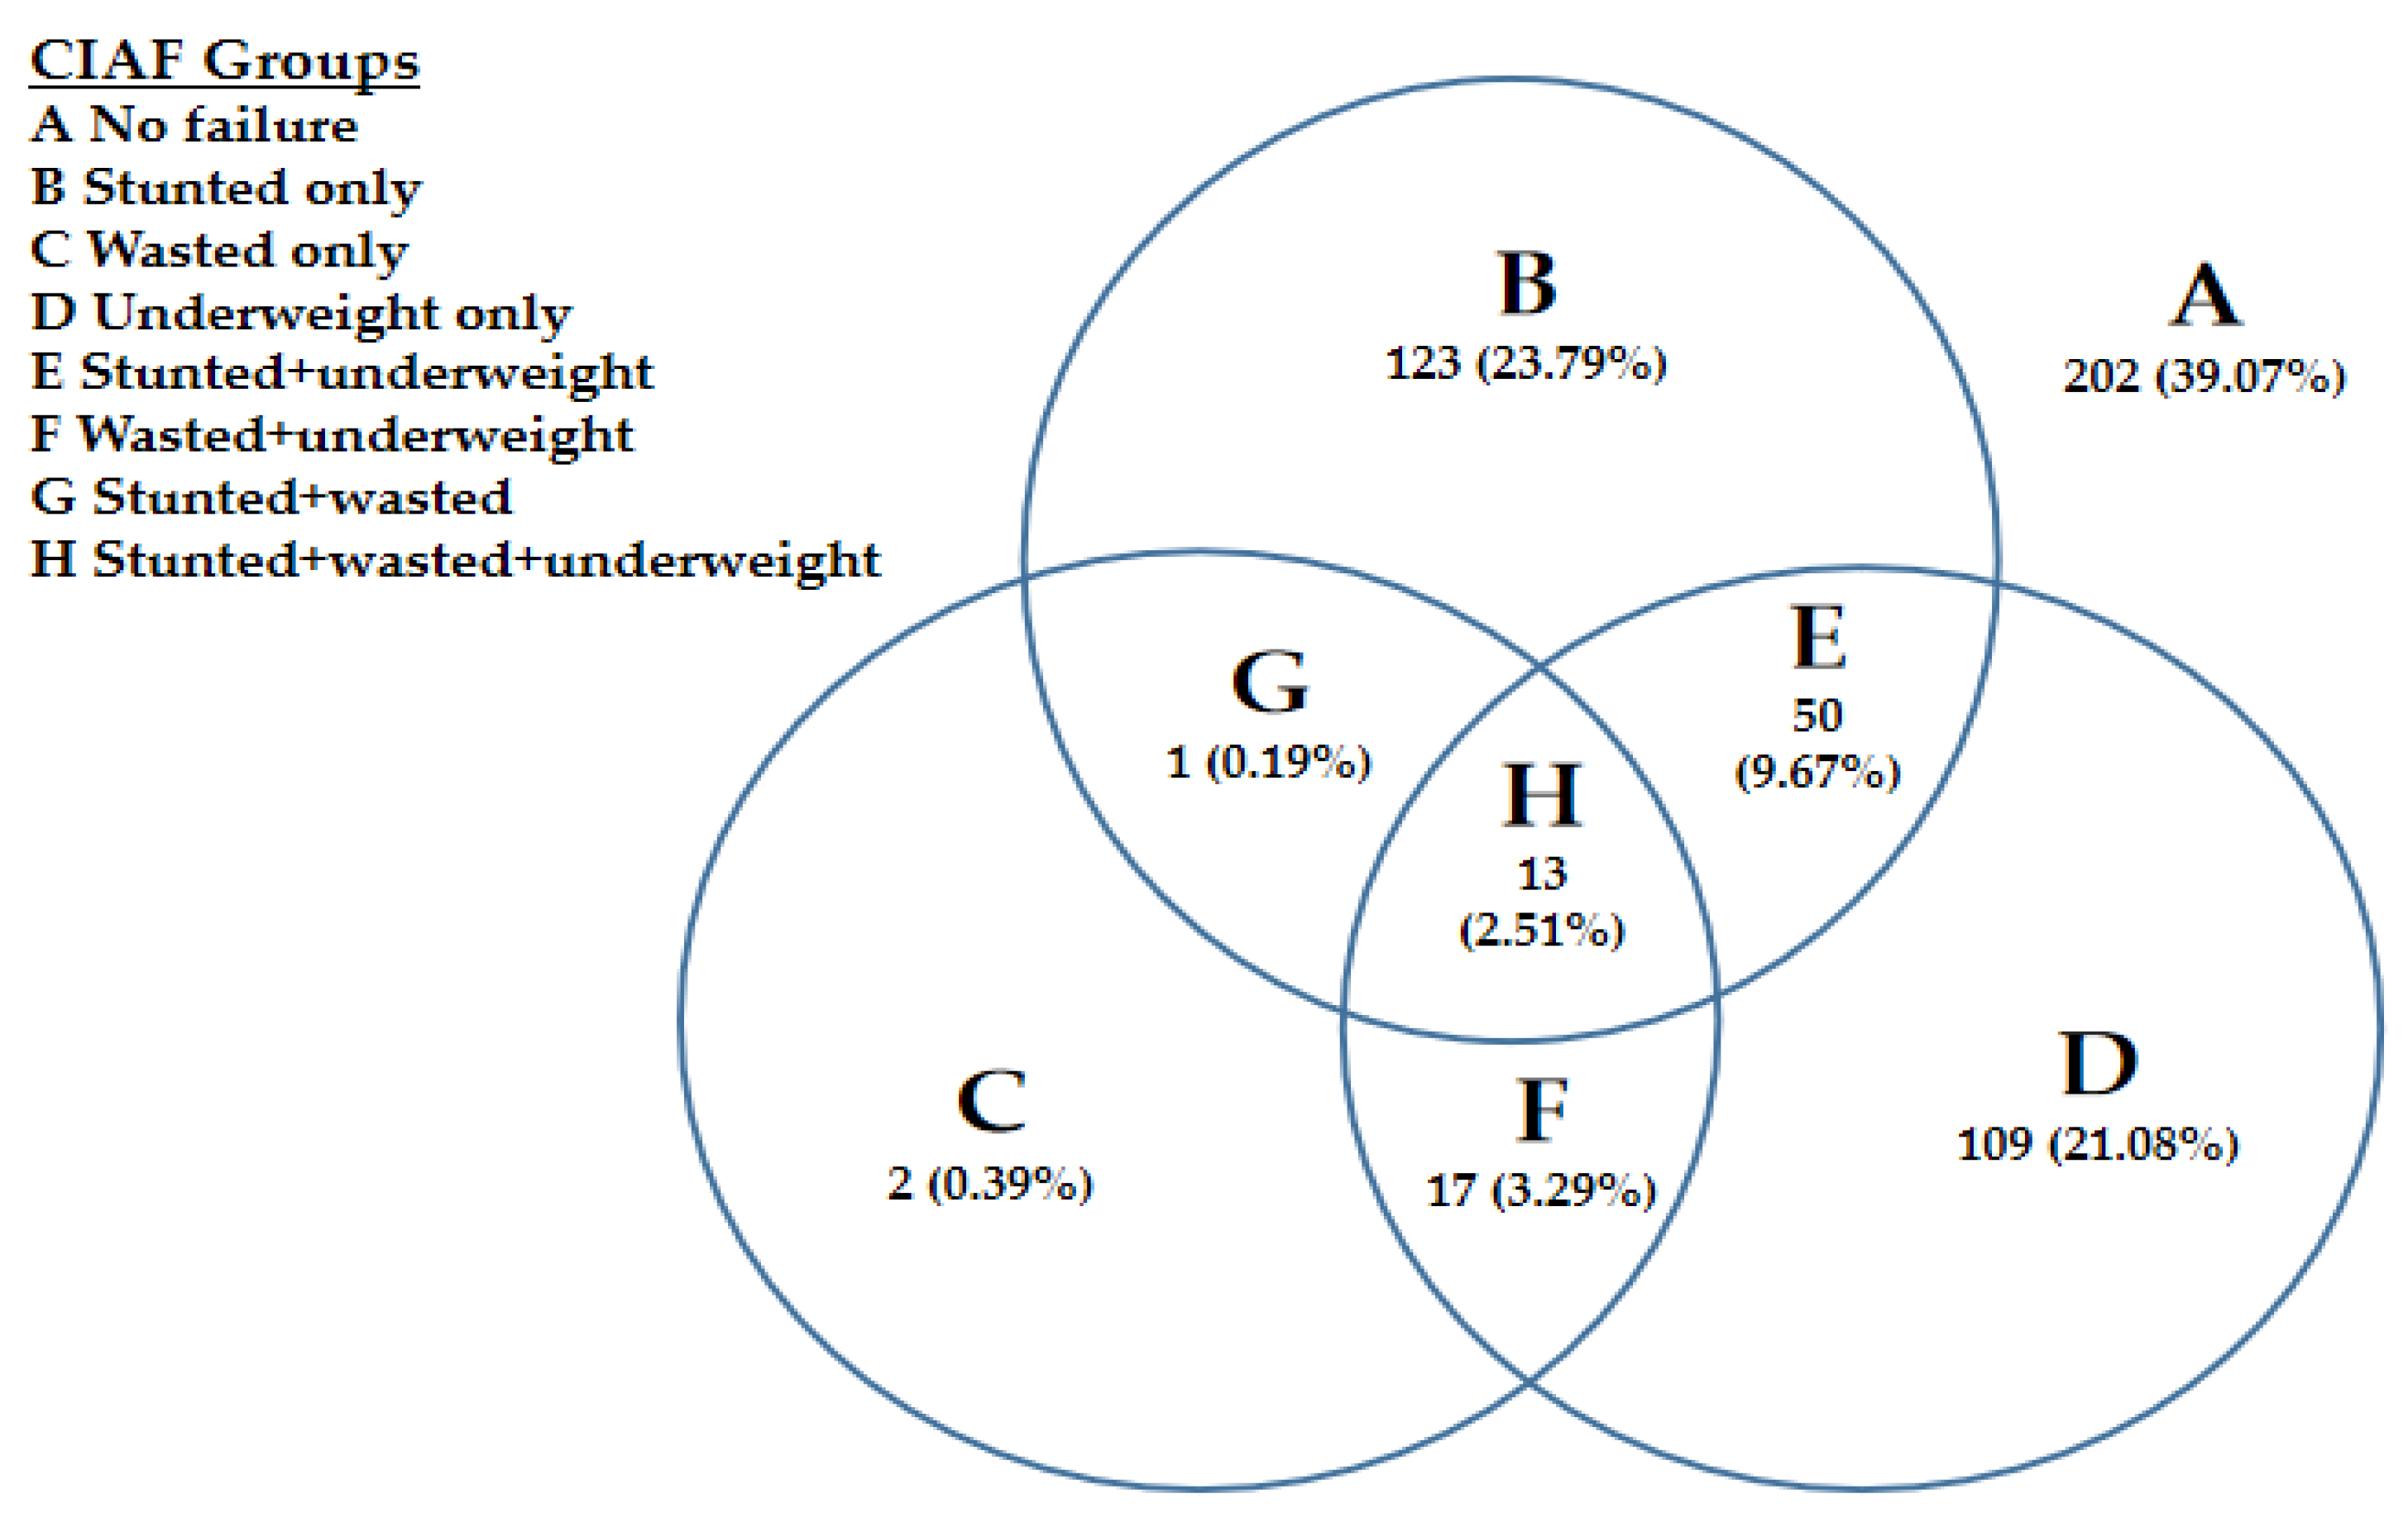
| A | No failure | No | No | No |
| B | Stunted only | Yes | No | No |
| C | Wasted only | No | Yes | No |
| D | Underweight only | No | No | Yes |
| E | Stunted and underweight | Yes | No | Yes |
| F | Wasted and Underweight | No | Yes | Yes |
| G | Stunted and wasted | Yes | Yes | No |
| H | Stunted, wasted & underweight | Yes | Yes | Yes |
| Indicators | Frequencies and Percentages |
|---|---|
| BMI-for-age | Normal = 133 (25.73%); Undernutrition = 321 (62.24%); Overweight = 12 (2.32%); Obesity = 14(2.71%) |
| MUAC | Normal = 213 (44.68%); Moderate Undernutrition (MAM) = 113 (21.86%); Severe Undernutrition (SAM) = 173 (33.46%) |
| CIAF | Normal = 114 (36.77%) Malnourished = 196 (63.23%) |
| Stunting | Normal = 81 (30.34%); Moderate = 93 (34.83%); Severe = 93 (34.83%) |
| Underweight | Normal = 78 (29%); Moderate = 67 (24.91%); Severe = 124 (46.10%) |
| Wasting | Normal = 39 (54.93%); Moderate = 21 (29.58%); Severe = 11 (15.49%) |
| Explanatory Variables | Categories | CIAF OR & CI | MUAC OR & CI | CBMI-for-Age OR & CI | Conventional Indices | ||
|---|---|---|---|---|---|---|---|
| Stunting OR & CI | Underweight OR & CI | Wasting OR & CI | |||||
| Chid age (0 to 12 months-reference) | 13–24 months | 1.798 [0.65, 5.007] | 0.68 [0.36, 1.27] | 1.97 ** [1.07, 3.62] | 2.09 [0.78, 5.57] | 1.33 [0.67, 2.59] | 1.27 [0.39, 4.18] |
| 25–36 months | 6.33 *** [2.24, 17.90] | 0.42 *** [0.23, 0.78] | 2.14 ** [1.16, 3.94] | 5.96 *** [2.36, 15.04] | 1.12 [0.59, 2.11] | 0.61 [0.18, 2.03] | |
| 37–48 months | 1.04 [0.45, 2.40] | 0.26 *** [0.14, 0.48] | 2.19 ** [1.19, 4.04] | 1.22 [0.56, 2.69] | 0.39 *** [0.21, 0.74] | 0.72 [0.24, 2.17] | |
| 49–60 months | 0.84 [0.36, 1.97] | 0.25 *** [0.33, 0.49] | 2.81 *** [1.43, 5.54] | 1.10 [0.49, 2.48] | 0.23 *** [0.11, 0.47] | 0.45 [0.12, 1.75] | |
| Child gender (Female-reference) | Male | 0.69 *** [0.41, 1.16] | 0.89 [0.62, 1.31] | 0.87 [0.59, 1.30] | 0.67 [0.41, 1.10] | 1.005 [0.67, 1.49] | 1.38 [0.65, 2.92] |
| Birth order number (Birth order 1-reference) | 2 or 3 | 0.90 [0.46, 1.77] | 2.72*** [1.71, 4.34] | 1.71 ** [1.07, 2.72] | 0.61 [0.32, 1.16] | 1.73 ** [1.04, 2.86] | 4.09 ** [1.30, 12.84] |
| 4 or 5 | 0.51 ** [0.25, 1.01] | 2.15*** [1.28, 3.62] | 2.33 *** [1.34, 4.06] | 0.52** [0.26, 1.004] | 1.23 [0.68, 2.12] | 2.10 [0.59, 7.54] | |
| 6 and above | 1.37 [0.54, 3.47] | 3.68 *** [1.84, 7.35] | 4.52 *** [1.87, 10.92] | 0.87 [0.36, 2.06] | 1.47 [0.73, 2.98] | 2.99 [0.69, 12.88] | |
| Mother’s education (Illiterate-reference) | Primary | 0.002 *** [1.48, 5.48] | 0.72 [0.34, 1.53] | 0.61 [0.29, 1.25] | 0.74 [0.36, 1.53] | 1.01 [0.53, 1.94] | 1.58 [0.55, 4.58] |
| Middle | 1.53 [0.44, 5.34] | 0.77 [0.53, 2.33] | 0.89 [0.36, 2.24] | 1.24 [0.42, 3.69] | 1.57 [0.73, 3.39] | 2.42 [0.54, 10.88] | |
| Matric & higher | 0.73 [0.19, 2.77] | 0.71 [0.36, 2.03] | 0.22 [0.44, 1.10] | 1.004 [0.31, 3.24] | 1.24 [0.24, 6.45] | 1.57 [0.16, 15.92] | |
| Mothers work Status (Working reference) | Not-working | 8.06 ** [0.93, 69.93] | 2.16 [0.67, 6.94] | 1.91 [0.62, 5.84] | 3.95 * [0.92, 16.91] | 2.57 [0.74, 8.95] | 1.69 [0.17, 17.23] |
| Household socio-economic status (SES-1-reference) | SES-2 | 0.002 ** [0.05, 0.88] | 2.88 * [0.86, 9.65] | 0.59 [0.17, 2.06] | 0.42 [0.13, 1.38] | 4.05 ** [1.21, 13.54] | 10.89 *** [2.77, 42.83] |
| SES-3 | 0.001 *** [0.01, 0.16] | 1.52 [0.38, 6.14] | 1.25 [0.27, 5.74] | 0.25 ** [0.06, 1.04] | 0.33 [0.08, 1.44] | 1.54 [0.16, 15.18] | |
| The overall significance of the models | |||||||
| *: References: Odd Ratios; p-Values; Confidence Intervals Significance level: *** if p < 0.01 ** if p < 0.05, * if p < 0.1 | Number of obs = 306 | Number of obs = 517 | Number of obs = 517 | Number of obs = 312 | Number of obs = 456 | Number of obs = 407 | |
| LR chi2(14) = 53.27 | LR chi2(15) = 64.62 | LR chi2(15) = 51.15 | LR chi2(14) = 38.86 | LR chi2(14) = 55.48 | LR chi2(15) = 13.34 | ||
| Prob > chi2 ≤ 0.0001 | Prob > chi2 ≤ 0.0001 | Prob > chi2 ≤ 0.0001 | Prob > chi2 = 0.0004 | Prob > chi2 ≤ 0.0001 | Prob > chi2 = 0.5764 | ||
| Pseudo R2 = 0.1318 | Pseudo R2 = 0.0909 | Pseudo R2 = 0.0802 | Pseudo R2 = 0.0917 | Pseudo R2 = 0.0895 | Pseudo R2 = 0.0582 | ||
Publisher’s Note: MDPI stays neutral with regard to jurisdictional claims in published maps and institutional affiliations. |
© 2022 by the authors. Licensee MDPI, Basel, Switzerland. This article is an open access article distributed under the terms and conditions of the Creative Commons Attribution (CC BY) license (https://creativecommons.org/licenses/by/4.0/).
Share and Cite
Shahid, M.; Liu, Y.; Ameer, W.; Qureshi, M.G.; Ahmed, F.; Tang, K. Comparison of Different Nutritional Screening Approaches and the Determinants of Malnutrition in Under-Five Children in a Marginalized District of Punjab Province, Pakistan. Children 2022, 9, 1096. https://doi.org/10.3390/children9071096
Shahid M, Liu Y, Ameer W, Qureshi MG, Ahmed F, Tang K. Comparison of Different Nutritional Screening Approaches and the Determinants of Malnutrition in Under-Five Children in a Marginalized District of Punjab Province, Pakistan. Children. 2022; 9(7):1096. https://doi.org/10.3390/children9071096
Chicago/Turabian StyleShahid, Muhammad, Yongshuan Liu, Waqar Ameer, Madeeha Gohar Qureshi, Farooq Ahmed, and Kun Tang. 2022. "Comparison of Different Nutritional Screening Approaches and the Determinants of Malnutrition in Under-Five Children in a Marginalized District of Punjab Province, Pakistan" Children 9, no. 7: 1096. https://doi.org/10.3390/children9071096
APA StyleShahid, M., Liu, Y., Ameer, W., Qureshi, M. G., Ahmed, F., & Tang, K. (2022). Comparison of Different Nutritional Screening Approaches and the Determinants of Malnutrition in Under-Five Children in a Marginalized District of Punjab Province, Pakistan. Children, 9(7), 1096. https://doi.org/10.3390/children9071096