
The Young Parenting Inventory (YPI-R3), and the Baumrind, Maccoby and Martin Parenting Model: Finding Common Ground

Abstract
:1. Introduction
2. The Present Research
3. Materials and Methods
3.1. Samples
3.2. Measures
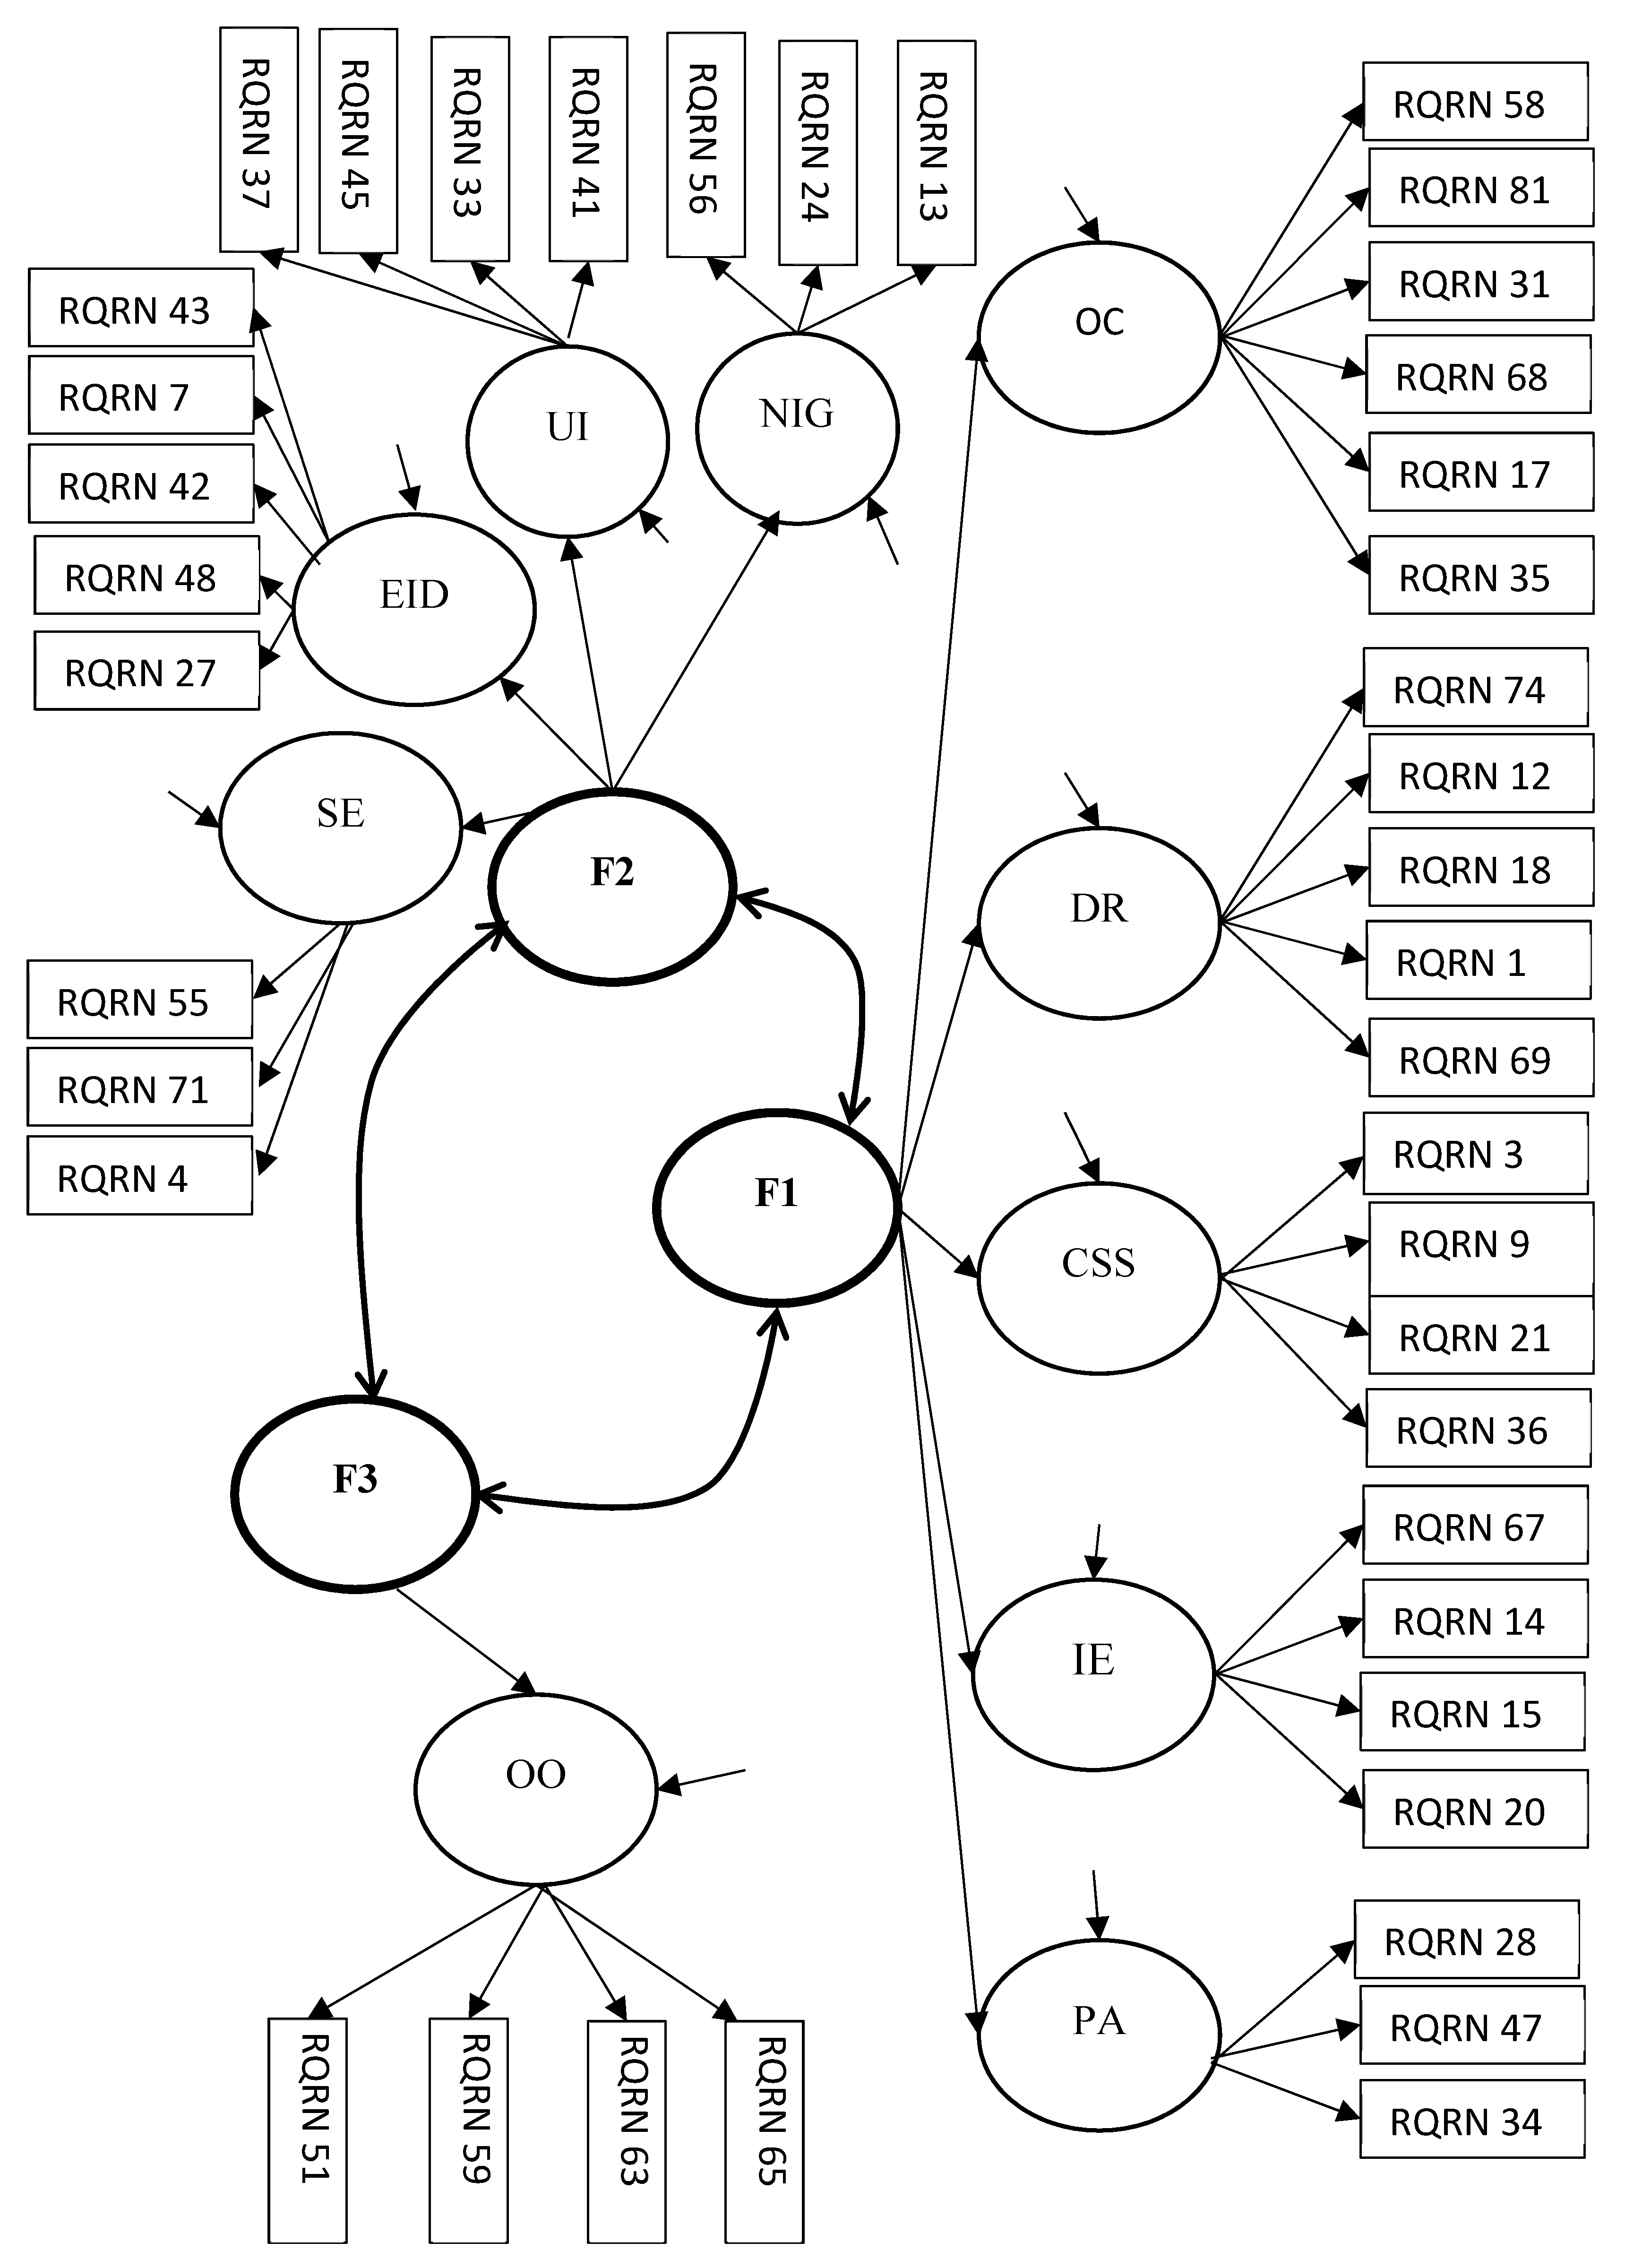
3.2.1. YPI-R3
3.2.2. Procedures and Statistical Analyses
4. Results
5. Discussion
6. Limitations
7. Future Studies
Supplementary Materials
Funding
Institutional Review Board Statement
Informed Consent Statement
Data Availability Statement
Acknowledgments
Conflicts of Interest
References
- Baumrind, D. Child care practices anteceding three patterns of preschool behavior. Genet. Psychol. Monogr. 1967, 75, 43–88. [Google Scholar] [PubMed]
- Maccoby, E.E.; Martin, J.A. Socialization in the Context of the Family: Parent-Child Interaction. Handb. Child Psychol. 1983, 1–101. [Google Scholar]
- Pinquart, M. Associations of parenting dimensions and styles with externalizing problems of children and adolescents: An updated meta-analysis. Dev. Psychol. 2017, 53, 873–932. [Google Scholar] [CrossRef] [PubMed]
- Darling, N.; Steinberg, L. Parenting style as context: An integrative model. Psychol. Bull. 1993, 113, 487–496. [Google Scholar] [CrossRef]
- Young, J.E.; Klosko, J.S.; Weishaar, M.E. Schema Therapy: A Practitioner’s Guide; Guilford Press: New York, NY, USA, 2006. [Google Scholar]
- Louis, J.P.; Wood, A.M.; Lockwood, G.; Ho, M.-H.R.; Ferguson, E. Positive clinical psychology and Schema Therapy (ST): The development of the Young Positive Schema Questionnaire (YPSQ) to complement the Young Schema Questionnaire 3 Short Form (YSQ-S3). Psychol. Assess 2018, 30, 1199–1213. [Google Scholar] [CrossRef]
- Bach, B.; Simonsen, E.; Christoffersen, P.; Kriston, L. The Young Schema Questionnaire 3 Short Form (YSQ-S3). Eur. J. Psychol. Assess 2017, 33, 134–143. [Google Scholar] [CrossRef]
- Kriston, L.; Schäfer, J.; Jacob, G.A.; Härter, M.; Hölzel, L.P. Reliability and validity of the German Version of the Young Schema Questionnaire—Short Form 3 (YSQ-S3). Eur. J. Psychol. Assess 2013, 29, 205–212. [Google Scholar] [CrossRef]
- Louis, J.P.; Wood, A.M.; Lockwood, G. Psychometric validation of the Young Parenting Inventory—Revised (YPI-R2): Replication and extension of a commonly used parenting scale in Schema Therapy (ST) research and practice. PLoS ONE 2018, 13, e0205605. [Google Scholar] [CrossRef]
- Louis, J.P.; Louis, K.M.C.D.; Lockwood, G. Development and Validation of the Young Parenting Inventory (YPI-R3) for Measuring Past Deviant and Normal Variations in Parenting. PLoS ONE, 2022; Manuscript submitted for publication. [Google Scholar]
- Cohen, J. A power primer. Psychol Bull. 1992, 112, 155–159. [Google Scholar] [CrossRef]
- Perris, C.; Jacobsson, L.; Lindström, H.; von Knorring, L.; Perris, H. Development of a new inventory of assessing memories of parental rearing behaviour. Acta Psychiatr Scand. 1980, 61, 265–274. [Google Scholar] [CrossRef] [PubMed]
- Thimm, J.C. Mediation of early maladaptive schemas between perceptions of parental rearing style and personality disorder symptoms. J. Behav. Ther. Exp. Psychiatry 2010, 41, 52–59. [Google Scholar] [CrossRef] [PubMed]
- Putnick, D.L.; Bornstein, M.H.; Lansford, J.E.; Malone, P.S.; Pastorelli, C.; Skinner, A.T.; Sorbring, E.; Tapanya, S.; Tirado, L.M.U.; Zelli, A.; et al. Perceived mother and father acceptance rejection predict four unique aspects of child adjustment across nine countries. J. Child Psychol. Psychiatry 2015, 56, 923–932. [Google Scholar] [CrossRef] [PubMed]
- IBM SPSS Statistics for Windows, Version 22.0; IBM Corp: Armonk, NY, USA, 2013.
- Muthen, L.K.; Muthen, B. Mplus User’s Guide: Statistical Analysis with Latent Variables, User’s Guide; Muthén & Muthén: Los Angeles, CA, USA, 2017. [Google Scholar]
- Little, R.J.A. A Test of Missing Completely at Random for Multivariate Data with Missing Values. J. Am. Stat. Assoc. 1988, 83, 1198–1202. [Google Scholar] [CrossRef]
- Schafer, J.L. Multiple imputation: A primer. Stat, Methods Med. Res. 1999, 8, 3. [Google Scholar] [CrossRef] [PubMed]
- Hair, J.F.; Black, W.C.; Babin, B.J.; Anderson, R.E. Multivariate Data Analysis, 7th ed.; Pearson Education: Upper Saddle Rive, NJ, USA, 2010. [Google Scholar]
- Tabachnick, B.G.; Fidell, L.S. Using Multivariate Statistics; Allyn & Bacon: Needham Heights, MA, USA, 2007. [Google Scholar]
- Ledesma, R.D.; Valero-Mora, P. Determining the number of factors to retain in EFA: An easy-to-use computer program for carrying out parallel analysis. Pract. Assess. Res. Eval. 2007, 12, 2. [Google Scholar] [CrossRef]
- Boomsma, A.; Hoogland, J.J. The Robustness of LISREL Modeling Revisited. In Structural Equation Modeling: Present and Future; Cudeck, R., Toit, S.D., Sörbom, D., Eds.; Scientific Software: Chicago, IL, USA, 2001; pp. 139–168. [Google Scholar]
- Wirth, R.J.; Edwards, M.C. Item factor analysis: Current approaches and future directions. Psychol. Methods 2007, 12, 58–79. [Google Scholar] [CrossRef] [Green Version]
- Kline, R.B. Principles and Practice of Structural Equation Modeling; Guilford Publications: New York, NY, USA, 2015. [Google Scholar]
- Browne, M.W.; Cudeck, R. Alternative ways of assessing model fit. Sociol. Methods Res. 1992, 21, 230–258. [Google Scholar] [CrossRef]
- Floyd, F.J.; Widaman, K.F. Factor analysis in the development and refinement of clinical assessment instruments. Psychol. Assess. 1995, 7, 286–299. [Google Scholar] [CrossRef]
- Baranoff, J.; Oei, T.; Cho, S.H.; Kwon, S.M. Factor structure and internal consistency of the Young Schema Questionnaire (Short Form) in Korea and Australian samples. J. Affect. Disord. 2006, 93, 133–140. [Google Scholar] [CrossRef]
- Bryne, B.M. Factor analytic models: Viewing the structure of an assessment instrument from three perspectives. J. Personal. Assess. 2005, 85, 17–32. [Google Scholar] [CrossRef] [PubMed] [Green Version]
- Milfont, T.; Fischer, R. Testing measurement invariance across groups: Applications in cross-cultural research. Int. J. Psychol. Res. 2010, 3, 111–130. [Google Scholar] [CrossRef] [Green Version]
- Patil, P.; Peng, R.D.; Leek, J.T. What should researchers expect when they replicate studies? A statistical view of replicability in psychological science. Perspect. Psychol. Sci. 2016, 11, 539–544. [Google Scholar] [CrossRef] [PubMed]
- Louis, J.P.; Wood, A.M.; Lockwood, G. Development and validation of the Positive Parenting Schema Inventory (PPSI) to complement the Young Parenting Inventory (YPI) for schema therapy (ST). Assessment 2020, 27, 766–786. [Google Scholar] [CrossRef]
- Louis, J.P.; Louis, K.M. Good Enough Parenting: An In-Depth Perspective on Meeting Core Emotional Needs and Avoiding Exasperation, 2nd ed.; Louis Counselling and Training Services Pte. Ltd.: Singapore, 2020. [Google Scholar]


| Characteristics | Categories | USA | South Africa | Nigeria | India | Singapore | Malaysia |
|---|---|---|---|---|---|---|---|
| Gender | Men | 147 | 159 | 209 | 169 | 260 | 83 |
| Women | 249 | 231 | 155 | 137 | 371 | 149 | |
| Total | 396 | 390 | 364 | 306 | 631 | 232 | |
| Age | Mean | 43.69 | 42.11 | 45.7 | 42.39 | 46.22 | 41.40 |
| SD | 9.12 | 6.79 | 7.19 | 7.67 | 22.34 | 17.40 | |
| Missing | >10% | 0 | 0 | 0 | 0 | 3 | 3 |
| Race | Chinese | N.A. | N.A. | N.A. | N.A. | 508 | 205 |
| Indonesian | N.A. | N.A. | N.A. | N.A. | 5 | 5 | |
| Indian | N.A. | 7 | N.A. | N.A. | 15 | 3 | |
| Filipino | N.A. | N.A. | N.A. | N.A. | 91 | 9 | |
| Caucasian / White | 104 | 65 | N.A. | N.A. | 2 | 2 | |
| Black | 52 | 135 | N.A. | N.A. | N.A. | N.A. | |
| Latino | 121 | N.A. | N.A. | N.A. | N.A. | N.A. | |
| Asian | 99 | N.A. | N.A. | N.A. | N.A. | N.A. | |
| Colored | N.A. | 17 | N.A. | N.A. | N.A. | N.A. | |
| Yoruba | N.A. | N.A. | 191 | N.A. | N.A. | N.A. | |
| Ibo | N.A. | N.A. | 72 | N.A. | N.A. | N.A. | |
| Hausa | N.A. | N.A. | 5 | N.A. | N.A. | N.A. | |
| North India | N.A. | N.A. | N.A. | 31 | N.A. | N.A. | |
| East India | N.A. | N.A. | N.A. | 44 | N.A. | N.A. | |
| South India | N.A. | N.A. | N.A. | 138 | N.A. | N.A. | |
| West India | N.A. | N.A. | N.A. | 45 | N.A. | N.A. | |
| Others | 20 | 7 | 96 | 48 | 9 | 8 | |
| Did not specify | 0 | 159 | 0 | 0 | 1 | 0 | |
| Missing | 0 | 0 | 0 | 0 | 3 | 3 | |
| Sample Size | 396 | 390 | 364 | 306 | 628 | 229 | |
| ** Final Fathers Sample Size, n | 259 | 318 | 328 | 277 | 592 | 222 | |
| ** Final Mothers Sample Size, n | 281 | 372 | 344 | 289 | 628 | 229 |
| Mothers | Fathers | |||||||
|---|---|---|---|---|---|---|---|---|
| YPI-R3 First Order Factors | Factors | Factors | ||||||
| 1 | 2 | 3 | 4 | 1 | 2 | 3 | 4 | |
| OC | 0.834 | 0.876 | ||||||
| DR | 0.782 | 0.806 | ||||||
| CSS | 0.782 | 0.806 | ||||||
| PA | 0.761 | 0.340 | 0.787 | |||||
| IE | 0.452 | 0.371 | 0.631 | 0.481 | ||||
| NIG | 0.853 | 0.813 | ||||||
| EID | 0.498 | 0.400 | 0.800 | |||||
| UI | 0.477 | 0.913 | ||||||
| SE | 0.767 | 0.460 | 0.630 | |||||
| OO | 0.541 | 0.979 | ||||||
| Mothers Sample | Fathers Sample | ||||||
|---|---|---|---|---|---|---|---|
| YPI-R3 First Order Factors | Factor | Factor | |||||
| 1 | 2 | 3 | 1 | 2 | 3 | ||
| OC | 0.859 | OC | 0.902 | ||||
| DR | 0.814 | DR | 0.839 | ||||
| CSS | 0.786 | CSS | 0.826 | ||||
| PA | 0.769 | PA | 0.816 | ||||
| IE | 0.465 | IE | 0.610 | ||||
| NIG | 0.882 | NIG | 0.927 | ||||
| EID | 0.494 | EID | 0.663 | ||||
| UI | 0.480 | UI | 0.608 | ||||
| SE | 0.433 | SE | 0.581 | ||||
| OO | 0.608 | OO | 0.979 | ||||
| Mothers Sample | Fathers Sample | ||||
|---|---|---|---|---|---|
| YPI-R3 First Order Factors | Factor | Factor | |||
| 1 | 2 | 1 | 2 | ||
| OC | 0.869 | OC | 0.901 | ||
| DR | 0.797 | CSS | 0.868 | ||
| CSS | 0.763 | DR | 0.821 | ||
| PA | 0.723 | PUN | 0.784 | ||
| IE | 0.439 | IE | 0.587 | ||
| NIG | −0.345 | 0.885 | NIG | 0.919 | |
| EID | 0.536 | EID | 0.638 | ||
| UI | 0.463 | UI | 0.630 | ||
| SE | 0.419 | SE | 0.569 | ||
| OO | OO | ||||
| Model | Number of Parameters | χ2 | df | p | χ2/df | CFI | TLI | RMSEA (CI) |
|---|---|---|---|---|---|---|---|---|
| Fathers | ||||||||
| Malaysia | 258 | 1643.812 | 767 | <0.001 | 2.14 | 0.88 | 0.87 | 0.072 (0.067–0.077) |
| USA | 258 | 1807.136 | 767 | <0.001 | 2.36 | 0.90 | 0.90 | 0.072 (0.068–0.077) |
| South Africa | 258 | 2066.145 | 767 | <0.001 | 2.69 | 0.93 | 0.92 | 0.073 (0.069–0.077) |
| Nigeria | 258 | 1750.401 | 767 | <0.001 | 2.28 | 0.94 | 0.94 | 0.063 (0.059–0.066) |
| India | 258 | 1880.033 | 767 | <0.001 | 2.45 | 0.89 | 0.88 | 0.072 (0.068–0.077) |
| Mothers | ||||||||
| Malaysia | 258 | 1616.696 | 767 | <0.001 | 2.11 | 0.88 | 0.87 | 0.070 (0.065–0.074) |
| USA | 258 | 1650.019 | 767 | <0.001 | 2.15 | 0.91 | 0.90 | 0.064 (0.060–0.068) |
| South Africa | 258 | 2001.574 | 767 | <0.001 | 2.61 | 0.94 | 0.93 | 0.066 (0.062–0.069) |
| Nigeria | 258 | 2181.266 | 767 | <0.001 | 2.84 | 0.91 | 0.90 | 0.073 (0.070–0.077) |
| India | 258 | 1820.338 | 767 | <0.001 | 2.37 | 0.90 | 0.89 | 0.069 (0.065–0.073) |
| Model | Number of Parameters | χ2 | df | p | χ2/df | CFI | TLI | RMSEA | ||
|---|---|---|---|---|---|---|---|---|---|---|
| Comparison | Decision | |||||||||
| Configural invariance | 1250 | 9509.20 | 3875 | <0.001 | 2.45 | 0.908 | 0.903 | 0.069 (0.068–0.071) | - | Accept |
| Metric invariance | 1102 | 9679.93 | 4023 | <0.001 | 2.41 | 0.908 | 0.906 | 0.068 (0.066–0.070) | Configural vs. metric | Accept |
| (308.22) | (148) | <0.001 | (<0.001) | (−0.003) | (−0.001) | |||||
| Scalar invariance | 494 | 10055.77 | 4631 | <0.001 | 2.17 | 0.912 | 0.922 | 0.062 (0.061–0.064) | Metric vs. scalar | Accept |
| (1224.78) | (608) | (<0.001) | (−0.004) | (−0.016) | (−0.006) | |||||
| Residual variance invariance | 290 | 9966.466 | 4835 | <0.001 | 2.06 | 0.916 | 0.929 | 0.059 (0.058–0.061) | Scalar vs. residual | Accept |
| (606.35) | (204) | (<0.001) | (−0.004) | (−0.007) | (−0.003) | |||||
| Factor variance invariance | 282 | 9062.66 | 4843 | <0.001 | 1.87 | 0.931 | 0.942 | 0.054 (0.052–0.055) | Residual vs. factor variance | Accept |
| (30.01) | (8) | (<0.001) | (−0.015) | (−0.013) | (−0.005) | |||||
| Factor covariance invariance | 270 | 8609.47 | 4855 | <0.001 | 1.77 | 0.939 | 0.948 | 0.051 (0.049–0.052) | Factor variance vs. factor covariance | Accept |
| (95.78) | (12) | (<0.001) | (−0.008) | (−0.006) | (−0.003) | |||||
| Factor mean invariance | 264 | 9034.14 | 4861 | <0.001 | 1.86 | 0.932 | 0.943 | 0.053 (0.052–0.055) | Factor covariance vs. factor mean | Accept |
| (105.49) | (6) | (<0.001) | (0.007) | (0.005) | (0.002) | |||||
| Acceptance criteria for indices (differences) | >0.9 | >0.9 | <0.06 | |||||||
| (<0.01) | (<0.01) | (<0.015) |
| Model | Number of Parameters | χ2 | df | p | χ2/df | CFI | TLI | RMSEA | ||
|---|---|---|---|---|---|---|---|---|---|---|
| Comparison | Decision | |||||||||
| Configural invariance | 1250 | 9388.05 | 3875 | <0.001 | 2.42 | 0.914 | 0.909 | 0.071 (0.069–0.073) | Accept | |
| Metric invariance | 1102 | 9692.57 | 4023 | <0.001 | 2.41 | 0.911 | 0.910 | 0.071 (0.069–0.073) | ||
| (515.75) | (148) | (<0.001) | (0.003) | (−0.001) | (<0.001) | Configural vs. metric | Accept | |||
| Scalar invariance | 494 | 10349.93 | 4631 | <0.001 | 2.23 | 0.910 | 0.921 | 0.066 (0.065–0.068) | ||
| (1497.71) | (608) | (<0.001) | (0.001) | (−0.011) | (−0.005) | Metric vs. scalar | Accept | |||
| Residual variance invariance | 290 | 10183.63 | 4835 | <0.001 | 2.11 | 0.916 | 0.929 | 0.063 (0.061–0.064) | ||
| (695.97) | (204) | (<0.001) | (−0.006) | (−0.008) | (−0.003) | Scalar vs. residual | Accept | |||
| Factor variance invariance | 282 | 9696.67 | 4843 | <0.001 | 2.00 | 0.924 | 0.936 | 0.060 (0.058–0.061) | ||
| (53.56) | (8) | (<0.001) | (−0.008) | (−0.007) | (−0.003) | Residual vs. factor variance | Accept | |||
| Factor covariance invariance | 270 | 9359.75 | 4855 | <0.001 | 1.93 | 0.929 | 0.940 | 0.057 (0.056–0.059) | ||
| (109.77) | (12) | (<0.001) | (−0.005) | (−0.004) | (−0.003) | Factor variance vs. factor covariance | Accept | |||
| Factor mean invariance | 264 | 9740.37 | 4861 | <0.001 | 2.00 | 0.924 | 0.936 | 0.060 (0.058–0.062) | ||
| (93.32) | (6) | (<0.001) | (0.005) | (0.004) | (0.003) | Factor covariance vs. factor mean | Accept |
| The Second Order Solution of YPI-R3 | The First Order Solution of YPI-R3 | |||||||
|---|---|---|---|---|---|---|---|---|
| χ2/df | CFI | TLI | RMSEA | χ2/df | CFI | TLI | RMSEA | |
| Fathers | ||||||||
| Malaysia | 2.14 | 0.875 | 0.866 | 0.072 (0.067–0.077) | 3.48 | 0.915 | 0.905 | 0.065 (0.062–0.068) |
| USA | 2.36 | 0.902 | 0.895 | 0.072 (0.068–0.077) | 1.87 | 0.909 | 0.898 | 0.063 (0.058–0.068) |
| South Africa | 2.69 | 0.927 | 0.922 | 0.073 (0.069–0.077) | 2.13 | 0.922 | 0.913 | 0.066 (0.062–0.071) |
| Nigeria | 2.28 | 0.942 | 0.939 | 0.063 (0.059–0.066) | 2.40 | 0.942 | 0.936 | 0.066 (0.062–0.070) |
| India | 2.45 | 0.89 | 0.880 | 0.072 (0.068–0.077) | 2.23 | 0.910 | 0.900 | 0.067(0.062–0.071) |
| Mothers | ||||||||
| Malaysia | 2.11 | 0.880 | 0.872 | 0.070 (0.065– 0.074) | 1.77 | 0.920 | 0.911 | 0.058 (0.053–0.063) |
| USA | 2.15 | 0.906 | 0.899 | 0.064 (0.060– 0.068) | 2.02 | 0.920 | 0.911 | 0.060 (0.056–0.065) |
| South Africa | 2.61 | 0.936 | 0.932 | 0.066 (0.062–0.069) | 2.36 | 0.949 | 0.942 | 0.060 (0.057–0.064) |
| Nigeria | 2.84 | 0.907 | 0.901 | 0.073 (0.070–0.077) | 2.51 | 0.928 | 0.919 | 0.066 (0.062–0.070) |
| India | 2.37 | 0.900 | 0.890 | 0.069 (0.065–0.073) | 2.13 | 0.921 | 0.912 | 0.062 (0.058–0.067) |
Publisher’s Note: MDPI stays neutral with regard to jurisdictional claims in published maps and institutional affiliations. |
© 2022 by the author. Licensee MDPI, Basel, Switzerland. This article is an open access article distributed under the terms and conditions of the Creative Commons Attribution (CC BY) license (https://creativecommons.org/licenses/by/4.0/).
Share and Cite
Louis, J.P. The Young Parenting Inventory (YPI-R3), and the Baumrind, Maccoby and Martin Parenting Model: Finding Common Ground. Children 2022, 9, 159. https://doi.org/10.3390/children9020159
Louis JP. The Young Parenting Inventory (YPI-R3), and the Baumrind, Maccoby and Martin Parenting Model: Finding Common Ground. Children. 2022; 9(2):159. https://doi.org/10.3390/children9020159
Chicago/Turabian StyleLouis, John Philip. 2022. "The Young Parenting Inventory (YPI-R3), and the Baumrind, Maccoby and Martin Parenting Model: Finding Common Ground" Children 9, no. 2: 159. https://doi.org/10.3390/children9020159
APA StyleLouis, J. P. (2022). The Young Parenting Inventory (YPI-R3), and the Baumrind, Maccoby and Martin Parenting Model: Finding Common Ground. Children, 9(2), 159. https://doi.org/10.3390/children9020159