
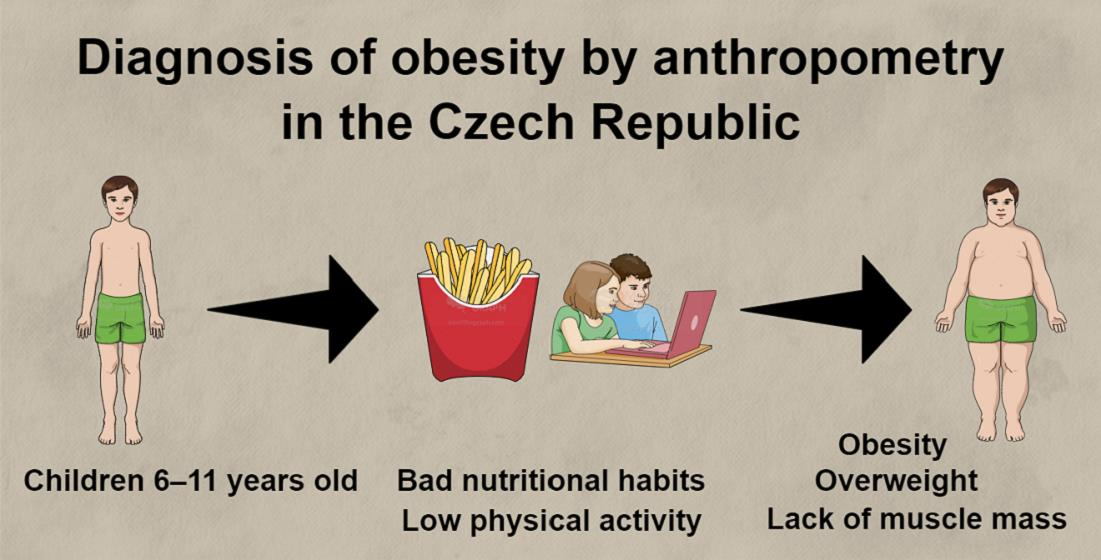
Body Fat Mass, Percent Body Fat, Fat-Free Mass, and Skeletal Muscle Mass Reference Curves for Czech Children Aged 6–11 Years


Abstract

1. Background
2. Methods
2.1. Subjects and Anthropometric Measurements
2.2. Statistical Analysis and Centile Curves
3. Results
4. Discussion
5. Limitations
6. Conclusions
Author Contributions
Funding
Ethical Approval and Consent to Participate
Consent for Publication
Availability of Data and Materials
Acknowledgments
Conflicts of Interest
Abbreviations
| BFM | body fat mass |
| %BF | percent body fat |
| SMM | skeletal muscle mass |
| FFM | fat-free mass |
| BMI | body mass index |
| MF-BIA | multifrequency bioelectrical impedance |
| PA | physical activity |
References
- Nasreddine, L.; Naja, F.; Chamieh, M.; Adra, N.; Sibai, A.M.; Hwalla, N. Trends in overweight and obesity in Lebanon: Evidence from two national cross-sectional surveys (1997 and 2009). BMC Public Health 2012. [Google Scholar] [CrossRef]
- Ogden, C.L.; Carroll, M.D.; Kit, B.K.; Flegal, K.M. Prevalence of obesity and trends in body mass index among US children and adolescents, 1999–2010. J. Am. Med. Assoc. 2012. [Google Scholar] [CrossRef]
- World Health Organisation: Obesity and Overweight. 2018. Available online: http://www.who.int/mediacentre/factsheets/fs311/en/ (accessed on 20 September 2019).
- Edwards, K.L.; Clarke, G.P.; Ransley, J.K.; Cade, J. The neighbourhood matters: Studying exposures relevant to childhood obesity and the policy implications in Leeds, UK. J. Epidemiol. Community Health 2010. [Google Scholar] [CrossRef] [PubMed]
- Ahrens, W.; Pigeot, I.; Pohlabeln, H.; De Henauw, S.; Lissner, L.; Molnar, D.; Moreno, L.A.; Tornaritis, M.; Veidebaum, T.; Siani, A. Prevalence of overweight and obesity in European children below the age of 10. Int. J. Obes. 2014, 38, S99–S107. [Google Scholar] [CrossRef] [PubMed]
- Reilly, J.J.; Methven, E.; McDowell, Z.C.; Hacking, B.; Alexander, D.; Stewart, L.; Kelnar, C.J. Health consequences of obesity. Arch. Dis. Child. 2003, 88, 748–752. [Google Scholar] [CrossRef]
- Reilly, J.J. Descriptive epidemiology and health consequences of childhood consequences. Best Pract. Res. Clin. Endocrinol. Metab. 2005, 19, 327–341. [Google Scholar] [CrossRef] [PubMed]
- Nader, P.R.; O’Brien, M.; Houts, R.; Bradley, R.; Belsky, J.; Crosnoe, R.; Friedman, S.; Mei, Z.; Susman, E.J. Identifying risk for obesity in early childhood. Pediatrics 2006, 118, e594–e601. [Google Scholar] [CrossRef]
- Eriksson, J.; Forsen, T.; Osmond, C.; Barker, D. Obesity from cradle to grave. Int. J. Obes. Relat. Metab. Disord. 2003. [Google Scholar] [CrossRef]
- Guo, S.S.; Huang, C.; Maynard, L.; Demerath, E.; Towne, B.; Chumlea, W.C.; Siervogel, R.M. Body mass index during childhood, adolescence and young adulthood in relation to adult overweight and adiposity: The Fels Longitudinal Study. Int. J. Obes. Relat. Metab. Disord. 2000, 24, 1628–1635. [Google Scholar] [CrossRef]
- Singh, A.S.; Mulder, C.; Twisk, J.W.R.; Van Mechelen, W.; Chinapaw, M.J.M. Tracking of childhood overweight into adulthood: A systematic review of the literature. Obes. Rev. 2008. [Google Scholar] [CrossRef] [PubMed]
- Wang, Y.; Ge, K.; Popkin, B.M. Tracking of body mass index from childhood to adolescence: A 6-y follow-up study in China. Am. J. Clin.Nutr. 2000, 72, 1018–1024. [Google Scholar] [CrossRef] [PubMed]
- Marinov, Z. Nadváha a běžná obezita v dětském věku—Zdravotní výzva 21. století. Lékařské listy Pediatrie 2014, 9, 21–24. [Google Scholar]
- Pastucha, D.; Filipčíková, R.; Bezdíčková, M.; Blažková, Z.; Hyjánek, J. Pohyb v Terapii a Prevenci Dětské Obesity; Grada Publishing: Praha, Czech Republic, 2011. [Google Scholar]
- Pietrobelli, A.; Heymsfield, S.B. Establishing body composition in obesity. J. Endocrinol. Investig. 2002. [Google Scholar] [CrossRef] [PubMed]
- Benson, A.C.; Torode, M.E.; Singh, M.A. Muscular strength and cardiorespiratory fitness is associated with higher insulin sensitivity in children and adolescents. Int. J. Pediatr. Obes. 2006, 1, 221–231. [Google Scholar] [CrossRef]
- Steene-Johannessen, J.; Anderssen, S.A.; Kolle, E.; Andersen, L.B. Lowmuscle fitness is associated with metabolic risk in youth. Med. Sci. Sports Exerc. 2009, 41, 1361–1367. [Google Scholar] [CrossRef]
- Marinov, Z. Rizika dětské obezity. Čes-slov Pediat. 2009, 64, 141–146. [Google Scholar]
- Riegerová, J.; Přidalová, M.; Ulbrichová, M. Aplikace fyzické Antropologie v Tělesné Výchově a Sportu; Hanex: Olomouc, Czechia, 2006. [Google Scholar]
- Roche, A.F.; Sun, S. Human Growth: Assessment and Interpretation; Cambridge University Press: Cambridge, UK, 2003. [Google Scholar] [CrossRef]
- Hermanussen, M. Auxology: An Update. Horm. Res. Paediatr. 2000. [Google Scholar] [CrossRef]
- Phyllis, B.; Tanner, E.; Tanner, J.M. Worldwide Variation in Human Growth, 2nd ed.; B.m.: Cambridge University Press: Cambridge, UK, 1990. [Google Scholar]
- Vignerová, J.; Riedlová, J.; Bláha, P.; Kobzová, J.; Krejčovský, L.; Brabec, M.; Hrušková, M. 6. Celostátní Antropologickývýzkum dětí a Mládeže 2001, Česká Republika. Souhrnné Výsledky; Státní Zdravotní Ústav Praha: Prague, Czechia, 2006. [Google Scholar]
- Klementa, J.; Machová, J.; Menzelová, M. Základní tělesné rozměry cvičenců ČSS 1975 ve srovnání s rozměry cvičenců I., II. a III. ČSS. Teor. Praxe Tělesné Výchovy 1976, 24, 685–700. [Google Scholar]
- Bláha, P.; et al. Antropometrie Československé Populace od 6 do 35 let /Československá Spartakiáda 1980/; OZZ VS: Praha, Czech Republic, 1982. [Google Scholar]
- Bláha, P.; et al. Antropometrie Československé Populace od 6 do 35 let /Československá Spartakiáda 1980/. Druhá část; OZZ VS: Praha, Czech Republic, 1984. [Google Scholar]
- Bláha, P.; et al. Antropometrie Československé Populace od 6 do 55 let. Československá Spartakiáda 1985. Díl I, část 1; ÚNZ VS: Praha, Czech Republic, 1986. [Google Scholar]
- Bláha, P.; Vignerová, J.; Paulová, M.; Riedlová, J.; Kobzová, J.; Krejčovský, L. Vývoj Tělesných Parametrů Českých Dětí a Mládeže se Zaměřením na Rozměry Hlavy (0–16 let). I. díl; SZÚ: Praha, Czech Republic, 1999. [Google Scholar]
- Bláha, P.; Vignerová, J.; Paulová, M.; Riedlová, J.; Kobzová, J.; Krejčovský, L. Vývoj Tělesných Parametrů Českých dětí a Mládeže se Zaměřením na Rozměry Hlavy (0–16 let). II. Díl; SZÚ: Praha, Czech Republic, 1999. [Google Scholar]
- Reilly, J.J.; Dorosty, A.R.; Emmett, P.M. Identification of the obese child: Adequacy of the body mass index for clinical practice and epidemiology. Int. J. Obes. Relat. Metab. Disord. 2000, 24, 1623–1627. [Google Scholar] [CrossRef]
- Malina, R.M.; Katzmarzyk, P.T. Validity of the body mass index as an indicator of the risk and presence of overweight in adolescents. Am. J. Clin. Nutr. 1999. [Google Scholar] [CrossRef]
- Fornetti, W.C.; Pivarnik, J.M.; Foley, J.M.; Fiechtner, J.J. Reliability and validity of body composition measures in female athletes. J. Appl. Physiol. 1999, 87, 1114–1122. [Google Scholar] [CrossRef]
- Gibson, A.; Holmes, J.; Desautels, R.; Edmonds, L.; Nuudi, L. Ability of new octapolar bioimpedance spectroscopy analyzers to predict 4–component model percentage body fat in Hispanic, black, and white adults. Am. J. Clin. Nutr. 2008, 87, 332–338. [Google Scholar] [CrossRef] [PubMed]
- Kyle, U.G.; Bosaeus, I.; De Lorenzo, A.D.; Deurenberg, P.; Elia, M.; Gómez, J.M.; Heitmann, B.L.; Kent-Smith, L.; Melchior, J.C.; Pirlich, M.; et al. Bioelectrical impedance analysis part I: Review of principles and methods. Clin. Nutr. 2004, 23, 1226–1243. [Google Scholar] [CrossRef] [PubMed]
- Lim, J.S.; Hwang, J.S.; Lee, J.A.; Kim, D.H.; Park, K.D.; Jeong, J.S.; Cheon, G.J. Cross-calibration of multi-frequency bioelectrical impedance analysis with eight-point tactile electrodes and dual-energy X-ray absorptiometry for assessment of body composition in healthy children aged 6–18 years. Pediatr. Int. 2009, 51, 263–268. [Google Scholar] [CrossRef] [PubMed]
- Malavolti, M.; Mussi, C.; Poli, M.; Fantuzzi, A.L.; Salvioli, G.; Battistini, N. Cross-calibration of eight-polar bioelectrical impedance analysis versus dual-energy X-ray absorptiometry for the assessment of total and appendicular body composition in healthy subjects aged 21–82 years. Ann. Hum. Bio 2003, 30, 380–391. [Google Scholar] [CrossRef]
- Kurtoglu, S.; Mazicioglu, M.M.; Ozturk, A.; Hatipoglu, N.; Cicek, B.; Ustunbas, H.B. Body fat reference curves for healthy Turkish children and adolescents. Eur. J. Pediatr. 2010. [Google Scholar] [CrossRef]
- Papandreou, D.; Malindretos, P.; Rousso, I. First body fat percentiles for 607 children from Thessaloniki-Northern Greece. Hippokratia 2010, 14, 208–211. [Google Scholar]
- Escobar-Cardozo, G.D.; Correa-Bautista, J.E.; González-Jiménez, E.; Schmidt-RioValle, J.; Ramírez-Vélez, R. Percentiles of body fat measured by bioelectrical impedance in children and adolescents from Bogotá (Colombia): The FUPRECOL study. Arch. Argent Pediatr. 2016, 114, 135–142. [Google Scholar] [PubMed]
- McCarthy, H.D.; Cole, T.J.; Fry, T.; Jebb, S.A.; Prentice, A.M. Body fat reference curves for children. Int. J. Obes. 2006. [Google Scholar] [CrossRef]
- Laurson, K.R.; Eisenmann, J.C.; Welk, G.J. Body fat percentile curves for U. S. children and adolescents. Am. J. Prev. Med. 2001. [Google Scholar] [CrossRef]
- Alpizar, M.; Peschard, V.G.; Escalante-Araiza, F.; Altamirano-Bustamante, N.F.; Murata, C.; Arenas-Pérez, R.; Rodriguez-Ayala, E. Smooted Body Composition Percentiles Curves for Mexican Children Aged 6 to 12 Years. Children 2017, 4, 112. [Google Scholar] [CrossRef]
- McCarthy, H.D.; Samani-Radia, D.; Jebb, S.A.; Prentice, A.M. Skeletal muscle mass reference curves for children and adolescents. Pediatr. Obes. 2014. [Google Scholar] [CrossRef]
- Chiplonkar, S.; Kajale, N.; Ekbote, V.; Mandlik, R.; Parthasarathy, L.; Borade, A.; Patel, P.; Patel, P.; Khadilkar, V.; Khadilkar, A. Reference Percentil Curves for Body Fat Percentage, Fat-free mass, Muscle Mass and Bone Mass Measured by Bioelectrical Impedance in Asian Indian Children and Adolescent. Indian Pediatr. 2017, 54, 1005–1011. [Google Scholar] [CrossRef] [PubMed]
- Liu, J.; Yan, Y.; Xi, B.; Huang, G.; Mi, J. Skeletal muscle reference for Chinese children and adolescents. JCSM 2019. [Google Scholar] [CrossRef] [PubMed]
- Kim, K.; Hong, S.; Kim, E.Y. Reference Values of Skeletal Muscle Mass for Korean Children and Adolescents Using Data from the Korean National Health and Nutrition Examination Survey 2009–2011. PLoS ONE 2016. [Google Scholar] [CrossRef] [PubMed]


| Age (Years) | n | Height (cm) | Weight (kg) | SMM (kg) | FFM (kg) | %BF | BFM (kg) |
|---|---|---|---|---|---|---|---|
| Boys | |||||||
| 6 | 74 | 125.5 ± 6.1 | 24.9 ± 4.5 | 10.9 ± 1.7 | 21.7 ± 2.8 | 12.2 ± 6.3 | 3.3 ± 2.3 |
| 7 | 223 | 132.1 ± 6.3 | 29.2 ± 5.4 | 11.7 ± 1.9 | 23.0 ± 3.1 | 12.3 ± 7.0 | 3.6 ± 2.9 |
| 8 | 254 | 134.2 ± 5.7 | 30.6 ± 6.5 | 13.3 ± 2.1 | 25.8 ± 3.4 | 14.5 ± 8.3 | 4.9 ± 4.0 |
| 9 | 179 | 139.0 ± 6.7 | 33.5 ± 7.0 | 14.5 ± 2.3 | 27.8 ± 3.9 | 15.7 ± 8.0 | 5.7 ± 4.2 |
| 10 | 148 | 145.4 ± 7.5 | 38.0 ± 9.3 | 16.3 ± 3.0 | 30.9 ± 5.0 | 17.2 ± 8.2 | 7.1 ± 5.3 |
| 11 | 130 | 148.3 ± 7.1 | 40.2 ± 8.4 | 17.5 ± 2.7 | 32.8 ± 4.6 | 17.0 ± 8.7 | 7.4 ± 5.3 |
| Girls | |||||||
| 6 | 95 | 124.0 ± 6.8 | 24.8 ± 6.1 | 10.3 ± 2.0 | 20.7 ± 3.4 | 15.4 ± 7.5 | 4.1 ± 3.1 |
| 7 | 255 | 127.5 ± 6.4 | 26.0 ± 5.1 | 10.8 ± 1.7 | 21.5 ± 2.9 | 16.0 ± 7.9 | 4.5 ± 3.1 |
| 8 | 251 | 132.1 ± 6.9 | 29.2 ± 5.7 | 12.0 ± 1.9 | 23.6 ± 3.3 | 18.2 ± 8.2 | 5.6 ± 3.6 |
| 9 | 174 | 136.9 ± 7.0 | 31.6 ± 7.5 | 13.1 ± 2.3 | 25.4 ± 3.9 | 18.0 ± 8.6 | 6.2 ± 4.6 |
| 10 | 177 | 144.6 ± 7.9 | 36.7 ± 8.6 | 15.3 ± 2.9 | 29.1 ± 4.8 | 19.1 ± 8.3 | 7.5 ± 4.9 |
| 11 | 133 | 147.0 ± 7.4 | 39.0 ± 9.6 | 16.2 ± 2.9 | 30.8 ± 4.9 | 19.5 ± 8.6 | 8.2 ± 6.0 |
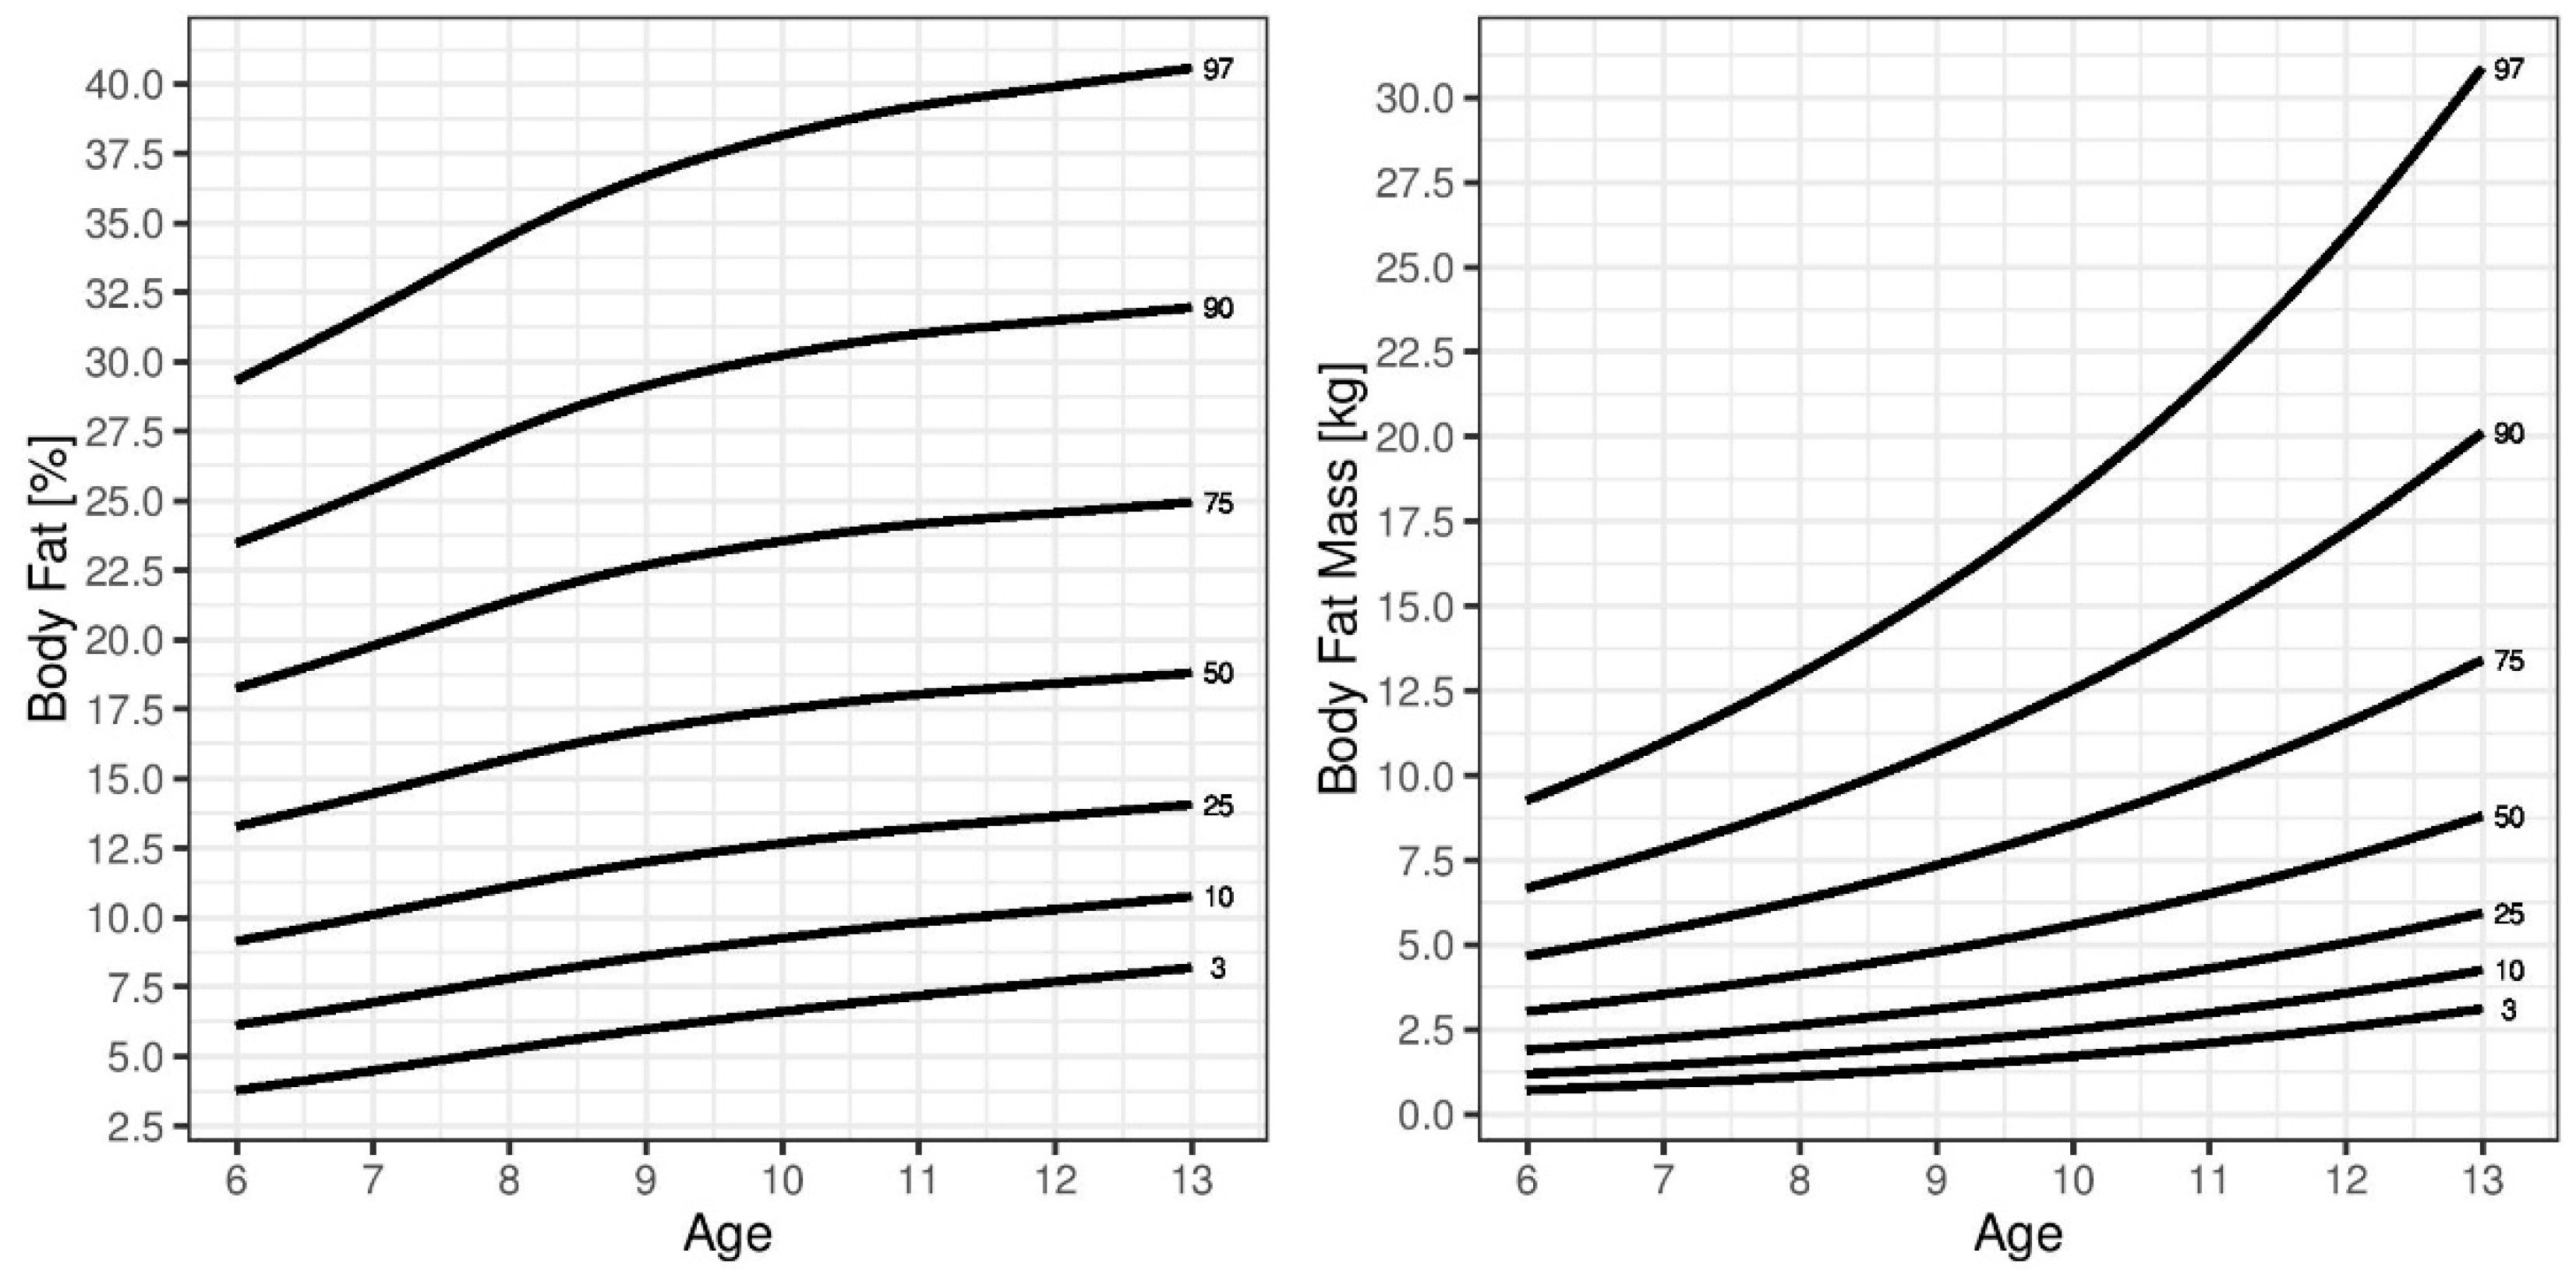
| Percentile | |||||||
|---|---|---|---|---|---|---|---|
| Age (Years) | 3 | 10 | 25 | 50 | 75 | 90 | 97 |
| Girls | |||||||
| 6 | 7.2 | 7.8 | 8.5 | 9.3 | 10.2 | 11.3 | 12.6 |
| 7 | 7.7 | 8.5 | 9.3 | 10.2 | 11.3 | 12.4 | 13.9 |
| 8 | 8.3 | 9.2 | 10.1 | 11.2 | 12.4 | 13.7 | 15.3 |
| 9 | 9.0 | 10.1 | 11.2 | 12.4 | 13.8 | 15.2 | 17.0 |
| 10 | 9.9 | 11.1 | 12.4 | 13.9 | 15.5 | 17.1 | 19.1 |
| 11 | 10.8 | 12.3 | 13.8 | 15.5 | 17.4 | 19.3 | 21.5 |
| Boys | |||||||
| 6 | 7.4 | 8.2 | 9.0 | 9.9 | 10.8 | 11.8 | 13.2 |
| 7 | 8.2 | 9.1 | 10.0 | 11.0 | 12.1 | 13.3 | 14.8 |
| 8 | 9.2 | 10.2 | 11.2 | 12.3 | 13.5 | 14.9 | 16.6 |
| 9 | 10.3 | 11.3 | 12.4 | 13.7 | 15.1 | 16.7 | 18.6 |
| 10 | 11.4 | 12.5 | 13.8 | 15.2 | 16.8 | 18.6 | 20.8 |
| 11 | 12.4 | 13.7 | 15.0 | 16.6 | 18.4 | 20.4 | 22.9 |
| Percentile | |||||||
|---|---|---|---|---|---|---|---|
| Age (years) | 3 | 10 | 25 | 50 | 75 | 90 | 97 |
| Girls | |||||||
| 6 | 0.7 | 1.2 | 1.9 | 3.0 | 4.7 | 6.7 | 9.3 |
| 7 | 0.9 | 1.4 | 2.2 | 3.5 | 5.4 | 7.8 | 11.0 |
| 8 | 1.1 | 1.7 | 2.6 | 4.1 | 6.3 | 9.1 | 13.0 |
| 9 | 1.4 | 2.1 | 3.1 | 4.8 | 7.3 | 10.7 | 15.4 |
| 10 | 1.7 | 2.5 | 3.7 | 5.6 | 8.5 | 12.5 | 18.3 |
| 11 | 2.1 | 3.0 | 4.3 | 6.5 | 9.9 | 14.7 | 21.8 |
| Boys | |||||||
| 6 | 0.7 | 1.0 | 1.5 | 2.3 | 3.7 | 6.0 | 9.8 |
| 7 | 0.8 | 1.1 | 1.6 | 2.6 | 4.2 | 6.6 | 10.6 |
| 8 | 0.9 | 1.3 | 2.0 | 3.1 | 5.0 | 7.8 | 12.4 |
| 9 | 1.2 | 1.7 | 2.6 | 4.1 | 6.6 | 10.2 | 15.8 |
| 10 | 1.4 | 2.1 | 3.2 | 5.1 | 8.2 | 12.6 | 19.2 |
| 11 | 1.6 | 2.4 | 3.6 | 5.8 | 9.3 | 14.2 | 21.2 |
| Percentile | |||||||
|---|---|---|---|---|---|---|---|
| Age (Years) | 3 | 10 | 25 | 50 | 75 | 90 | 97 |
| Girls | |||||||
| 6 | 15.4 | 16.5 | 17.6 | 19.0 | 20.5 | 22.2 | 24.5 |
| 7 | 16.4 | 17.6 | 19.0 | 20.5 | 22.2 | 24.2 | 26.7 |
| 8 | 17.4 | 18.9 | 20.5 | 22.2 | 24.2 | 26.4 | 29.1 |
| 9 | 18.7 | 20.4 | 22.2 | 24.3 | 26.6 | 29.1 | 32.1 |
| 10 | 20.1 | 22.2 | 24.3 | 26.8 | 29.5 | 32.3 | 35.7 |
| 11 | 21.7 | 24.2 | 26.8 | 29.7 | 32.8 | 36.0 | 39.8 |
| Boys | |||||||
| 6 | 15.8 | 17.2 | 18.5 | 20.0 | 21.6 | 23.4 | 25.8 |
| 7 | 17.3 | 18.8 | 20.3 | 21.9 | 23.7 | 25.7 | 28.3 |
| 8 | 18.9 | 20.5 | 22.1 | 24.0 | 26.1 | 28.3 | 31.2 |
| 9 | 20.6 | 22.4 | 24.2 | 26.3 | 28.7 | 31.2 | 34.4 |
| 10 | 22.4 | 24.3 | 26.3 | 28.8 | 31.5 | 34.4 | 38.1 |
| 11 | 24.4 | 26.5 | 28.7 | 31.5 | 34.6 | 38.0 | 42.2 |
| Percentile | |||||||
|---|---|---|---|---|---|---|---|
| Age (Years) | 3 | 10 | 25 | 50 | 75 | 90 | 97 |
| Girls | |||||||
| 6 | 3.8 | 6.1 | 9.1 | 13.3 | 18.2 | 23.5 | 29.3 |
| 7 | 4.5 | 6.9 | 10.1 | 14.5 | 19.8 | 25.4 | 31.8 |
| 8 | 5.2 | 7.8 | 11.1 | 15.7 | 21.4 | 27.5 | 34.5 |
| 9 | 6.0 | 8.6 | 12.0 | 16.7 | 22.7 | 29.1 | 36.7 |
| 10 | 6.6 | 9.3 | 12.7 | 17.5 | 23.5 | 30.2 | 38.2 |
| 11 | 7.2 | 9.8 | 13.2 | 18.0 | 24.2 | 31.0 | 39.2 |
| Boys | |||||||
| 6 | 3.3 | 4.7 | 6.8 | 10.0 | 14.6 | 20.5 | 28.5 |
| 7 | 3.5 | 5.1 | 7.2 | 10.6 | 15.4 | 21.3 | 29.1 |
| 8 | 3.9 | 5.6 | 8.0 | 11.7 | 16.9 | 23.1 | 31.1 |
| 9 | 4.4 | 6.5 | 9.3 | 13.5 | 19.2 | 25.9 | 34.4 |
| 10 | 4.9 | 7.2 | 10.3 | 14.9 | 21.0 | 28.1 | 36.8 |
| 11 | 5.0 | 7.5 | 10.7 | 15.4 | 21.6 | 28.6 | 37.1 |
Publisher’s Note: MDPI stays neutral with regard to jurisdictional claims in published maps and institutional affiliations. |
© 2021 by the authors. Licensee MDPI, Basel, Switzerland. This article is an open access article distributed under the terms and conditions of the Creative Commons Attribution (CC BY) license (https://creativecommons.org/licenses/by/4.0/).
Share and Cite
Zbořilová, V.; Přidalová, M.; Kaplanová, T. Body Fat Mass, Percent Body Fat, Fat-Free Mass, and Skeletal Muscle Mass Reference Curves for Czech Children Aged 6–11 Years. Children 2021, 8, 366. https://doi.org/10.3390/children8050366
Zbořilová V, Přidalová M, Kaplanová T. Body Fat Mass, Percent Body Fat, Fat-Free Mass, and Skeletal Muscle Mass Reference Curves for Czech Children Aged 6–11 Years. Children. 2021; 8(5):366. https://doi.org/10.3390/children8050366
Chicago/Turabian StyleZbořilová, Vendula, Miroslava Přidalová, and Tereza Kaplanová. 2021. "Body Fat Mass, Percent Body Fat, Fat-Free Mass, and Skeletal Muscle Mass Reference Curves for Czech Children Aged 6–11 Years" Children 8, no. 5: 366. https://doi.org/10.3390/children8050366
APA StyleZbořilová, V., Přidalová, M., & Kaplanová, T. (2021). Body Fat Mass, Percent Body Fat, Fat-Free Mass, and Skeletal Muscle Mass Reference Curves for Czech Children Aged 6–11 Years. Children, 8(5), 366. https://doi.org/10.3390/children8050366