


Predictors of Static Postural Loading in Primary-School-Aged Children: Comparing Elastic Net and Multiple Regression Methods
 , , , and
Abstract
1. Introduction
2. Materials and Methods
2.1. Study Design
2.2. Population
2.3. Outcome
2.4. Candidate Predicting Variables
2.5. Statistical Analysis
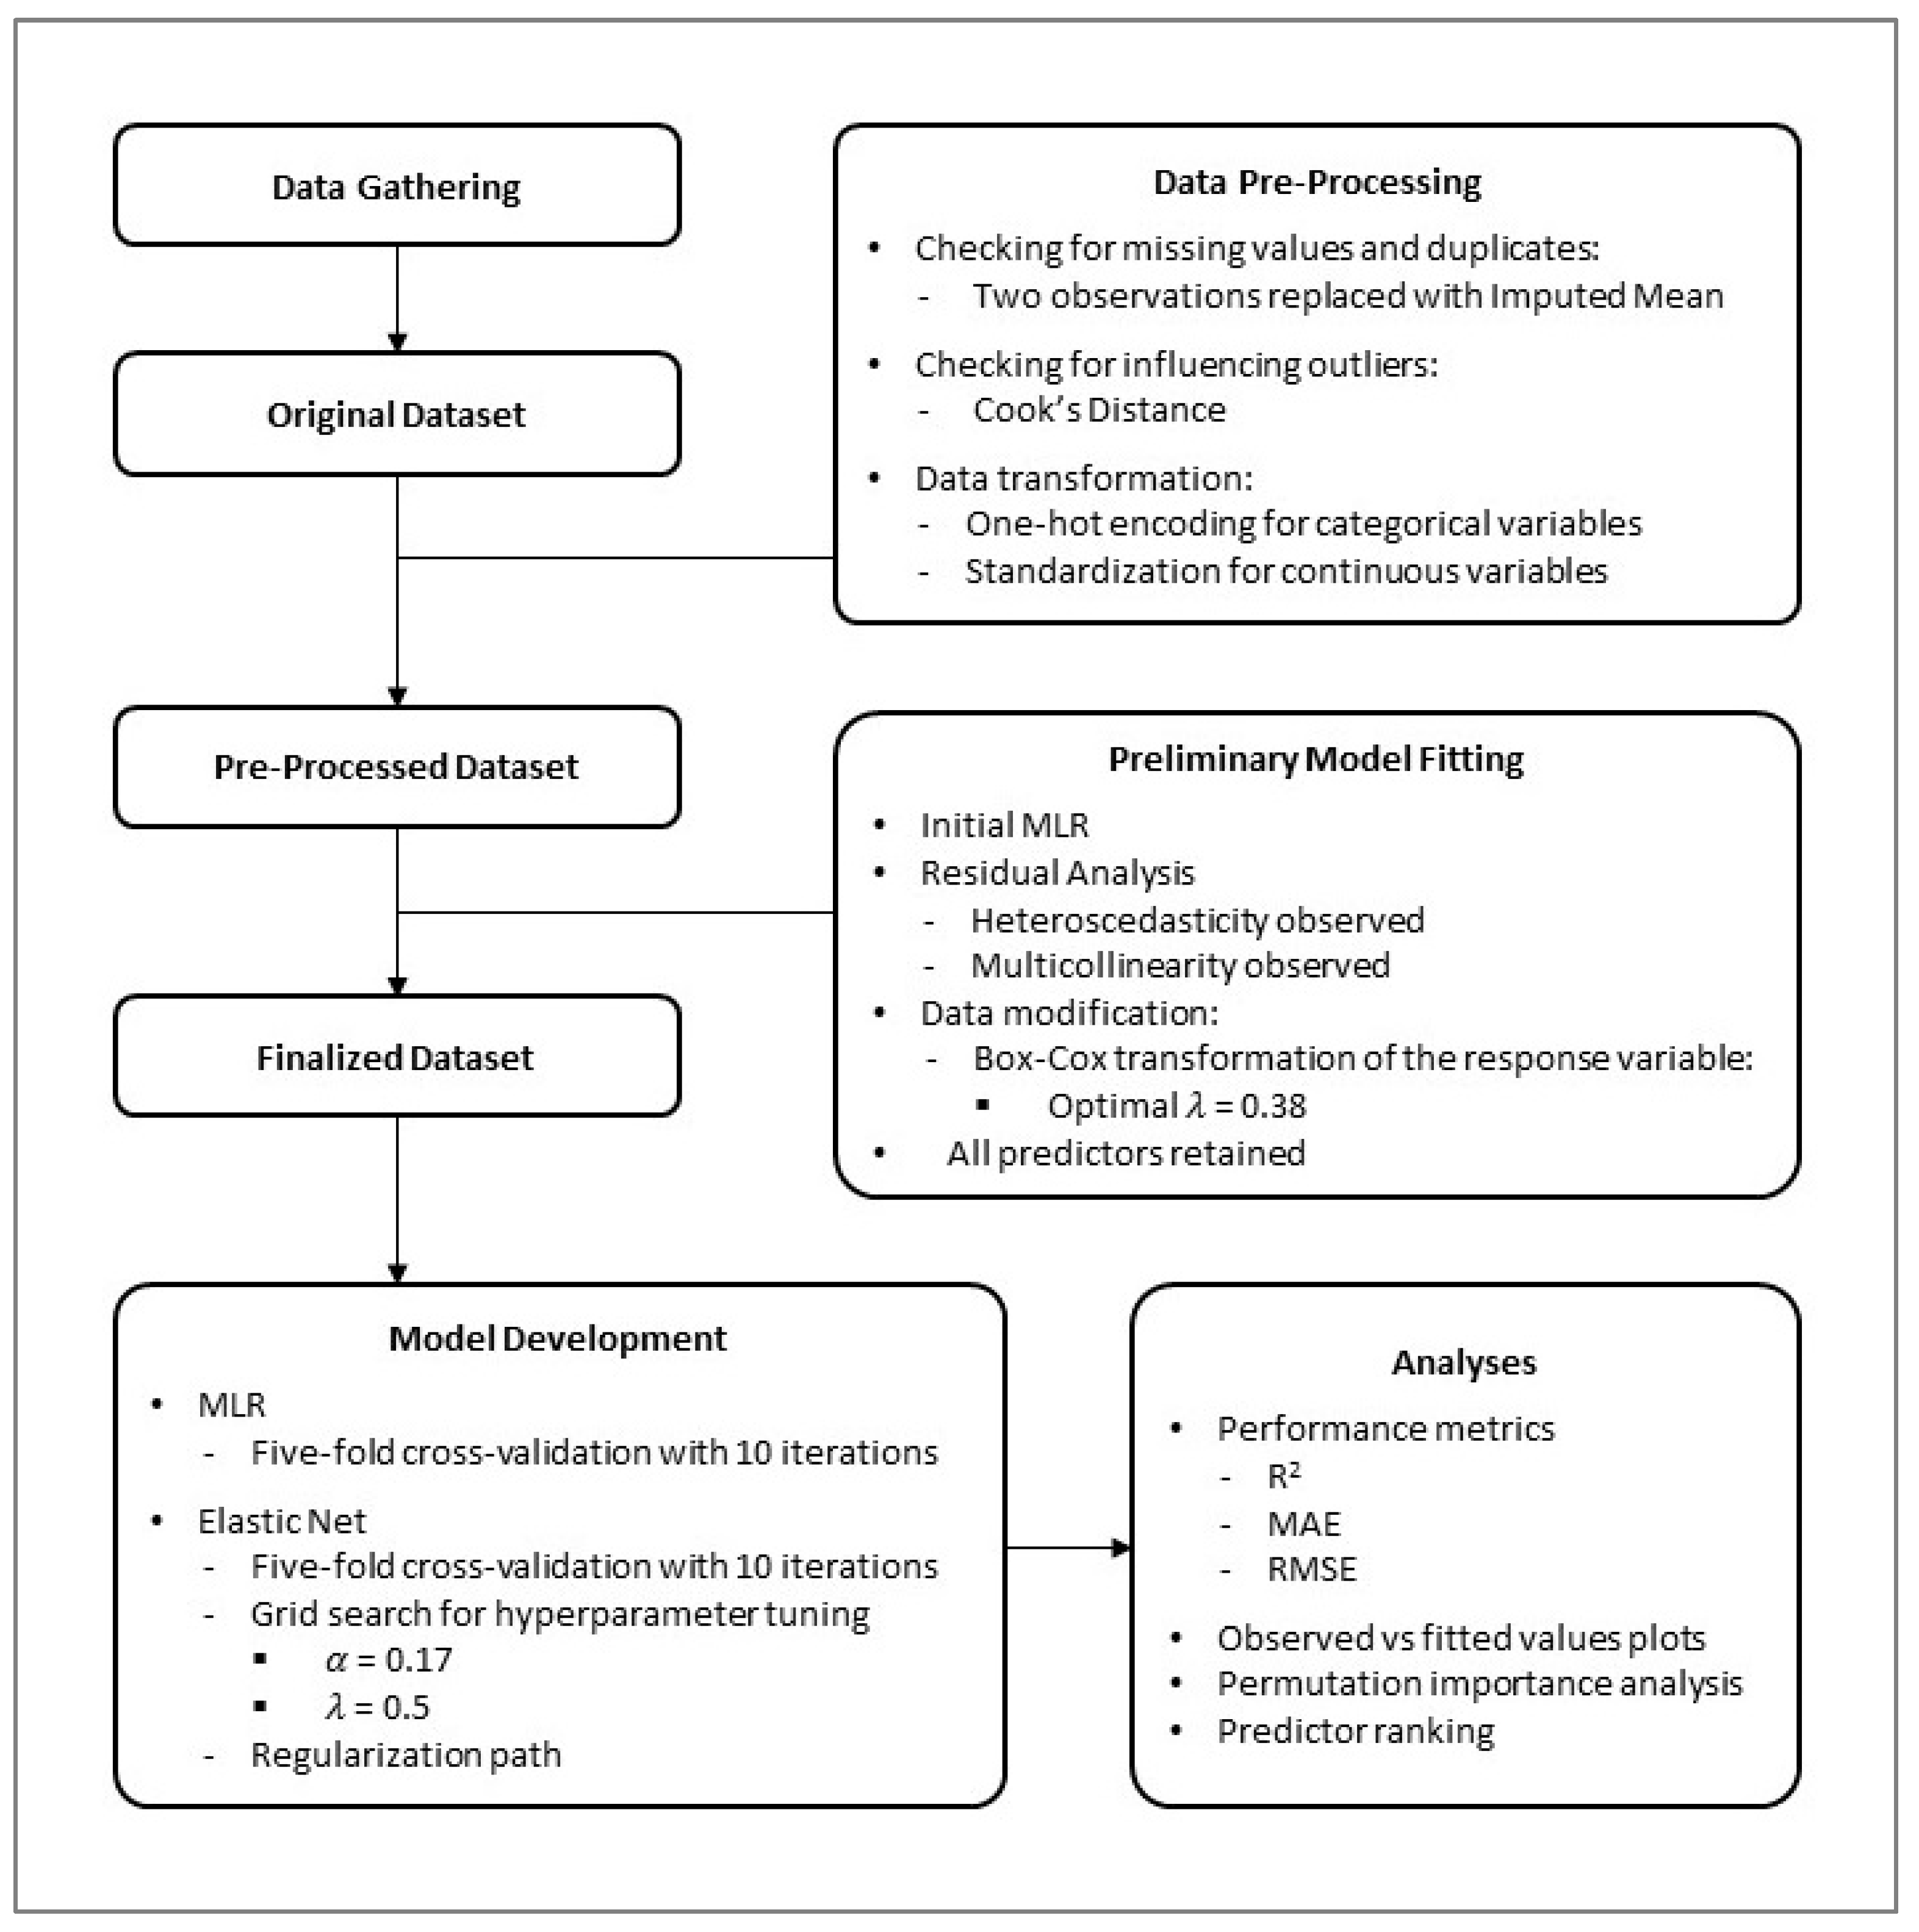
2.5.1. Data Pre-Processing
2.5.2. Model Fitting and Evaluation
3. Results
4. Discussion
4.1. Main Predictors of SPL in School Children
4.2. Regression Models
4.3. Implications
4.4. Strengths and Limitations
5. Conclusions
Supplementary Materials
Author Contributions
Funding
Institutional Review Board Statement
Informed Consent Statement
Data Availability Statement
Acknowledgments
Conflicts of Interest
Abbreviations
| SPL | Static Postural Loading |
| MLR | Multiple Linear Regression |
| EN | Elastic Net |
| pGALS | Pediatric version of Gait, Arms, Legs, and Spine Musculoskeletal Examination |
| REBA | Rapid Entire Body Assessment |
References
- De Freitas, J.; Glicksberg, B.S.; Johnson, K.W.; Miotto, R. Chapter 4—Deep learning for biomedical applications. In Machine Learning in Cardiovascular Medicine; Al’Aref, S.J., Singh, G., Baskaran, L., Metaxas, D., Eds.; Academic Press: Cambridge, MA, USA, 2021; pp. 71–94. [Google Scholar]
- Robinson, H.A.; Dam, R.; Hassan, L.; Jenkins, D.; Buchan, I.; Sperrin, M. Post-2000 growth trajectories in children aged 4–11 years: A review and quantitative analysis. Prev. Med. Rep. 2019, 14, 100834. [Google Scholar] [CrossRef]
- Williams, K.; Thomson, D.; Seto, I.; Contopoulos-Ioannidis, D.; Ioannidis, J.; Curtis, S.; Constantin, E.; Batmanabane, G.; Hartling, L.; Klassen, T. Standard 6: Age Groups for Pediatric Trials. Pediatrics 2012, 129 (Suppl. S3), S153–S160. [Google Scholar] [CrossRef] [PubMed]
- Tofts, L.; Das, S.; Collins, F.; Burton, K.L. Growth charts for Australian children with achondroplasia. Am. J. Med. Genet. Part A 2017, 173, 2189–2200. [Google Scholar] [CrossRef]
- Weinstein, S.L.; Dolan, L.A.; Holt, J. There’s More to Consider Than Thoracic Spine Height—The Case for Primary Spine Fusion in Older Early-onset Scoliosis Patients. Spine 2021, 46, 139–142. [Google Scholar] [CrossRef]
- Chen, C.; Chen, Y.; Zhang, Y.; Sun, W.; Jiang, Y.; Song, Y.; Zhu, Q.; Mei, H.; Wang, X.; Liu, S. Association between dietary patterns and precocious puberty in children: A population-based study. Int. J. Endocrinol. 2018, 2018, 4528704. [Google Scholar] [CrossRef]
- Martos-Moreno, G.Á.; Martínez-Villanueva, J.; González-Leal, R.; Chowen, J.A.; Argente, J. Sex, puberty, and ethnicity have a strong influence on growth and metabolic comorbidities in children and adolescents with obesity: Report on 1300 patients (the Madrid Cohort). Pediatr. Obes. 2019, 14, e12565. [Google Scholar] [CrossRef] [PubMed]
- Downing, K.L.; Salmon, J.; Timperio, A.; Hinkley, T.; Cliff, D.P.; Okely, A.D.; Hesketh, K.D. Sitting and screen time outside school hours: Correlates in 6-to 8-year-old children. J. Phys. Act. Health 2019, 16, 752–764. [Google Scholar] [CrossRef]
- Sherry, A.P.; Pearson, N.; Ridgers, N.D.; Barber, S.E.; Bingham, D.D.; Nagy, L.C.; Clemes, S.A. activPAL-measured sitting levels and patterns in 9–10 years old children from a UK city. J. Public Health 2019, 41, 757–764. [Google Scholar] [CrossRef]
- Reilly, J.J.; Barnes, J.; Gonzalez, S.; Huang, W.Y.; Manyanga, T.; Tanaka, C.; Tremblay, M.S. Recent Secular Trends in Child and Adolescent Physical Activity and Sedentary Behavior Internationally: Analyses of Active Healthy Kids Global Alliance Global Matrices 1.0 to 4.0. J. Phys. Act. Health 2022, 19, 729–736. [Google Scholar] [CrossRef]
- Abbass, S.J.; Abd-ul-Amir, D.Q. Effects of Backpack Loads on Kids Posture. Al-Nahrain J. Eng. Sci. 2017, 20, 876–886. [Google Scholar]
- Brzęk, A.; Dworrak, T.; Strauss, M.; Sanchis-Gomar, F.; Sabbah, I.; Dworrak, B.; Leischik, R. The weight of pupils’ schoolbags in early school age and its influence on body posture. BMC Musculoskelet. Disord. 2017, 18, 1–11. [Google Scholar] [CrossRef] [PubMed]
- Ihnow, S.B.; Sturm, P.F. Case of an Adolescent Male with Back Pain and Poor Posture: Scheuermann’s Kyphosis. In Back Pain in the Young Child and Adolescent; Springer: Berlin/Heidelberg, Germany, 2021; pp. 121–129. [Google Scholar]
- Kumar, P.; Singh, R.M.; Ratnakar, A. Role of physical education research activities and their impact in modern day life. Asian J. Multidimens. Res. (AJMR) 2018, 7, 420–425. [Google Scholar]
- Karalus, M.A.; Sullivan, T.A.; Wild, C.E.; Cave, T.L.; O’Sullivan, N.A.; Hofman, P.L.; Edwards, E.A.; Mouat, S.; Wong, W.; Anderson, Y.C. The cost of investigating weight-related comorbidities in children and adolescents in Aotearoa/New Zealand. J. Paediatr. Child Health 2021, 57, 1942–1948. [Google Scholar] [CrossRef] [PubMed]
- Li, X.; Vanderloo, L.M.; Maguire, J.L.; Keown-Stoneman, C.D.G.; Aglipay, M.; Anderson, L.N.; Cost, K.T.; Charach, A.; Vanderhout, S.M.; Birken, C.S.; et al. Public health preventive measures and child health behaviours during COVID-19: A cohort study. Can. J. Public Health 2021, 223, 831–842. [Google Scholar] [CrossRef]
- Neil, A.L.; Islam, F.; Kariuki, M.; Laurens, K.R.; Katz, I.; Harris, F.; Carr, V.J.; Green, M.J. Costs for physical and mental health hospitalizations in the first 13 years of life among children engaged with Child Protection Services. Child Abus. Negl. 2020, 99, 104280. [Google Scholar] [CrossRef]
- Raudenbush, B.L.; Gurd, D.P.; Goodwin, R.C.; Kuivila, T.E.; Ballock, R.T. Cost analysis of adolescent idiopathic scoliosis surgery: Early discharge decreases hospital costs much less than intraoperative variables under the control of the surgeon. J. Spine Surg. 2017, 3, 50. [Google Scholar] [CrossRef]
- Wolfe, I.; Satherley, R.-M.; Scotney, E.; Newham, J.; Lingam, R. Integrated care models and child health: A meta-analysis. Pediatrics 2020, 145, e20183747. [Google Scholar] [CrossRef]
- Zeng, W.; Li, G.; Ahn, H.; Nguyen, H.T.H.; Shepard, D.S.; Nair, D. Cost-Effectiveness of health systems strengthening interventions in improving maternal and child health in low-and middle-income countries: A systematic review. Health Policy Plan. 2018, 33, 283–297. [Google Scholar] [CrossRef]
- Hogan, M.E.; Taddio, A.; Katz, J.; Shah, V.; Krahn, M. Incremental health care costs for chronic pain in Ontario, Canada: A population-based matched cohort study of adolescents and adults using administrative data. Pain 2016, 157, 1626–1633. [Google Scholar] [CrossRef]
- Bevan, S. Economic impact of musculoskeletal disorders (MSDs) on work in Europe. Best Pract. Res. Clin. Rheumatol. 2015, 29, 356–373. [Google Scholar] [CrossRef]
- WHO. Health Promotion and Disease Prevention Through Population-Based Interventions; WHO: Geneva, Switzerland, 2021. [Google Scholar]
- Hulshof, C.T.; Pega, F.; Neupane, S.; van der Molen, H.F.; Colosio, C.; Daams, J.G.; Descatha, A.; Kc, P.; Kuijer, P.P.; Mandic-Rajcevic, S. The prevalence of occupational exposure to ergonomic risk factors: A systematic review and meta-analysis from the WHO/ILO Joint Estimates of the Work-related Burden of Disease and Injury. Environ. Int. 2021, 146, 106157. [Google Scholar] [CrossRef] [PubMed]
- OSHA, EU. EU-OSHA—European Agency for Safety and Health at Work, Work-Related Musculoskeletal Disorders: Prevalence, Costs and Demographics in the EU. 2019, EU-OSHA; EU-OSHA, 2019. (accessed on 23 March 2024).
- Wu, H.-C.; Wang, M.-J.J. Relationship between maximum acceptable work time and physical workload. Ergonomics 2002, 45, 280–289. [Google Scholar] [CrossRef]
- Aulia, S.F.; Alayyannur, P.A.; Dwiyanti, E.; Martiana, T.; Arini, S.Y. Correlation between Workload and Work Environment with Work Stress. Indian J. Forensic Med. Toxicol. 2021, 15, 1846–1852. [Google Scholar]
- DiDomenico, A.; Nussbaum, M.A. Effects of different physical workload parameters on mental workload and performance. Int. J. Ind. Ergon. 2011, 41, 255–260. [Google Scholar] [CrossRef]
- Schwartz, A.; Gerberich, S.G.; Albin, T.; Kim, H.; Ryan, A.D.; Church, T.R.; Green, D.R.; McGovern, P.M.; Erdman, A.G.; Arauz, R.F. The association between janitor physical workload, mental workload, and stress: The SWEEP study. Work 2020, 65, 837–846. [Google Scholar] [CrossRef]
- Oh, J.-I.; Yoo, D.-H.; Paek, D.-M.; Park, J.-S.; Cho, S.-I. Association between physical workload and work-related back pain: A Nationwide study. Korean J. Occup. Environ. Med. 2011, 23, 298–308. [Google Scholar] [CrossRef]
- Hashiguchi, N.; Kodama, K.; Lim, Y.; Che, C.; Kuroishi, S.; Miyazaki, Y.; Kobayashi, T.; Kitahara, S.; Tateyama, K. Practical judgment of workload based on physical activity, work conditions, and worker’s age in construction site. Sensors 2020, 20, 3786. [Google Scholar] [CrossRef]
- Jørgensen, M.B.; Nabe-Nielsen, K.; Clausen, T.; Holtermann, A. Independent effect of physical workload and childhood socioeconomic status on low back pain among health care workers in Denmark. Spine 2013, 38, E359–E366. [Google Scholar] [CrossRef] [PubMed]
- Mukherjee, S.; Rifkin, R.; Poggio, T. Regression and Classification with Regularization. In Nonlinear Estimation and Classification; Denison, D.D., Hansen, M.H., Holmes, C.C., Mallick, B., Yu, B., Eds.; Springer: New York, NY, USA, 2003; pp. 111–128. [Google Scholar]
- Bray, A. Evaluation of Human Work, 4th ed.; Taylor & Francis: Abingdon-on-Thames, UK, 2016; Volume 66. [Google Scholar]
- Joshi Mangesh, D.V. A systematic review of comparative studies on ergonomic assessment techniques. Int. J. Ind. Ergon. 2019, 74, 102865. [Google Scholar] [CrossRef]
- Hedge, A.; Morimoto, S.; McCrobie, D.J.E. Cornell musculoskeletal discomfort questionnaire. Ergonomics 1999. [Google Scholar] [CrossRef]
- Osqueizadeh, R.; Bandpei, M.A.M.; Rahmani, N.; Goudarzi, H.; Ebadi, A. Reliability and Validity of Observational Methods for Postural Load Assessment: An Updated Systematic Review. Health Scope 2023, 12, e137573. [Google Scholar] [CrossRef]
- Young, N.L.; Williams, J.I.; Yoshida, K.K.; Wright, J.G. Measurement properties of the activities scale for kids. J. Clin. Epidemiol. 2000, 53, 125–137. [Google Scholar] [CrossRef]
- lisahunter; Abbott, R.; Macdonald, D.; Ziviani, J.; Cuskelly, M. Active kids active minds: A physical activity intervention to promote learning? Asia-Pac. J. Health Sport Phys. Educ. 2014, 5, 117–131. [Google Scholar] [CrossRef]
- Aittasalo, M.; Jussila, A.; Tokola, K.; Sievänen, H.; Vähä-Ypyä, H.; Vasankari, T. Kids Out; evaluation of a brief multimodal cluster randomized intervention integrated in health education lessons to increase physical activity and reduce sedentary behavior among eighth graders. BMC Public Health 2019, 19, 415. [Google Scholar] [CrossRef]
- Nogueira, R.C.; Weeks, B.K.; Beck, B.R. An in-school exercise intervention to enhance bone and reduce fat in girls: The CAPO Kids trial. Bone 2014, 68, 92–99. [Google Scholar] [CrossRef]
- Rosenberg, D.E.; Norman, G.J.; Wagner, N.; Patrick, K.; Calfas, K.J.; Sallis, J.F. Reliability and Validity of the Sedentary Behavior Questionnaire (SBQ) for Adults. J. Phys. Act. Health 2010, 7, 697–705. [Google Scholar] [CrossRef]
- Bost, K.; Teran-Garcia, M.; Donovan, S.; Fiese, B.; Team, S.K. Child body mass index, genotype and parenting in the prediction of restrictive feeding. Pediatr. Obes. 2018, 13, 239–246. [Google Scholar] [CrossRef]
- Li, X.; Keown-Stoneman, C.D.; Lebovic, G.; Omand, J.A.; Adeli, K.; Hamilton, J.K.; Hanley, A.J.; Mamdani, M.; McCrindle, B.W.; Sievenpiper, J.L. The association between body mass index trajectories and cardiometabolic risk in young children. Pediatr. Obes. 2020, 15, e12633. [Google Scholar] [CrossRef]
- Birch, L.; Perry, R.; Hunt, L.P.; Matson, R.; Chong, A.; Beynon, R.; Shield, J.P. What change in body mass index is associated with improvement in percentage body fat in childhood obesity? A meta-regression. BMJ Open 2019, 9, e028231. [Google Scholar] [CrossRef]
- Elliott, S.A.; Truby, H.; Lee, A.; Harper, C.; Abbott, R.A.; Davies, P.S. Associations of body mass index and waist circumference with: Energy intake and percentage energy from macronutrients, in a cohort of Australian children. Nutr. J. 2011, 10, 58. [Google Scholar] [CrossRef]
- Weststrate, J.A.; Deurenberg, P. Body composition in children: Proposal for a method for calculating body fat percentage from total body density or skinfold-thickness measurements. Am. J. Clin. Nutr. 1989, 50, 1104–1115. [Google Scholar] [CrossRef] [PubMed]
- Nogueira, R.C.; Weeks, B.K.; Beck, B.R. Characterisation of the mechanical loads and metabolic intensity of the CAPO kids exercise intervention for healthy primary school children. J. Sports Sci. Med. 2015, 14, 562. [Google Scholar]
- Naser, S.S.A.; Al-Bayed, M.H. Detecting Health Problems Related to Addiction of Video Game Playing Using an Expert System. World Wide J. Multidiscip. Res. Dev. 2016, 2, 7–12. [Google Scholar]
- Foster, H.E.; Jandial, S. pGALS–paediatric Gait Arms Legs and Spine: A simple examination of the musculoskeletal system. Pediatr. Rheumatol. 2013, 11, 44. [Google Scholar] [CrossRef]
- Xue, Z.; Li, Q.; Ashraf, M. Designing wearables for assistive correction of children’s sitting posture. In Machine Learning, Multi Agent and Cyber Physical Systems: Proceedings of the 15th International FLINS Conference (FLINS 2022); World Scientific: Singapore, 2023; pp. 474–481. [Google Scholar]
- Sahabo, M.; Kabara, A. Anthropometrics and ergonomics of secondary school students in four yola metropolis, Adamawa State, Nigeria. J. Appl. Sci. Environ. Manag. 2023, 27, 1217–1222. [Google Scholar]
- Castellucci, H.; Arezes, P.; Molenbroek, J. Equations for defining the mismatch between students and school furniture: A systematic review. Int. J. Ind. Ergon. 2015, 48, 117–126. [Google Scholar] [CrossRef]
- Aminian, S.; Hinckson, E.A.; Stewart, T. Modifying the classroom environment to increase standing and reduce sitting. Build. Res. Inf. 2015, 43, 631–645. [Google Scholar] [CrossRef]
- Kimmerly, L.; Odell, D. Children and computer use in the home: Workstations, behaviors and parental attitudes. Work 2009, 32, 299–310. [Google Scholar] [CrossRef]
- Sedrez, J.A.; Rosa, M.I.Z.d.; Noll, M.; Medeiros, F.d.S.; Candotti, C.T. Risk factors associated with structural postural changes in the spinal column of children and adolescents. Rev. Paul. De Pediatr. 2015, 33, 72–81. [Google Scholar] [CrossRef]
- McAtamney, L.; Hignett, S. Rapid entire body assessment. In Handbook of Human Factors and Ergonomics Methods; CRC Press: Boca Raton, FL, USA, 2004; pp. 97–108. [Google Scholar]
- O’Brien, R.M. Dropping highly collinear variables from a model: Why it typically is not a good idea. Soc. Sci. Q. 2017, 98, 360–375. [Google Scholar] [CrossRef]
- Zou, H.; Hastie, T. Regularization and variable selection via the elastic net. J. R. Stat. Soc. Ser. B Stat. Methodol. 2005, 67, 301–320. [Google Scholar] [CrossRef]
- Altmann, A.; Toloşi, L.; Sander, O.; Lengauer, T. Permutation importance: A corrected feature importance measure. Bioinformatics 2010, 26, 1340–1347. [Google Scholar] [CrossRef]
- Software, P.P. Available online: www.python.org (accessed on 10 February 2024).
- Menor-Rodríguez, M.J.; Rodríguez-Blanque, R.; Montiel-Troya, M.; Cortés-Martín, J.; Aguilar-Cordero, M.J.; Sánchez-García, J.C. Educational Intervention in the Postural Hygiene of School-Age Children. Healthcare 2022, 10, 864. [Google Scholar] [CrossRef]
- Balkó, S.; Balkó, I.; Valter, L.; Jelínek, M. Influence of physical activities on the posture in 10-11 year old schoolchildren. J. Phys. Educ. Sport 2017, 17, 101. [Google Scholar]
- Hellig, T.; Mertens, A.; Brandl, C. The interaction effect of working postures on muscle activity and subjective discomfort during static working postures and its correlation with OWAS. Int. J. Ind. Ergon. 2018, 68, 25–33. [Google Scholar] [CrossRef]
- Warda, D.G.; Nwakibu, U.; Nourbakhsh, A. Neck and Upper Extremity Musculoskeletal Symptoms Secondary to Maladaptive Postures Caused by Cell Phones and Backpacks in School-Aged Children and Adolescents. Healthcare 2023, 11, 819. [Google Scholar] [CrossRef] [PubMed]
- Tanaka, C.; Tanaka, M.; Tanaka, S. Objectively evaluated physical activity and sedentary time in primary school children by gender, grade and types of physical education lessons. BMC Public Health 2018, 18, 948. [Google Scholar] [CrossRef] [PubMed]
- Ellis, Y.G.; Cliff, D.P.; Janssen, X.; Jones, R.A.; Reilly, J.J.; Okely, A.D. Sedentary time, physical activity and compliance with IOM recommendations in young children at childcare. Prev. Med. Rep. 2017, 7, 221–226. [Google Scholar] [CrossRef]
- McLellan, G.; Arthur, R.; Donnelly, S.; Buchan, D.S. Segmented sedentary time and physical activity patterns throughout the week from wrist-worn ActiGraph GT3X+ accelerometers among children 7–12 years old. J. Sport Health Sci. 2020, 9, 179–188. [Google Scholar] [CrossRef]
- Hidding, L.M.; Altenburg, T.M.; van Ekris, E.; Chinapaw, M.J.M. Why Do Children Engage in Sedentary Behavior? Child- and Parent-Perceived Determinants. Int. J. Environ. Res. Public Health 2017, 14, 671. [Google Scholar] [CrossRef]
- Enright, G.; Allman-Farinelli, M.; Redfern, J. Effectiveness of family-based behavior change interventions on obesity-related behavior change in children: A realist synthesis. Int. J. Environ. Res. Public Health 2020, 17, 4099. [Google Scholar] [CrossRef] [PubMed]
- McLaughlin, T.W.; Denney, M.K.; Snyder, P.A.; Welsh, J.L. Behavior support interventions implemented by families of young children: Examination of contextual fit. J. Posit. Behav. Interv. 2012, 14, 87–97. [Google Scholar] [CrossRef]
- Saunders, T.J.; Rollo, S.; Kuzik, N.; Demchenko, I.; Bélanger, S.; Brisson-Boivin, K.; Carson, V.; da Costa, B.G.G.; Davis, M.; Hornby, S.; et al. International school-related sedentary behaviour recommendations for children and youth. Int. J. Behav. Nutr. Phys. Act. 2022, 19, 39. [Google Scholar] [CrossRef] [PubMed]
- Guirado, T.; Chambonnière, C.; Chaput, J.-P.; Metz, L.; Thivel, D.; Duclos, M. Effects of Classroom Active Desks on Children and Adolescents’ Physical Activity, Sedentary Behavior, Academic Achievements and Overall Health: A Systematic Review. Int. J. Environ. Res. Public Health 2021, 18, 2828. [Google Scholar] [CrossRef] [PubMed]
- Hnatiuk, J.A.; Salmon, J.; Hinkley, T.; Okely, A.D.; Trost, S. A review of preschool children’s physical activity and sedentary time using objective measures. Am. J. Prev. Med. 2014, 47, 487–497. [Google Scholar] [CrossRef]
- Phillips, S.M.; Summerbell, C.; Hobbs, M.; Hesketh, K.R.; Saxena, S.; Muir, C.; Hillier-Brown, F.C. A systematic review of the validity, reliability, and feasibility of measurement tools used to assess the physical activity and sedentary behaviour of pre-school aged children. Int. J. Behav. Nutr. Phys. Act. 2021, 18, 1–28. [Google Scholar] [CrossRef]
- Dowda, M.; Saunders, R.P.; Dishman, R.K.; Pate, R.R. Association of physical activity, sedentary behavior, diet quality with adiposity: A longitudinal analysis in children categorized by baseline weight status. Int. J. Obes. 2024, 48, 240–246. [Google Scholar] [CrossRef]
- Maciałczyk-Paprocka, K.; Stawińska-Witoszyńska, B.; Kotwicki, T.; Sowińska, A.; Krzyżaniak, A.; Walkowiak, J.; Krzywińska-Wiewiorowska, M. Prevalence of incorrect body posture in children and adolescents with overweight and obesity. Eur. J. Pediatr. 2017, 176, 563–572. [Google Scholar] [CrossRef]

| Variable/Measure | Mean ± SD (Range) |
|---|---|
| Age (years) | 9.4 ± 1.7 (7–12) |
| BMI (kg/m2) | 16.9 ± 4.8 (7.5–28.6) |
| Body Fat Percentage (%) | 16.5 ± 5 (8.2–30.1) |
| Sedentary Behavior (hours/week) | 15.3 ± 2.4 (10–19) |
| Task Duration (minutes) | 14.2 ± 3.3 (9–23) |
| Postural Risk (scores 1–7) | 3 ± 1.2 (1–5) |
| n (%) | |
| Gender | |
| Male | 130 (50.3) |
| Female | 128 (49.7) |
| Musculoskeletal Health (pGALS examination) | |
| Healthy | 101 (60.9) |
| Condition | 157 (39.1) |
| Anthropometric Match (standard equations) | |
| Matched | 120 (46.5) |
| Mismatched | 138 (53.5) |
| Sitting Type | |
| Upright | 74 (28.7) |
| Leaning Forward | 64 (24.8) |
| Slouched | 66 (25.6) |
| Slumped | 54 (20.9) |
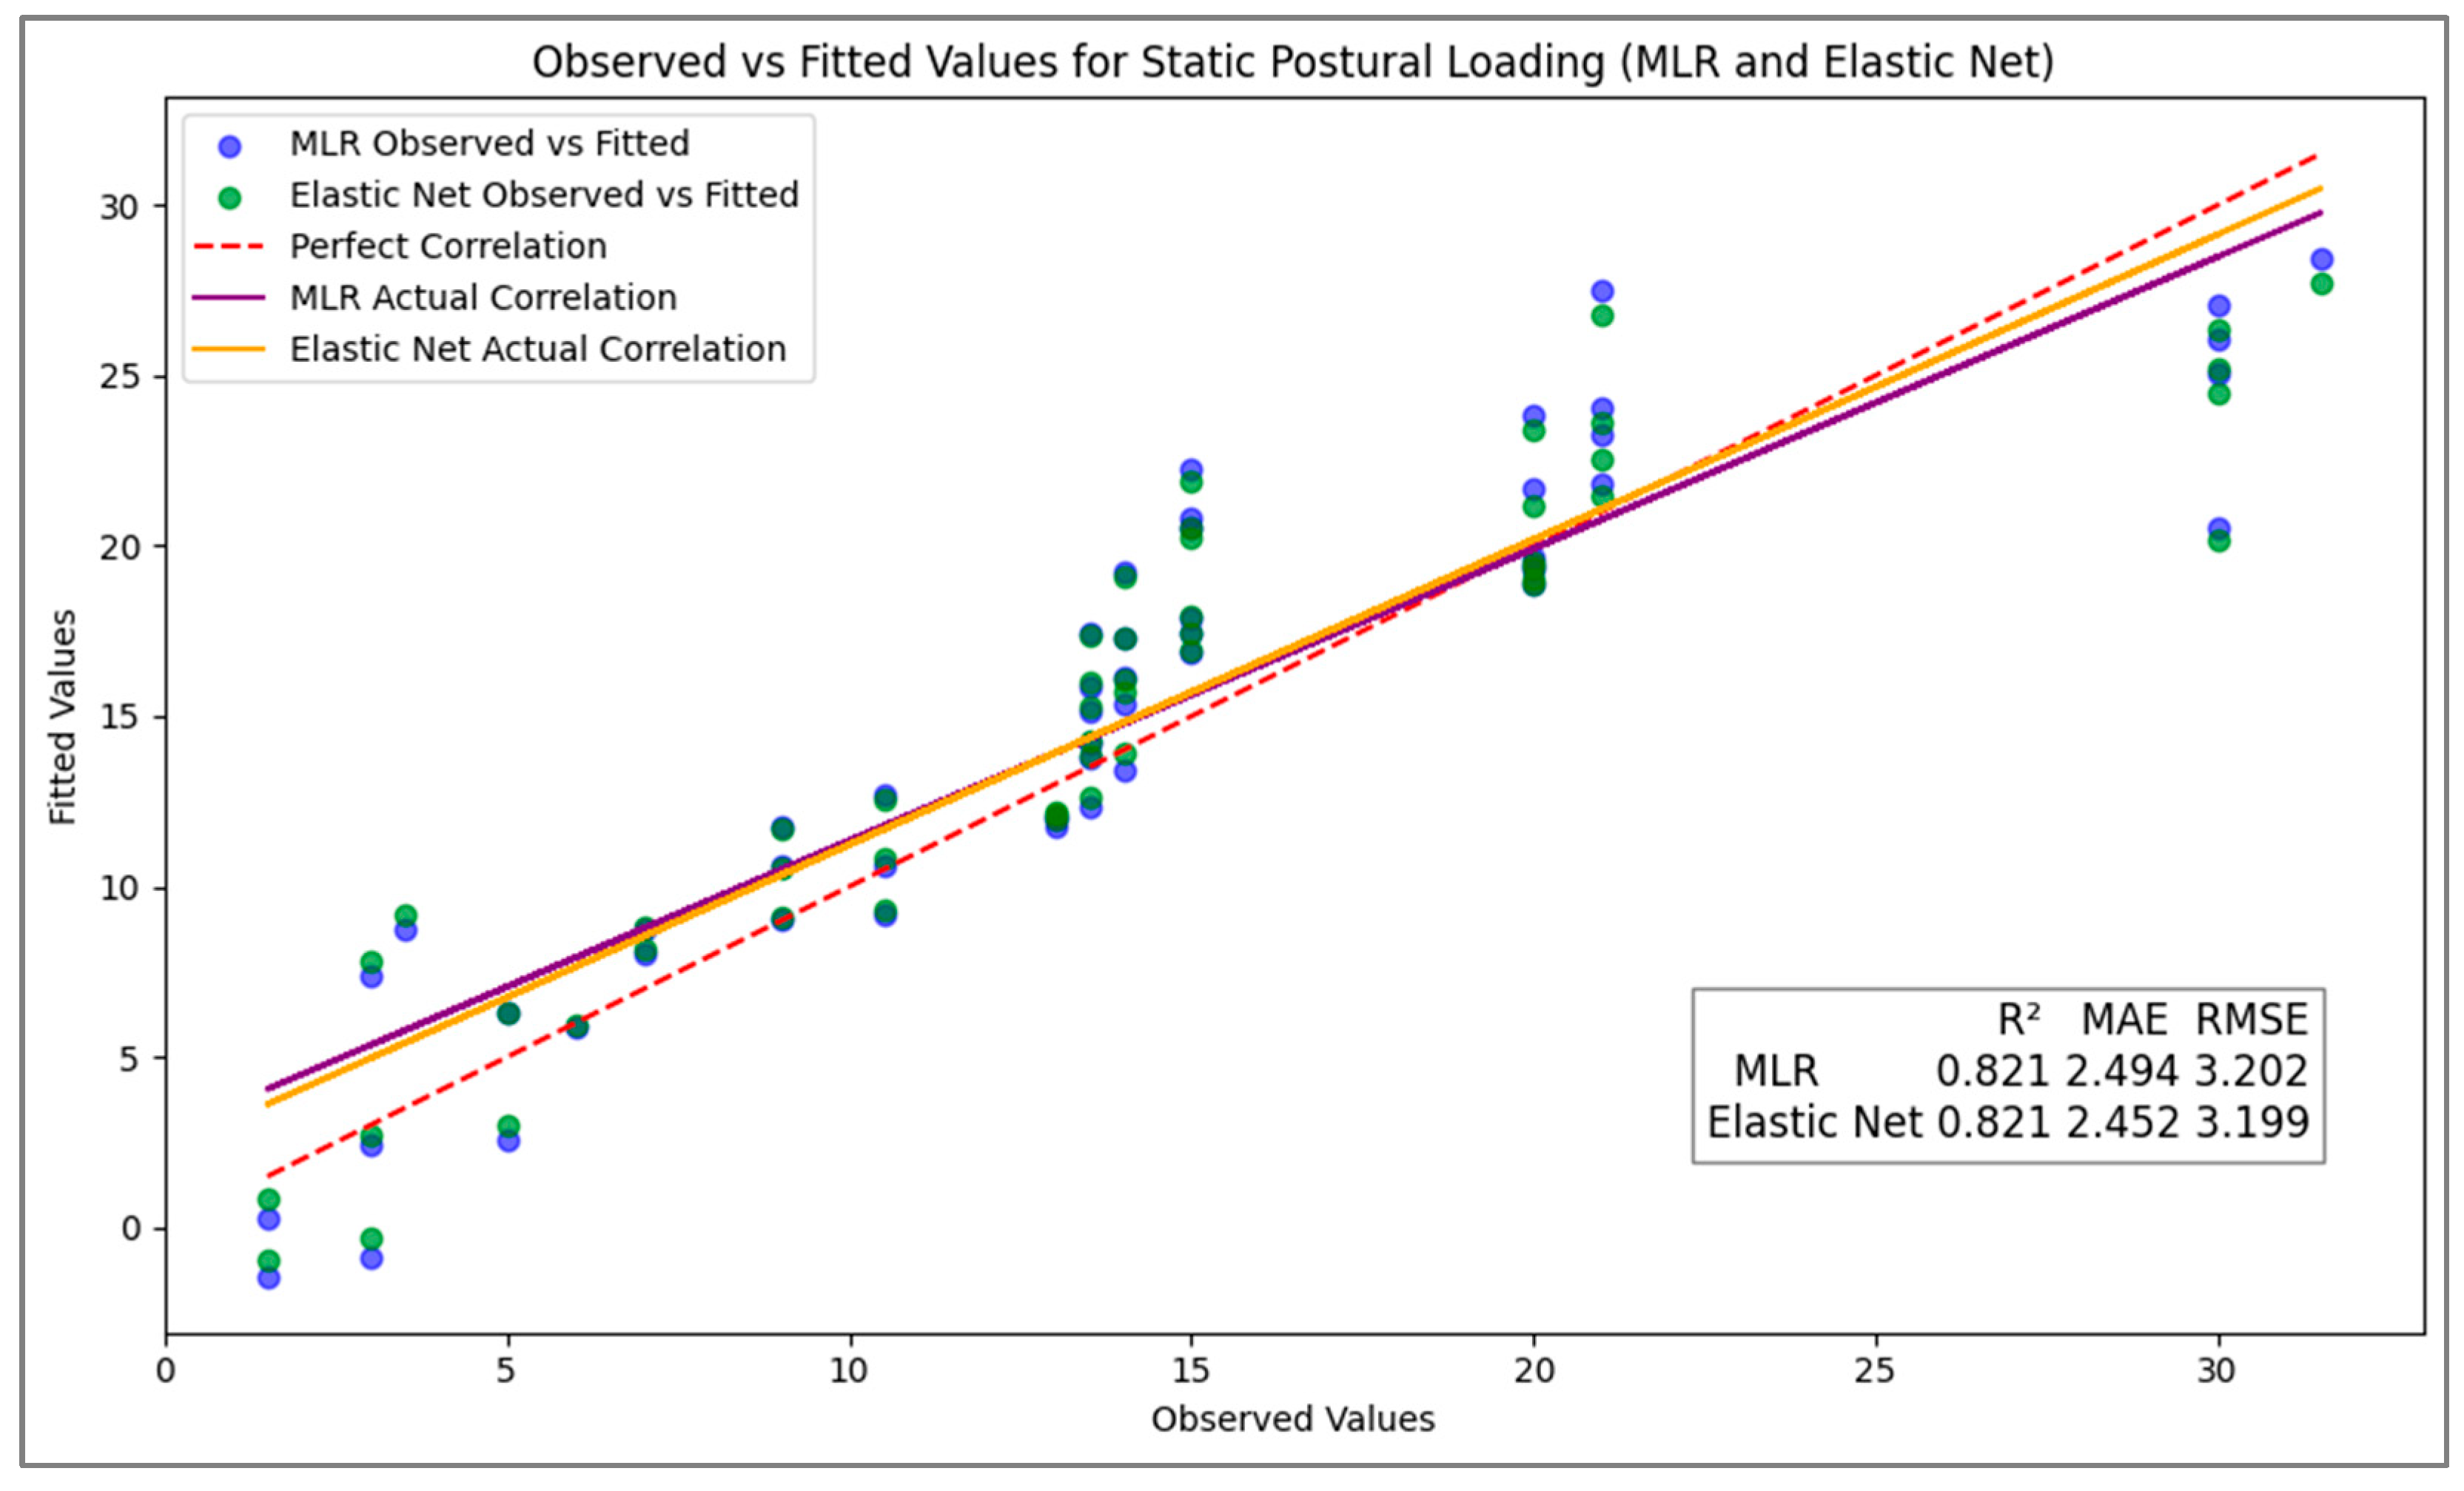
| Metric | R2 | MAE | RMSE | |||
|---|---|---|---|---|---|---|
| Train | Test | Train | Test | Train | Test | |
| MLR | 0.876 | 0.821 | 2.157 | 2.494 | 2.831 | 3.202 |
| EN | 0.875 | 0.821 | 2.118 | 2.452 | 2.851 | 3.199 |
| n = 258 (train dataset: 206, test dataset: 52) | ||||||
| MLR | EN | ||||
|---|---|---|---|---|---|
| Predictor | Importance | SD | Predictor | Importance | SD |
| Postural Risk | 0.2082 | 0.04762 | Postural Risk | 0.118199 | 0.032799 |
| BMI | 0.075443 | 0.030741 | Sedentary Behavior | 0.107396 | 0.03266 |
| Task Duration | 0.063287 | 0.024169 | BMI | 0.103434 | 0.036781 |
| Sedentary Behavior | 0.025567 | 0.017667 | Task Duration | 0.081299 | 0.025873 |
| Sitting Type— Slouched | 0.002511 | 0.001873 | Age | 0.002045 | 0.001721 |
| Gender— Male | 0.002354 | 0.000987 | Sitting Type— Leaning Forward | 0.001049 | 0.002653 |
| Gender— Female | 0.002354 | 0.000987 | Gender— Male | 0.000265 | 0.000106 |
| Age | 0.002107 | 0.001306 | Gender— Female | 0.000265 | 0.000106 |
| Sitting Type— Leaning Forward | 0.001749 | 0.005937 | Anthropometric Match—Mismatched | 0.000004 | 0.000047 |
| Musculoskeletal Health— Healthy | 0.000054 | 0.000618 | Anthropometric Match—Matched | 0.000003 | 0.000045 |
| Musculoskeletal Health— With Condition | 0.000054 | 0.000618 | Musculoskeletal Health—Healthy | 0 | 0 |
| Anthropometric Match—Mismatched | −0.000501 | 0.002352 | Musculoskeletal Health—With Condition | 0 | 0 |
| Anthropometric Match— Matched | −0.000501 | 0.002352 | Sitting Type— Slouched | 0 | 0 |
| Sitting Type— Upright | −0.001244 | 0.000808 | Sitting Type— Upright | 0 | 0 |
| Body Fat Percentage | −0.011036 | 0.006458 | Sitting Type— Slumped | −0.003859 | 0.001491 |
| Sitting Type— Slumped | −0.015018 | 0.00631 | Body Fat Percentage | −0.011674 | 0.008509 |
Disclaimer/Publisher’s Note: The statements, opinions and data contained in all publications are solely those of the individual author(s) and contributor(s) and not of MDPI and/or the editor(s). MDPI and/or the editor(s) disclaim responsibility for any injury to people or property resulting from any ideas, methods, instructions or products referred to in the content. |
© 2025 by the authors. Licensee MDPI, Basel, Switzerland. This article is an open access article distributed under the terms and conditions of the Creative Commons Attribution (CC BY) license (https://creativecommons.org/licenses/by/4.0/).
Share and Cite
Mohseni Bandpei, M.A.; Osqueizadeh, R.; Goudarzi, H.; Rahmani, N.; Ebadi, A. Predictors of Static Postural Loading in Primary-School-Aged Children: Comparing Elastic Net and Multiple Regression Methods. Children 2025, 12, 744. https://doi.org/10.3390/children12060744
Mohseni Bandpei MA, Osqueizadeh R, Goudarzi H, Rahmani N, Ebadi A. Predictors of Static Postural Loading in Primary-School-Aged Children: Comparing Elastic Net and Multiple Regression Methods. Children. 2025; 12(6):744. https://doi.org/10.3390/children12060744
Chicago/Turabian StyleMohseni Bandpei, Mohammad Ali, Reza Osqueizadeh, Hamidreza Goudarzi, Nahid Rahmani, and Abbas Ebadi. 2025. "Predictors of Static Postural Loading in Primary-School-Aged Children: Comparing Elastic Net and Multiple Regression Methods" Children 12, no. 6: 744. https://doi.org/10.3390/children12060744
APA StyleMohseni Bandpei, M. A., Osqueizadeh, R., Goudarzi, H., Rahmani, N., & Ebadi, A. (2025). Predictors of Static Postural Loading in Primary-School-Aged Children: Comparing Elastic Net and Multiple Regression Methods. Children, 12(6), 744. https://doi.org/10.3390/children12060744