

Influence of Urban and Rural Areas, Type of School, and Parents’ Education Level on Nutrition Habits and Their Relationship with Dental Caries in Schoolchildren in Mallorca


Abstract
1. Introduction
2. Materials and Methods
2.1. Study Design and Target Population
2.2. Study Variables
- Age;
- Type of school: public or subsidized/private;
- Geographic location: urban or rural;
- Education level of parents/guardians: includes the educational level of both the mother and father, categorized as elementary, secondary, or higher education.
- Frequency of food consumption: the number of times consumed per month;
- Nutrition-related attitudes and practices: an assessment of the number of meals per day, where they were eaten, and the purchase of snacks.
- Experience of caries is determined through the DMFT index in permanent teeth, where D=decayed teeth, M=missing teeth due to caries, and F=filled teeth corresponding to the unit being assessed. The analysis of caries experience uses the total sample (for children aged 5–6 years, among those who had mixed dentition, only permanent teeth were considered).
2.3. Ethical Treatment of the Data
2.4. Statistical Analysis
3. Results
3.1. Sample Description
3.2. Nutrition Habits
3.2.1. Frequency of Food Consumption
3.2.2. Meals During the Day
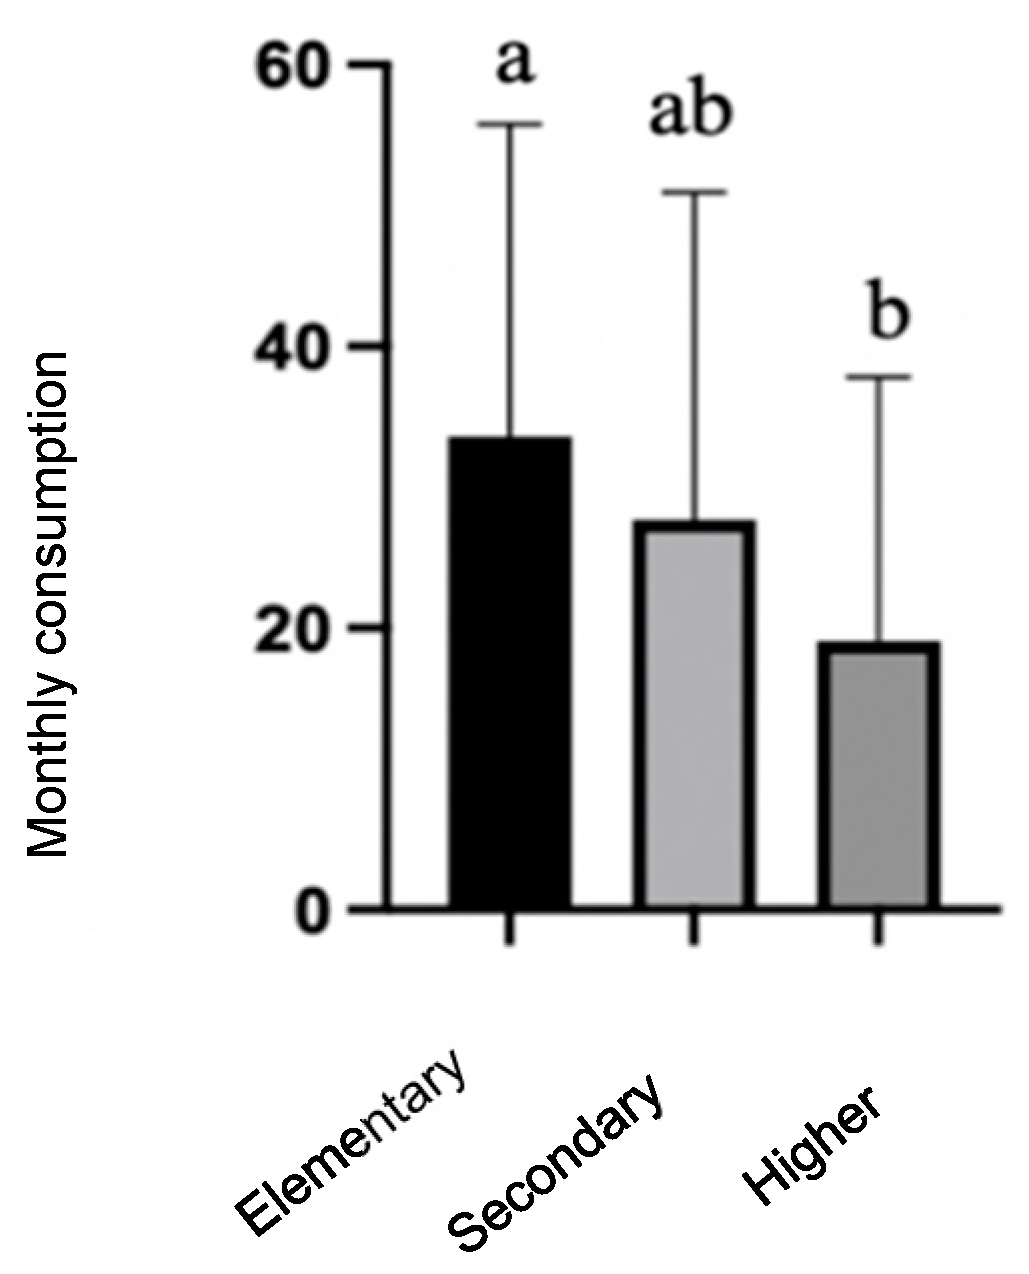
3.2.3. Parents/Guardians’ Education Levels
3.3. Effect of Nutrition Habits on the Experience of Caries in Schoolchildren
3.3.1. Consumption of Sugary Foods
3.3.2. Meals During the Day
4. Discussion
5. Conclusions
Author Contributions
Funding
Institutional Review Board Statement
Informed Consent Statement
Data Availability Statement
Conflicts of Interest
Abbreviations
| WHO | World Health Organization |
| FAO | Food and Agriculture Organization of the United Nations |
| EFSA | European Food Safety Authority |
References
- Cheikh Moussa, K.; Sanz-Valero, J.; Wanden-Berghe, C. The social determinants of health of the child-adolescent immigration and its influence on the nutritional status: Systematic review. Nutr. Hosp. 2014, 30, 1008–1019. [Google Scholar]
- Wilkinson, R.G.; Marmot, M. Los Determinantes Sociales de Salud: Los Hechos Probados; Organización Mundial de la Salud: Geneva, Switzerland, 2006. [Google Scholar]
- Rovner, A.J.; Nansel, T.R.; Wang, J.; Iannotti, R.J. Food sold in school vending machines is associated with overall student dietary intake. J. Adolesc. Health 2011, 48, 13–19. [Google Scholar] [CrossRef]
- Scaglioni, S.; De Cosmi, V.; Ciappolino, V.; Parazzini, F.; Brambilla, P.; Agostoni, C. Factors Influencing Children’s Eating Behaviours. Nutrients 2018, 10, 706. [Google Scholar] [CrossRef] [PubMed]
- Wechsler, H.; Devereaux, R.S.; Davis, M.; Collins, J. Using the school environment to promote physical activity and healthy eating. Prev. Med. 2000, 31, S121–S137. [Google Scholar] [CrossRef]
- Giacaman, R.A.; Fernández, C.E.; Muñoz-Sandoval, C.; León, S.; García-Manríquez, N.; Echeverría, C.; Valdés, S.; Castro, R.J.; Gambetta-Tessini, K. Understanding dental caries as a non-communicable and behavioral disease: Management implications. Front. Oral Health 2022, 3, 764479. [Google Scholar] [CrossRef] [PubMed]
- Khalid, T.; Mahdi, S.S.; Khawaja, M.; Allana, R.; Amenta, F. Relationship between Socioeconomic Inequalities and Oral Hygiene Indicators in Private and Public Schools in Karachi: An Observational Study. Int. J. Environ. Res. Public Health 2020, 17, 8893. [Google Scholar] [CrossRef]
- Lešić, S.; Dukić, W.; Šapro Kriste, Z.; Tomičić, V.; Kadić, S. Caries prevalence among schoolchildren in urban and rural Croatia. Cent. Eur. J. Public Health 2019, 27, 256–262. [Google Scholar] [CrossRef]
- Giacaman, R.A.; Bustos, I.P.; Bazán, P.; Mariño, R.J. Oral health disparities among adolescents from urban and rural communities of central Chile. Rural Remote Health 2018, 18, 4312. [Google Scholar] [CrossRef]
- Gorbatova, M.A.; Gorbatova, L.N.; Pastbin, M.U.; Grjibovski, A.M. Urban-rural differences in dental caries experience among 6-year-old children in the Russian north. Rural Remote Health 2012, 12, 1999. [Google Scholar] [CrossRef]
- Dagli, N.; Haque, M.; Kumar, S. A bibliometric Analysis of Literature on the Impact of Diet on Oral Health. Cureus 2024, 16, e59418. [Google Scholar] [CrossRef] [PubMed] [PubMed Central]
- Hancock, S.; Zinn, C.; Schofield, G. The consumption of processed sugar- and starch-containing foods, and dental caries: A systematic review. Eur. J. Oral Sci. 2020, 128, 467–475. [Google Scholar] [CrossRef] [PubMed]
- Moynihan, P. Sugars and dental caries: Evidence for setting a recommended threshold for intake. Adv. Nutr. 2016, 7, 149–156. [Google Scholar] [CrossRef] [PubMed]
- Mahboobi, Z.; Pakdaman, A.; Yazdani, R.; Azadbakht, L.; Montazeri, A. Dietary free sugar and dental caries in children: A systematic review on longitudinal studies. Health Promot. Perspect. 2021, 11, 271. [Google Scholar] [CrossRef]
- Gustafsson, B.E.; Quensel, C.-E.; Lanke, L.S.; Lundqvist, C.; Grahnén, H.; Bonow, B.E.; Krasse, B. The Vipeholm dental caries study. The effect of different levels of carbohydrate intake on caries activity in 436 individuals observed for five years. Acta Odontol. Scand. 1954, 11, 232–364. [Google Scholar] [CrossRef]
- König, K.; Schmid, P.; Schmid, R. An apparatus for frequency-controlled feeding of small rodents and its use in dental caries experiments. Arch. Oral Biol. 1968, 13, 13-IN7. [Google Scholar] [CrossRef]
- Coll, I.; Vallejos, D.; López-Safont, N. Differences in Physical Activity Levels, Screen Time, and Body Mass Index and Their Associations with Oral Health in Schoolchildren in Mallorca. Children 2024, 11, 1280. [Google Scholar] [CrossRef]
- Coll, I.; Vallejos, D.; Cuesta, R.; Domínguez, J.; Tomás, P.; López-Safont, N. Prevalence of Oral Diseases and the Influence of the Presence of Overweight/Obesity in Schoolchildren Population in Mallorca. J. Clin. Med. 2024, 13, 7283. [Google Scholar] [CrossRef]
- World Health Organization. Oral Health Surveys Basic Methods, 5th ed.; World Health Organization: Geneva, Switzerland, 2013; Available online: https://www.who.int/publications/i/item/9789241548649 (accessed on 15 May 2024).
- Marías, Y.F.; Glasauer, P. Guidelines for Assessing Nutrition-Related Knowledge, Attitudes and Practices; Food and Agriculture Organization of the United Nations (FAO): Rome, Italy, 2014. [Google Scholar]
- European Food Safety Authority. General principles for the collection of national food consumption data in the view of a pan-European dietary survey. EFSA J. 2009, 7, 1435. [Google Scholar] [CrossRef]
- López-Sobaler, A.M.; Aparicio, A.; González-Rodríguez, L.G.; Cuadrado-Soto, E.; Rubio, J.; Marcos, V.; Sanchidrián, R.; Santos, S.; Pérez-Farinós, N.; Dal Re, M.Á.; et al. Adequacy of Usual Vitamin and Mineral Intake in Spanish Children and Adolescents: ENALIA Study. Nutrients 2017, 9, 131. [Google Scholar] [CrossRef]
- Zarychta, K.; Mullan, B.; Luszczynska, A. It doesn’t matter what they say, it matters how they behave: Parental influences and changes in body mass among overweight and obese adolescents. Appetite 2016, 96, 47–55. [Google Scholar] [CrossRef]
- Emmett, P.M.; Jones, L.R. Diet, growth, and obesity development throughout childhood in the Avon Longitudinal Study of Parents and Children. Nutr. Rev. 2015, 73 (Suppl. S3), 175–206. [Google Scholar] [CrossRef]
- Harrison, M.E.; Norris, M.L.; Obeid, N.; Fu, M.; Weinstangel, H.; Sampson, M. Systematic review of the effects of family meal frequency on psychosocial outcomes in youth. Can. Fam. Physician 2015, 61, e96–e106. [Google Scholar] [PubMed]
- Andrino Borja, G.D.; Llaneras, K. ¿Escuela de Ricos, Escuela de Pobres? Cómo la Concertada y la Pública Segregan por Clase Social; El País: Madrid, Spain, 2019. [Google Scholar]
- Ministerio de Educación, Cultura y Deporte (MECD). PISA 2015. Programa para la Evaluación Internacional de los Alumnos. Informe Español; Secretaría de Estado de Educación, FP y Universidades, MECD: Madrid, Spain, 2016. [Google Scholar]
- Leimbigler, B.; Li, E.P.H.; Rush, K.L.; Seaton, C.L. Social, political, commercial, and corporate determinants of rural health equity in Canada: An integrated framework. Can. J. Public Health 2022, 113, 749–754. [Google Scholar] [CrossRef]
- Comisión para Reducir las Desigualdades Sociales en Salud en España. Propuesta de políticas e intervenciones para reducir las desigualdades sociales en salud en España. Gac. Sanit. 2012, 26, 182–189. [Google Scholar] [CrossRef] [PubMed]
- Doescher, M.; Keppel, G. Dentist Supply, Dental Care Utilization, and Oral Health Among Rural and Urban US Residents; WWAMI Rural Health Research Center, University of Washington: Seattle, WA, USA, 2015. [Google Scholar]
- Fink, S.K.; Racine, E.F.; Mueffelmann, R.E.; Dean, M.N.; Herman-Smith, R. Family meals and diet quality among children and adolescents in North Carolina. J. Nutr. Educ. Behav. 2014, 46, 418–422. [Google Scholar] [CrossRef]
- Wen, X.; Kong, K.L.; Eiden, R.D.; Sharma, N.N.; Xie, C. Sociodemographic differences and infant dietary patterns. Pediatrics 2014, 134, e1387–e1398. [Google Scholar] [CrossRef] [PubMed]
- Guerrero, A.D.; Chu, L.; Franke, T.; Kuo, A.A. Father involvement in feeding interactions with their young children. Am. J. Health Behav. 2016, 40, 221–230. [Google Scholar] [CrossRef] [PubMed]
- Boylan, S.; Lallukka, T.; Lahelma, E.; Pikhart, H.; Malyutina, S.; Pajak, A.; Kubinova, R.; Bragina, O.; Stepaniak, V.; Gillis-Januszewska, A.; et al. Socio-economic circumstances and food habits in Eastern, Central and Western European populations. Public Health Nutr. 2011, 14, 678–687. [Google Scholar] [CrossRef] [PubMed]
- Kim, D. Financial hardship and social assistance as determinants of mental health and food and housing insecurity during the COVID-19 pandemic in the United States. SSM-Popul. Health 2021, 16, 100862. [Google Scholar] [CrossRef]
- Darmon, N.; Drewnowski, A. Does social class predict diet quality? Am. J. Clin. Nutr. 2008, 87, 1107–1117. [Google Scholar] [CrossRef] [PubMed]
- Beydoun, M.A.; Wang, Y. Do nutrition knowledge and beliefs modify the association of socio-economic factors and diet quality among US adults? Prev. Med. 2008, 46, 145–153. [Google Scholar] [CrossRef] [PubMed]
- Pérez, M.B.; Silla, J.M.A.; Díaz, E.C.; Peidró, E.C.; Martinicorena, F.C.; Delgado, A.E.; Casas, M.T. Encuesta de salud oral en España 2020. RCOE Rev. Del Ilustre Cons. Gen. Col. Odontólogos Estomatólogos España 2020, 25, 12–69. [Google Scholar]

| First Stratum | Second Stratum | Third Stratum |
|---|---|---|
| Population Nuclei: | School Types: | Age Groups: |
|
|
|
| First-Year Elementary (5–6 Years Old) n = 255 | Sixth-Year Elementary (12 Years Old) n = 230 | Fourth-Year Secondary (15 Years Old) n = 233 | Total | ||||||
|---|---|---|---|---|---|---|---|---|---|
| n | % | n | % | n | % | n | % | ||
| Sex | Male | 144 | 56.47 | 125 | 54.35 | 112 | 48.06 | 381 | 53.06 |
| Female | 111 | 43.53 | 105 | 46.65 | 121 | 51.93 | 337 | 46.94 | |
| School type | Public | 177 | 69.4 | 159 | 69.1 | 190 | 81.5 | 526 | 73.3 |
| Subsidized/private | 78 | 30.6 | 71 | 30.9 | 43 | 18.5 | 192 | 26.7 | |
| Geographic location | Urban | 163 | 63.9 | 140 | 60.9 | 101 | 43.3 | 404 | 56.3 |
| Rural | 92 | 36.1 | 90 | 39.1 | 132 | 56.7 | 314 | 43.7 | |
| Geographic Location | n | Mean | SD | CI 95% | p-Value | School Type | n | Mean | SD | CI 95% | p-Value | |
|---|---|---|---|---|---|---|---|---|---|---|---|---|
| Pastries | Rural | 85 | 27.62 | 21.94 | (22.96–32.29) | 0.013 * | Public | 169 | 23.88 | 21.73 | (20.61–27.16) | 0.307 |
| Urban | 160 | 20.45 | 20.93 | (17.20–23.69) | Subs./priv. | 76 | 20.84 | 21.02 | (16.12–25.57) | |||
| Unknown | 10 | 10 | ||||||||||
| Potato chips | Rural | 85 | 19.84 | 15.82 | (16.47–23.20) | 0.192 | Public | 169 | 18.82 | 15.91 | (16.42–21.21) | 0.243 |
| Urban | 160 | 17.06 | 15.79 | (14.62–19.51) | Subs./priv. | 76 | 16.26 | 15.59 | (12.76–19.77) | |||
| Unknown | 10 | 10 | ||||||||||
| Sausages | Rural | 81 | 30.54 | 23.34 | (25.46–35.63) | <0.001 * | Public | 162 | 24.79 | 22.77 | (21.28–28.30) | 0.071 |
| Urban | 155 | 19.12 | 20.39 | (15.90–22.32) | Subs./priv. | 74 | 19.19 | 20.11 | (14.61–23.77) | |||
| Unknown | 19 | 19 | ||||||||||
| Sugar | Rural | 82 | 22.34 | 22.71 | (17.43–27.26) | 0.699 | Public | 160 | 24.23 | 23.94 | (20.52–27.94) | 0.290 |
| Urban | 149 | 23.58 | 23.65 | (19.79–27.38) | Subs./priv. | 71 | 20.70 | 21.69 | (15.66–25.75) | |||
| Unknown | 24 | 24 | ||||||||||
| Sugary soft drinks | Rural | 86 | 41.58 | 22.73 | (36.78–46.38) | <0.001 * | Public | 168 | 36.48 | 24.58 | (32.76–40.19) | 0.002 |
| Urban | 156 | 28.56 | 25.25 | (24.60–32.53) | Subs./priv. | 74 | 25.73 | 24.90 | (20.06–31.40) | |||
| Unknown | 13 | 13 | ||||||||||
| Commercial juices | Rural | 87 | 24.07 | 23.52 | (19.13–29.01) | 0.005 * | Public | 167 | 20.10 | 21.46 | (16.84–23.35) | 0.268 |
| Urban | 152 | 16.30 | 18.00 | (13.44–19.16) | Subs./priv. | 72 | 16.89 | 17.95 | (22.74–31.04) | |||
| Unknown | 16 | 16 | ||||||||||
| Sweets | Rural | 85 | 24.66 | 20.52 | (20.30–29.02) | 0.044 * | Public | 168 | 22.68 | 20.82 | (19.53–25.83) | 0.076 |
| Urban | 157 | 19.29 | 19.30 | (16.27–22.30) | Subs./priv. | 74 | 17.76 | 17.124 | (14.54–20.97) | |||
| Unknown | 13 | 13 | ||||||||||
| Fruits | Rural | 85 | 9.88 | 15.80 | (6.52–13.24) | 0.004 * | Public | 167 | 13.21 | 18.14 | (10.45–15.96) | 0.158 |
| Urban | 157 | 16.68 | 18.32 | (13.81–19.54 | Subs./priv. | 75 | 16.69 | 16.72 | (12.91–20.48) | |||
| Unknown | 13 | 13 | ||||||||||
| Vegetables | Rural | 86 | 14.41 | 18.30 | (10.55–18.29) | 0.176 | Public | 167 | 16.40 | 18.97 | (13.52–19.27) | 0.799 |
| Urban | 157 | 17.80 | 18.68 | (14.87–20.72) | Subs./priv. | 76 | 17.05 | 17.81 | (13.05–21.06 | |||
| Unknown | 13 | 12 |
| Geographic Location | n | Mean | SD | CI 95% | p-Value | Type of School | n | Mean | SD | CI 95% | p-Value | |
|---|---|---|---|---|---|---|---|---|---|---|---|---|
| Pastries | Rural | 88 | 29.32 | 20.21 | (25.10–33.54) | 0.008 * | Public | 157 | 22.56 | 19.13 | (19.57–25.55) | 0.017 |
| Urban | 136 | 21.76 | 20.98 | (18.24–25.29) | Subs./priv. | 67 | 29.82 | 24.13 | (24.04–35.60) | |||
| Unknown | 6 | 6 | ||||||||||
| Potato chips | Rural | 88 | 26.48 | 16.52 | (23.03–29.93) | <0.001 * | Public | 156 | 21.90 | 15.96 | (19.39–24.40) | 0.985 |
| Urban | 136 | 18.91 | 16.23 | (16.18–21.64) | Subs./priv. | 68 | 21.85 | 18.48 | (17.46–26.24) | |||
| Unknown | 6 | 6 | ||||||||||
| Sausages | Rural | 86 | 25.05 | 21.72 | (20.46–29.64) | 0.236 | Public | 155 | 22.66 | 20.54 | (19.42–25.89) | 0.740 |
| Urban | 136 | 21.65 | 20.16 | (18.26–25.04) | Subs./priv. | 67 | 23.67 | 21.50 | (18.52–28.82) | |||
| Unknown | 8 | 8 | ||||||||||
| Sugar | Rural | 86 | 19.93 | 20.01 | (15.70–24.16) | 0.688 | Public | 154 | 19.74 | 20.13 | (16.56–22.92) | 0.329 |
| Urban | 133 | 21.10 | 21.58 | (17.43–24.77) | Subs./priv. | 65 | 22.77 | 22.76 | (17.24–28.30) | |||
| Unknown | 8 | 11 | ||||||||||
| Sugary soft drinks | Rural | 88 | 32.43 | 20.72 | (28.10–36.76) | <0.001 * | Public | 155 | 25.69 | 22.03 | (22.22–29.16) | 0.743 |
| Urban | 134 | 21.79 | 21.72 | (18.11–25.47) | Subs./priv. | 67 | 26.74 | 21.77 | (21.53–31.96) | |||
| Unknown | 8 | 8 | ||||||||||
| Commercial juices | Rural | 84 | 24.67 | 21.40 | (20.09–29.24) | 0.443 | Public | 150 | 22.16 | 22.28 | (18.60–25.73) | 0.336 |
| Urban | 134 | 22.22 | 23.72 | (18.21–26.24) | Subs./priv. | 68 | 25.38 | 24.05 | (19.67–31.10) | |||
| Unknown | 8 | 12 | ||||||||||
| Sweets | Rural | 87 | 24.48 | 15.24 | (21.28–27.69) | 0.024 * | Public | 155 | 20.67 | 15.91 | (18.17–23.18) | 0.426 |
| Urban | 136 | 19.22 | 17.84 | (16.22–22.22) | Subs./priv. | 68 | 22.65 | 19.42 | (18.03–27.26) | |||
| Unknown | 7 | 7 | ||||||||||
| Fruits | Rural | 87 | 9.95 | 12.99 | (7.23–12.68) | 0.120 | Public | 156 | 12.71 | 15.73 | (10.24–15.17) | 0.269 |
| Urban | 137 | 13.23 | 16.59 | (10.45–16.00) | Subs./priv. | 68 | 10.24 | 14.37 | (6.82–13.65) | |||
| Unknown | 6 | 7 | ||||||||||
| Vegetables | Rural | 87 | 16.18 | 17.67 | (12.47–19.90) | 0.485 | Public | 152 | 14.61 | 16.26 | (12.02–17.19) | 0.413 |
| Urban | 133 | 14.59 | 15.81 | (11.90–17.27) | Subs./priv. | 68 | 16.59 | 17.22 | (12.50–20.68) | |||
| Unknown | 10 | 10 |
| Geographic Location | n | Mean | SD | CI 95% | p-Value | School Type | n | Mean | SD | CI 95% | p-Value | |
|---|---|---|---|---|---|---|---|---|---|---|---|---|
| Pastries | Rural | 130 | 22.54 | 19.13 | (19.25–25.83) | 0.854 | Public | 188 | 23.30 | 18.79 | (20.61–25.98) | 0.335 |
| Urban | 101 | 22.99 | 17.71 | (19.54–26.45) | Subs./priv. | 43 | 20.28 | 17.12 | (15.16–25.40) | |||
| Unknown | 2 | 2 | ||||||||||
| Potato chips | Rural | 131 | 28.18 | 18.28 | (25.05–31.31) | 0.005 * | Public | 189 | 26.95 | 17.77 | (24.42–29.49) | 0.004 * |
| Urban | 100 | 21.70 | 15.78 | (18.61–24.79) | Subs./priv. | 42 | 18.29 | 14.43 | (13.92–22.65) | |||
| Unknown | 2 | 2 | ||||||||||
| Sausages | Rural | 130 | 26.34 | 21.77 | (22.60–30.08) | 0.011 * | Public | 188 | 25.55 | 21.67 | (22.46–28.65) | <0.001 * |
| Urban | 101 | 19.21 | 19.84 | (15.34–23.078) | Subs./priv. | 43 | 13.02 | 15.51 | (8.39–17.66) | |||
| Unknown | 2 | 2 | ||||||||||
| Sugar | Rural | 129 | 17.47 | 19.13 | (14.17–20.77) | 0.637 | Public | 186 | 17.63 | 18.96 | (14.91–20.36) | 0.247 |
| Urban | 98 | 16.31 | 17.46 | (12.85–19.76) | Subs./priv. | 41 | 13.95 | 15.45 | (9.22–18.68) | |||
| Unknown | 6 | 6 | ||||||||||
| Sugary soft drinks | Rural | 130 | 29.80 | 22.35 | (25.96–33.64) | 0.236 | Public | 187 | 29.51 | 22.46 | (26.29–32.73) | 0.077 |
| Urban | 99 | 26.26 | 22.31 | (21.87–30.66) | Subs./priv. | 42 | 22.76 | 21.28 | (16.33–29.20) | |||
| Unknown | 4 | 4 | ||||||||||
| Commercial juices | Rural | 128 | 29.92 | 21.31 | (26.23–33.61) | 0.179 | Public | 185 | 29.54 | 22.08 | (26.35–32.72) | 0.049 * |
| Urban | 97 | 25.86 | 23.77 | (21.13–30.59) | Subs./priv. | 40 | 21.85 | 23.31 | (14.63–29.07) | |||
| Unknown | 8 | 5 | ||||||||||
| Sweets | Rural | 129 | 26.16 | 19.51 | (22.79–29.52) | 0.460 | Public | 186 | 26.18 | 19.13 | (23.43–28.93) | 0.153 |
| Urban | 97 | 24.23 | 19.22 | (20.40–28.05) | Subs./priv. | 40 | 21.35 | 20.20 | (15.09–27.61) | |||
| Unknown | 9 | 7 | ||||||||||
| Fruits | Rural | 130 | 9.80 | 13.32 | (7.51–12.09) | 0.242 | Public | 187 | 10.11 | 13.22 | (8.21–12.00) | 0.146 |
| Urban | 99 | 11.98 | 14.71 | (9.08–14.88) | Subs./priv. | 42 | 13.57 | 16.72 | (8.52–18.63) | |||
| Unknown | 4 | 4 | ||||||||||
| Vegetables | Rural | 130 | 14.00 | 16.26 | (11.20–16.80) | 0.840 | Public | 188 | 13.87 | 16.26 | (11.55–16.20) | 0.912 |
| Urban | 101 | 13.58 | 14.50 | (10.76–16.41) | Subs./priv. | 43 | 13.58 | 11.63 | (10.11–17.06) | |||
| Unknown | 2 | 2 |
| Breakfast | Place | ||||||
|---|---|---|---|---|---|---|---|
| 5–6 Years | Yes | No | p-Value (Chi-Square) | Home | School | Other | p-Value (Chi-Square) |
| Rural | 79 (94%) | 5 (6%) | 0.434 | 74 (93.7%) | 3 (3.8%) | 1 (1.3%) | 0.043 * |
| Urban | 154 (95.1%) | 6 (3.7%) | 152 (99.3%) | 0 | 1 (0.7%) | ||
| Unknown | 11 | 24 | |||||
| Public | 159 (95%) | 7 (5%) | 0.590 | 154 (96.3%) | 3 (1.9%) | 3 (1.9%) | 0.428 |
| Subs./priv. | 74 (95%) | 4 (5%) | 72 (100%) | 0 | 0 | ||
| Unknown | 11 | 23 | |||||
| 12 years | |||||||
| Rural | 76 (90.5%) | 8 (9.5%) | 0.145 | 74 (97.4%) | 1 (1.3%) | 1 (1.3%) | 0.826 |
| Urban | 132 (95.7%) | 5 (3.6%) | 130 (97%) | 1 (0.7%) | 3 (2.2%) | ||
| Unknown | 9 | 20 | |||||
| Public | 144 (94.7%) | 7 (4.6%) | 0.406 | 141 (97.2%) | 1 (0.7%) | 3 (2.1%) | 0.816 |
| Subs./priv. | 64 (91.4%) | 6 (8.6%) | 63 (96.9%) | 1 (1.5%) | 1 (1.5%) | ||
| Unknown | 9 | 20 | |||||
| 15 years | |||||||
| Rural | 109 (83.8%) | 19 (14.6%) | 0.453 | 104 (96.3%) | 3 (2.8%) | 1 (0.9%) | 0.147 |
| Urban | 86 (86%) | 14 (14%) | 79 (91.9%) | 3 (2.3%) | 5 (5.8%) | ||
| Unknown | 5 | 38 | |||||
| Public | 154 (82.4%) | 31 (16.6%) | 0.099 | 144 (94.1%) | 4 (2.6%) | 5 (3.3%) | 0.961 |
| Subs./priv. | 41 (95.3%) | 2 (4.7%) | 39 (95.1%) | 1 (2.4%) | 1 (2.4%) | ||
| Unknown | 5 | 39 | |||||
| Lunch | Place | ||||||
|---|---|---|---|---|---|---|---|
| 5–6 Years | Yes | No | p-Value (Chi-Square) | Home | School | Other | p-Value (Chi-Square) |
| Rural | 73 (90.1%) | 4 (4.9%) | 0.533 | 73 (90.1%) | 2 (2.5%) | 6 (7.4%) | 0.037 * |
| Urban | 139 (90.3%) | 4 (2.6%) | 114 (77.6%) | 16 (10.9%) | 17 (11.6%) | ||
| Unknown | 35 | 27 | |||||
| Public | 148 (96.1%) | 6 (3.9%) | 0.383 | 134 (85.9%) | 8 (5.1%) | 14 (9%) | 0.043 * |
| Subs./priv. | 64 (96.9%) | 2 (3.1%) | 53 (73.6%) | 10 (13.9%) | 9 (12.5%) | ||
| Unknown | 35 | 27 | |||||
| 12 years | |||||||
| Rural | 69 (86.3%) | 7 (8.8%) | 0.010 * | 62 (78.5%) | 8 (10.1%) | 9 (11.4%) | 0.932 |
| Urban | 132 (97.1%) | 2 (1.5%) | 105 (78.4%) | 12 (9%) | 17 (12.7%) | ||
| Unknown | 20 | 17 | |||||
| Public | 138 (93.9%) | 5 (3.4%) | 0.710 | 119 (81.5%) | 9 (6.2%) | 18 (12.3%) | 0.057 |
| Subs./priv. | 63 (91.3%) | 4 (5.8%) | 48 (71.6%) | 11 (16.4%) | 8 (11.9%) | ||
| Unknown | 20 | 17 | |||||
| 15 years | |||||||
| Rural | 114 (91.2%) | 7 (5.6%) | 0.201 | 88 (74.6%) | 6 (5.1%) | 24 (20.3%) | 0.127 |
| Urban | 97 (97%) | 2 (2%) | 73 (75.3%) | 11 (11.3%) | 13 (13.4%) | ||
| Unknown | 13 | 18 | |||||
| Public | 173 (95.1%) | 5 (2.7%) | 0.142 | 126 (71.6%) | 15 (8.5%) | 35 (19.9%) | 0.052 |
| Subs./priv. | 38 (88.4%) | 4 (9.3%) | 35 (89.7%) | 2 (5.1%) | 2 (5.1%) | ||
| Unknown | 13 | 18 | |||||
| Dinner | Place | |||||
|---|---|---|---|---|---|---|
| 5–6 Years | Yes | No | p-Value (Chi-Square) | Home | Other | p-Value (Chi-Square) |
| Rural | 74 (90.2%) | 4 (4.9%) | 0.566 | 72 (94.7%) | 4 (5.3%) | 0.086 |
| Urban | 149 (93.7%) | 4 (2.5%) | 146 (98.6%) | 2 (1.4%) | ||
| Unknown | 24 | 31 | ||||
| Public | 152 (92.1%) | 7 (4.2%) | 0.430 | 148 (96.7%) | 5 (3.3%) | 0.423 |
| Subs./priv. | 71 (93.4%) | 1 (1.3%) | 70 (98.6%) | 1 (1.4%) | ||
| Unknown | 24 | 31 | ||||
| 12 years | ||||||
| Rural | 79 (98.8%) | 1 (1.3%) | 0.392 | 79 (100%) | 0 | 0.115 |
| Urban | 129 (95.6%) | 4 (3%) | 126 (96.9%) | 4 (3.1%) | ||
| Unknown | 17 | 21 | ||||
| Public | 142 (96.6%) | 4 (2.7%) | 0.731 | 141 (91.3%) | 1 (1.7%) | 0.063 |
| Subs./priv. | 66 (97.1%) | 1 (1.5%) | 64 (95.5%) | 3 (4.5%) | ||
| Unknown | 17 | 21 | ||||
| 15 years | ||||||
| Rural | 120 (93%) | 9 (7%) | 0.180 | 115 (98.3%) | 2 (1.7%) | 0.674 |
| Urban | 97 (97%) | 3 (3%) | 96 (99%) | 1 (1%) | ||
| Unknown | 4 | 19 | ||||
| Public | 176 (94.6%) | 10 (5.4%) | 0.847 | 172 (98.9%) | 2 (1.1%) | 0.512 |
| Subs./priv. | 41 (95.3%) | 2 (4.7%) | 39 (97.5%) | 1 (2.5%) | ||
| Unknown | 4 | 19 | ||||
| OR | CI (95%) | p-Value | |
|---|---|---|---|
| Sweets | 1.757 | 1.07–2.98 | 0.035 * |
| Commercial juices | 1.316 | 0.87–2.08 | 0.197 |
| Pastries | 1.095 | 0.69–1.73 | 0.699 |
| Sugary soft drinks | 1.039 | 0.67–1.62 | 0.867 |
| Potato chips | 1.374 | 0.79–2.38 | 0.256 |
| Sausages | 1.185 | 0.75–1.88 | 0.472 |
| Sugar | 0.890 | 0.61–1.30 | 0.545 |
| Fruit | 0.857 | 0.61–1.21 | 0.383 |
| Vegetables | 1.001 | 0.67–1.50 | 0.997 |
| Experience of Caries | Yes | No | p-Value (Chi-Square) | Home | School | Other | p-Value (Chi-Square) |
| Breakfast | |||||||
| No experience of caries | 479 (93.6%) | 33 (6.4%) | 0.004 * | 463 (96.9%) | 6 (1.3%) | 8 (1.3%) | 0.558 |
| Experience of caries | 157 (86.7%) | 24 (13.3%) | 150 (94.9%) | 4 (2.5%) | 0 | ||
| Unknown | 25 | 87 | |||||
| Lunch | |||||||
| No experience of caries | 452 (96%) | 19 (4%) | 0.943 | 383 (79.5%) | 46 (9.5%) | 53 (11%) | 0.009 * |
| Experience of caries | 172 (96.1%) | 7 (3.9%) | 132 (75.9%) | 9 (5.2%) | 33 (19%) | ||
| Unknown | 68 | 62 | |||||
| Dinner | |||||||
| No experience of caries | 480 (97.6%) | 12 (2.4%) | 0.004 * | 472 (98.3%) | - | 8 (1.7%) | 0.292 |
| Experience of caries | 168 (92.8%) | 13 (7.2%) | 162 (97%) | - | 5 (3%) | ||
| Unknown | 45 | 71 | |||||
Disclaimer/Publisher’s Note: The statements, opinions and data contained in all publications are solely those of the individual author(s) and contributor(s) and not of MDPI and/or the editor(s). MDPI and/or the editor(s) disclaim responsibility for any injury to people or property resulting from any ideas, methods, instructions or products referred to in the content. |
© 2025 by the authors. Licensee MDPI, Basel, Switzerland. This article is an open access article distributed under the terms and conditions of the Creative Commons Attribution (CC BY) license (https://creativecommons.org/licenses/by/4.0/).
Share and Cite
Vallejos, D.; Coll, I.; López-Safont, N. Influence of Urban and Rural Areas, Type of School, and Parents’ Education Level on Nutrition Habits and Their Relationship with Dental Caries in Schoolchildren in Mallorca. Children 2025, 12, 383. https://doi.org/10.3390/children12030383
Vallejos D, Coll I, López-Safont N. Influence of Urban and Rural Areas, Type of School, and Parents’ Education Level on Nutrition Habits and Their Relationship with Dental Caries in Schoolchildren in Mallorca. Children. 2025; 12(3):383. https://doi.org/10.3390/children12030383
Chicago/Turabian StyleVallejos, Daniela, Irene Coll, and Nora López-Safont. 2025. "Influence of Urban and Rural Areas, Type of School, and Parents’ Education Level on Nutrition Habits and Their Relationship with Dental Caries in Schoolchildren in Mallorca" Children 12, no. 3: 383. https://doi.org/10.3390/children12030383
APA StyleVallejos, D., Coll, I., & López-Safont, N. (2025). Influence of Urban and Rural Areas, Type of School, and Parents’ Education Level on Nutrition Habits and Their Relationship with Dental Caries in Schoolchildren in Mallorca. Children, 12(3), 383. https://doi.org/10.3390/children12030383