
Factors Predicting In-School and Electronic Bullying among High School Students in the United States: An Analysis of the 2021 Youth Risk Behavior Surveillance System

 ,
,  ,
,  , and
, and
Abstract
1. Introduction
2. Materials and Methods
2.1. Data Source
2.2. Variables
2.3. Analysis
3. Results
3.1. Cyberbullying Model
3.2. In-School Bullying
4. Discussion
5. Conclusions
Author Contributions
Funding
Institutional Review Board Statement
Informed Consent Statement
Data Availability Statement
Conflicts of Interest
References
- Labella, M.H.; Klein, N.D.; Yeboah, G.; Bailey, C.; Doane, A.N.; Kaminer, D.; Bravo, A.J. Cross-Cultural Addictions Study Team. Childhood bullying victimization, emotion regulation, rumination, distress tolerance, and depressive symptoms: A cross-national examination among young adults in seven countries. Aggress. Behav. 2024, 50, e22111. [Google Scholar] [CrossRef] [PubMed]
- U.S. Department of Health and Human Services. Consequences of Bullying. Available online: https://www.stopbullying.gov/resources/research-resources/consequences-of-bullying (accessed on 10 April 2023).
- Centers for Disease Control and Prevention. Preventing Bullying. Available online: https://www.cdc.gov/violenceprevention/pdf/yv/Bullying-factsheet_508_1.pdf (accessed on 17 June 2023).
- Voisin, D.R.; Takahashi, L.; Miller, D.B.; Hong, J.S. Bullying victimization and perpetration: Some answers and more questions. J. Pediatr. 2023, 99, 309–311. [Google Scholar] [CrossRef] [PubMed]
- Cuba Bustinza, C.; Adams, R.E.; Claussen, A.H.; Vitucci, D.; Danielson, M.L.; Holbrook, J.R.; Charania, S.N.; Yamamoto, K.; Nidey, N.; Froehlich, T.E. Factors Associated with Bullying Victimization and Bullying Perpetration in Children and Adolescents With ADHD: 2016 to 2017 National Survey of Children’s Health. J. Atten. Disord. 2022, 26, 1535–1548. [Google Scholar] [CrossRef] [PubMed]
- Cosma, A.; Bjereld, Y.; Elgar, F.J.; Richardson, C.; Bilz, L.; Craig, W.; Augustine, L.; Molcho, M.; Malinowska-Cieślik, M.; Walsh, S.D. Gender Differences in Bullying Reflect Societal Gender Inequality: A Multilevel Study with Adolescents in 46 Countries. J. Adolesc. Health 2022, 71, 601–608. [Google Scholar] [CrossRef] [PubMed]
- Yin, H.; Han, Z.; Li, Y. Traditional bullying, cyberbullying, and quality of life among adolescents in 35 countries: Do cultural values matter? Soc. Sci. Med. 2024, 340, 116499. [Google Scholar] [CrossRef] [PubMed]
- Rostam-Abadi, Y.; Stefanovics, E.A.; Zhai, Z.W.; Potenza, M.N. An exploratory study of the prevalence and adverse associations of in-school traditional bullying and cyberbullying among adolescents in Connecticut. J. Psychiatr. Res. 2024, 173, 372–380. [Google Scholar] [CrossRef]
- Hornor, G. Online Sexual Solicitation of Children and Adolescents. J. Pediatr. Health Care 2020, 34, 610–618. [Google Scholar] [CrossRef] [PubMed]
- Stewart, S.L.; Withers, A.; Graham, A.A.; Poss, J. Identifying Factors Associated with Bullying Roles Using the interRAI Child and Youth Mental Health (ChYMH) Suite of Instruments. Child Psychiatry Hum. Dev. 2024. [Google Scholar] [CrossRef]
- National Center for Education Statistics (NCES). Students Reports of Bullying: Results from the 2017 School Crime Supplement to the National Crime Victimization Survey. Available online: https://nces.ed.gov/pubs2019/2019054.pdf (accessed on 9 September 2023).
- Ang, R.P. Bullying Among Children and Youth in the Digital Age. In Child Safety, Welfare and Well-being; Deb, S., Ed.; Springer: Singapore, 2022. [Google Scholar] [CrossRef]
- Fu, R.; Perepezko, A.L.; Waasdorp, T.E.; Bradshaw, C.P. Race-based bullying victimization and adjustment difficulties: Racial-ethnic differences in the protective role of school equity. Int. J. Bullying Prev. 2023, 5, 245–260. [Google Scholar] [CrossRef]
- Chuang, Y.R.; Huang, F.; Herman, K.; Zhang, B. Potential Moderation Across Racial Groups in Perceptions of Authoritative School Climate and Peer Victimization and Student Engagement. Sch. Psychol. Rev. 2022, 1–17. [Google Scholar] [CrossRef]
- Iyanda, A.E. Bullying Victimization of Children with Mental, Emotional, and Developmental or Behavioral (MEDB) Disorders in the United States. J. Child. Adolesc. Trauma. 2021, 15, 221–233. [Google Scholar] [CrossRef] [PubMed] [PubMed Central]
- YaleNews. Adolescents Report Weight as the Primary Reason for Bullying at School. Available online: https://news.yale.edu/2011/11/09/adolescents-report-weight-primary-reason-bullying-school (accessed on 3 January 2022).
- Morales, D.X.; Grineski, S.E.; Collins, T.W. School bullying, body size, and gender: An intersectionality approach to understanding US children’s bullying victimization. Br. J. Sociol. Educ. 2019, 40, 1121–1137. [Google Scholar] [CrossRef] [PubMed]
- Wang, C.; Li, Y.; Li, K.; Seo, D.C. Body weight and bullying victimization among US adolescents. Am. J. Health Behav. 2018, 42, 3–12. [Google Scholar] [CrossRef] [PubMed]
- Waseem, M.; Amanda, B.N. Bullying: Issues and challenges in prevention and intervention. Current Psychology 2024, 43, 9270–9279. [Google Scholar] [CrossRef]
- American Academy of Child and Adolescent Psychiatry (AACAP). Screen Time and Children. Available online: https://www.aacap.org/AACAP/Families_and_Youth/Facts_for_Families/FFF-Guide/Children-And-Watching-TV-054.aspx (accessed on 2 November 2023).
- Rojo-Wissar, D.M.; Acosta, J.; DiMarzio, K.; Hare, M.; Dale, C.F.; Sanders, W.; Parent, J.M. The role of sleep in prospective associations between parent-reported youth screen media activity and behavioral health. Child. Adolesc. Ment. Health 2024, 29, 33–42. [Google Scholar] [CrossRef] [PubMed]
- Zhu, M.Q.; Oliveros, H.; Marín, C.; Mora-Plazas, M.; Villamor, E. Middle childhood and adolescence sleep duration and behavior problems in adolescence. Dev. Psychopathol. 2024, 36, 338–348. [Google Scholar] [CrossRef] [PubMed]
- Hu, X.; Drenowatz, C.; Duncan, M.; Bao, R.; Chen, S.; He, J.; Tang, Y. Physical education, muscle strengthening exercise, sport participation and their associations with screen time in adolescents. Front. Public Health 2023, 11, 1100958. [Google Scholar] [CrossRef] [PubMed]
- Fan, H.; Yan, J.; Yang, Z.; Liang, K.; Chen, S. Cross-sectional associations between screen time and the selected lifestyle behaviors in adolescents. Front. Public Health 2022, 10, 932017. [Google Scholar] [CrossRef] [PubMed]
- Wallace, J.; Boers, E.; Ouellet, J.; Conrod, P. A population-based analysis of the temporal association of screen time and aggressive behaviors in adolescents. JAACAP Open 2023, 1, 284–294. [Google Scholar] [CrossRef]
- Khan, A.; Lee, E.Y.; Horwood, S. Adolescent screen time: Associations with school stress and school satisfaction across 38 countries. Eur. J. Pediatr. 2022, 181, 2273–2281. [Google Scholar] [CrossRef]
- Méndez, I.; Ruiz-Esteban, C.; Ortega, E. Impact of the Physical Activity on Bullying. Front. Psychol. 2019, 10, 1520. [Google Scholar] [CrossRef] [PubMed]
- García-Hermoso, A.; Hormazabal-Aguayo, I.; Oriol-Granado, X.; Fernández-Vergara, O.; Del Pozo Cruz, B. Bullying victimization, physical inactivity and sedentary behavior among children and adolescents: A meta-analysis. Int. J. Behav. Nutr. Phys. Act. 2020, 17, 114. [Google Scholar] [CrossRef] [PubMed]
- American Academy of Child and Adolescent Psychiatry (AACAP). Marijuana and Teens. Available online: https://www.aacap.org/AACAP/Families_and_Youth/Facts_for_Families/FFF-Guide/Marijuana-and-Teens-106.aspx (accessed on 6 February 2024).
- Schaefer, J.D.; Hamdi, N.R.; Malone, S.M.; Vrieze, S.; Wilson, S.; McGue, M.; Iacono, W.G. Associations between adolescent cannabis use and young-adult functioning in three longitudinal twin studies. Proc. Natl. Acad. Sci. USA 2021, 118, e2013180118. [Google Scholar] [CrossRef] [PubMed]
- Sampasa-Kanyinga, H.; Bakwa-Kanyinga, F.; Hamilton, H.A.; Chaput, J.P. Cyberbullying involvement, parental support, and cannabis use among adolescents. Child. Abuse Negl. 2022, 133, 105830. [Google Scholar] [CrossRef] [PubMed]
- Jack, R.; Oster, E. COVID-19, School Closures, and Outcomes. J. Econ. Perspect. 2023, 37, 51–70. [Google Scholar] [CrossRef]
- Forsberg, J.T.; Thorvaldsen, S. The severe impact of the COVID-19 pandemic on bullying victimization, mental health indicators and quality of life. Sci. Rep. 2022, 12, 22634. [Google Scholar] [CrossRef] [PubMed]
- Armitage, R. Bullying during COVID-19: The impact on child and adolescent health. Br. J. Gen. Pract. 2021, 71, 122. [Google Scholar] [CrossRef] [PubMed]
- Vaillancourt, T.; Brittain, H.; Krygsman, A.; Farrell, A.H.; Landon, S.; Pepler, D. School bullying before and during COVID-19: Results from a population-based randomized design. Aggress. Behav. 2021, 47, 557–569. [Google Scholar] [CrossRef] [PubMed]
- Shin, S.Y.; Choi, Y.J. Comparison of Cyberbullying before and after the COVID-19 Pandemic in Korea. Int. J. Environ. Res. Public Health 2021, 18, 10085. [Google Scholar] [CrossRef] [PubMed]
- Da, Q.; Huang, J.; Peng, Z.; Chen, Y.; Li, L. Did the prevalence of traditional school bullying increase after COVID-19? Evidence from a two-stage cross-sectional study before and during COVID-19 pandemic. Child. Abuse Negl. 2023, 143, 106256. [Google Scholar] [CrossRef]
- Centers for Disease Control and Prevention (CDC). Youth Risk Behavior Surveillance System (YRBSS). Available online: https://www.cdc.gov/healthyyouth/data/yrbs/index.htm (accessed on 6 February 2024).
- Thornton, E.; Panayiotou, M.; Humphrey, N. Prevalence, Inequalities, and Impact of Bullying in Adolescence: Insights from the #BeeWell Study. Int. J. Bullying Prev. 2024. [Google Scholar] [CrossRef]
- Peng, Z.; Li, L.; Su, X.; Lu, Y. A pilot intervention study on bullying prevention among junior high school students in Shantou, China. BMC Public Health 2022, 22, 262. [Google Scholar] [CrossRef]
- Alrajeh, S.M.; Hassan, H.M.; Al-Ahmed, A.S.; Alsayed Hassan, D. An investigation of the relationship between cyberbullying, cyber-victimization and depression symptoms: A cross-sectional study among university students in Qatar. PLoS ONE 2021, 16, e0260263. [Google Scholar] [CrossRef]
- López-Castro, L.; Smith, P.K.; Robinson, S.; Görzig, A. Age differences in bullying victimisation and perpetration: Evidence from cross-cultural surveys. Aggress. Violent Behav. 2023, 73, 101888. [Google Scholar] [CrossRef]
- Kilicaslan, F.; Beyazgul, B.; Kuzan, R.; Karadag, D.; Koruk, F.; Koruk, I. The prevalence of peer bullying and psychiatric symptoms among high school students in southeast Turkey. Nord. J. Psychiatry 2023, 77, 83–90. [Google Scholar] [CrossRef] [PubMed]
- Craig, W.; Boniel-Nissim, M.; King, N.; Walsh, S.D.; Boer, M.; Donnelly, P.D.; Harel-Fisch, Y.; Malinowska-Cieślik, M.; Gaspar de Matos, M.; Cosma, A.; et al. Social Media Use and Cyber-Bullying: A Cross-National Analysis of Young People in 42 Countries. J. Adolesc. Health 2020, 66, S100–S108. [Google Scholar] [CrossRef] [PubMed]
- Webb, L.; Clary, L.K.; Johnson, R.M.; Mendelson, T. Electronic and School Bullying Victimization by Race/Ethnicity and Sexual Minority Status in a Nationally Representative Adolescent Sample. J. Adolesc. Health 2021, 68, 378–384. [Google Scholar] [CrossRef] [PubMed]
- Centers for Disease Control and Prevention. Youth Risk Behavior Survey Data Summary & Trends Report 2009–2019. Available online: https://www.cdc.gov/healthyyouth/data/yrbs/pdf/YRBSDataSummaryTrendsReport2019-508.pdf (accessed on 13 April 2024).
- Roberts, K.J.; Chaves, E. Beyond binge eating: The impact of implicit biases in healthcare on youth with disordered eating and obesity. Nutrients 2023, 15, 1861. [Google Scholar] [CrossRef] [PubMed]
- Lawrence, S.E.; Watson, R.J.; Eadeh, H.M.; Brown, C.; Puhl, R.M.; Eisenberg, M.E. Bias-based bullying, self-esteem, queer identity pride, and disordered eating behaviors among sexually and gender diverse adolescents. Int. J. Eat. Disord. 2024, 57, 303–315. [Google Scholar] [CrossRef]
- Espinoza, S.M.; Martin, C.L.; Eisenberg, M.E.; Borowsky, I.W.; McMorris, B.J.; Hooper, L. Internal and social assets, weight-based bullying, sport, and activity among female adolescents. Women Sport Phys. Act. J. 2023, 31, 82–91. [Google Scholar] [CrossRef]
- Priesman, E.; Newman, R.; Ford, J.A. Bullying victimization, binge drinking, and marijuana use among adolescents: Results from the 2013 National Youth Risk Behavior Survey. J. Psychoactive Drugs 2018, 50, 133–142. [Google Scholar] [CrossRef] [PubMed]
- Hakim, E.A.; McDonald, K.L.; Lochman, J.E.; Powell, N.; Witte, T.H.; Vernberg, E.M. Youth Aggression and Peer Victimization as Predictors of Adolescent Alcohol and Marijuana Use: A Longitudinal Analysis of Youth with Aggressive Behavior Problems. Res. Child. Adolesc. Psychopathol. 2024, 52, 877–889. [Google Scholar] [CrossRef] [PubMed]
- Mereish, E.H.; Cox, D.J.; Goldbach, J.T. Heterosexist Bullying Victimization and Perpetration and Substance Use Among Heterosexual Adolescents. Int. J. Behav. Med. 2023, 30, 431–437. [Google Scholar] [CrossRef]
- Nikolopoulou, G.B.; Maltezou, H.C. COVID-19 in Children: Where do we Stand? Arch. Med. Res. 2022, 53, 1–8. [Google Scholar] [CrossRef] [PubMed]
- Tong, H.L.; Maher, C.; Parker, K.; Pham, T.D.; Neves, A.L.; Riordan, B.; Chow, C.K.; Laranjo, L.; Quiroz, J.C. The use of mobile apps and fitness trackers to promote healthy behaviors during COVID-19: A cross-sectional survey. PLoS Digit. Health 2022, 1, e0000087. [Google Scholar] [CrossRef] [PubMed]
- Benítez-Sillero, J.D.; Murillo-Moraño, J.; Corredor-Corredor, D.; Morente-Montero, Á.; Branquinho, L.; Armada-Crespo, J.M. Relationship between Bullying and the Type of Physical Activity Practised by Spanish Pre- and Adolescents. Children 2023, 10, 1888. [Google Scholar] [CrossRef] [PubMed]
- Li, C.; Wang, P.; Martin-Moratinos, M.; Bella-Fernández, M.; Blasco-Fontecilla, H. Traditional bullying and cyberbullying in the digital age and its associated mental health problems in children and adolescents: A meta-analysis. Eur. Child. Adolesc. Psychiatry 2022, 31, 1–14. [Google Scholar] [CrossRef]
- Milosevic, T.; Van Royen, K.; Davis, B. Artificial Intelligence to Address Cyberbullying, Harassment and Abuse: New Directions in the Midst of Complexity. Int. J. Bullying Prev. 2022, 4, 1–5. [Google Scholar] [CrossRef]


| Variable | Survey Item | Response Choice |
|---|---|---|
| Dependent variables | ||
| In-school bullied | During the past 12 months, have you ever been bullied on school property? | [no] or [yes] |
| Cyberbullied | During the past 12 months, have you ever been electronically bullied? (Count being bullied through texting, Instagram, Facebook, or other social media.) | [no] or [yes] |
| Independent variables | ||
| Age group | How old are you? | 14 years old or younger 15 years old 16 years old 17 years old 18 years old or older |
| Gender | What is your sex? | [female] or [male] |
| Race | The variable is computed from two questions: (1) Are Hispanic or Latino? and (2) What is your race? | White Black Asian Hispanic/Latino AI a/AN b NH c/other PI d |
| Physical appearance of obesity | Had obesity (students who were ≥95th percentile for body mass index, based on sex- and age-specific reference data from the 2000 CDC e growth charts) | [no] or [yes] |
| Physical lifestyles of being physically active | Were physically active at least 60 min per day on 5 or more days (in any kind of physical activity that increased their heart rate and made them breathe hard some of the time during the 7 days before the survey) | [no] or [yes] |
| Physical lifestyles of spending a long time on digital games | Played video or computer games or used a computer 3 or more hours per day (counting time spent on things such as playing games, watching videos, texting, or using social media on your smartphone, computer, Xbox, PlayStation, iPad, or other tablet, for something that was not schoolwork, on an average school day) | [no] or [yes] |
| Risk-taken behaviors using marijuana/alcohol | Currently used marijuana | [no] or [yes] |
| Variables | n a (Not Weighted) | % (Weighted) | |
|---|---|---|---|
| Dependent variables | |||
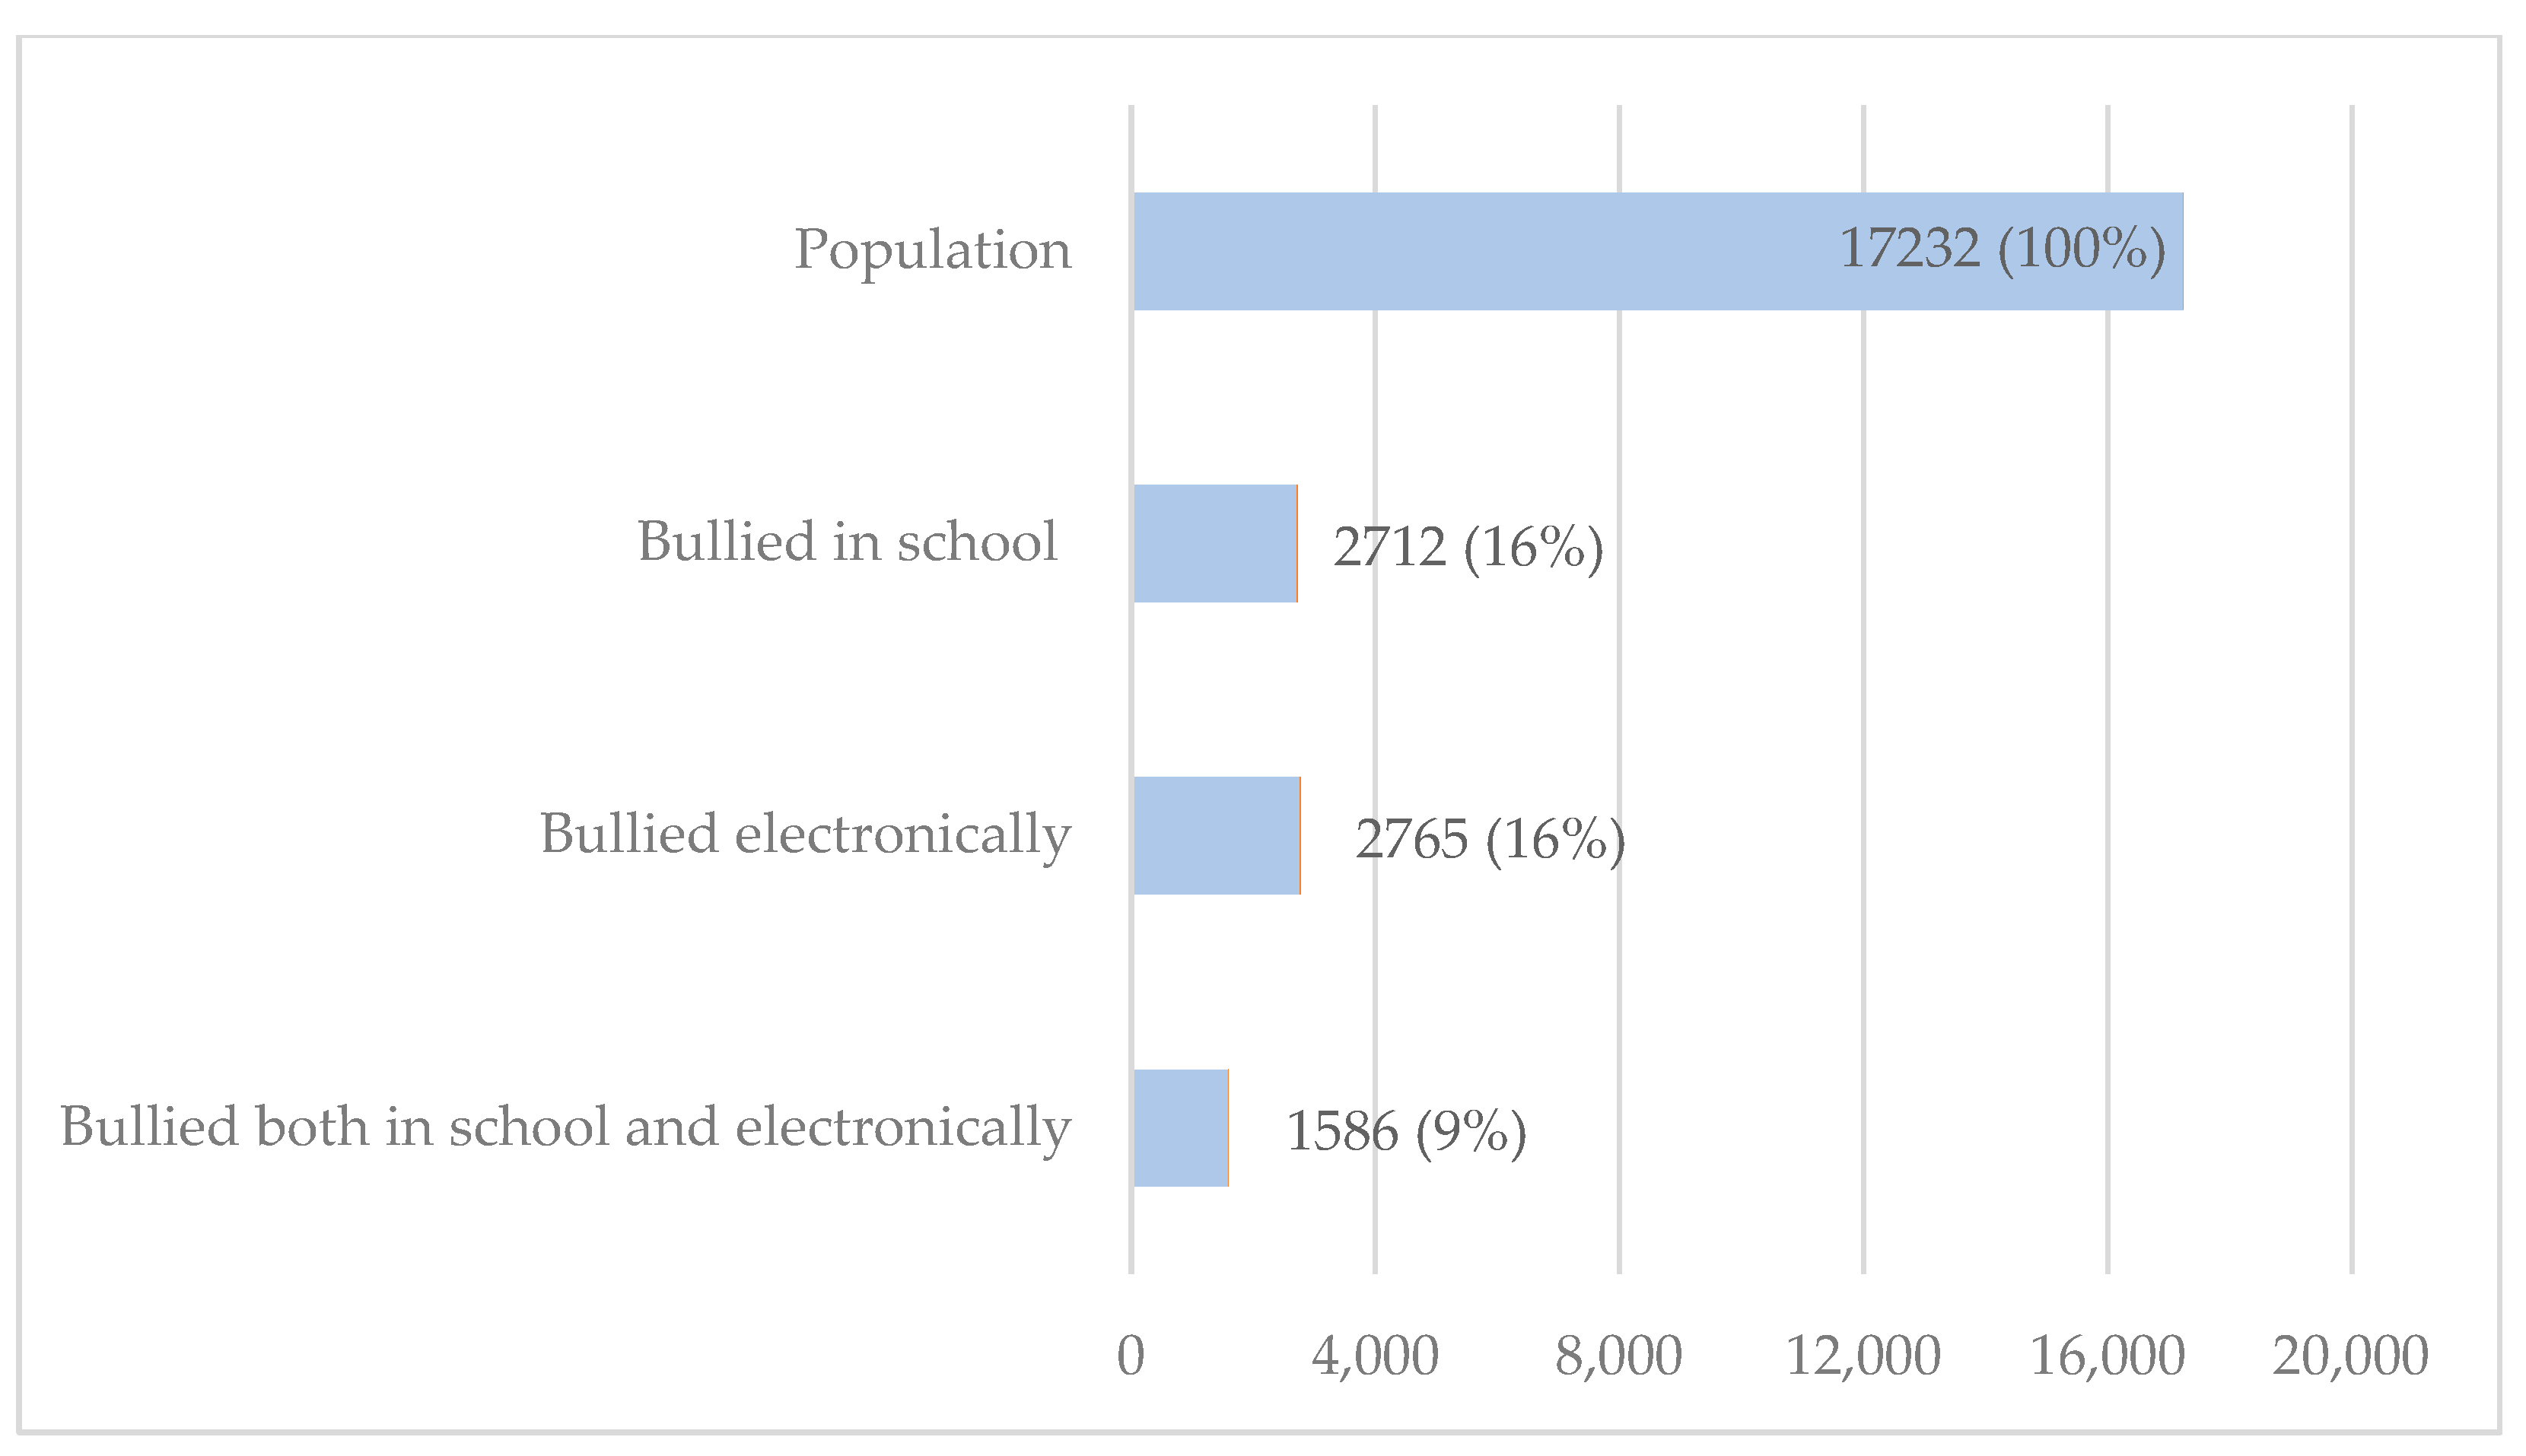
| Being cyberbullied (n = 17,032) | No | 14,267 | 83.77 |
| Yes | 2765 | 16.23 | |
| Being in-school bullied (n = 16,706) | No | 13,994 | 83.77 |
| Yes | 2712 | 16.23 | |
| Independent variables | |||
| Age groups (n = 17,134) | ≤14 years old | 3504 | 20.45 |
| 15 years old | 4427 | 25.84 | |
| 16 years old | 4276 | 24.96 | |
| 17 years old | 3904 | 22.79 | |
| ≥18 years old | 1023 | 5.97 | |
| Gender (n = 16,968) | Female | 8152 | 48.04 |
| Male | 8816 | 51.96 | |
| Race (n = 16,800) | White | 9151 | 54.47 |
| Black | 2322 | 13.82 | |
| Asian | 850 | 5.06 | |
| Hispanic/Latino | 1213 | 7.22 | |
| AIAN b | 145 | 0.86 | |
| NH/PI c | 88 | 0.52 | |
| Multiracial | 3031 | 18.04 | |
| Obesity appearance (n = 14,896) | No | 12,341 | 82.85 |
| Yes | 2555 | 17.15 | |
| At least 1 h of physical activity per day for 5 days during the past 7 days (n = 16,652) | No | 7658 | 45.99 |
| Yes | 8994 | 54.01 | |
| At least 3 h per day on video/computer games or computers (n = 16,496) | No | 4064 | 24.64 |
| Yes | 12,432 | 75.36 | |
| Currently using marijuana (n = 16,897) | No | 14,250 | 84.33 |
| Yes | 26.47 | 15.67 | |
| Variable | Category | Cyberbullied | In-School Bullied | ||||
|---|---|---|---|---|---|---|---|
| No | Yes | p a | No | Yes | p a | ||
| Age group | ≤14 years | 2857 | 595 | <0.001 | 2771 | 631 | <0.001 |
| 15 years | 3600 | 776 | 3485 | 746 | |||
| 16 years | 3556 | 681 | 3501 | 662 | |||
| 17 years | 3313 | 556 | 3304 | 519 | |||
| ≥18 years | 868 | 141 | 861 | 137 | |||
| Gender | Male | 7723 | 975 | <0.001 | 7415 | 1130 | <0.001 |
| Female | 6366 | 1720 | 6411 | 1507 | |||
| Race | White | 7372 | 1700 | <0.001 | 7236 | 1678 | <0.001 |
| Black | 2054 | 231 | 2047 | 207 | |||
| Asian | 729 | 114 | 736 | 88 | |||
| Hispanic/Latino | 1081 | 111 | 1060 | 110 | |||
| AIAN b | 108 | 36 | 108 | 33 | |||
| NH/PI c | 81 | 7 | 72 | 11 | |||
| Multiracial | 2505 | 495 | 2424 | 499 | |||
| Obesity appearance | No | 10,307 | 1923 | 0.189 | 10,141 | 1851 | 0.001 |
| Yes | 2109 | 425 | 2033 | 452 | |||
| More than an hour of physical activity per day for 5 days during the past 7 days | No | 7352 | 1535 | <0.001 | 7276 | 1481 | 0.006 |
| Yes | 6447 | 1143 | 6270 | 1134 | |||
| More than 3 h a day on digital games or computers | No | 3476 | 530 | <0.001 | 3343 | 586 | 0.014 |
| Yes | 10,206 | 2113 | 10,076 | 2003 | |||
| Current use of marijuana | No | 1894 | 1992 | <0.001 | 11,784 | 2060 | <0.001 |
| Yes | 1894 | 709 | 1955 | 596 | |||
| Variable | Category | Cyberbullying | In-School Bullying | ||||
|---|---|---|---|---|---|---|---|
| AOR a | p b | 95% CI c | AOR a | p b | 95% CI c | ||
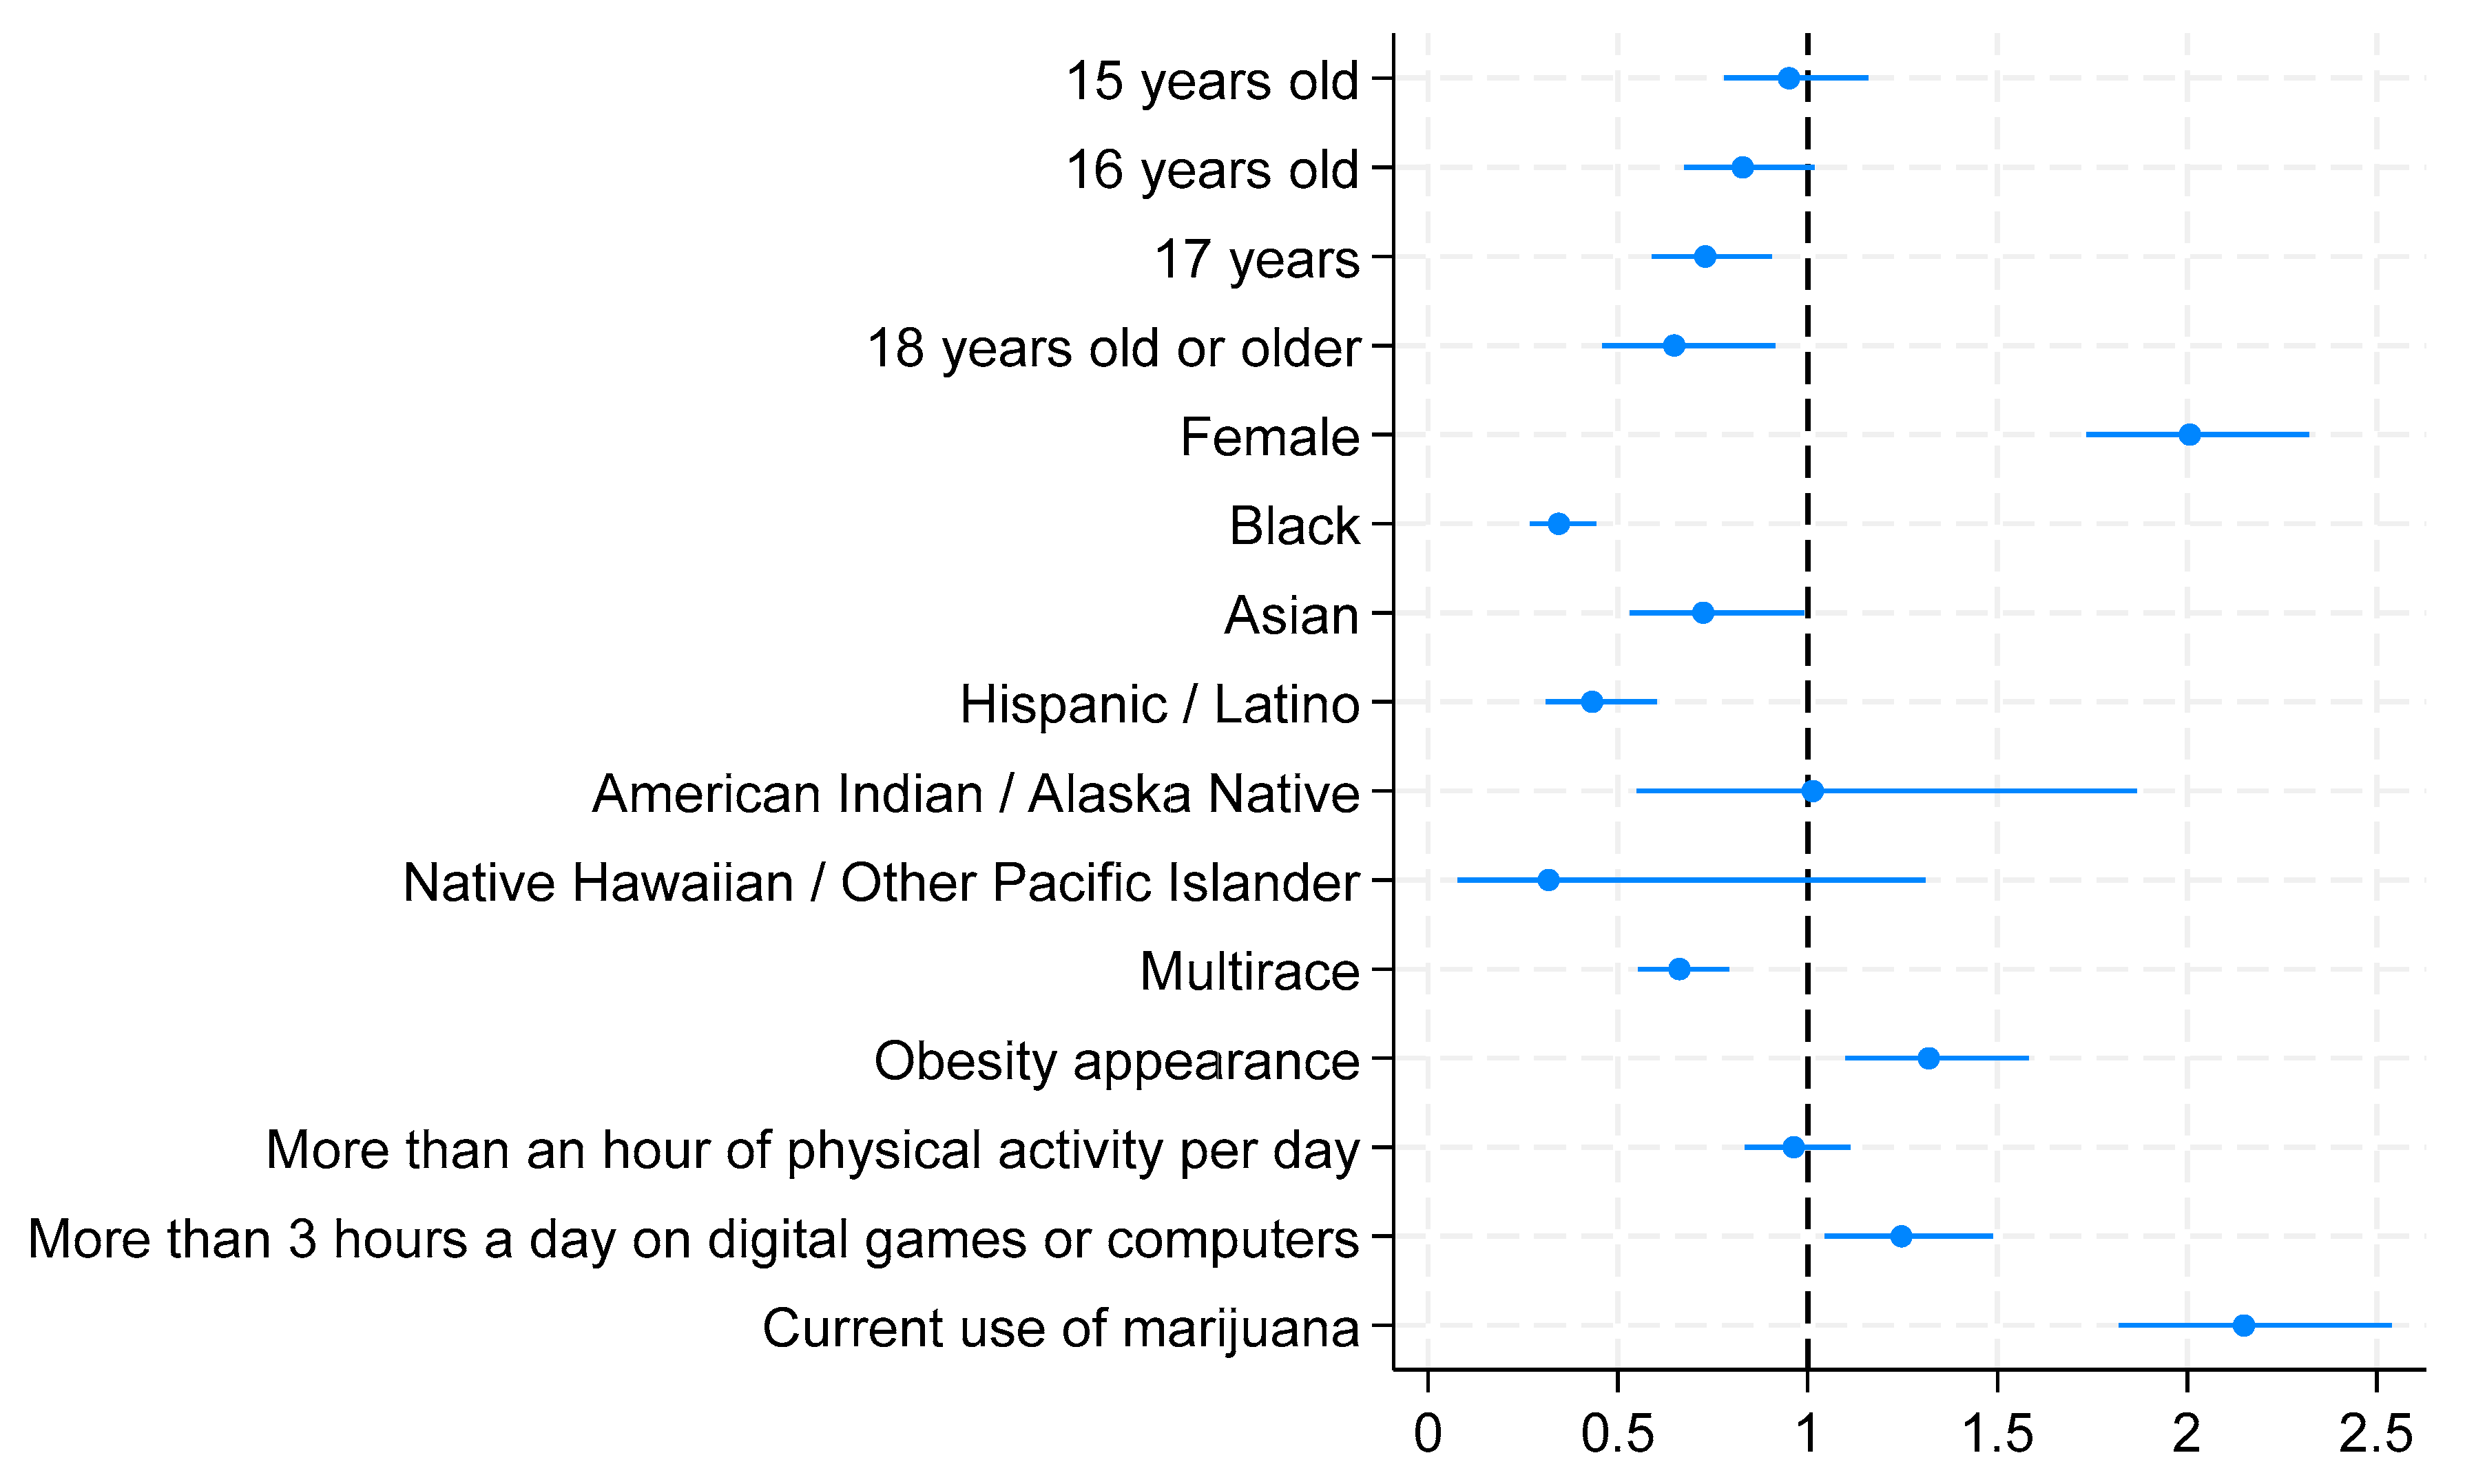
| Age group | ≤14 years | Ref | Ref | Ref | Ref | Ref | Ref |
| 15 years | 0.951 | 0.618 | 0.779–1.160 | 0.800 | 0.028 | 0.655–0.977 | |
| 16 years | 0.829 | 0.074 | 0.675–1.018 | 0.703 | 0.001 | 0.574–0.861 | |
| 17 years | 0.730 | 0.004 | 0.589–0.904 | 0.606 | <0.001 | 0.491–0.749 | |
| ≥18 years | 0.648 | 0.014 | 0.459–0.914 | 0.529 | <0.001 | 0.372–0.753 | |
| Gender | Male | Ref | Ref | Ref | Ref | Ref | Ref |
| Female | 2.001 | <0.001 | 1.735–2.322 | 1.380 | <0.001 | 1.193–1.597 | |
| Race | White | Ref | Ref | Ref | Ref | Ref | Ref |
| Black | 0.344 | <0.001 | 0.268–0.442 | 0.383 | <0.001 | 0.296–0.495 | |
| Asian | 0.724 | 0.043 | 0.530–0.990 | 0.574 | 0.002 | 0.405–0.814 | |
| Hispanic/Latino | 0.432 | <0.001 | 0.310–0.602 | 0.376 | <0.001 | 0.268–0.530 | |
| AIAN d | 1.013 | 0.966 | 0.550–1.867 | 0.787 | 0.455 | 0.421–1.474 | |
| NH/PI e | 0.317 | 0.113 | 0.077–1.310 | 0.224 | 0.063 | 0.046–1.085 | |
| Multiracial | 0.662 | <0.001 | 0.553–0.793 | 0.713 | <0.001 | 0.594–0.855 | |
| Obesity appearance | No | Ref | Ref | Ref | Ref | Ref | Ref |
| Yes | 1.319 | 0.003 | 1.010–1.582 | 1.303 | 0.004 | 1.090–1.559 | |
| More than an hour of physical activity per day for 5 days during the past 7 days | No | Ref | Ref | Ref | Ref | Ref | Ref |
| Yes | 0.963 | 0.611 | 0.834–1.113 | 0.941 | 0.421 | 0.813–1.090 | |
| More than 3 h a day on digital games or computers | No | Ref | Ref | Ref | Ref | Ref | Ref |
| Yes | 1.247 | 0.014 | 1.046–1.487 | 1.056 | 0.527 | 0.891–1.252 | |
| Current use of marijuana | No | Ref | Ref | Ref | Ref | Ref | Ref |
| Yes | 2.150 | <0.001 | 1.820–2.539 | 1.818 | <0.001 | 1.529–2.162 | |
Disclaimer/Publisher’s Note: The statements, opinions and data contained in all publications are solely those of the individual author(s) and contributor(s) and not of MDPI and/or the editor(s). MDPI and/or the editor(s) disclaim responsibility for any injury to people or property resulting from any ideas, methods, instructions or products referred to in the content. |
© 2024 by the authors. Licensee MDPI, Basel, Switzerland. This article is an open access article distributed under the terms and conditions of the Creative Commons Attribution (CC BY) license (https://creativecommons.org/licenses/by/4.0/).
Share and Cite
Nguyen, T.H.; Shah, G.H.; Kaur, R.; Muzamil, M.; Ikhile, O.; Ayangunna, E. Factors Predicting In-School and Electronic Bullying among High School Students in the United States: An Analysis of the 2021 Youth Risk Behavior Surveillance System. Children 2024, 11, 788. https://doi.org/10.3390/children11070788
Nguyen TH, Shah GH, Kaur R, Muzamil M, Ikhile O, Ayangunna E. Factors Predicting In-School and Electronic Bullying among High School Students in the United States: An Analysis of the 2021 Youth Risk Behavior Surveillance System. Children. 2024; 11(7):788. https://doi.org/10.3390/children11070788
Chicago/Turabian StyleNguyen, Tran H., Gulzar H. Shah, Ravneet Kaur, Maham Muzamil, Osaremhen Ikhile, and Elizabeth Ayangunna. 2024. "Factors Predicting In-School and Electronic Bullying among High School Students in the United States: An Analysis of the 2021 Youth Risk Behavior Surveillance System" Children 11, no. 7: 788. https://doi.org/10.3390/children11070788
APA StyleNguyen, T. H., Shah, G. H., Kaur, R., Muzamil, M., Ikhile, O., & Ayangunna, E. (2024). Factors Predicting In-School and Electronic Bullying among High School Students in the United States: An Analysis of the 2021 Youth Risk Behavior Surveillance System. Children, 11(7), 788. https://doi.org/10.3390/children11070788