
High Rate of Change of the Foot in Ecuadorian Children: The Need for Proper Shoe Design
 , , , and
Abstract
1. Introduction
2. Materials and Methods
2.1. Participants
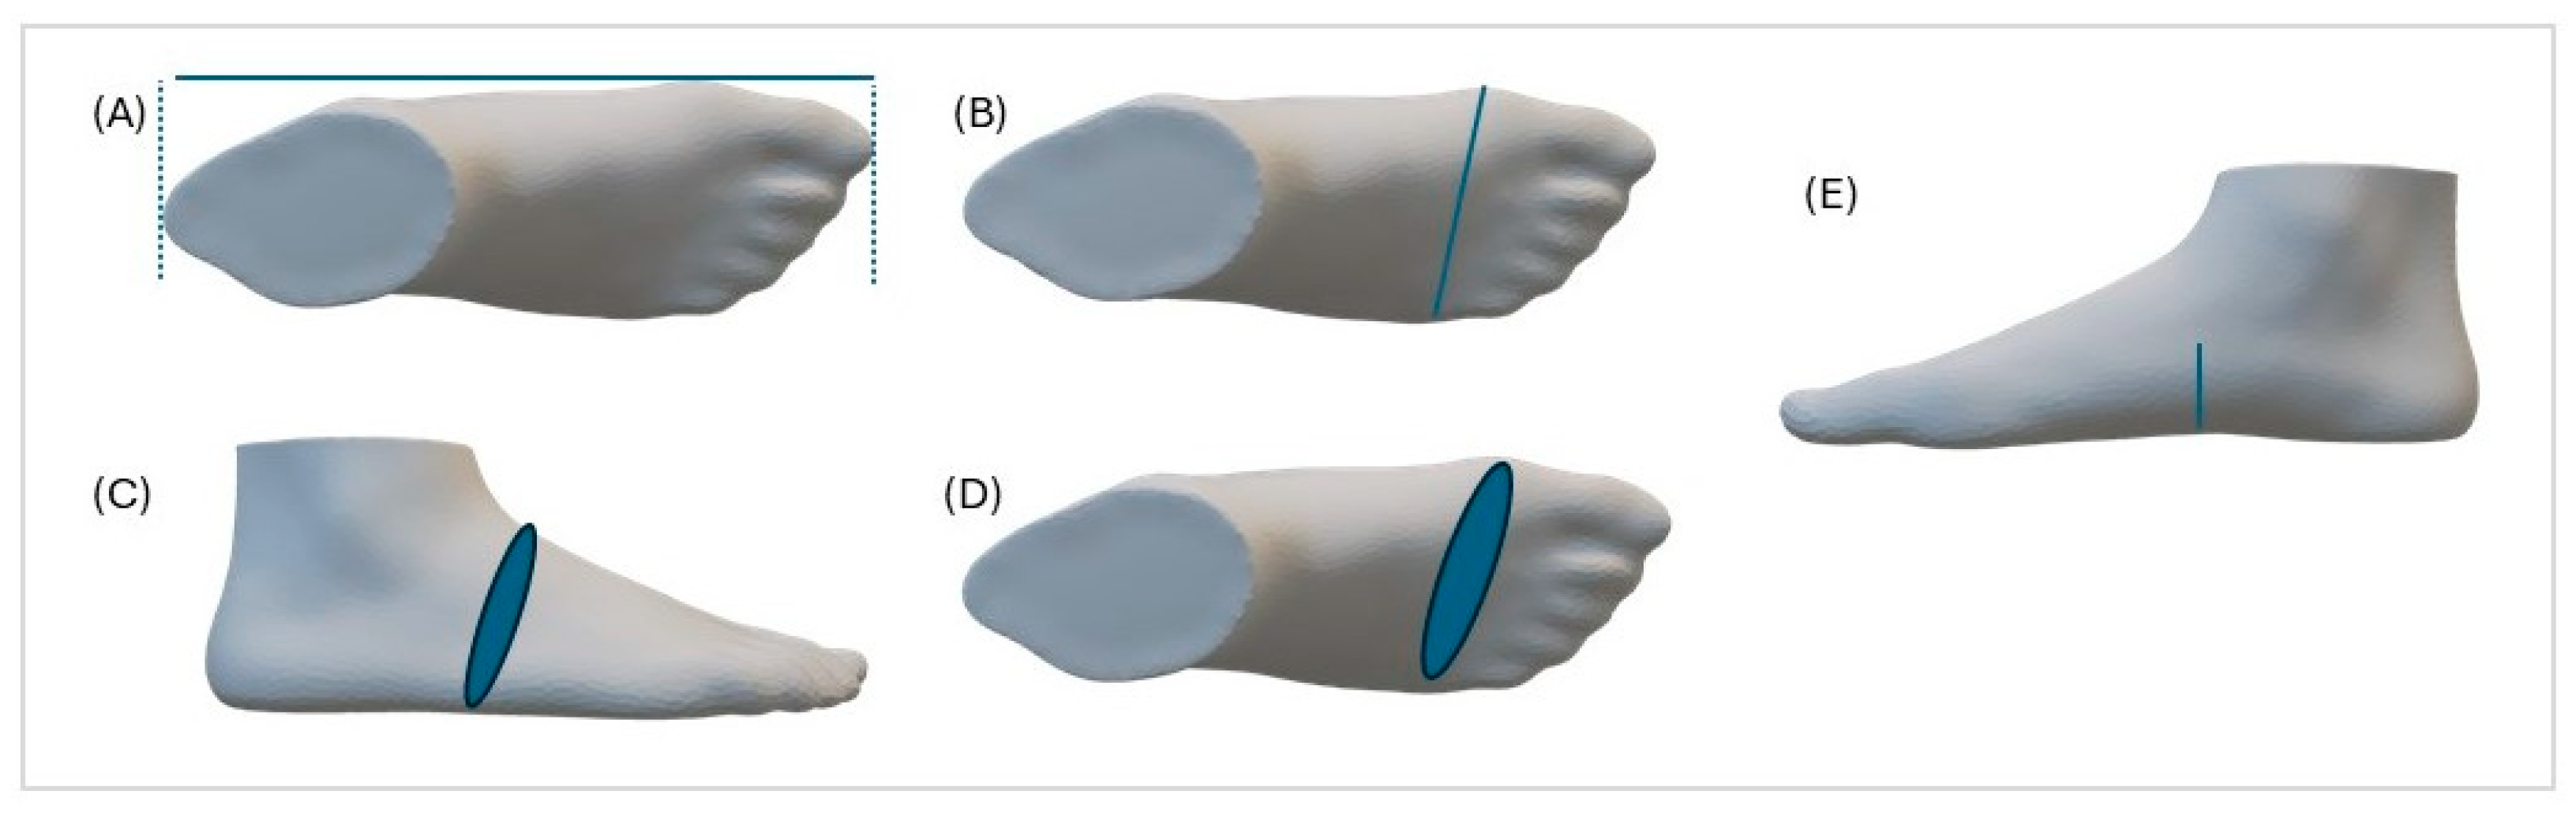
2.2. Measurements
2.3. Statistical Analysis
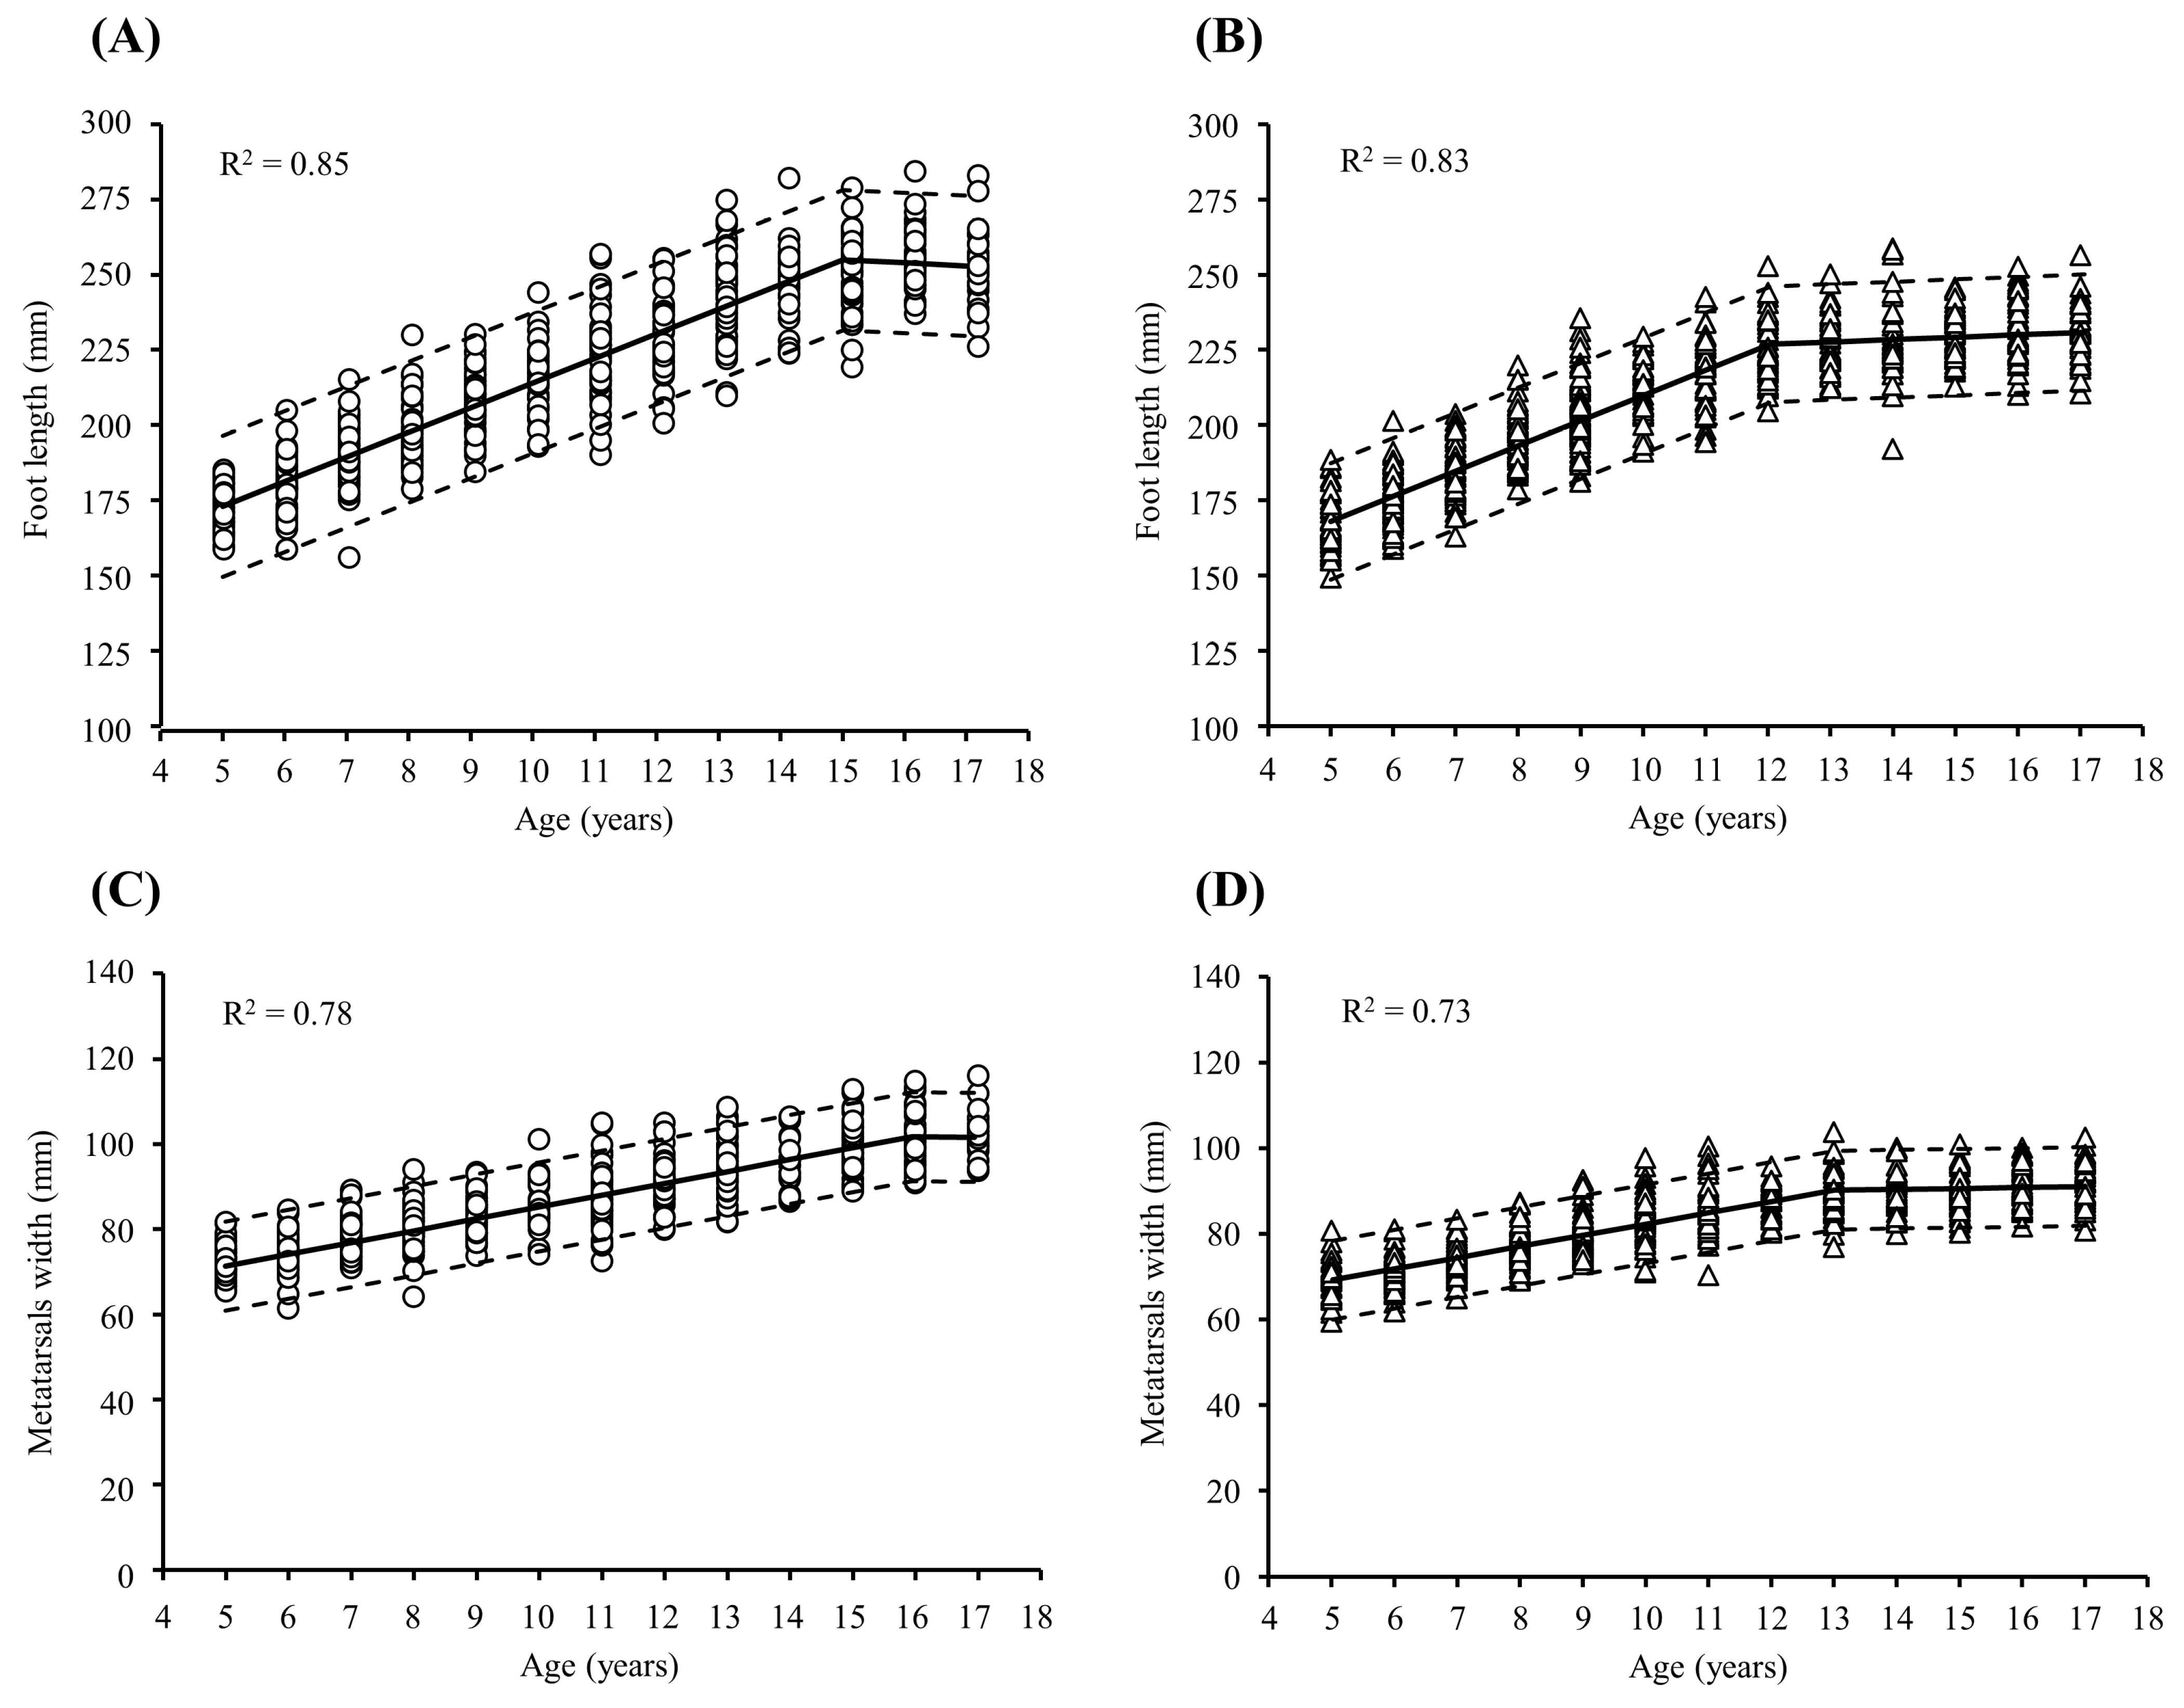
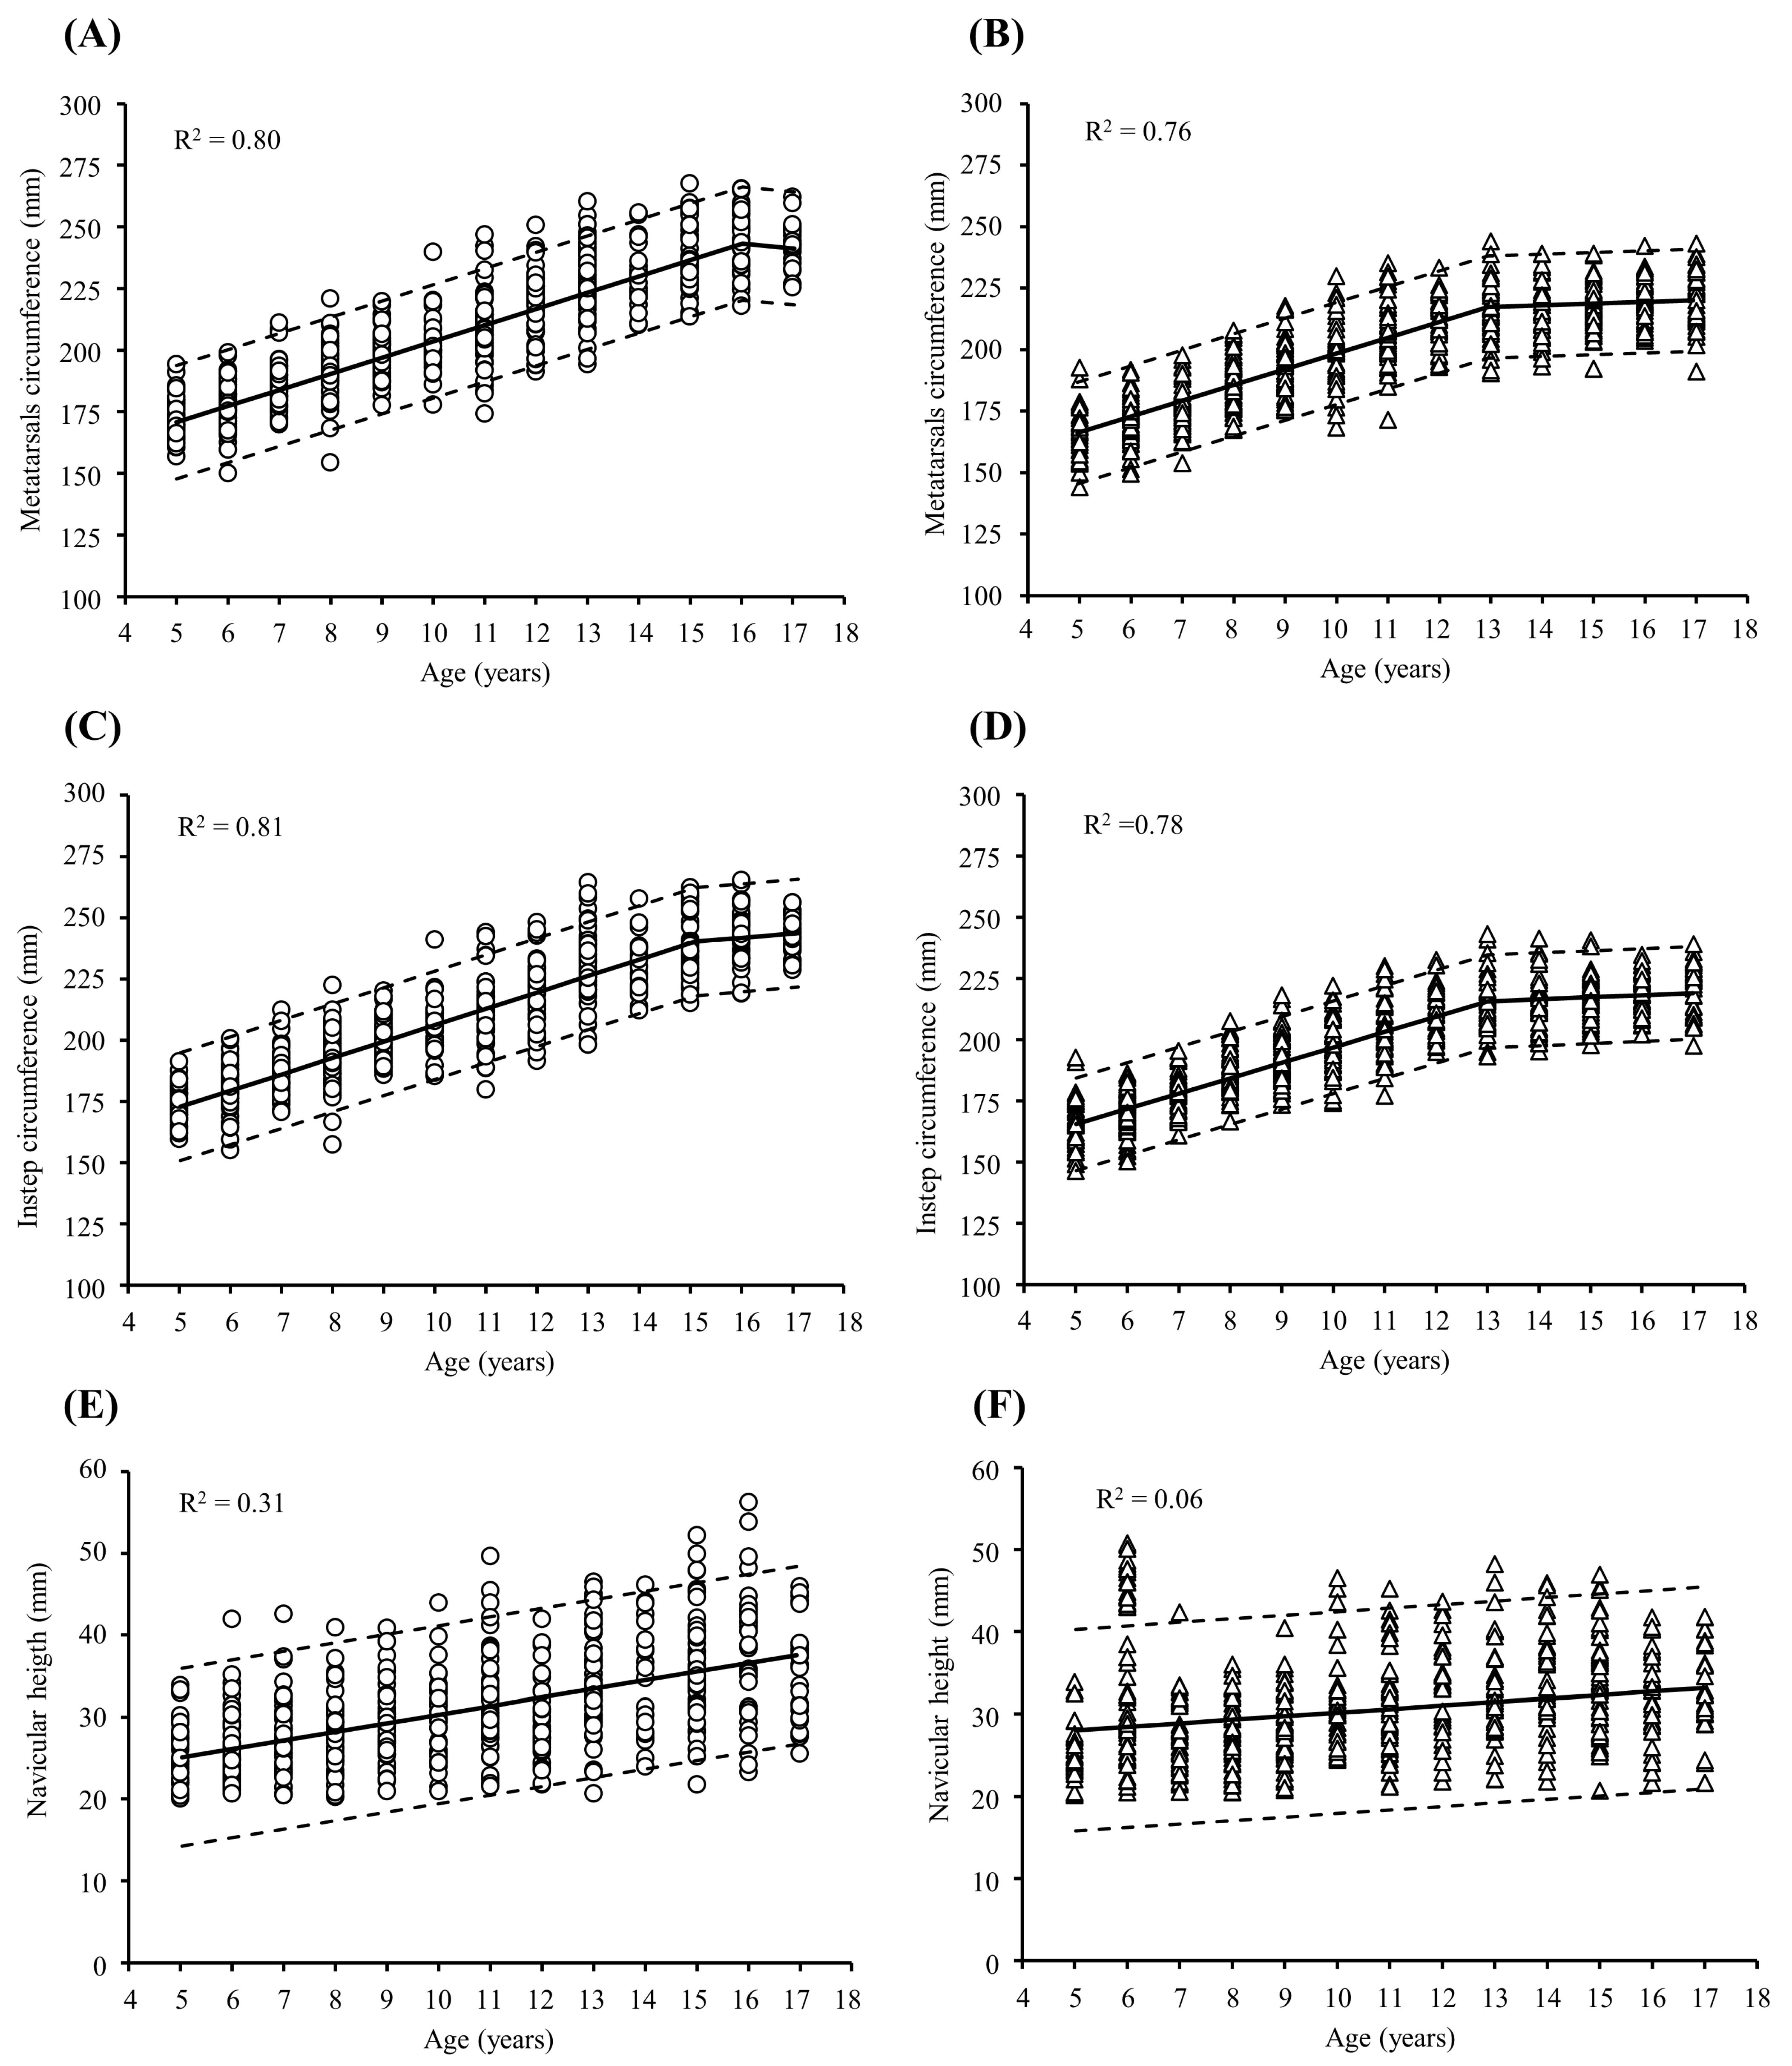
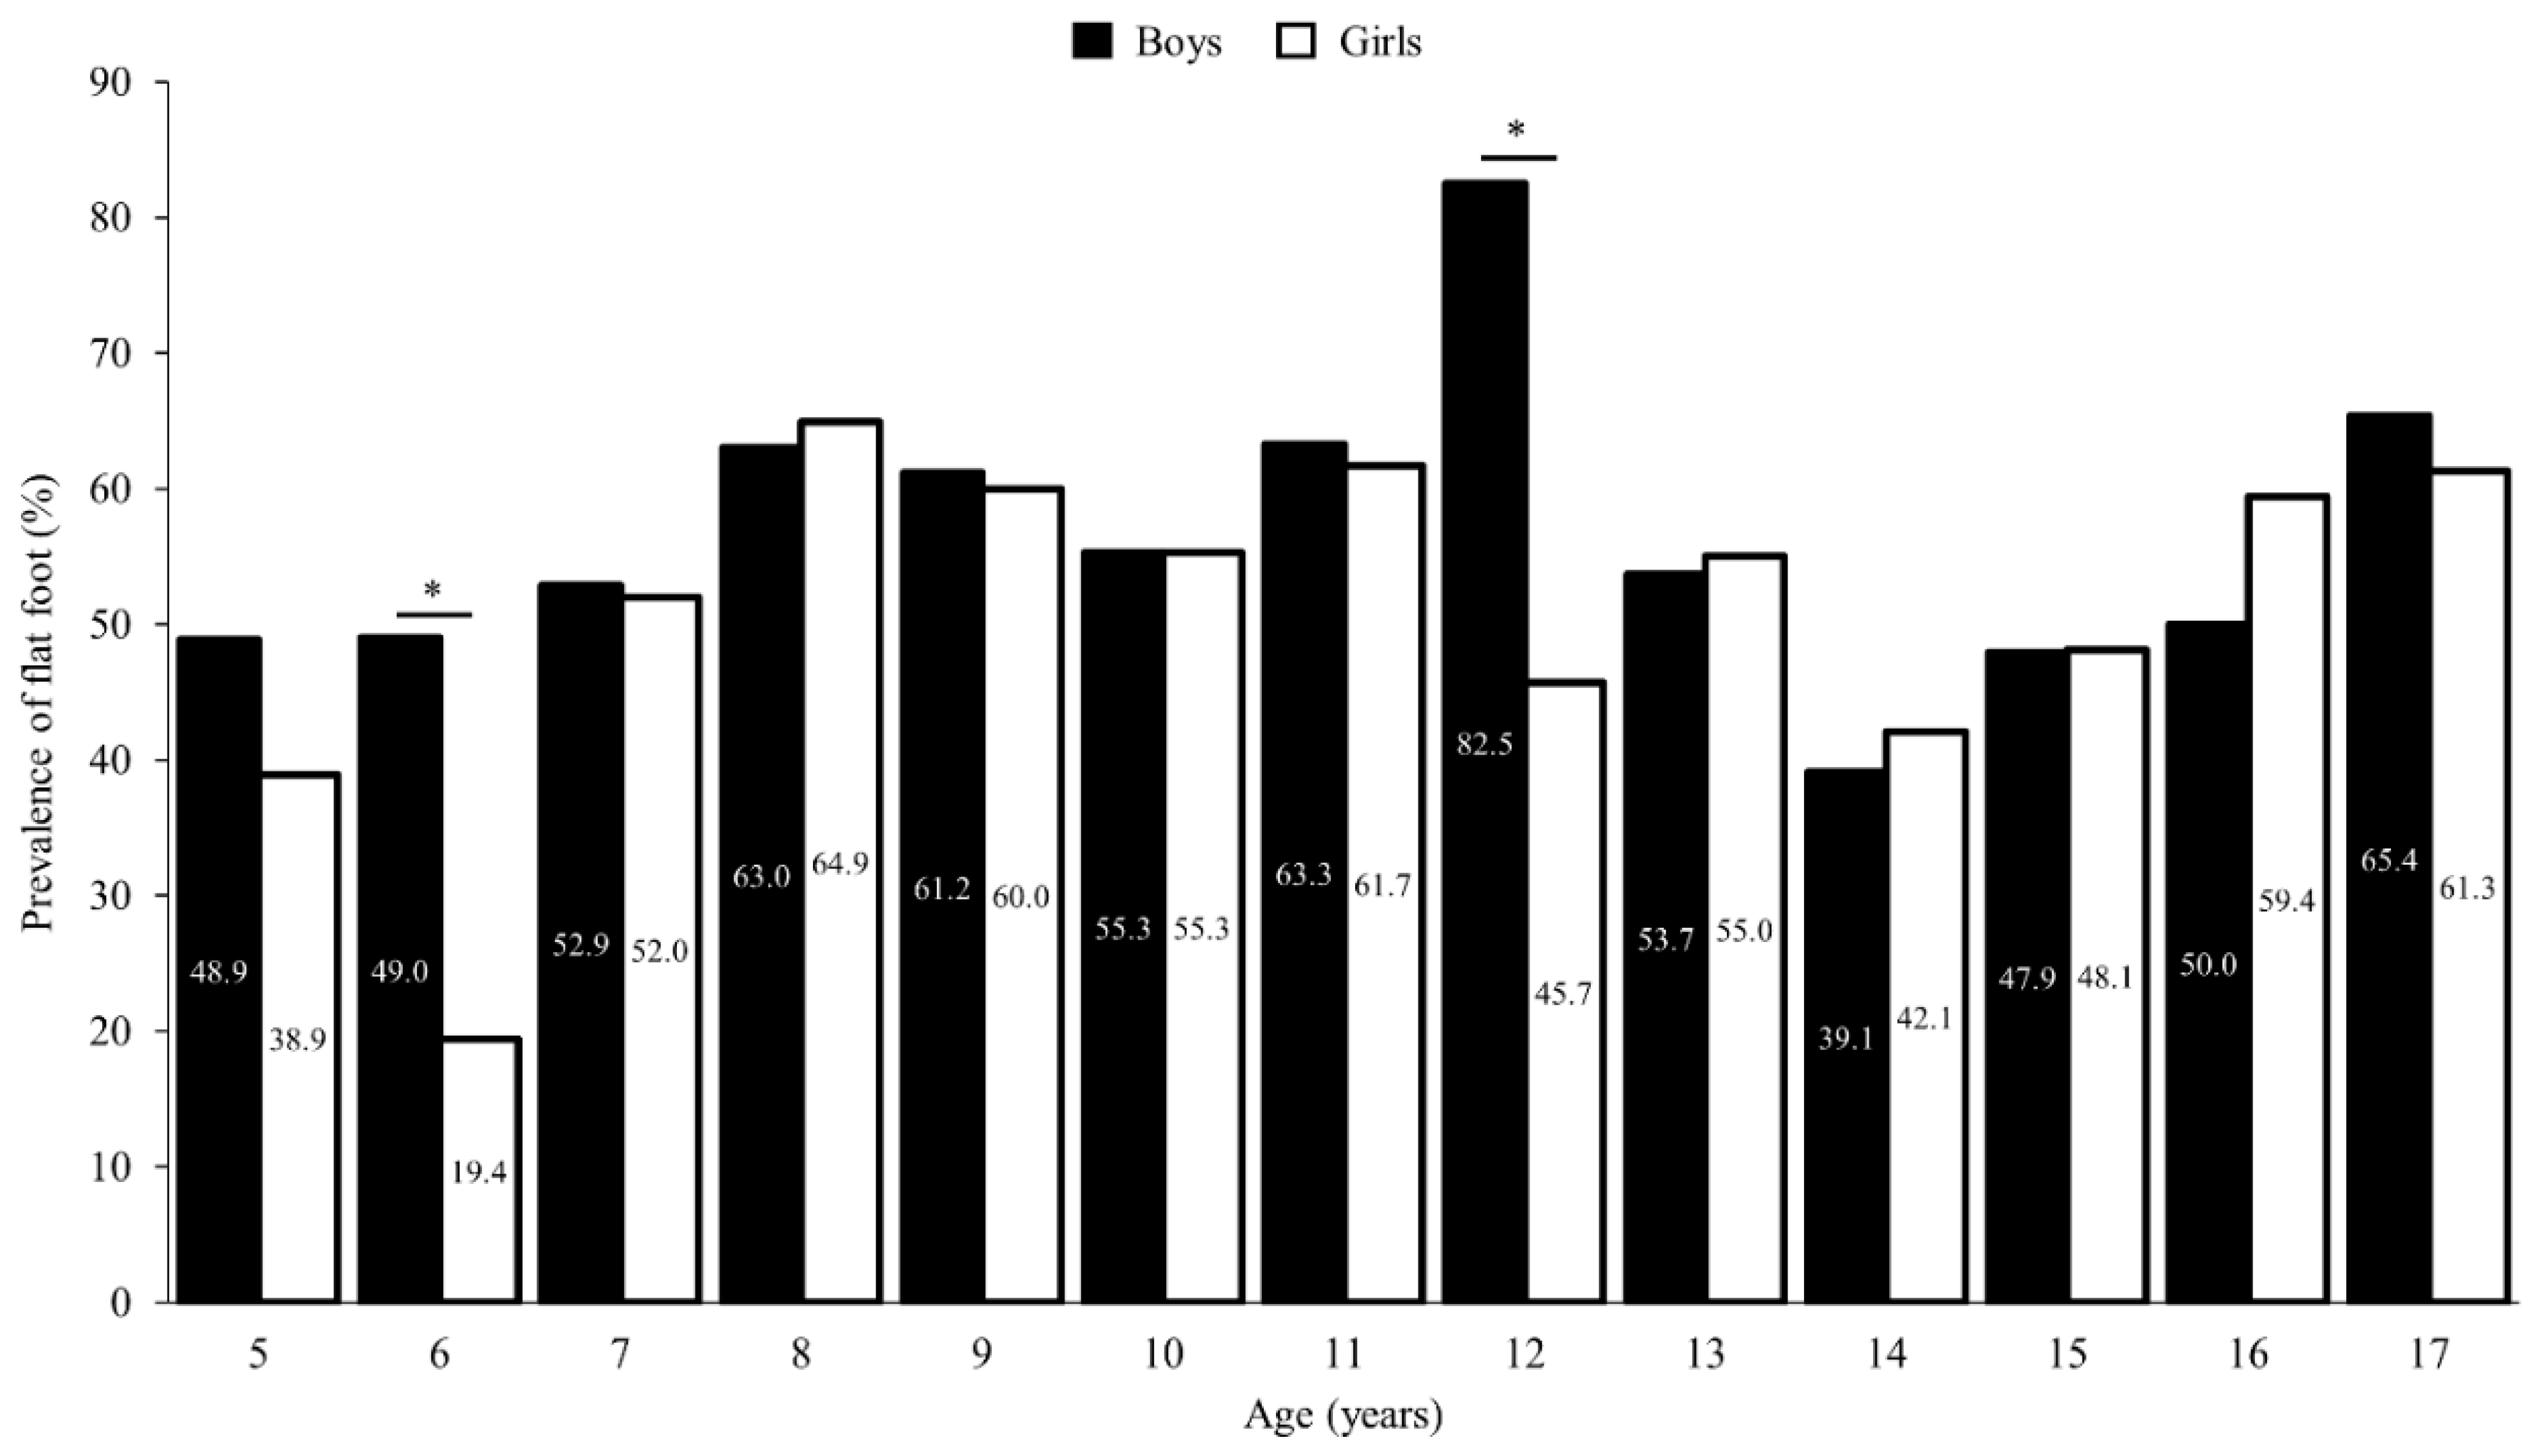
3. Results
4. Discussion
5. Conclusions
Author Contributions
Funding
Institutional Review Board Statement
Informed Consent Statement
Data Availability Statement
Acknowledgments
Conflicts of Interest
References
- Mauch, M.; Grau, S.; Krauss, I.; Miwald, C.; Horstmann, T.A. New approach to children’s footwear based on foot type classification. Ergonomics 2009, 52, 999–1008. [Google Scholar] [CrossRef]
- González Elena, M.L.; Córdoba-Fernández, A. Footwear fit in schoolchildren of southern Spain: A population study. BMC Musculoskelet. Disord. 2019, 20, 208. [Google Scholar] [CrossRef] [PubMed]
- Waseda, A.; Suda, Y.; Inokuchi, S.; Nishiwaki, Y.; Toyama, Y. Standard growth of the foot arch in childhood and adolescence--Derived from the measurement results of 10,155 children. Foot Ankle Surg. 2014, 20, 208–214. [Google Scholar] [CrossRef] [PubMed]
- Breet, M.C.; Venter, R. Are habitually barefoot children compelled to wear ill-fitting school shoes? A cross-sectional study. BMC Pediatr. 2022, 22, 187. [Google Scholar] [CrossRef] [PubMed]
- Bertsch, C.; Unger, H.; Winkelmann, W.; Rosenbaum, D. Evaluation of early walking patterns from plantar pressure distribution measurements. First year results of 42 children. Gait Posture 2004, 19, 235–242. [Google Scholar] [CrossRef] [PubMed]
- Onodera, A.N.; Sacco, I.C.; Morioka, E.H.; Souza, P.S.; de Sá, M.R.; Amadio, A.C. What is the best method for child longitudinal plantar arch assessment and when does arch maturation occur? Foot 2008, 18, 142–149. [Google Scholar] [CrossRef]
- Cheng, J.C.; Leung, S.S.; Leung, A.K.; Guo, X.; Sher, A.; Mak, A.F. Change of foot size with weightbearing. A study of 2829 children 3 to 18 years of age. Clin. Orthop. Relat. Res. 1997, 342, 123–131. [Google Scholar] [CrossRef]
- Volpon, J.B. Footprint analysis during the growth period. J. Pediatr. Orthop. 1994, 14, 83–85. [Google Scholar] [CrossRef] [PubMed]
- Mueller, J.; Richter, M.; Schaefer, K.; Ganz, J.; Lohscheller, J.; Mueller, S. How to measure children’s feet: 3D foot scanning compared with established 2D manual or digital methods. J. Foot Ankle Res. 2023, 16, 21. [Google Scholar] [CrossRef] [PubMed]
- Mauch, M.; Mickle, K.J.; Munro, B.J.; Dowling, A.M.; Grau, S.; Steele, J.R. Do the feet of German and Australian children differ in structure? Implications for children’s shoe design. Ergonomics 2008, 51, 527–539. [Google Scholar] [CrossRef] [PubMed]
- Sacco, I.; Onodera, A.; Bosch, K.; Rosenbaum, D. Comparisons of foot anthropometry and plantar arch indices between German and Brazilian children. BMC Pediatr. 2015, 15, 4–9. [Google Scholar] [CrossRef] [PubMed]
- Barisch-Fritz, B.; Schmeltzpfenning, T.; Plank, C.; Hein, T.; Grau, S. The effects of gender, age, and body mass on dynamic foot shape and foot deformation inchildren and adolescents. Footwear Sci. 2014; 6, 27–39. [Google Scholar]
- Janisse, D.J. The art and science of fitting shoes. Foot Ankle 1992, 13, 257–262. [Google Scholar] [CrossRef] [PubMed]
- Echarri, J.J.; Forriol, F. The development in footprint morphology in 1851 Congolese children from urban and rural areas, and the relationship between this and wearing shoes. J. Pediatr. Orthop. 2003, 12, 141–146. [Google Scholar]
- Xiong, S.; Goonetilleke, R.S.; Witana, C.P.; Lee Au, E.Y. Modelling foot height and foot shape-related dimensions. Ergonomics 2008, 51, 1272–1289. [Google Scholar] [CrossRef] [PubMed]
- Xu, M.; Hong, Y.; Li, J.X.; Wang, L. Foot morphology in Chinese school children varies by sex and age. Med. Sci. Monit. 2018, 24, 4536–4546. [Google Scholar] [CrossRef]
- Delgado-Abellán, L.; Aguado, X.; Jiménez-Ormeño, E.; Mecerreyes, L.; Alegre, L.M. Foot morphology in Spanish school children according to sex and age. Ergonomics 2014, 57, 787–797. [Google Scholar] [CrossRef] [PubMed]
- Alsancak, S.; Guner, S.; Güven, E.; Özgün, A.K.; Akkaş, Y.; Alkıs, N. Paediatric flat foot and foot dimension in Central Anatolia. BMC Pediatr. 2021, 27, 21–200. [Google Scholar] [CrossRef] [PubMed]
- Chang, H.W.; Lin, C.J.; Kuo, L.C.; Tsai, M.J.; Chieh, H.F.; Su, F.C. Three-dimensional measurement of foot arch in preschool children. Biomed. Eng. 2012, 11, 76. [Google Scholar] [CrossRef] [PubMed]
- De Mits, S.; Coorevits, P.; De Clercq, D.; Elewaut, D.; Woodburn, J.; Roosen, P. Reliability and validity of the Infoot 3D foot digitizer for normal healthy adults. Footwear Sci. 2010, 2, 65–75. [Google Scholar] [CrossRef]
- Aboelnasr, E.A.; Hegazy, F.A.; Zaghloul, A.A.; El-Talawy, H.A.; Abdelazim, F.H. Validation of normalized truncated navicular height as a clinical assessment measure of static foot posture to determine flatfoot in children and adolescents: A cross sectional study. Foot 2018, 37, 85–90. [Google Scholar] [CrossRef]
- Alcazar, J.; Aagaard, P.; Haddock, B.; Kamper, R.S.; Hansen, S.K.; Prescott, E.; Alegre, L.M.; Frandsen, U.; Suetta, C. Age- and Sex-Specific Changes in Lower-Limb Muscle Power Throughout the Lifespan. J. Gerontol. A Biol. Sci. Med. Sci. 2020, 75, 1369–1378. [Google Scholar] [CrossRef] [PubMed]
- Kouchi, M. Foot Dimensions and Foot Shape: Differences Due to Growth, Generation and Ethnic Origin. Anthropol. Sci. 1998, 106, 161–188. [Google Scholar] [CrossRef] [PubMed]
- Wu, H.H.; Zhang, Y.Q.; Yu, C.D.; Yang, L.; Tao, C.; Shu, W.; Li, T.; Huang, G.; Hou, D.; Chen, F.F.; et al. Association of height, foot length, and pubertal development in children aged 3–18: A cross-sectional survey in China. Front. Public Health 2024, 12, 1322333. [Google Scholar] [CrossRef] [PubMed]
- Klein, C.; Groll-Knapp, E.; Kundi, M.; Kinz, W. Increased hallux angle in children and its association with insufficient length of footwear: A community based cross-sectional study. BMC Musculoskelet. Disord. 2009, 17, 159. [Google Scholar] [CrossRef] [PubMed]
- Martín-Casado, L.; Aldana-Caballero, A.; Barquín, C.; Criado-Álvarez, J.J.; Polonio-López, B.; Marcos-Tejedor, F. Foot morphology as a predictor of hallux valgus development in children. Sci. Rep. 2023, 13, 9351. [Google Scholar] [CrossRef] [PubMed]
- Xu, L.; Gu, H.; Zhang, Y.; Sun, T.; Yu, J. Risk Factors of Flatfoot in Children: A Systematic Review and Meta-Analysis. Int. J. Environ. Res. Public. Health 2022, 19, 8247. [Google Scholar] [CrossRef] [PubMed]
- Leung, A.K.; Cheng, J.C.; Mak, A.F. A cross-sectional study on the development of foot arch function of 2715 Chinese children. Prosthet. Orthot. Int. 2005, 29, 241–253. [Google Scholar] [CrossRef] [PubMed]
- Stavlas, P.; Grivas, T.B.; Michas, C.; Vasiliadis, E.; Polyzois, V. The evolution of foot morphology in children between 6 and 17 years of age: A cross-sectional study based on footprints in a Mediterranean population. Foot Ankle Surg. 2005, 44, 424–428. [Google Scholar] [CrossRef] [PubMed]

| Age (Years) | Weight (kg) | Height (m) | BIM (kg/m2) | |||
|---|---|---|---|---|---|---|
| Boys | Girls | Boys | Girls | Boys | Girls | |
| 5 | 18.36 ± 1.42 | 187.97 ± 1.80 | 1.09 ± 0.04 | 1.07 ± 0.05 | 15.54 ± 0.91 | 15.71 ± 0.81 |
| 6 | 20.71 ± 2.38 | 19.44 ± 2.04 | 1.14 ± 0.05 | 1.13 ± 0.05 | 15.88 ± 1.37 | 15.32 ± 1.14 |
| 7 | 22.47 ± 2.91 | 22.28 ± 2.56 | 1.19 ± 0.05 | 1.19 ± 0.05 | 15.83 ± 1.54 | 15.77 ± 1.13 |
| 8 | 25.01 ± 3.06 | 24.58 ± 2.56 | 1.24 ± 0.05 | 1.23 ± 0.04 | 16.19 ± 1.18 | 16.22 ± 1.23 |
| 9 | 28.16 ± 3.19 | 27.91 ± 3.58 | 1.29 ± 0.05 | 1.28 ± 0.06 | 16.92 ± 1.13 | 17.01 ± 1.20 |
| 10 | 30.63 ± 4.24 | 29.53 ± 5.13 | 1.33 ± 0.06 | 1.34 ± 0.06 | 17.24 ± 1.32 | 16.46 ± 2.18 |
| 11 | 33.05 ± 5.60 | 33.38 ± 5.18 | 1.37 ± 0.07 | 1.38 ± 0.07 | 17.41 ±1.89 | 17.44 ± 1.63 |
| 12 | 37.73 ± 5.70 | 39.67 ± 5.28 | 1.43 ± 0.08 | 1.46 ± 0.08 | 18.42 ± 1.59 | 18.65 ± 1.44 |
| 13 | 43.90 ± 7.43 | 43.30 ± 5.32 | 1.52 ± 0.08 | 1.50 ± 0.06 | 18.96 ±1.77 | 19.34 ± 1.79 |
| 14 | 44.67 ± 7.18 | 46.61 ± 7.24 | 1.54 ± 0.09 | 1.51 ± 0.08 | 18.71 ±1.73 | 20.42 ± 1.96 |
| 15 | 51.87 ± 8.99 | 48.77 ± 5.13 | 1.61 ± 0.11 | 1.53 ± 0.05 | 19.74 ± 2.08 | 20.82 ± 1.70 |
| 16 | 56.20 ± 7.13 | 50.79 ± 5.33 | 1.66 ± 0.06 | 1.55 ± 0.07 | 20.22 ± 1.77 | 21.20 ± 1.89 |
| 17 | 56.97 ± 6.49 | 52.25 ± 5.32 | 1.63 ± 0.06 | 1.55 ± 0.06 | 21.28 ± 1.86 | 21.85 ± 1.93 |
| Age (Years) | Foot Length (mm) | Metatarsal Width (mm) | Metatarsal Circumference (mm) | Instep Circumference (mm) | Navicular Height (mm) | |||||
|---|---|---|---|---|---|---|---|---|---|---|
| Boys | Girls | Boys | Girls | Boys | Girls | Boys | Girls | Boys | Girls | |
| 5 | − | − | − | − | − | − | − | − | − | − |
| 6 | 4.7 | 5.0 * | 3.8 | 3.8 | 3.8 | 3.9 | 3.8 | 3.8 | 4.1 | 1.5 * |
| 7 | 4.5 | 4.7 * | 3.7 | 3.6 | 3.7 | 3.7 | 3.7 | 3.6 | 3.9 | 1.5 * |
| 8 | 4.3 | 4.5 * | 3.5 | 3.5 | 3.6 | 3.6 | 3.6 | 3.5 | 3.8 | 1.5 * |
| 9 | 4.1 | 4.3 * | 3.4 | 3.4 | 3.4 | 3.5 | 3.4 | 3.4 | 3.6 | 1.4 * |
| 10 | 3.9 | 4.1 * | 3.3 | 3.3 | 3.3 | 3.3 | 3.3 | 3.3 | 3.5 | 1.4 * |
| 11 | 3.8 | 4.0 * | 3.2 | 3.2 | 3.2 | 3.2 | 3.2 | 3.2 | 3.4 | 1.4 * |
| 12 | 3.6 | 3.8 * | 3.1 | 3.1 | 3.1 | 3.1 | 3.1 | 3.1 | 3.3 | 1.4 * |
| 13 | 3.5 | 0.4 * | 3.0 | 3.0 | 3.0 | 3.0 | 3.0 | 3.0 | 3.2 | 1.4 * |
| 14 | 3.4 | 0.3 * | 2.9 | 0.2 * | 2.9 | 0.3 * | 2.9 | 0.4 * | 3.1 | 1.4 * |
| 15 | 3.3 | 0.3 * | 2.8 | 0.2 * | 2.9 | 0.3 * | 2.9 | 0.4 * | 3.0 | 1.3 * |
| 16 | −0.4 | 0.3 | 2.7 | 0.2 | 2.8 | 0.3 * | 0.7 | 0.4 | 2.9 | 1.3 * |
| 17 | −0.4 | 0.3 | −0.2 | 0.2 | −0.8 | 0.3 | 0.7 | 0.4 | 2.8 | 1.3 * |
| Age (Years) | Foot Length (mm) | Metatarsal Width (mm) | Metatarsal Circumference (mm) | Instep Circumference (mm) | Navicular Height (mm) | |||||
|---|---|---|---|---|---|---|---|---|---|---|
| Boys | Girls | Boys | Girls | Boys | Girls | Boys | Girls | Boys | Girls | |
| 5 | 172.4 ± 7.2 | 167.7 ± 9.4 * | 72.1 ± 3.8 | 69.3 ± 4.4 * | 172.6 ± 7.9 | 166.1 ± 9.9 * | 173.5 ± 7.4 | 166.1 ± 10.1 * | 25.6 ± 3.5 | 25.3 ± 3.2 |
| 6 | 180.1 ± 8.9 | 176.2 ± 8.8 * | 74.3 ± 4.3 | 71.2 ± 3.7 * | 177.6 ± 9.8 | 171.2 ± 8.5 * | 180.4 ± 10.1 | 170.8 ± 7.9 * | 26.8 ± 4.2 | 34.3 ± 9.5 * |
| 7 | 191.3 ± 8.8 | 185.3 ± 9.4 * | 77.7 ± 4.1 | 74.1 ± 3.8 * | 185.6 ± 9.1 | 177.3 ± 8.8 * | 186.8 ± 8.4 | 178.1 ± 8.0* | 27.3 ± 4.7 | 27.0 ± 4.1 |
| 8 | 197.4 ± 10.1 | 196.4 ± 8.5 * | 80.0 ± 5.0 | 77.8 ± 4.5 * | 191.4 ± 11.3 | 186.5 ± 9.9 * | 193.4 ± 11.2 | 187.7 ± 8.7* | 27.3 ± 4.3 | 27.2 ± 4.0 |
| 9 | 208.3 ± 10.2 | 204.0 ± 11.5 * | 83.2 ± 4.3 | 80.3 ± 4.7 * | 198.9 ± 9.8 | 192.7 ± 10.8 * | 200.9 ± 8.7 | 193.2 ± 9.4 * | 29.5 ± 4.7 | 28.3 ± 4.2 |
| 10 | 214.1 ± 11.2 | 212.6 ± 9.0 | 84.8 ± 4.9 | 83.5 ± 5.8 | 203.1 ± 11.2 | 199.5 ± 13.6 | 206.0 ± 10.6 | 198.3 ± 11.6 * | 29.7 ± 5.0 | 31.0 ± 5.5 |
| 11 | 223.1 ± 14.7 | 219.2 ± 10.5 | 87.5 ± 6.8 | 86.2 ± 5.9 | 208.7 ± 15.0 | 206.9 ± 13.4 | 211.2 ± 13.5 | 205.0 ± 11.9 * | 31.8 ± 6.0 | 30.9 ± 5.8 |
| 12 | 231.2 ± 13.5 | 225.6 ± 10.8 * | 91.0 ± 6.2 | 87.8 ± 4.0 * | 218.0 ± 14.1 | 211.7 ± 9.7 * | 219.2 ± 13.9 | 211.5 ± 9.7 * | 29.4 ± 4.7 | 32.6 ± 5.6 * |
| 13 | 241.9 ± 13.5 | 227.3 ± 9.2 * | 95.4 ± 6.2 | 89.6 ± 5.4 * | 228.6 ± 14.5 | 215.4 ± 11.5 * | 230.5 ± 13.9 | 215.1 ± 10.9 * | 34.6 ± 6.0 | 32.6 ± 5.9 |
| 14 | 246.2 ± 13.4 | 227.8 ± 13.0 * | 95.2 ± 5.9 | 89.6 ± 5.1 * | 229.3 ± 13.0 | 216.1 ± 11.7 * | 231.2 ± 11.9 | 214.8 ± 11.0 * | 35.1 ± 6.6 | 34.3 ± 6.2 |
| 15 | 249.2 ± 16.5 | 230.2 ± 7.5 * | 99.0 ± 5.7 | 90.0 ± 4.1 * | 237.7 ± 12.4 | 216.8 ± 9.2 * | 238.7 ± 12.5 | 217.5 ± 8.4 * | 36.1 ± 6.6 | 33.3 ± 6.0 * |
| 16 | 255.7 ± 10.0 | 232.6 ± 10.5 * | 101.8 ± 6.3 | 91.2 ± 4.5 * | 242.8 ± 12.9 | 219.9 ± 9.3 * | 243.6 ± 11.5 | 220.0 ± 7.9 * | 37.6 ± 8.1 | 32.0 ± 5.5 * |
| 17 | 251.6 ± 12.4 | 230.9 ± 9.0 * | 101.8 ± 4.2 | 91.9 ± 4.9 * | 242.3 ± 8.8 | 221.3 ± 11.3 * | 242.3 ± 8.2 | 220.6 ± 10.3 * | 35.8 ± 6.0 | 32.4 ± 5.5 * |
Disclaimer/Publisher’s Note: The statements, opinions and data contained in all publications are solely those of the individual author(s) and contributor(s) and not of MDPI and/or the editor(s). MDPI and/or the editor(s) disclaim responsibility for any injury to people or property resulting from any ideas, methods, instructions or products referred to in the content. |
© 2024 by the authors. Licensee MDPI, Basel, Switzerland. This article is an open access article distributed under the terms and conditions of the Creative Commons Attribution (CC BY) license (https://creativecommons.org/licenses/by/4.0/).
Share and Cite
Martín-Casado, L.; Palomo-Fernández, I.; Aldana-Caballero, A.; Baltasar-Fernandez, I.; Marcos-Tejedor, F. High Rate of Change of the Foot in Ecuadorian Children: The Need for Proper Shoe Design. Children 2024, 11, 749. https://doi.org/10.3390/children11060749
Martín-Casado L, Palomo-Fernández I, Aldana-Caballero A, Baltasar-Fernandez I, Marcos-Tejedor F. High Rate of Change of the Foot in Ecuadorian Children: The Need for Proper Shoe Design. Children. 2024; 11(6):749. https://doi.org/10.3390/children11060749
Chicago/Turabian StyleMartín-Casado, Laura, Inés Palomo-Fernández, Alberto Aldana-Caballero, Ivan Baltasar-Fernandez, and Felix Marcos-Tejedor. 2024. "High Rate of Change of the Foot in Ecuadorian Children: The Need for Proper Shoe Design" Children 11, no. 6: 749. https://doi.org/10.3390/children11060749
APA StyleMartín-Casado, L., Palomo-Fernández, I., Aldana-Caballero, A., Baltasar-Fernandez, I., & Marcos-Tejedor, F. (2024). High Rate of Change of the Foot in Ecuadorian Children: The Need for Proper Shoe Design. Children, 11(6), 749. https://doi.org/10.3390/children11060749