
Mental Health and Cognitive Development in Symptomatic Children and Adolescents Scoring High on Habitual Snoring: Role of Obesity and Allergy

 , , ,
, , ,  ,
,
Abstract
1. Introduction
2. Materials and Methods
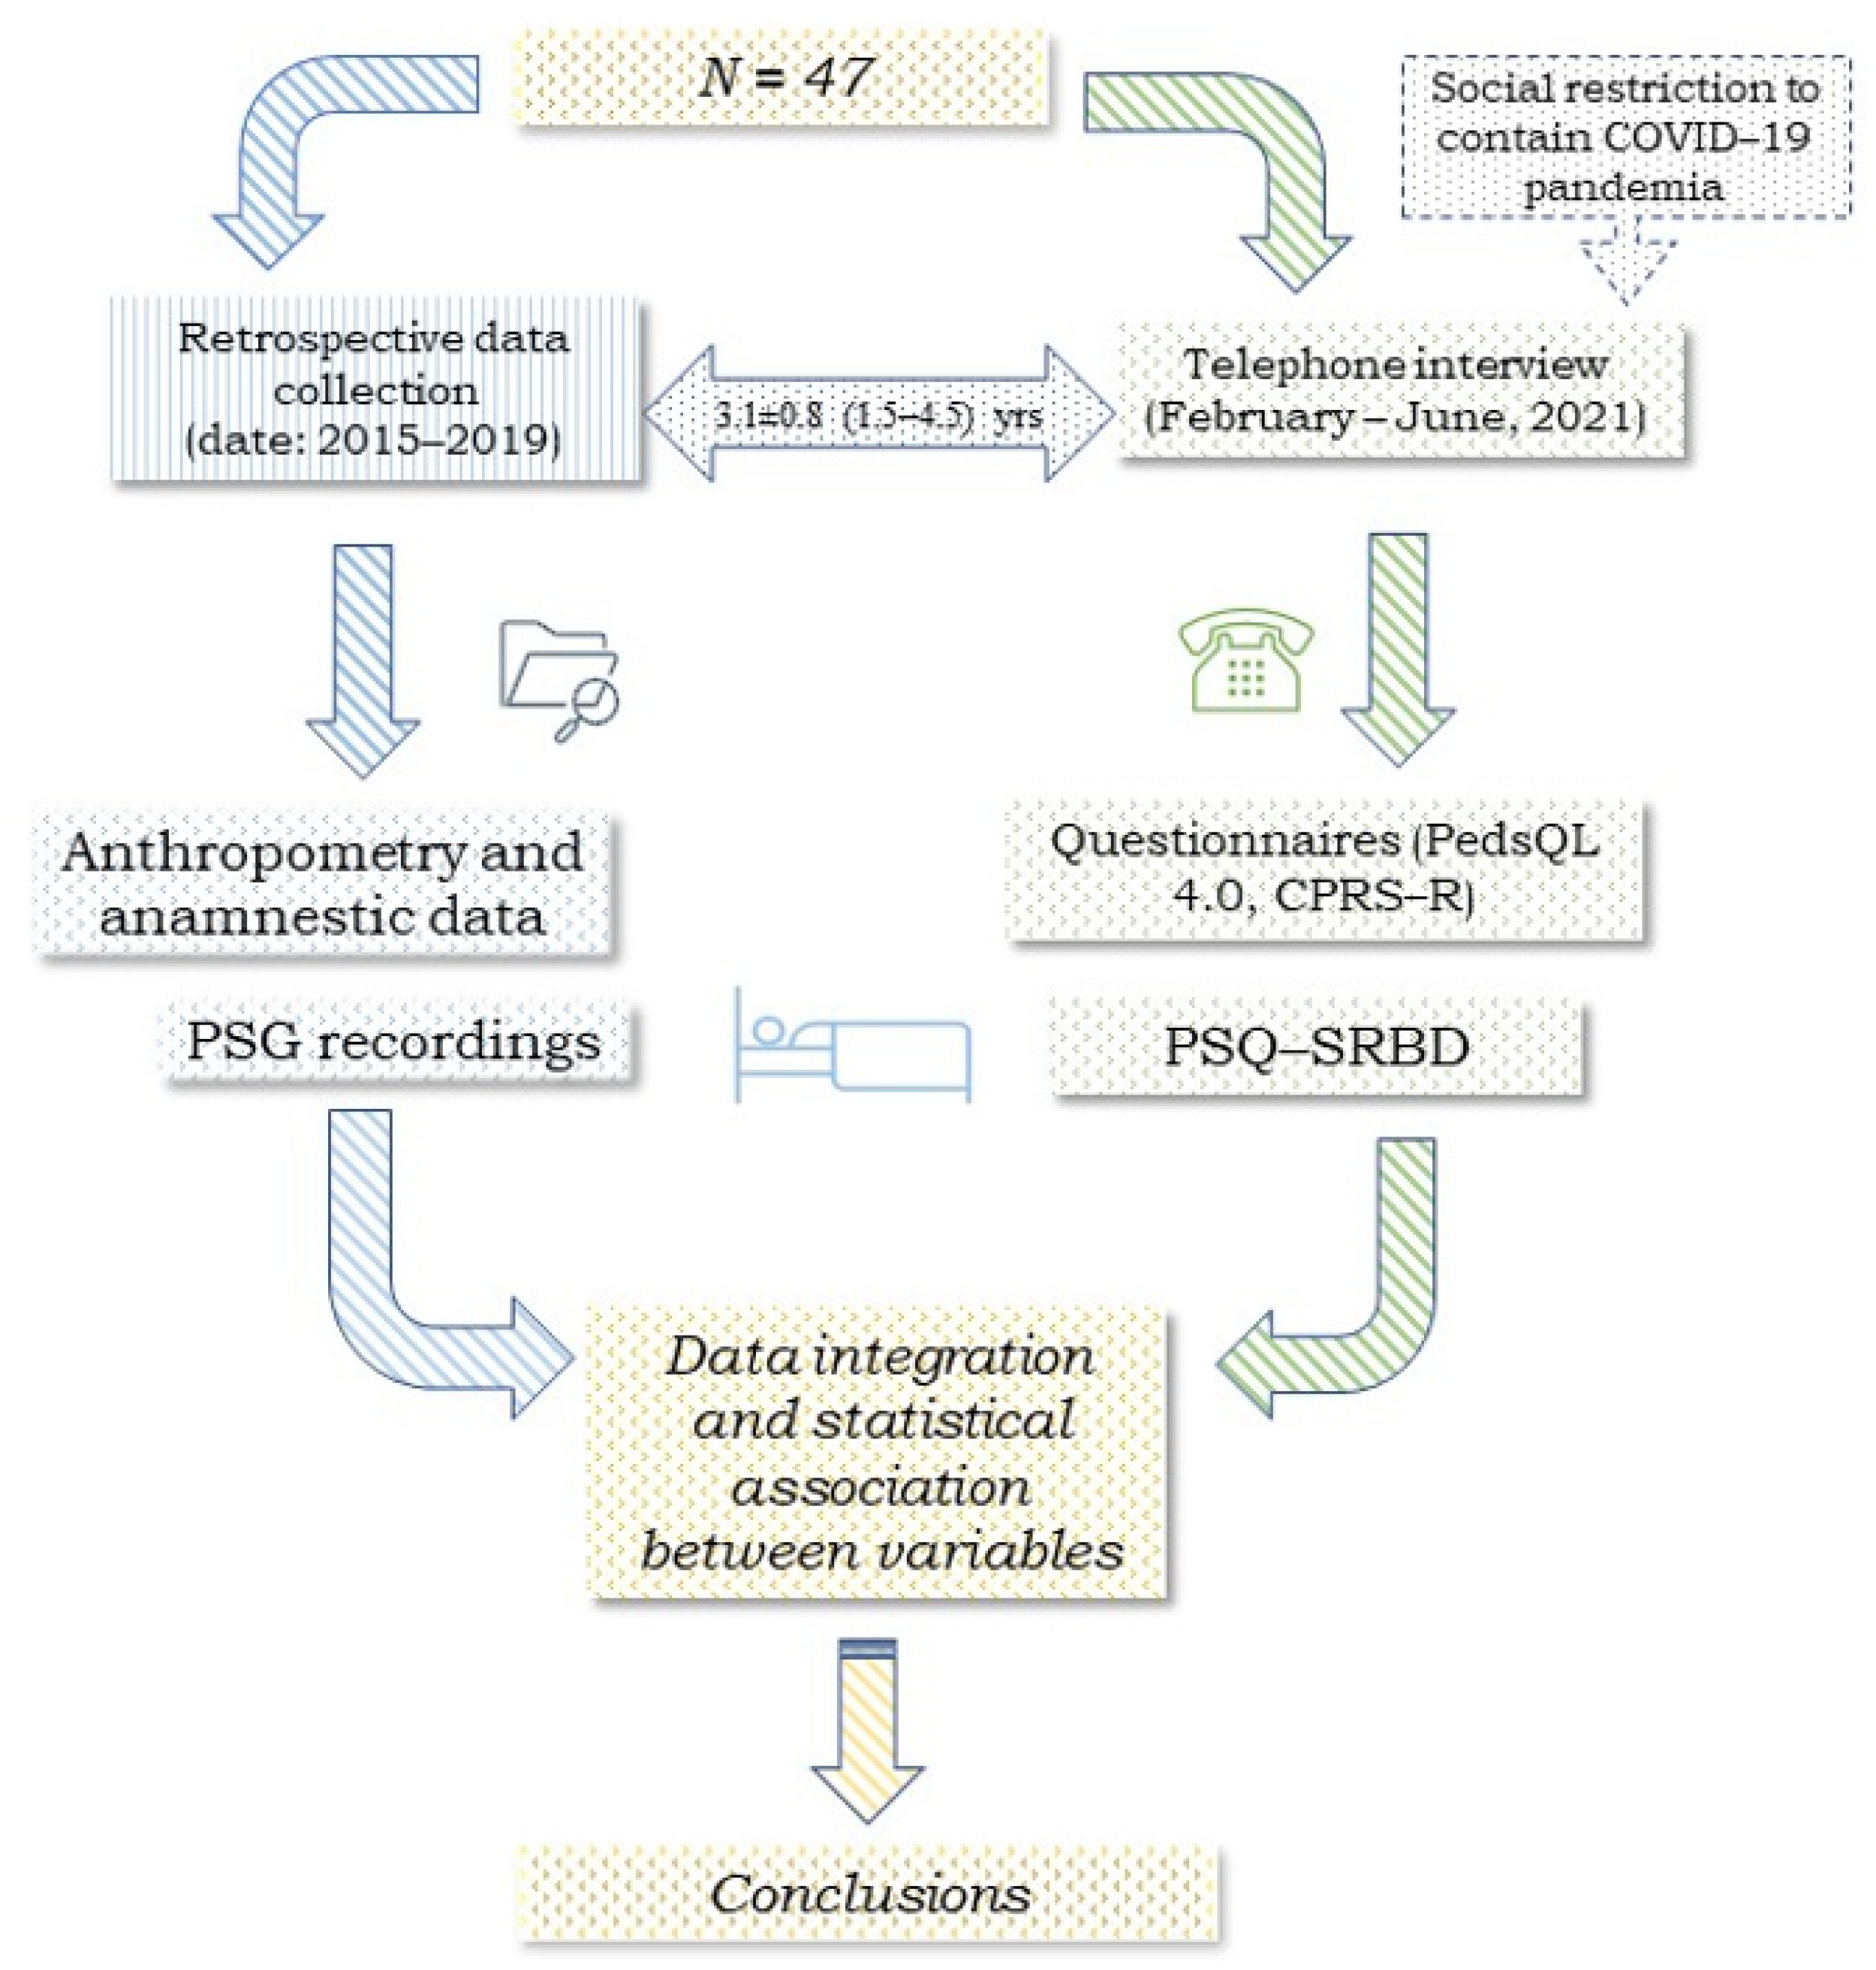
2.1. Study Population
2.2. Anthropometry
2.3. Respiratory Polysomnography
2.4. Telephone Interviews
2.5. Questionnaires
2.5.1. Pediatric Sleep Questionnaire
2.5.2. Pediatric Quality of Life Inventory
2.5.3. Conners’ Parent Rating Scales Revised
2.6. Statistical Analysis
3. Results
4. Discussion
5. Conclusions
Author Contributions
Funding
Institutional Review Board Statement
Informed Consent Statement
Data Availability Statement
Conflicts of Interest
References
- Brunetti, L.; Rana, S.; Lospalluti, M.L.; Pietrafesa, A.; Francavilla, R.; Fanelli, M.; Armenio, L. Prevalence of obstructive sleep apnea syndrome in a cohort of 1207 children of Southern Italy. Chest 2001, 120, 1930–1935. [Google Scholar] [CrossRef] [PubMed]
- Guilleminault, C.; Lee, J.H.; Chan, A. Pediatric obstructive sleep apnea syndrome. Arch. Pediatr. Adolesc. Med. 2005, 159, 775–785. [Google Scholar] [CrossRef] [PubMed]
- Tagetti, A.; Bonafini, S.; Zaffanello, M.; Benetti, M.V.; Vedove, F.D.; Gasperi, E.; Cavarzere, P.; Gaudino, R.; Piacentini, G.; Minuz, P.; et al. Sleep-disordered breathing is associated with blood pressure and carotid arterial stiffness in obese children. J. Hypertens. 2016, 35, 125–131. [Google Scholar] [CrossRef]
- Zaffanello, M.; Piacentini, G.; La Grutta, S. Beyond the growth delay in children with sleep-related breathing disorders: A systematic review. Panminerva Med. 2020, 62, 164–175. [Google Scholar] [CrossRef]
- Capdevila, O.S.; Kheirandish-Gozal, L.; Dayyat, E.; Gozal, D. Pediatric obstructive sleep apnea: Complications, management, and long-term outcomes. Proc. Am. Thorac. Soc. 2008, 5, 274–282. [Google Scholar] [CrossRef]
- Hunter, S.J.; Gozal, D.; Smith, D.L.; Philby, M.F.; Kaylegian, J.; Kheirandish-Gozal, L. Effect of Sleep-disordered Breathing Severity on Cognitive Performance Measures in a Large Community Cohort of Young School-aged Children. Am. J. Respir. Crit. Care Med. 2016, 194, 739–747. [Google Scholar] [CrossRef]
- Torres-Lopez, L.V.; Cadenas-Sanchez, C.; Migueles, J.H.; Esteban-Cornejo, I.; Molina-Garcia, P.; Hillman, C.; Catena, A.; Ortega, F.B. Does sleep-disordered breathing add to impairments in academic performance and brain structure usually observed in children with overweight/obesity? Eur. J. Pediatr. 2022, 181, 2055–2065. [Google Scholar] [CrossRef]
- Biggs, S.N.; Walter, L.M.; Jackman, A.R.; Nisbet, L.C.; Weichard, A.J.; Hollis, S.L.; Davey, M.J.; Anderson, V.; Nixon, G.M.; Horne, R.S. Long-Term Cognitive and Behavioral Outcomes following Resolution of Sleep Disordered Breathing in Preschool Children. PLoS ONE 2015, 10, e0139142. [Google Scholar] [CrossRef] [PubMed]
- Brockmann, P.E.; Gozal, D. Neurocognitive Consequences in Children with Sleep Disordered Breathing: Who Is at Risk? Children 2022, 9, 1278. [Google Scholar] [CrossRef] [PubMed]
- Berry, R.B.; Budhiraja, R.; Gottlieb, D.J.; Gozal, D.; Iber, C.; Kapur, V.K.; Marcus, C.L.; Mehra, R.; Parthasarathy, S.; Quan, S.F.; et al. Rules for scoring respiratory events in sleep: Update of the 2007 AASM Manual for the Scoring of Sleep and Associated Events. Deliberations of the Sleep Apnea Definitions Task Force of the American Academy of Sleep Medicine. J. Clin. Sleep Med. 2012, 8, 597–619. [Google Scholar] [CrossRef]
- Villa, M.P.; Pietropaoli, N.; Supino, M.C.; Vitelli, O.; Rabasco, J.; Evangelisti, M.; Del Pozzo, M.; Kaditis, A.G. Diagnosis of Pediatric Obstructive Sleep Apnea Syndrome in Settings With Limited Resources. JAMA Otolaryngol. Head Neck Surg. 2015, 141, 990–996. [Google Scholar] [CrossRef]
- Chervin, R.D.; Weatherly, R.A.; Garetz, S.L.; Ruzicka, D.L.; Giordani, B.J.; Hodges, E.K.; Dillon, J.E.; Guire, K.E. Pediatric sleep questionnaire: Prediction of sleep apnea and outcomes. Arch. Otolaryngol. Head Neck Surg. 2007, 133, 216–222. [Google Scholar] [CrossRef] [PubMed]
- Incerti Parenti, S.; Fiordelli, A.; Bartolucci, M.L.; Martina, S.; D’Antò, V.; Alessandri-Bonetti, G. Diagnostic accuracy of screening questionnaires for obstructive sleep apnea in children: A systematic review and meta-analysis. Sleep Med. Rev. 2021, 57, 101464. [Google Scholar] [CrossRef] [PubMed]
- Zaffanello, M.; Ferrante, G.; Zoccante, L.; Ciceri, M.L.; Nosetti, L.; Tenero, L.; Piazza, M.; Piacentini, G. Predictive Power of Oxygen Desaturation Index (ODI) and Apnea-Hypopnea Index (AHI) in Detecting Long-Term Neurocognitive and Psychosocial Outcomes of Sleep-Disordered Breathing in Children: A Questionnaire-Based Study. J. Clin. Med. 2023, 12, 3060. [Google Scholar] [CrossRef] [PubMed]
- Verhulst, S.L.; Van Gaal, L.; De Backer, W.; Desager, K. The prevalence, anatomical correlates and treatment of sleep-disordered breathing in obese children and adolescents. Sleep Med. Rev. 2008, 12, 339–346. [Google Scholar] [CrossRef] [PubMed]
- Vlastos, I.M.; Hajiioannou, J.K. Clinical practice: Diagnosis and treatment of childhood snoring. Eur. J. Pediatr. 2010, 169, 261–267. [Google Scholar] [CrossRef] [PubMed]
- McColley, S.A.; Carroll, J.L.; Curtis, S.; Loughlin, G.M.; Sampson, H.A. High prevalence of allergic sensitization in children with habitual snoring and obstructive sleep apnea. Chest 1997, 111, 170–173. [Google Scholar] [CrossRef]
- Styne, D.M.; Arslanian, S.A.; Connor, E.L.; Farooqi, I.S.; Murad, M.H.; Silverstein, J.H.; Yanovski, J.A. Pediatric Obesity-Assessment, Treatment, and Prevention: An Endocrine Society Clinical Practice Guideline. J. Clin. Endocrinol. Metab. 2017, 102, 709–757. [Google Scholar] [CrossRef]
- Di Cesare, M.; Sorić, M.; Bovet, P.; Miranda, J.J.; Bhutta, Z.; Stevens, G.A.; Laxmaiah, A.; Kengne, A.P.; Bentham, J. The epidemiological burden of obesity in childhood: A worldwide epidemic requiring urgent action. BMC Med. 2019, 17, 212. [Google Scholar] [CrossRef]
- Beebe, D.W.; Ris, M.D.; Kramer, M.E.; Long, E.; Amin, R. The association between sleep disordered breathing, academic grades, and cognitive and behavioral functioning among overweight subjects during middle to late childhood. Sleep 2010, 33, 1447–1456. [Google Scholar] [CrossRef]
- Chad, Z. Allergies in children. Paediatr. Child Health 2001, 6, 555–566. [Google Scholar] [CrossRef]
- Nur Husna, S.M.; Tan, H.T.; Md Shukri, N.; Mohd Ashari, N.S.; Wong, K.K. Allergic Rhinitis: A Clinical and Pathophysiological Overview. Front. Med. 2022, 9, 874114. [Google Scholar] [CrossRef] [PubMed]
- Fokkens, W.J.; Lund, V.J.; Hopkins, C.; Hellings, P.W.; Kern, R.; Reitsma, S.; Toppila-Salmi, S.; Bernal-Sprekelsen, M.; Mullol, J.; Alobid, I.; et al. European Position Paper on Rhinosinusitis and Nasal Polyps 2020. Rhinology 2020, 58, 1–464. [Google Scholar] [CrossRef] [PubMed]
- Tai, A.; Volkmer, R.; Burton, A. Association between asthma symptoms and obesity in preschool (4–5 year old) children. J. Asthma 2009, 46, 362–365. [Google Scholar] [CrossRef]
- D’Elia, C.; Gozal, D.; Bruni, O.; Goudouris, E.; Meira, E.C.M. Allergic rhinitis and sleep disorders in children—Coexistence and reciprocal interactions. J. Pediatr. 2022, 98, 444–454. [Google Scholar] [CrossRef]
- Zheng, M.; Wang, X.; Ge, S.; Gu, Y.; Ding, X.; Zhang, Y.; Ye, J.; Zhang, L. Allergic and Non-Allergic Rhinitis Are Common in Obstructive Sleep Apnea but Not Associated With Disease Severity. J. Clin. Sleep Med. 2017, 13, 959–966. [Google Scholar] [CrossRef] [PubMed]
- Papapostolou, G.; Kiotseridis, H.; Romberg, K.; Dahl, Å.; Bjermer, L.; Lindgren, M.; Aronsson, D.; Tunsäter, A.; Tufvesson, E. Cognitive dysfunction and quality of life during pollen season in children with seasonal allergic rhinitis. Pediatr. Allergy Immunol. 2021, 32, 67–76. [Google Scholar] [CrossRef] [PubMed]
- Dehlink, E.; Tan, H.L. Update on paediatric obstructive sleep apnoea. J. Thorac. Dis. 2016, 8, 224–235. [Google Scholar] [CrossRef] [PubMed]
- Chervin, R.D.; Hedger, K.; Dillon, J.E.; Pituch, K.J. Pediatric sleep questionnaire (PSQ): Validity and reliability of scales for sleep-disordered breathing, snoring, sleepiness, and behavioral problems. Sleep Med. 2000, 1, 21–32. [Google Scholar] [CrossRef]
- Ward, T.M.; Chen, M.L.; Landis, C.A.; Ringold, S.; Beebe, D.W.; Pike, K.C.; Wallace, C.A. Congruence between polysomnography obstructive sleep apnea and the pediatric sleep questionnaire: Fatigue and health-related quality of life in juvenile idiopathic arthritis. Qual. Life Res. 2017, 26, 779–788. [Google Scholar] [CrossRef]
- Varni, J.W.; Seid, M.; Kurtin, P.S. PedsQL 4.0: Reliability and validity of the Pediatric Quality of Life Inventory version 4.0 generic core scales in healthy and patient populations. Med. Care 2001, 39, 800–812. [Google Scholar] [CrossRef] [PubMed]
- Hullmann, S.E.; Ryan, J.L.; Ramsey, R.R.; Chaney, J.M.; Mullins, L.L. Measures of general pediatric quality of life: Child Health Questionnaire (CHQ), DISABKIDS Chronic Generic Measure (DCGM), KINDL-R, Pediatric Quality of Life Inventory (PedsQL) 4.0 Generic Core Scales, and Quality of My Life Questionnaire (QoML). Arthritis Care Res. 2011, 63 (Suppl. S11), S420–S430. [Google Scholar] [CrossRef] [PubMed]
- Amiri, S.; AbdollahiFakhim, S.; Lotfi, A.; Bayazian, G.; Sohrabpour, M.; Hemmatjoo, T. Effect of adenotonsillectomy on ADHD symptoms of children with adenotonsillar hypertrophy and sleep disordered breathing. Int. J. Pediatr. Otorhinolaryngol. 2015, 79, 1213–1217. [Google Scholar] [CrossRef]
- Bergeron, M.; Duggins, A.L.; Cohen, A.P.; Ishman, S.L. Comparison of Patient- and Parent-Reported Quality of Life for Patients Treated for Persistent Obstructive Sleep Apnea. Otolaryngol. Head Neck Surg. 2018, 159, 789–795. [Google Scholar] [CrossRef] [PubMed]
- Isaiah, A.; Shikara, M.; Pereira, K.D.; Das, G. Refining screening questionnaires for prediction of sleep apnea severity in children. Sleep Breath 2020, 24, 1349–1356. [Google Scholar] [CrossRef] [PubMed]
- Conners, C.K.; Sitarenios, G.; Parker, J.D.; Epstein, J.N. The revised Conners’ Parent Rating Scale (CPRS-R): Factor structure, reliability, and criterion validity. J. Abnorm. Child Psychol. 1998, 26, 257–268. [Google Scholar] [CrossRef]
- Dekking, F.M. A Modern Introduction to Probability and Statistics: Understanding Why and How; Springer: Berlin/Heidelberg, Germany, 2005. [Google Scholar]
- Greenland, S.; Senn, S.J.; Rothman, K.J.; Carlin, J.B.; Poole, C.; Goodman, S.N.; Altman, D.G. Statistical tests, p values, confidence intervals, and power: A guide to misinterpretations. Eur. J. Epidemiol. 2016, 31, 337–350. [Google Scholar] [CrossRef]
- Trosman, I.; Trosman, S.J. Cognitive and Behavioral Consequences of Sleep Disordered Breathing in Children. Med. Sci. 2017, 5, 30. [Google Scholar] [CrossRef]
- Liang, J.; Matheson, B.E.; Kaye, W.H.; Boutelle, K.N. Neurocognitive correlates of obesity and obesity-related behaviors in children and adolescents. Int. J. Obes. 2014, 38, 494–506. [Google Scholar] [CrossRef]
- Tsai, C.L.; Chen, F.C.; Pan, C.Y.; Tseng, Y.T. The Neurocognitive Performance of Visuospatial Attention in Children with Obesity. Front. Psychol. 2016, 7, 1033. [Google Scholar] [CrossRef]
- Dennis, E.; Manza, P.; Volkow, N.D. Socioeconomic status, BMI, and brain development in children. Transl. Psychiatry 2022, 12, 33. [Google Scholar] [CrossRef] [PubMed]
- Meo, S.A.; Altuwaym, A.A.; Alfallaj, R.M.; Alduraibi, K.A.; Alhamoudi, A.M.; Alghamdi, S.M.; Akram, A. Effect of Obesity on Cognitive Function among School Adolescents: A Cross-Sectional Study. Obes. Facts 2019, 12, 150–156. [Google Scholar] [CrossRef]
- Konstantinopoulou, S.; Tapia, I.E.; Kim, J.Y.; Xanthopoulos, M.S.; Radcliffe, J.; Cohen, M.S.; Hanna, B.D.; Pipan, M.; Cielo, C.; Thomas, A.J.; et al. Relationship between obstructive sleep apnea cardiac complications and sleepiness in children with Down syndrome. Sleep Med. 2016, 17, 18–24. [Google Scholar] [CrossRef]
- Watach, A.J.; Radcliffe, J.; Xanthopoulos, M.S.; Novick, M.B.; Sawyer, A.M. Executive Function Impairments in Adolescents With Obesity and Obstructive Sleep Apnea Syndrome. Biol. Res. Nurs. 2019, 21, 377–383. [Google Scholar] [CrossRef] [PubMed]
- Menzies, B.; Teng, A.; Burns, M.; Lah, S. Neurocognitive outcomes of children with sleep disordered breathing: A systematic review with meta-analysis. Sleep Med. Rev. 2022, 63, 101629. [Google Scholar] [CrossRef]
- Isaiah, A.; Ernst, T.; Cloak, C.C.; Clark, D.B.; Chang, L. Association Between Habitual Snoring and Cognitive Performance Among a Large Sample of Preadolescent Children. JAMA Otolaryngol. Head Neck Surg. 2021, 147, 426–433. [Google Scholar] [CrossRef] [PubMed]
- Giordani, B.; Hodges, E.K.; Guire, K.E.; Ruzicka, D.L.; Dillon, J.E.; Weatherly, R.A.; Garetz, S.L.; Chervin, R.D. Neuropsychological and behavioral functioning in children with and without obstructive sleep apnea referred for tonsillectomy. J. Int. Neuropsychol. Soc. 2008, 14, 571–581. [Google Scholar] [CrossRef]
- Calhoun, S.L.; Mayes, S.D.; Vgontzas, A.N.; Tsaoussoglou, M.; Shifflett, L.J.; Bixler, E.O. No relationship between neurocognitive functioning and mild sleep disordered breathing in a community sample of children. J. Clin. Sleep Med. 2009, 5, 228–234. [Google Scholar] [CrossRef]
- Csábi, E.; Gaál, V.; Hallgató, E.; Schulcz, R.A.; Katona, G.; Benedek, P. Increased behavioral problems in children with sleep-disordered breathing. Ital. J. Pediatr. 2022, 48, 173. [Google Scholar] [CrossRef]
- Hagström, K.; Saarenpää-Heikkilä, O.; Himanen, S.L.; Lampinlampi, A.M.; Rantanen, K. Neurobehavioral Outcomes in School-Aged Children with Primary Snoring. Arch. Clin. Neuropsychol. 2020, 35, 401–412. [Google Scholar] [CrossRef]
- Blunden, S.; Lushington, K.; Lorenzen, B.; Martin, J.; Kennedy, D. Neuropsychological and psychosocial function in children with a history of snoring or behavioral sleep problems. J. Pediatr. 2005, 146, 780–786. [Google Scholar] [CrossRef] [PubMed]
- Owens, J.; Spirito, A.; Marcotte, A.; McGuinn, M.; Berkelhammer, L. Neuropsychological and Behavioral Correlates of Obstructive Sleep Apnea Syndrome in Children: A Preliminary Study. Sleep Breath 2000, 4, 67–78. [Google Scholar] [CrossRef] [PubMed]


| Normal Weight (n = 29) | Overweight (n = 18) | Mann–Whitney U Test | Non-Allergic (n = 34) | Allergic (n = 13) | Mann–Whitney U Test | |||||
|---|---|---|---|---|---|---|---|---|---|---|
| Mean (SD) | Min–Max | Mean (SD) | Range | p-Value | Mean (SD) | Range | Mean (SD) | Range | ||
| No. (males %) | 62 | - | 72.2 | - | 0.349 [chi square] | 64.7 | - | 69.2 | 0.527 [chi square] | |
| Age at PSG (years) | 5.0 (2.7) | 2.0–11.1 | 7.1 (2.4) | 3.1–13.8 | 0.005 | 5.5 (3.0) | 2–13.8 | 6.4 (2.1) | 2.9–11.0 | 0.183 |
| Weight (kg) | 17.8 (6.7) | 6.5–39 | 34.9 (19.3) | 17–102 | <0.001 | 23.5 (17.0) | 6.5–102 | 26.8 (10.3) | 13–51 | 0.070 |
| Height (cm) | 106.8 (18.5) | 62–145 | 123 (18.0) | 93–173 | 0.004 | 110.5 (21.0) | 62–173 | 119.4 (15.0) | 90–149 | 0.060 |
| BMI (kg/m2) | 15.2 (1.5) | 12.5–18.5 | 21.6 (4.7) | 16.8–34.1 | <0.001 | 17.5 (4.7) | 12.5–34.1 | 18.0 (3.6) | 13.3–26.7 | 0.385 |
| BMI Z-score | −0.72 (1.39) | −3.80–0.80 | 1.9 (0.6) | 1.0–2.9 | <0.001 | 0.06 (1.79) | −3.80–2.9 | 0.87 (1.41) | −2.60–2.80 | 0.147 |
| BMI percentile | 37.5 (29.1) | 0.1–80 | 94.6 (5.2) | 84.4–99.8 | <0.001 | 54.2 (37.4) | 0.1–99.8 | 73.1 (29.9) | 0.5–99.7 | 0.150 |
| Normal Weight (n = 29) | Overweight (n = 18) | Mann–Whitney U Test | Not-Allergic (n = 34) | Allergic (n = 13) | Mann–Whitney U Test | |||||
|---|---|---|---|---|---|---|---|---|---|---|
| Mean (SD) | Range | Mean (SD) | Range | p | Mean (SD) | Range | Mean (SD) | Range | ||
| Duration of recording (h) | 9.4 (1.0) | 7.2–11.0 | 9.1 (0.7) | 8.1–11.0 | 0.096 | 9.3 (0.9) | 7.6–11 | 93.2 (0.9) | 7.2–11.0 | 0.886 |
| OA (Events/h) | 3.5 (5.4) | 0–22 | 2.6 (3.0) | 0–10.4 | 0.974 | 3.3 (5.3) | 0.0–22.0 | 2.8 (1.9) | 0.2–7.5 | 0.091 |
| oAHI (Events/h) | 5.5 (6.8) | 0–24.6 | 3.9 (3.3) | 0.2–12.5 | 0.878 | 7.0 (7.1) | 0.1–29.7 | 6.2 (2.2) | 1.0–9.8 | 0.140 |
| ODI (Events/h) | 3.5 (4.9) | 0.1–23.4 | 2.8 (2.5) | 0.4–8.3 | 0.577 | 3.4 (4.5) | 0.1–23.4 | 2.8 (2.7) | 0.1–8.3 | 0.991 |
| SpO2 minimum (%) | 89.4 (4.5) | 77–95 | 86.6 (10.1) | 51–94 | 0.509 | 87.9 (8.1) | 51–95 | 89.4 (4.2) | 78–94 | 0.848 |
| SpO2 < 90% (% eTST) | 0.27 (0.80) | 0–4.2 | 0.3 (0.8) | 0.0–3.3 | 0.776 | 0.25 (0.74) | 0.0–4.2 | 0.39 (0.97) | 0.0 -3.3 | 0.670 |
| Snoring (% eTST) | 1.5 (4.4) | 0.1–22.1 | 1.7 (5.0) | 0.1–21.4 | 0.243 | 2.11 (5.3) | 0.1–22.1 | 0.07 (0.12) | 0.1–0.4 | 0.661 |
| Normal Weight (n = 29) | Overweight (n = 18) | Mann–Whitney U Test | Not-Allergic | Allergic | Mann–Whitney U Test | |||||
|---|---|---|---|---|---|---|---|---|---|---|
| Mean (SD) | Range | Mean (SD) | Min–Max | p-Value | Mean (SD) | Range | Mean (SD) | Range | ||
| Age at follow-up (years) | 8.2 (2.6) | 4.1–14.2 | 10.1 (2.5) | 5.6–15.3 | <0.001 | 8.7 (3.0) | 4.1–15.3 | 9.6 (1.6) | 6.7–12.8 | 0.191 |
| Length follow-up (years) | 3.2 (0.7) | 1.7–4.5 | 3.0 (0.9) | 1.5–4.5 | 0.099 | 3.2 (0.7) | 1.5–4.5 | 3.1 (0.9) | 1.8–4.5 | 0.521 |
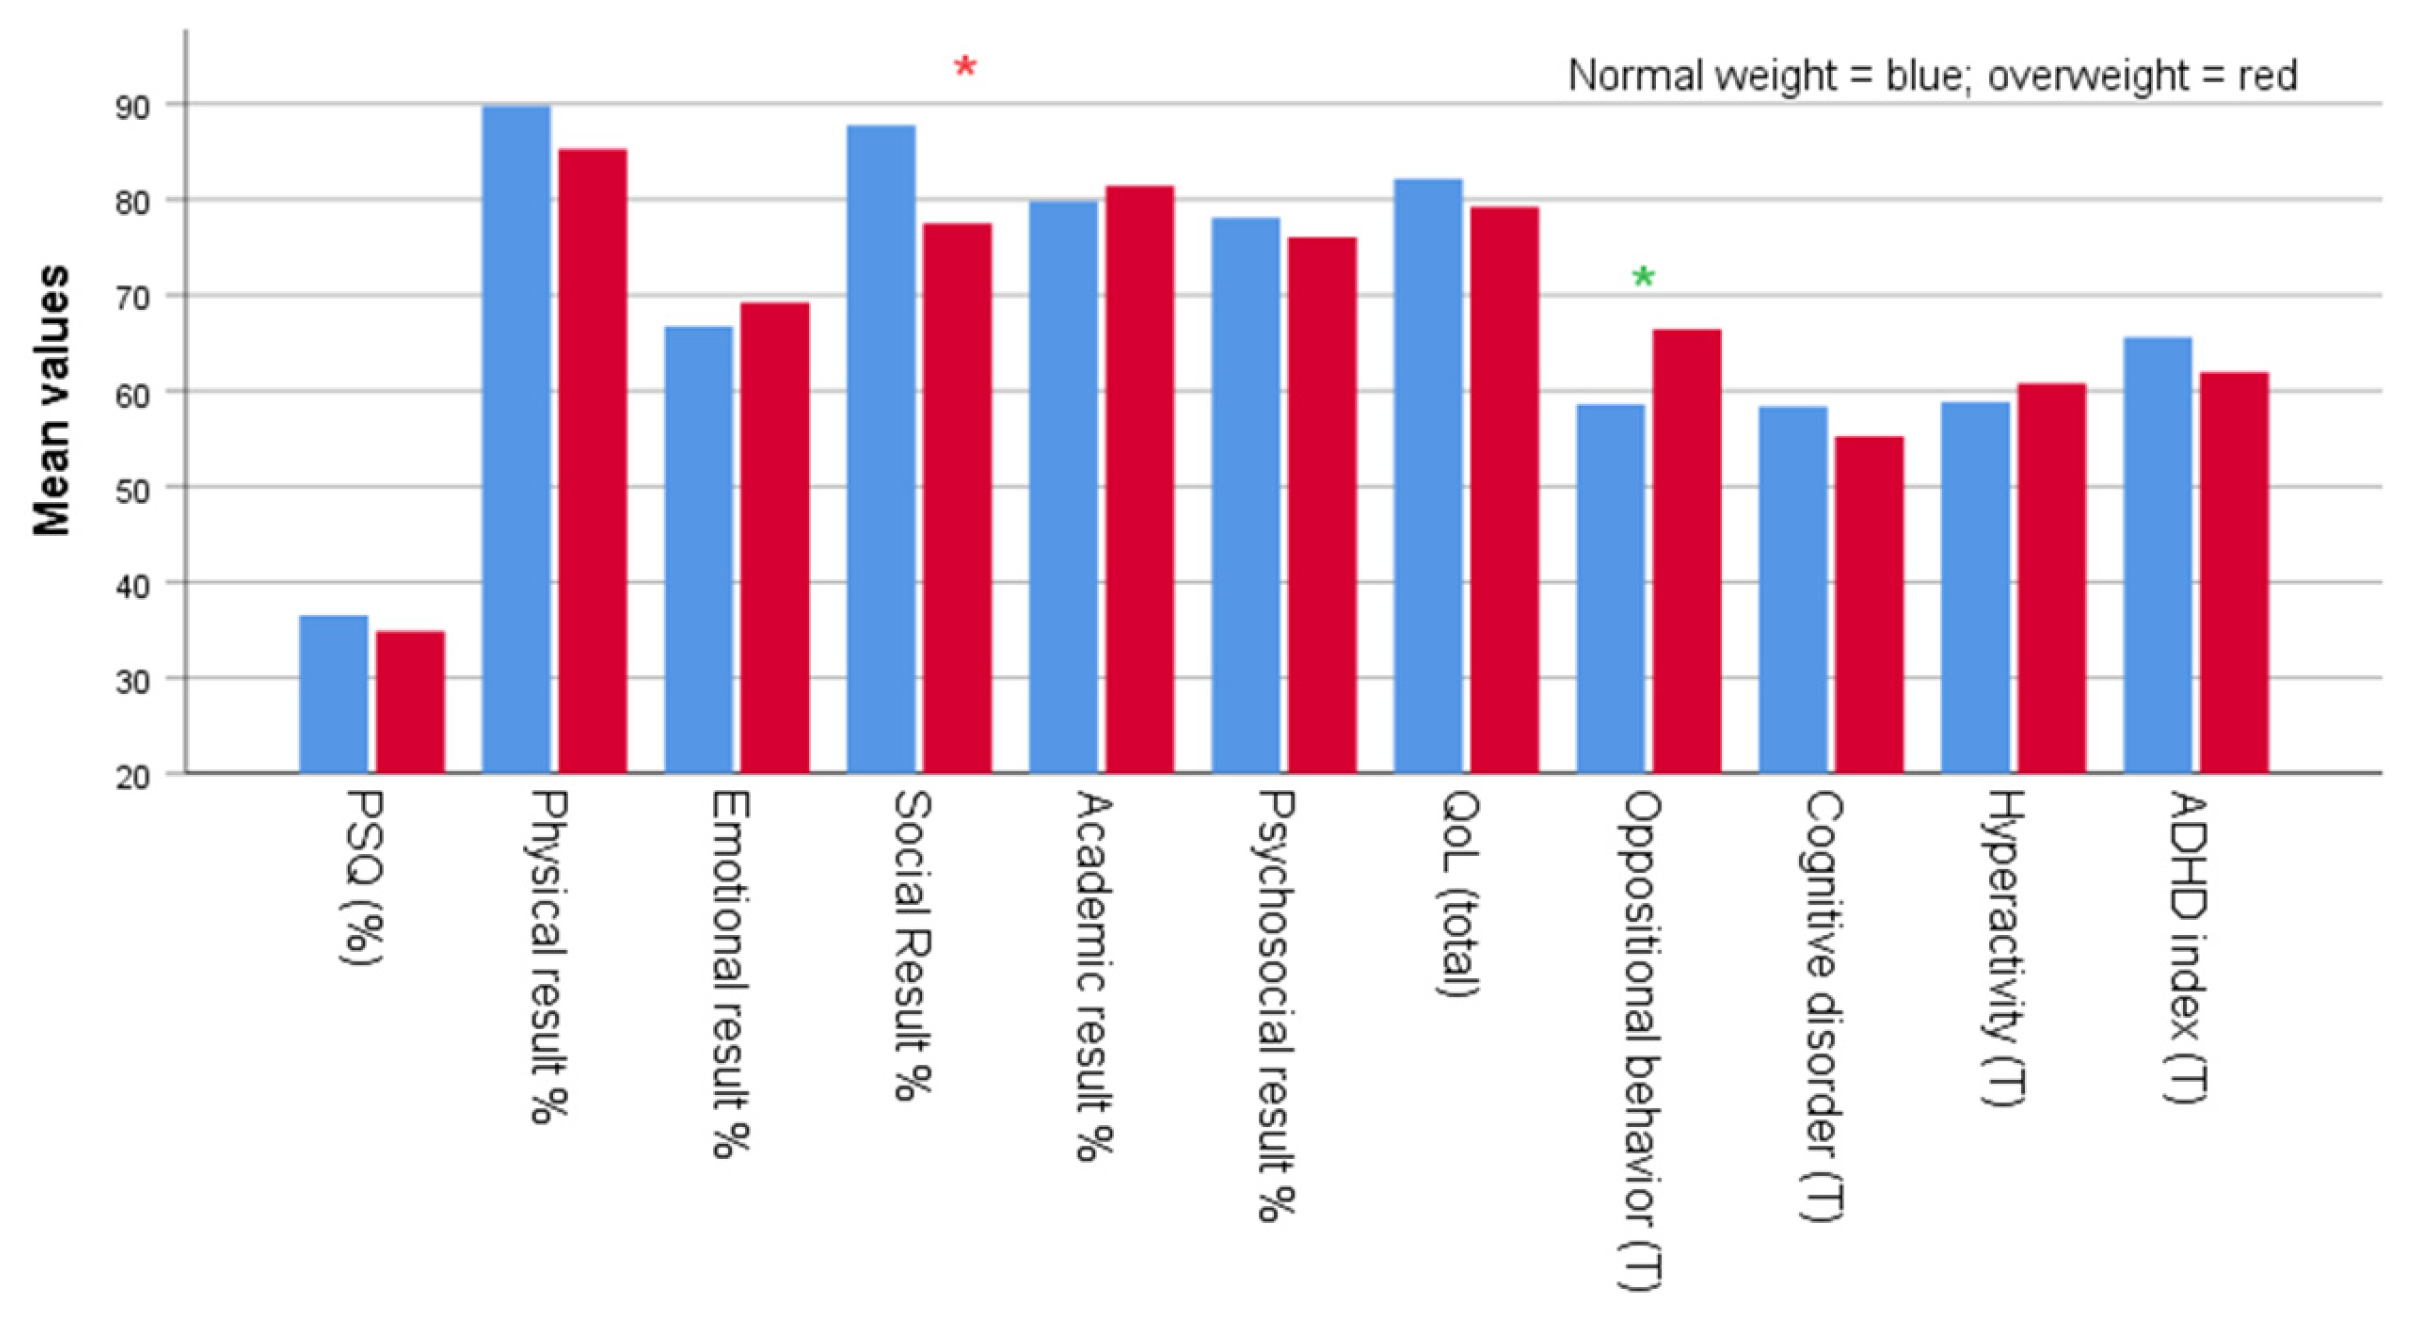
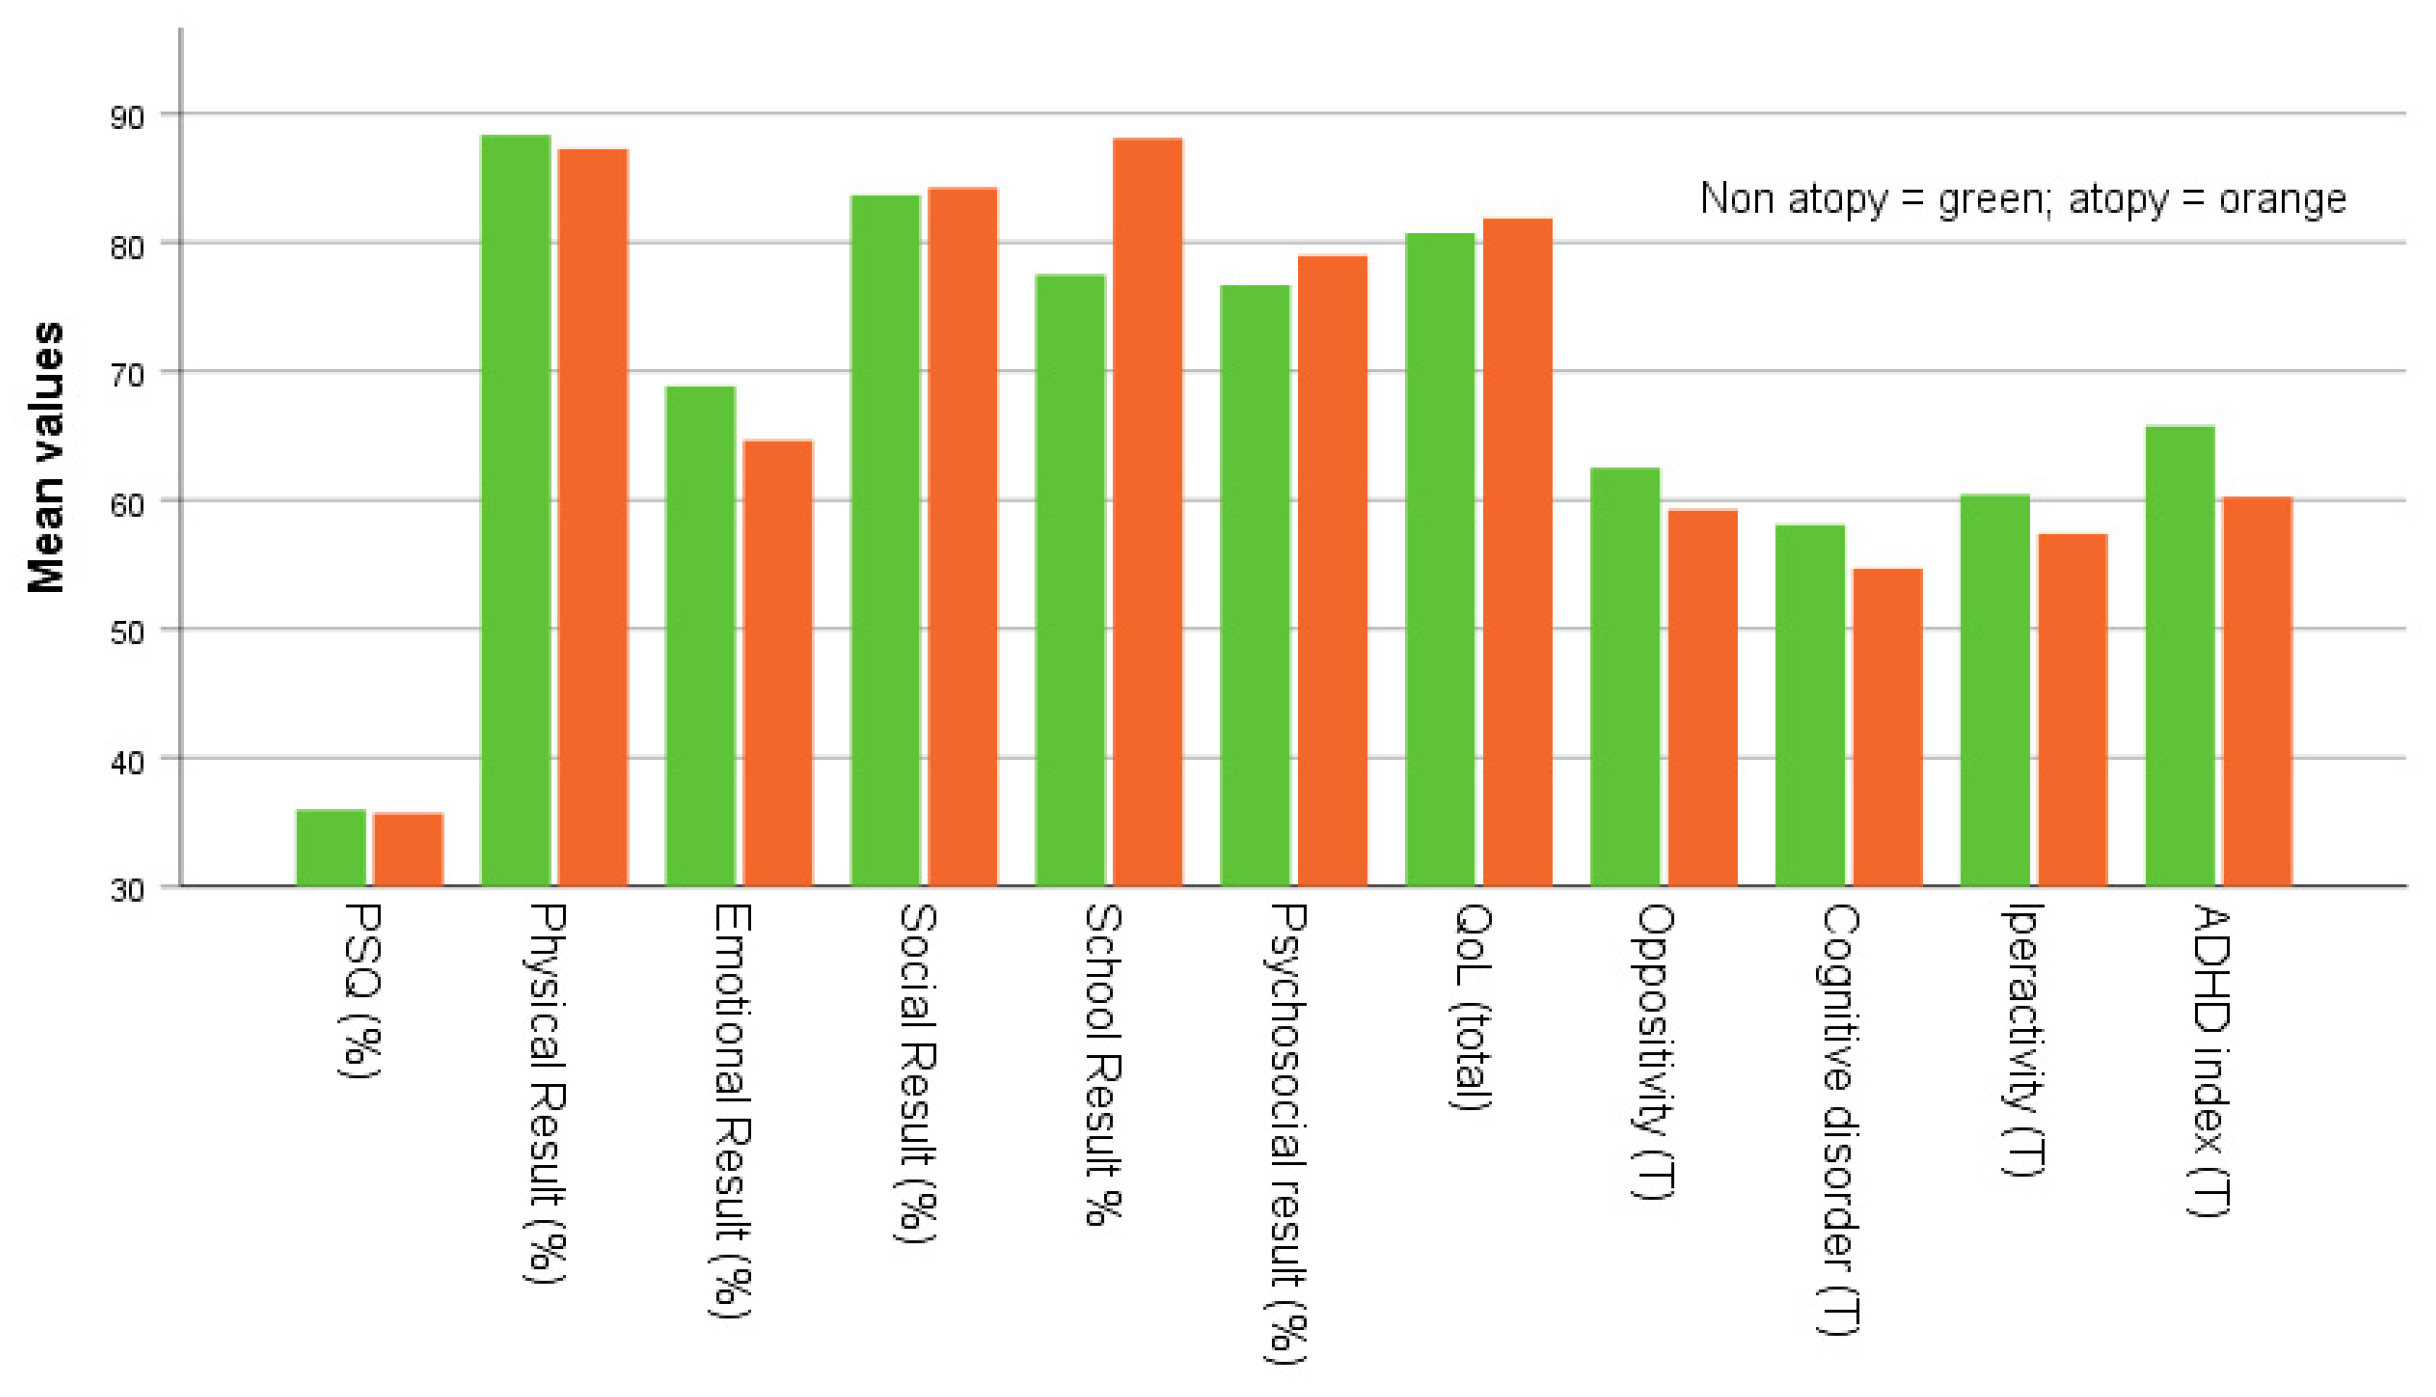
| PSQ (%) | 36.5 (20.7) | 0–77.3 | 34.8 (18.2) | 9.1–68.2 | 0.775 | 36.0 (20.6) | 0.0–77.3 | 35.7 (17.5) | 9.1–72.7 | 0.962 |
| Physical score % | 89.8 (12.9) | 46.9–100 | 85.2 (13.0) | 59.4–100 | 0.208 | 88.3 (13.5) | 46.9–100 | 87.3 (12.0) | 68.8–100 | 0.681 |
| Emotional score % | 66.7 (15.6) | 30–100 | 69.2 (16.9) | 30–90 | 0.501 | 68.8 (15.9) | 30–100 | 64.6 (16.5) | 30–90 | 0.556 |
| Social score % | 87.8 (16.2) | 45–100 | 77.5 (20.1) | 35–100 | 0.039 | 83.7 (19.2) | 35–100 | 84.2 (16.3) | 55–100 | 0.942 |
| Academic score % | 79.8 (18.5) | 40–100 | 81.4 (21.2) | 25–100 | 0.601 | 77.5 (20.5) | 25–100 | 88.1 (14.1) | 50–100 | 0.116 |
| Psychosocial score % | 78.1 (13.6) | 46.7–93.3 | 76.0 (16.6) | 30–96.7 | 0.733 | 93.3 (76.7) | 30–93.3 | 79.0 (13.7) | 46.7–96.7 | 0.793 |
| QoL total % | 82.2 (12.5) | 52.2–95.7 | 79.2 (14.1) | 47.8–95.7 | 0.518 | 80.7 (13.7) | 47.8–95.7 | 81.9 (11.8) | 54.3–95.7 | 0.981 |
| Oppositional behavior (T score) | 58.6 (13.4) | 38–88 | 66.4 (15.1) | 49–98 | 0.082 | 62.5 (15.4) | 38–98 | 59.2 (11.7) | 46–88 | 0.584 |
| Cognitive performance (T score) | 58.3 (15.3) | 41–94 | 55.2 (16.2) | 41–95 | 0.346 | 58.1 (15.8) | 41–95 | 54.7 (15.2) | 41–94 | 0.575 |
| Hyperactivity (T score) | 58.8 (13.6) | 39–82 | 60.8 (15.1) | 42–84 | 0.677 | 60.4 (14.1) | 39–84 | 57.4 (14.2) | 40–83 | 0.497 |
| ADHD Index (T score) | 65.6 (15.6) | 42–94 | 61.9 (13.8) | 38–90 | 0.490 | 65.7 (15.0) | 42–94 | 60.2 (14.3) | 38–83 | 0.239 |
| Variables in the Model | T | S.E. | Wald | p-Value | Exp(B) | 95% CI for B (Lower Limit) | 95% CI for B (Upper Limit) | |
|---|---|---|---|---|---|---|---|---|
| Dependent variable: retrospective normal weight = 0, overweight/obese = 1 status | ||||||||
| Retrospective age at PSG recording (years), allergy (no, yes), oAHI, ODI, minimum SpO2, SpO2 time < 90%, snoring (% TST), PSQ % at follow-up | Age at PSG recording (years) | 0.306 | 0.129 | 5.633 | 0.018 | 1.358 | 1.055 | 1.747 |
| Age at follow-up (years), follow-up time (years), retrospective allergic status (no, yes), and PSQ (%), physical performance, emotional outcomes, psychosocial outcomes, total QoL, oppositional behavior T-points, cognitive disorders T-points, hyperactivity T-points, ADHD T-point index at follow-up. | Age (years) | 0.413 | 0.197 | 4.384 | 0.036 | 1.511 | 1.027 | 2.223 |
| Allergy (No, yes) | −1.683 | 0.994 | 2.868 | 0.090 | 0.186 | 0.026 | 1.303 | |
| Emotional disorders | 0.079 | 0.039 | 4.132 | 0.042 | 1.082 | 1.003 | 1.168 | |
| Oppositional behavior | 0.086 | 0.035 | 5.592 | 0.015 | 1.090 | 1.017 | 1.168 | |
| Social disorders | −0.117 | 0.046 | 6.592 | 0.010 | 0.890 | 0.814 | 0.981 | |
| Cognitive disorders | −0.112 | 0.052 | 4.587 | 0.032 | 0.894 | 0.806 | 0.991 | |
| Dependent variable: retrospective non-allergic = 0, allergic = 1 status | ||||||||
| Retrospective age at PSG recording (years), weight (normal, overweight), OAHI, ODI, minimum SpO2, SpO2 time < 90%, snoring (% TST), PSQ % at follow-up | None | |||||||
| Age at follow-up (years), follow-up time (years), retrospective weight (normal, overweight) status, and PSQ (%), physical performance, emotional outcomes, psychosocial outcomes, total QoL, oppositional behavior (T), cognitive disorders (T), hyperactivity (T), ADHD index (T) at follow-up. | Emotional disorders | −0.052 | 0.029 | 3.278 | 0.070 | 0.950 | 0.888 | 1.004 |
| Academic achievement | 0.060 | 0.028 | 4.594 | 0.032 | 1.061 | 1.005 | 1.121 |
Disclaimer/Publisher’s Note: The statements, opinions and data contained in all publications are solely those of the individual author(s) and contributor(s) and not of MDPI and/or the editor(s). MDPI and/or the editor(s) disclaim responsibility for any injury to people or property resulting from any ideas, methods, instructions or products referred to in the content. |
© 2023 by the authors. Licensee MDPI, Basel, Switzerland. This article is an open access article distributed under the terms and conditions of the Creative Commons Attribution (CC BY) license (https://creativecommons.org/licenses/by/4.0/).
Share and Cite
Zaffanello, M.; Pietrobelli, A.; Zoccante, L.; Ferrante, G.; Tenero, L.; Piazza, M.; Ciceri, M.L.; Nosetti, L.; Piacentini, G. Mental Health and Cognitive Development in Symptomatic Children and Adolescents Scoring High on Habitual Snoring: Role of Obesity and Allergy. Children 2023, 10, 1183. https://doi.org/10.3390/children10071183
Zaffanello M, Pietrobelli A, Zoccante L, Ferrante G, Tenero L, Piazza M, Ciceri ML, Nosetti L, Piacentini G. Mental Health and Cognitive Development in Symptomatic Children and Adolescents Scoring High on Habitual Snoring: Role of Obesity and Allergy. Children. 2023; 10(7):1183. https://doi.org/10.3390/children10071183
Chicago/Turabian StyleZaffanello, Marco, Angelo Pietrobelli, Leonardo Zoccante, Giuliana Ferrante, Laura Tenero, Michele Piazza, Marco Luigi Ciceri, Luana Nosetti, and Giorgio Piacentini. 2023. "Mental Health and Cognitive Development in Symptomatic Children and Adolescents Scoring High on Habitual Snoring: Role of Obesity and Allergy" Children 10, no. 7: 1183. https://doi.org/10.3390/children10071183
APA StyleZaffanello, M., Pietrobelli, A., Zoccante, L., Ferrante, G., Tenero, L., Piazza, M., Ciceri, M. L., Nosetti, L., & Piacentini, G. (2023). Mental Health and Cognitive Development in Symptomatic Children and Adolescents Scoring High on Habitual Snoring: Role of Obesity and Allergy. Children, 10(7), 1183. https://doi.org/10.3390/children10071183