
Analysis of an Association between Preterm Birth and Parental Educational Level in Japan Using National Data


Abstract
:1. Introduction
2. Materials and Methods
2.1. Data Used in This Study
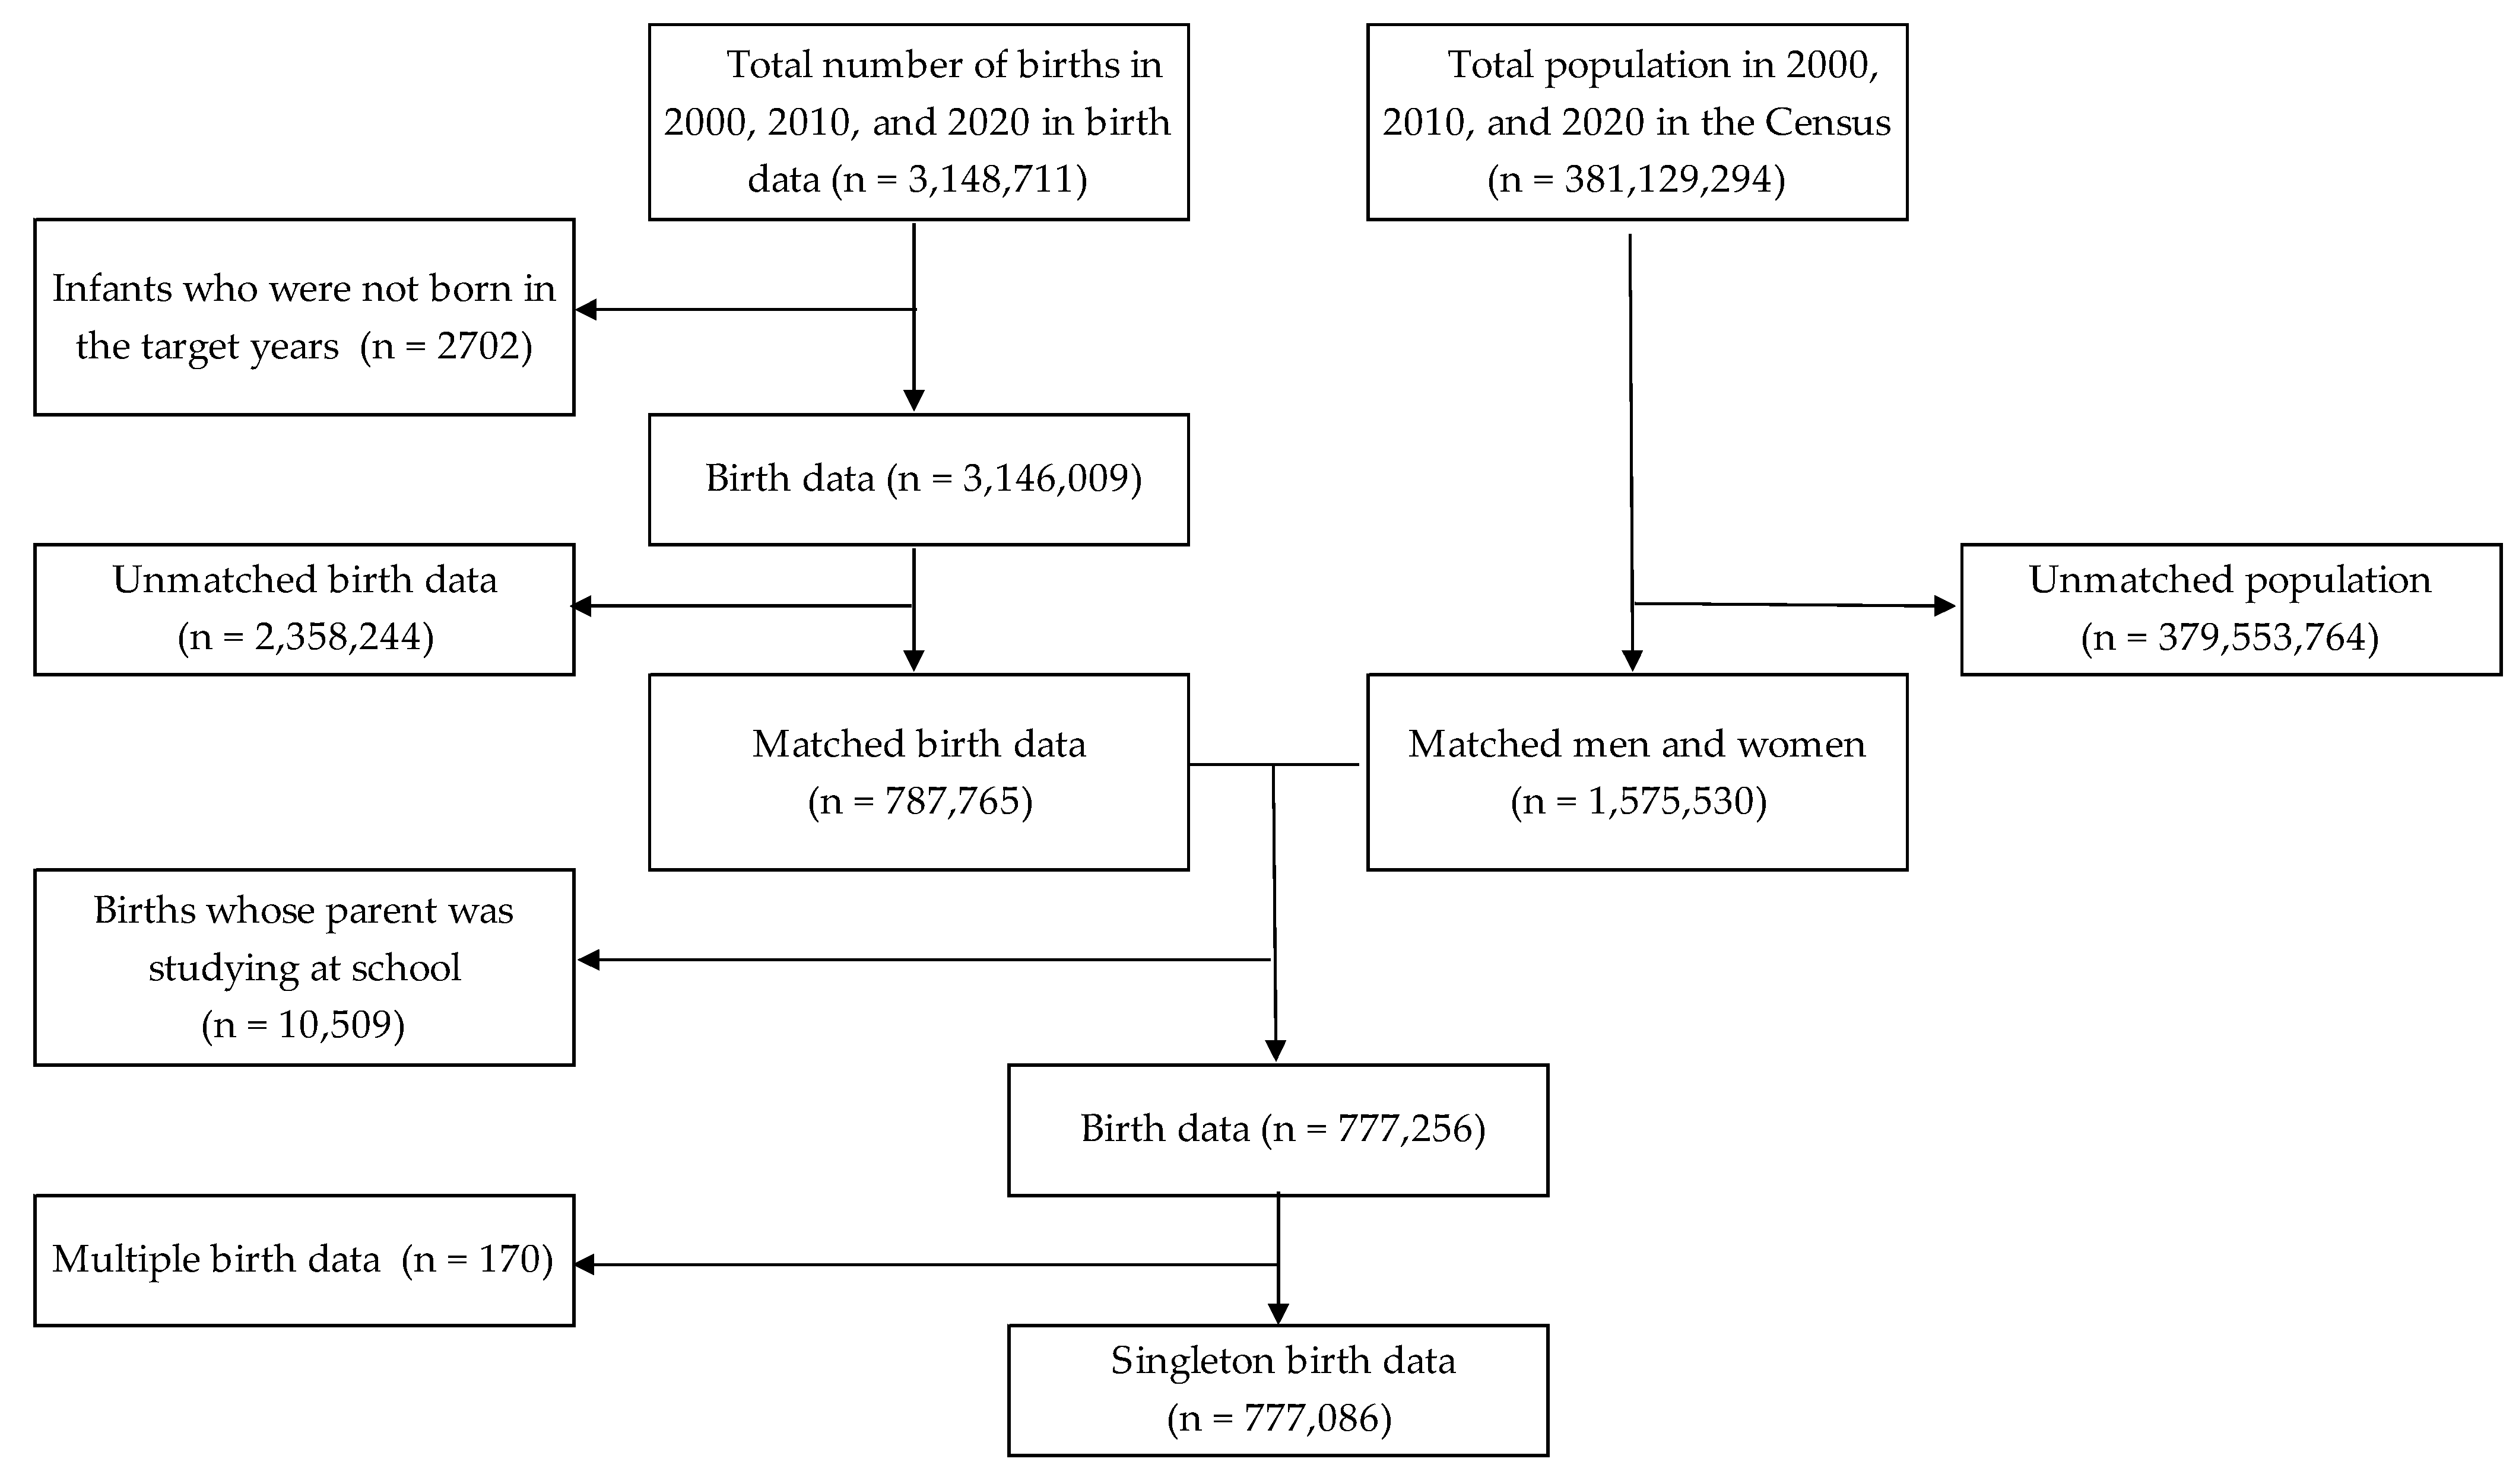
2.2. Data Linkage
2.3. Statistical Analysis
2.3.1. Descriptive Analysis
2.3.2. Inequality Indexes
2.3.3. Other Points
3. Results
4. Discussion
5. Conclusions
Supplementary Materials
Funding
Institutional Review Board Statement
Informed Consent Statement
Data Availability Statement
Conflicts of Interest
References
- Callaghan, W.M.; MacDorman, M.F.; Rasmussen, S.A.; Qin, C.; Lackritz, E.M. The Contribution of Preterm Birth to Infant Mortality Rates in the United States. Pediatrics 2006, 118, 1566–1573. [Google Scholar] [CrossRef] [PubMed]
- Dhaded, S.M.; Saleem, S.; Goudar, S.S.; Tikmani, S.S.; Hwang, K.; Guruprasad, G.; Aradhya, G.H.; Kusagur, V.B.; Patil, L.G.C.; Yogeshkumar, S.; et al. The causes of preterm neonatal deaths in India and Pakistan (PURPOSe): A prospective cohort study. Lancet Glob. Health 2022, 10, e1575–e1581. [Google Scholar] [CrossRef] [PubMed]
- Cao, G.; Liu, J.; Liu, M. Global, Regional, and National Incidence and Mortality of Neonatal Preterm Birth, 1990–2019. JAMA Pediatr. 2022, 176, 787–796. [Google Scholar] [CrossRef] [PubMed]
- Sakata, S.; Konishi, S.; Ng, C.F.S.; Watanabe, C. Preterm birth rates in Japan from 1979 to 2014: Analysis of national vital statistics. J. Obstet. Gynaecol. Res. 2017, 44, 390–396. [Google Scholar] [CrossRef] [PubMed]
- Okui, T.; Nakashima, N. Analysis of Differences in Preterm Birth Rates According to Household Occupation in Japan from 2007 to 2019. J. Prev. Med. Public Health 2022, 55, 371–378. [Google Scholar] [CrossRef] [PubMed]
- Ananth, C.V.; Misra, D.P.; Demissie, K.; Smulian, J.C. Rates of Preterm Delivery among Black Women and White Women in the United States over Two Decades: An Age-Period-Cohort Analysis. Am. J. Epidemiol. 2001, 154, 657–665. [Google Scholar] [CrossRef] [PubMed]
- Jansen, P.; Tiemeier, H.; Jaddoe, V.; Hofman, A.; Steegers, E.; Verhulst, F.; MacKenbach, J.; Raat, H. Explaining educational inequalities in preterm birth: The generation r study. Arch. Dis. Child.-Fetal Neonatal Ed. 2008, 94, F28–F34. [Google Scholar] [CrossRef] [PubMed]
- Wallace, M.E.; Mendola, P.; Chen, Z.; Hwang, B.S.; Grantz, K.L. Preterm Birth in the Context of Increasing Income Inequality. Matern. Child Health J. 2015, 20, 164–171. [Google Scholar] [CrossRef] [PubMed]
- Tamura, N.; Hanaoka, T.; Ito, K.; Araki, A.; Miyashita, C.; Ito, S.; Minakami, H.; Cho, K.; Endo, T.; Sengoku, K.; et al. Different Risk Factors for Very Low Birth Weight, Term-Small-for-Gestational-Age, or Preterm Birth in Japan. Int. J. Environ. Res. Public Health 2018, 15, 369. [Google Scholar] [CrossRef] [PubMed]
- Shiozaki, A.; Yoneda, S.; Nakabayashi, M.; Takeda, Y.; Takeda, S.; Sugimura, M.; Yoshida, K.; Tajima, A.; Manabe, M.; Akagi, K.; et al. Multiple pregnancy, short cervix, part-time worker, steroid use, low educational level and male fetus are risk factors for preterm birth in Japan: A multicenter, prospective study. J. Obstet. Gynaecol. Res. 2013, 40, 53–61. [Google Scholar] [CrossRef]
- Fujiwara, T.; Ito, J.; Kawachi, I. Income Inequality, Parental Socioeconomic Status, and Birth Outcomes in Japan. Am. J. Epidemiol. 2013, 177, 1042–1052. [Google Scholar] [CrossRef] [PubMed]
- Luo, Z.-C.; Kierans, W.J.; Wilkins, R.; Liston, R.M.; Mohamed, J.; Kramer, M.S. Disparities in Birth Outcomes by Neighborhood Income. Epidemiology 2004, 15, 679–686. [Google Scholar] [CrossRef] [PubMed]
- Kent, S.T.; McClure, L.A.; Zaitchik, B.F.; Gohlke, J.M. Area-level risk factors for adverse birth outcomes: Trends in urban and rural settings. BMC Pregnancy Childbirth 2013, 13, 129. [Google Scholar] [CrossRef] [PubMed]
- Chen, L.; Xiao, L.; Auger, N.; Torrie, J.; McHugh, N.G.-L.; Zoungrana, H.; Luo, Z.-C. Disparities and Trends in Birth Outcomes, Perinatal and Infant Mortality in Aboriginal vs. Non-Aboriginal Populations: A Population-Based Study in Quebec, Canada 1996–2010. PLoS ONE 2015, 10, e0138562. [Google Scholar] [CrossRef]
- Bertens, L.C.M.; Ochoa, L.B.; Van Ourti, T.; Steegers, E.A.P.; Been, J.V. Persisting inequalities in birth outcomes related to neighbourhood deprivation. J. Epidemiol. Community Health 2019, 74, 232–239. [Google Scholar] [CrossRef] [PubMed]
- The Census. Available online: https://www.e-stat.go.jp/stat-search/files?page=1&toukei=00200521 (accessed on 30 December 2022).
- Hosseinpoor, A.R.; Bergen, N.; Kunst, A.; Harper, S.; Guthold, R.; Rekve, D.; D’Espaignet, E.T.; Naidoo, N.; Chatterji, S. Socioeconomic inequalities in risk factors for non communicable diseases in low-income and middle-income countries: Results from the World Health Survey. BMC Public Health 2012, 12, 912. [Google Scholar] [CrossRef] [PubMed]
- Guarnizo-Herreño, C.C.; Torres, G.; Buitrago, G. Socioeconomic inequalities in birth outcomes: An 11-year analysis in Colombia. PLoS ONE 2021, 16, e0255150. [Google Scholar] [CrossRef] [PubMed]
- Guarnizo-Herreño, C.C.; Watt, R.G.; Pikhart, H.; Sheiham, A.; Tsakos, G. Socioeconomic inequalities in oral health in different European welfare state regimes. J. Epidemiol. Community Health 2013, 67, 728–735. [Google Scholar] [CrossRef] [PubMed]
- Kim, Y.-J.; Lim, M.-N.; Lee, D.-S. Trend Analysis in the Prevalence of Type 2 Diabetes According to Risk Factors among Korean Adults: Based on the 2001~2009 Korean National Health and Nutrition Examination Survey Data. J. Korean Acad. Nurs. 2014, 44, 743–750. [Google Scholar] [CrossRef]
- Kim, N.; Kawachi, I. Insurance coverage expansion and inequalities in unmet oral healthcare needs in Korea: Repeated cross-sectional analysis, 2007–2015. Community Dent. Oral Epidemiol. 2020, 49, 232–239. [Google Scholar] [CrossRef]
- Kowarik, A.; Templ, M. Imputation with the R Package VIM. J. Stat. Softw. 2016, 74, 1–16. [Google Scholar] [CrossRef]
- Cantarutti, A.; Franchi, M.; Compagnoni, M.M.; Merlino, L.; Corrao, G. Mother’s education and the risk of several neonatal outcomes: An evidence from an Italian population-based study. BMC Pregnancy Childbirth 2017, 17, 221. [Google Scholar] [CrossRef] [PubMed]
- Ruiz, M.; Goldblatt, P.; Morrison, J.; Kukla, L.; Švancara, J.; Riitta-Järvelin, M.; Taanila, A.; Saurel-Cubizolles, M.-J.; Lioret, S.; Bakoula, C.; et al. Mother’s education and the risk of preterm and small for gestational age birth: A DRIVERS meta-analysis of 12 European cohorts. J. Epidemiol. Community Health 2015, 69, 826–833. [Google Scholar] [CrossRef] [PubMed]
- Blumenshine, P.M.; Egerter, S.A.; Libet, M.L.; Braveman, P.A. Father’s Education: An Independent Marker of Risk for Preterm Birth. Matern. Child Health J. 2011, 15, 60–67. [Google Scholar] [CrossRef]
- Soneji, S.; Beltrán-Sánchez, H. Association of Maternal Cigarette Smoking and Smoking Cessation With Preterm Birth. JAMA Netw. Open 2019, 2, e192514. [Google Scholar] [CrossRef]
- Liu, B.; Xu, G.; Sun, Y.; Qiu, X.; Ryckman, K.K.; Yu, Y.; Snetselaar, L.G.; Bao, W. Maternal cigarette smoking before and during pregnancy and the risk of preterm birth: A dose–response analysis of 25 million mother–infant pairs. PLoS Med. 2020, 17, e1003158. [Google Scholar] [CrossRef]
- Kondracki, A.J.; Hofferth, S.L. A gestational vulnerability window for smoking exposure and the increased risk of preterm birth: How timing and intensity of maternal smoking matter. Reprod. Health 2019, 16, 43. [Google Scholar] [CrossRef]
- Tomioka, K.; Kurumatani, N.; Saeki, K. The Association Between Education and Smoking Prevalence, Independent of Occupation: A Nationally Representative Survey in Japan. J. Epidemiol. 2020, 30, 136–142. [Google Scholar] [CrossRef]
- Silva, L.; Coolman, M.; Steegers, E.; Jaddoe, V.; Moll, H.; Hofman, A.; MacKenbach, J.; Raat, H. Maternal educational level and risk of gestational hypertension: The Generation R Study. J. Hum. Hypertens. 2008, 22, 483–492. [Google Scholar] [CrossRef]
- Bouthoorn, S.H.; Silva, L.M.; Murray, S.E.; Steegers, E.A.P.; Jaddoe, V.W.V.; Moll, H.; Hofman, A.; MacKenbach, J.P.; Raat, H. Low-educated women have an increased risk of gestational diabetes mellitus: The Generation R Study. Acta Diabetol. 2015, 52, 445–452. [Google Scholar] [CrossRef]
- Song, L.; Shen, L.; Li, H.; Liu, B.; Zheng, X.; Zhang, L.; Xu, S.; Wang, Y. Socio-economic status and risk of gestational diabetes mellitus among Chinese women. Diabet. Med. 2017, 34, 1421–1427. [Google Scholar] [CrossRef] [PubMed]
- Wang, J.-W.; Wang, Q.; Wang, X.-Q.; Wang, M.; Cao, S.-S.; Wang, J.-N. Association between maternal education level and gestational diabetes mellitus: A meta-analysis. J. Matern. Neonatal Med. 2021, 34, 580–587. [Google Scholar] [CrossRef] [PubMed]
- Madan, J.; Chen, M.; Goodman, E.; Davis, J.; Allan, W.; Dammann, O. Maternal obesity, gestational hypertension, and preterm delivery. J. Matern. Neonatal Med. 2010, 23, 82–88. [Google Scholar] [CrossRef] [PubMed]
- Hedderson, M.M. Gestational diabetes mellitus and lesser degrees of pregnancy hyperglycemia: Association with increased risk of spontaneous preterm birth. Obstet. Gynecol. 2003, 102, 850–856. [Google Scholar] [CrossRef] [PubMed]
- Vintzileos, A.M.; Ananth, C.V.; Smulian, J.C.; Scorza, W.E.; Knuppel, R.A. The impact of prenatal care in the United States on preterm births in the presence and absence of antenatal high-risk conditions. Am. J. Obstet. Gynecol. 2002, 187, 1254–1257. [Google Scholar] [CrossRef] [PubMed]
- Requejo, J.; Merialdi, M.; Althabe, F.; Keller, M.; Katz, J.; Menon, R. Born Too Soon: Care during pregnancy and childbirth to reduce preterm deliveries and improve health outcomes of the preterm baby. Reprod. Health 2013, 10, S4. [Google Scholar] [CrossRef]
- Beeckman, K.; Louckx, F.; Downe, S.; Putman, K. The relationship between antenatal care and preterm birth: The importance of content of care. Eur. J. Public Health 2013, 23, 366–371. [Google Scholar] [CrossRef]
- Muyunda, B.; Makasa, M.; Jacobs, C.; Musonda, P.; Michelo, C. Higher Educational Attainment Associated with Optimal Antenatal Care Visits among Childbearing Women in Zambia. Front. Public Health 2016, 4, 127. [Google Scholar] [CrossRef]
- Osawa, E.; Kodama, T. Regional socio-environmental characteristics associated with inadequate prenatal care during pregnancy: An ecological study of 47 prefectures in Japan. BMC Pregnancy Childbirth 2021, 21, 619. [Google Scholar] [CrossRef]
- McHale, P.; Maudsley, G.; Pennington, A.; Schlüter, D.K.; Ben Barr, B.; Paranjothy, S.; Taylor-Robinson, D. Mediators of socioeconomic inequalities in preterm birth: A systematic review. BMC Public Health 2022, 22, 1134. [Google Scholar] [CrossRef]
- Ministry of Health, Labour and Welfare of Japan. Overview of the Basic Survey on Wage Structure in 2020. Available online: https://www.mhlw.go.jp/toukei/itiran/roudou/chingin/kouzou/z2020/dl/13.pdf (accessed on 24 December 2022).
- Cubbin, C.; Kim, Y.; Vohra-Gupta, S.; Margerison, C. Longitudinal measures of neighborhood poverty and income inequality are associated with adverse birth outcomes in Texas. Soc. Sci. Med. 2020, 245, 112665. [Google Scholar] [CrossRef] [PubMed]
- Lintao, R.C.; Llamas-Clark, E.F.; Tantengco, O.A.G. Socioeconomic disparities in adverse birth outcomes in the Philippines. Lancet Reg. Health-West. Pac. 2022, 21, 100453. [Google Scholar] [CrossRef] [PubMed]
- Vidiella-Martin, J.; Been, J.V.; Van Doorslaer, E.; García-Gómez, P.; Van Ourti, T. Association Between Income and Perinatal Mortality in the Netherlands Across Gestational Age. JAMA Netw. Open 2021, 4, e2132124. [Google Scholar] [CrossRef] [PubMed]
- Ochoa, L.B.; Bertens, L.C.; Garcia-Gomez, P.; Van Ourti, T.; AP Steegers, E.; Been, J.V. Association of neighbourhood socioeconomic trajectories with preterm birth and small-for-gestational-age in the Netherlands: A nationwide population-based study. Lancet Reg. Health-Eur. 2021, 10, 100205. [Google Scholar] [CrossRef] [PubMed]
- DeFranco, E.A.; Lian, M.; Muglia, L.J.; Schootman, M. Area-level poverty and preterm birth risk: A population-based multilevel analysis. BMC Public Health 2008, 8, 316. [Google Scholar] [CrossRef] [PubMed]
- Vinikoor-Imler, L.; Messer, L.; Evenson, K.; Laraia, B. Neighborhood conditions are associated with maternal health behaviors and pregnancy outcomes. Soc. Sci. Med. 2011, 73, 1302–1311. [Google Scholar] [CrossRef]

| Year | |||
|---|---|---|---|
| 2000 | 2010 | 2020 | |
| Total | 308,994 (100.0) | 251,455 (100.0) | 216,637 (100.0) |
| Maternal age group | |||
| 19 years or less | 9607 (3.1) | 5076 (2.0) | 2013 (0.9) |
| 20–24 years | 72,551 (23.5) | 50,407 (20.0) | 31,218 (14.4) |
| 25–29 years | 112,295 (36.3) | 82,313 (32.7) | 65,429 (30.2) |
| 30–34 years | 81,107 (26.2) | 69,971 (27.8) | 66,501 (30.7) |
| 35–39 years | 29,172 (9.4) | 36,087 (14.4) | 40,761 (18.8) |
| 40 years or more | 4262 (1.4) | 7601 (3.0) | 10,715 (4.9) |
| Gender | |||
| Female | 149,954 (48.5) | 122,360 (48.7) | 105,734 (48.8) |
| Male | 159,040 (51.5) | 129,095 (51.3) | 110,903 (51.2) |
| Parity | |||
| Primiparous | 156,453 (50.6) | 125,412 (49.9) | 104,657 (48.3) |
| Multiparous | 152,541 (49.4) | 126,043 (50.1) | 111,980 (51.7) |
| Household occupation | |||
| Farmer | 20,371 (6.6) | 8193 (3.3) | 4175 (1.9) |
| Self-employed | 30,261 (9.8) | 21,016 (8.4) | 17,089 (7.9) |
| Full-time worker 1 | 116,984 (37.9) | 96,872 (38.5) | 75,969 (35.1) |
| Full-time worker 2 | 100,111 (32.4) | 89,426 (35.6) | 92,264 (42.6) |
| Other occupations | 34,218 (11.1) | 25,703 (10.2) | 21,046 (9.7) |
| Unemployed | 3624 (1.2) | 3910 (1.6) | 1721 (0.8) |
| Missing | 3425 (1.1) | 6335 (2.5) | 4373 (2.0) |
| Paternal educational level | |||
| Junior high school | 36,536 (11.8) | 21,616 (8.6) | 13,555 (6.3) |
| High school | 167,938 (54.3) | 109,471 (43.5) | 75,470 (34.8) |
| Technical school or junior college | 34,399 (11.1) | 34,600 (13.8) | 27,607 (12.7) |
| University or graduate school | 66,594 (21.6) | 66,058 (26.3) | 72,419 (33.4) |
| Missing | 3527 (1.1) | 19,710 (7.8) | 27,586 (12.7) |
| Maternal educational level | |||
| Junior high school | 25,841 (8.4) | 16,964 (6.7) | 9896 (4.6) |
| High school | 173,690 (56.2) | 106,675 (42.4) | 71,571 (33.0) |
| Technical school or junior college | 83,233 (26.9) | 72,275 (28.7) | 54,595 (25.2) |
| University or graduate school | 22,671 (7.3) | 36,647 (14.6) | 53,626 (24.8) |
| Missing | 3559 (1.2) | 18,894 (7.5) | 26,949 (12.4) |
| Gestational age | |||
| Term birth | 294,936 (95.5) | 239,867 (95.4) | 206,784 (95.5) |
| Preterm birth | 13,969 (4.5) | 11,548 (4.6) | 9821 (4.5) |
| Missing | 89 (0.0) | 40 (0.0) | 32 (0.0) |
| Birthweight | |||
| >= 2, 500 g | 285,929 (92.5) | 230,548 (91.7) | 199,587 (92.1) |
| < 2500 g | 23,042 (7.5) | 20,876 (8.3) | 17,023 (7.9) |
| Missing | 23 (0.0) | 31 (0.0) | 27 (0.0) |
| Year | |||
|---|---|---|---|
| 2000 | 2010 | 2020 | |
| Total | 13,597 (4.51) | 10,246 (4.56) | 8357 (4.52) |
| Paternal educational level | |||
| Junior high school | 1892 (5.27) | 1045 (5.04) | 686 (5.21) |
| High school | 7446 (4.50) | 4959 (4.68) | 3366 (4.57) |
| Technical school or junior college | 1439 (4.24) | 1456 (4.33) | 1187 (4.39) |
| University or graduate school | 2820 (4.28) | 2786 (4.32) | 3118 (4.39) |
| Maternal educational level | |||
| Junior high school | 1397 (5.52) | 854 (5.28) | 488 (5.07) |
| High school | 7834 (4.58) | 4845 (4.72) | 3248 (4.70) |
| Technical school or junior college | 3438 (4.18) | 3055 (4.35) | 2388 (4.45) |
| University or graduate school | 928 (4.13) | 1492 (4.16) | 2233 (4.24) |
| 2000 | 2010 | 2020 | |
|---|---|---|---|
| Estimates (95%CI) | Estimates (95%CI) | Estimates (95%CI) | |
| Slope index of inequality | |||
| Paternal educational level | −0.609 (−0.924, −0.293) | −0.620 (−0.976, −0.264) | −0.489 (−0.876, −0.103) |
| Maternal educational level | −1.024 (−1.344, −0.705) | −1.061 (−1.422, −0.700) | −0.967 (−1.353, −0.580) |
| Relative index of inequality | |||
| Paternal educational level | 0.854 (0.795, 0.918) | 0.867 (0.800, 0.939) | 0.886 (0.812, 0.967) |
| Maternal educational level | 0.779 (0.723, 0.838) | 0.773 (0.713, 0.839) | 0.784 (0.719, 0.856) |
| CI, confidence intervals | |||
| 1. Gender, parity, household occupation, and maternal age group were adjusted in the analysis. | |||
| 2. Estimates for the slope index of inequality, which was calculated using a binomial model with an identity link function, can be interpreted as the absolute risk difference between the highest and lowest educational levels. | |||
| 3. Estimates for the relative index of inequality, which was calculated using a log-binomial model, can be interpreted as the risk ratio between the highest and lowest educational levels. | |||
Disclaimer/Publisher’s Note: The statements, opinions and data contained in all publications are solely those of the individual author(s) and contributor(s) and not of MDPI and/or the editor(s). MDPI and/or the editor(s) disclaim responsibility for any injury to people or property resulting from any ideas, methods, instructions or products referred to in the content. |
© 2023 by the author. Licensee MDPI, Basel, Switzerland. This article is an open access article distributed under the terms and conditions of the Creative Commons Attribution (CC BY) license (https://creativecommons.org/licenses/by/4.0/).
Share and Cite
Okui, T. Analysis of an Association between Preterm Birth and Parental Educational Level in Japan Using National Data. Children 2023, 10, 342. https://doi.org/10.3390/children10020342
Okui T. Analysis of an Association between Preterm Birth and Parental Educational Level in Japan Using National Data. Children. 2023; 10(2):342. https://doi.org/10.3390/children10020342
Chicago/Turabian StyleOkui, Tasuku. 2023. "Analysis of an Association between Preterm Birth and Parental Educational Level in Japan Using National Data" Children 10, no. 2: 342. https://doi.org/10.3390/children10020342
APA StyleOkui, T. (2023). Analysis of an Association between Preterm Birth and Parental Educational Level in Japan Using National Data. Children, 10(2), 342. https://doi.org/10.3390/children10020342