
Short-Term SGLT2 Inhibitor Administration Does Not Alter Systemic Insulin Clearance in Type 2 Diabetes

 , ,
, ,
Abstract
:1. Introduction
2. Materials and Methods
2.1. Study Subjects
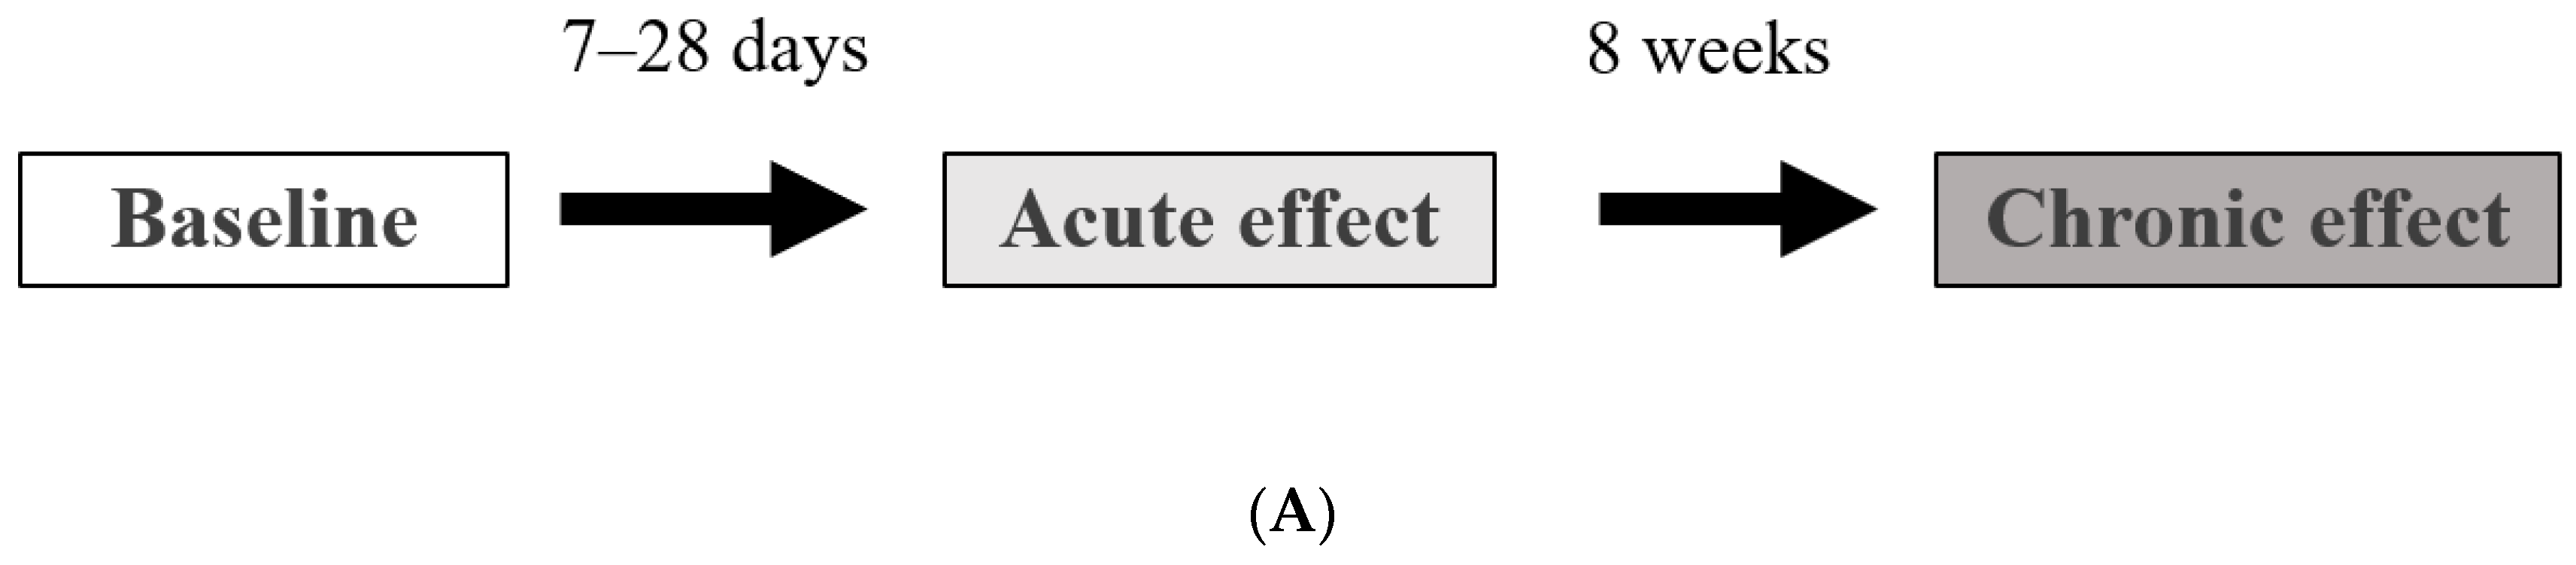
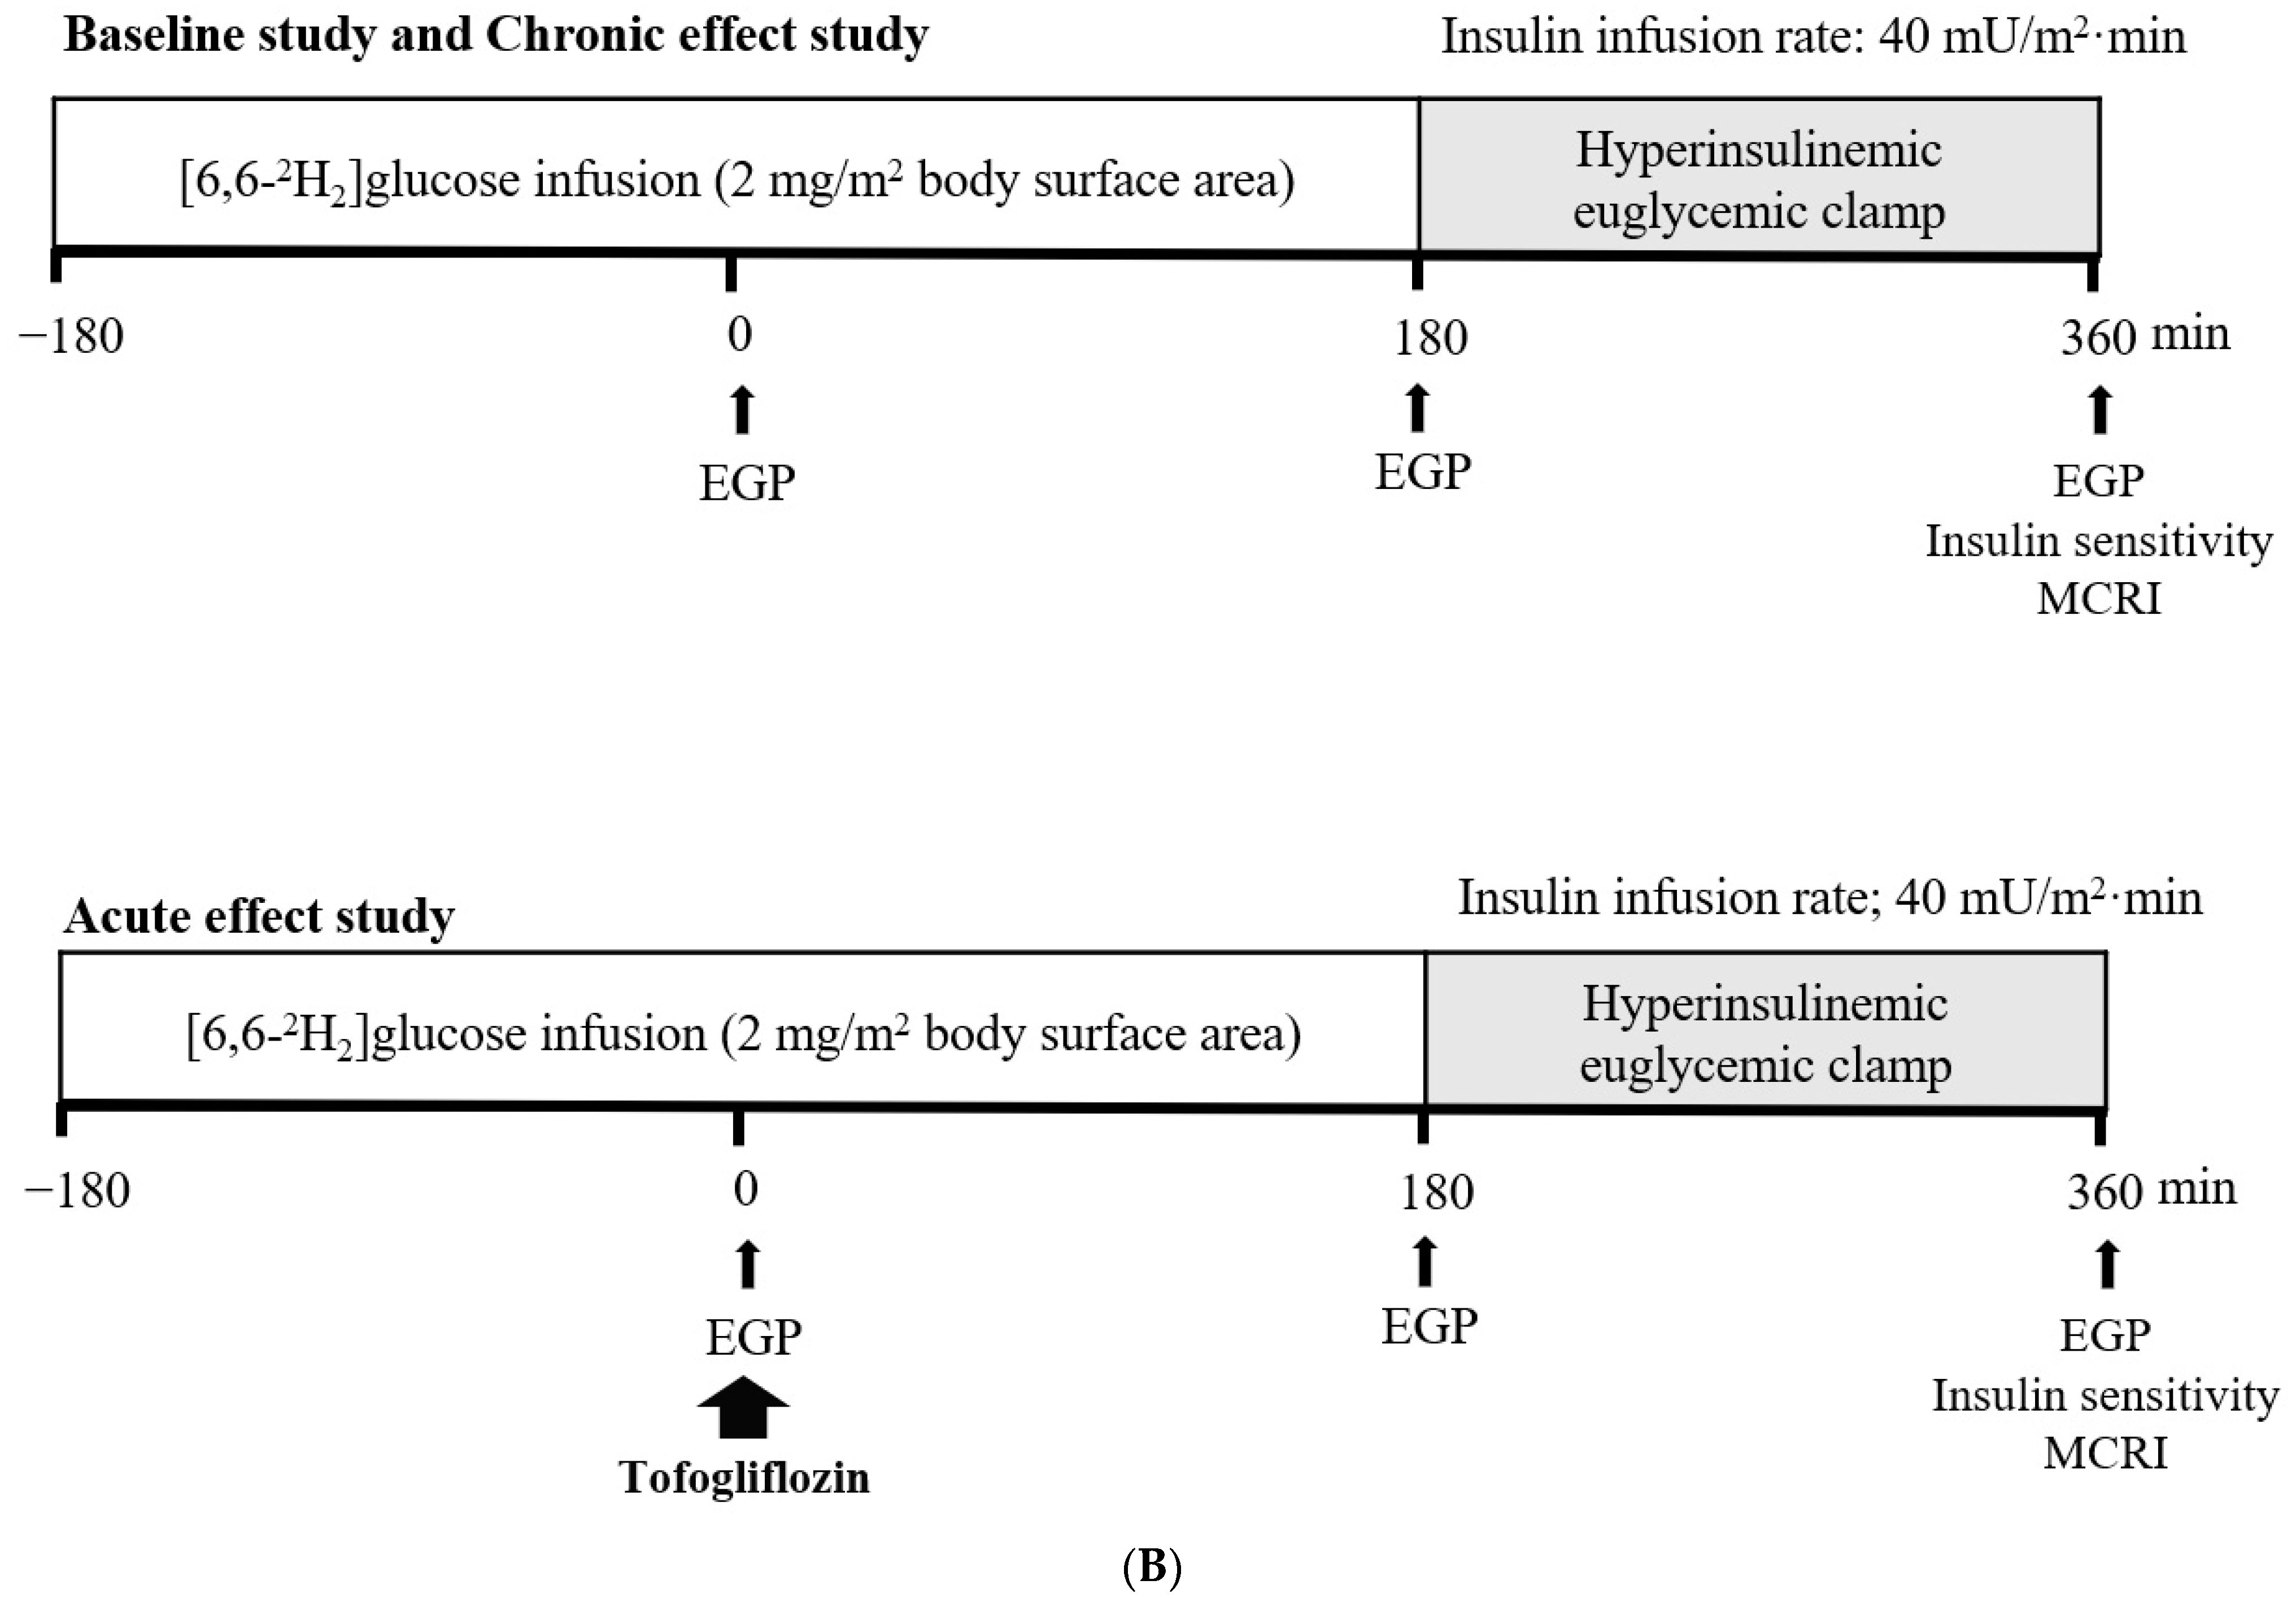
2.2. Study Design
2.3. Measurement of EGP, Insulin Clearance, and Tissue-Specific Insulin Sensitivity
2.4. H-Magnetic Resonance Spectroscopy
2.5. Fat Distribution and Body Composition
2.6. Statistical Analysis
3. Results
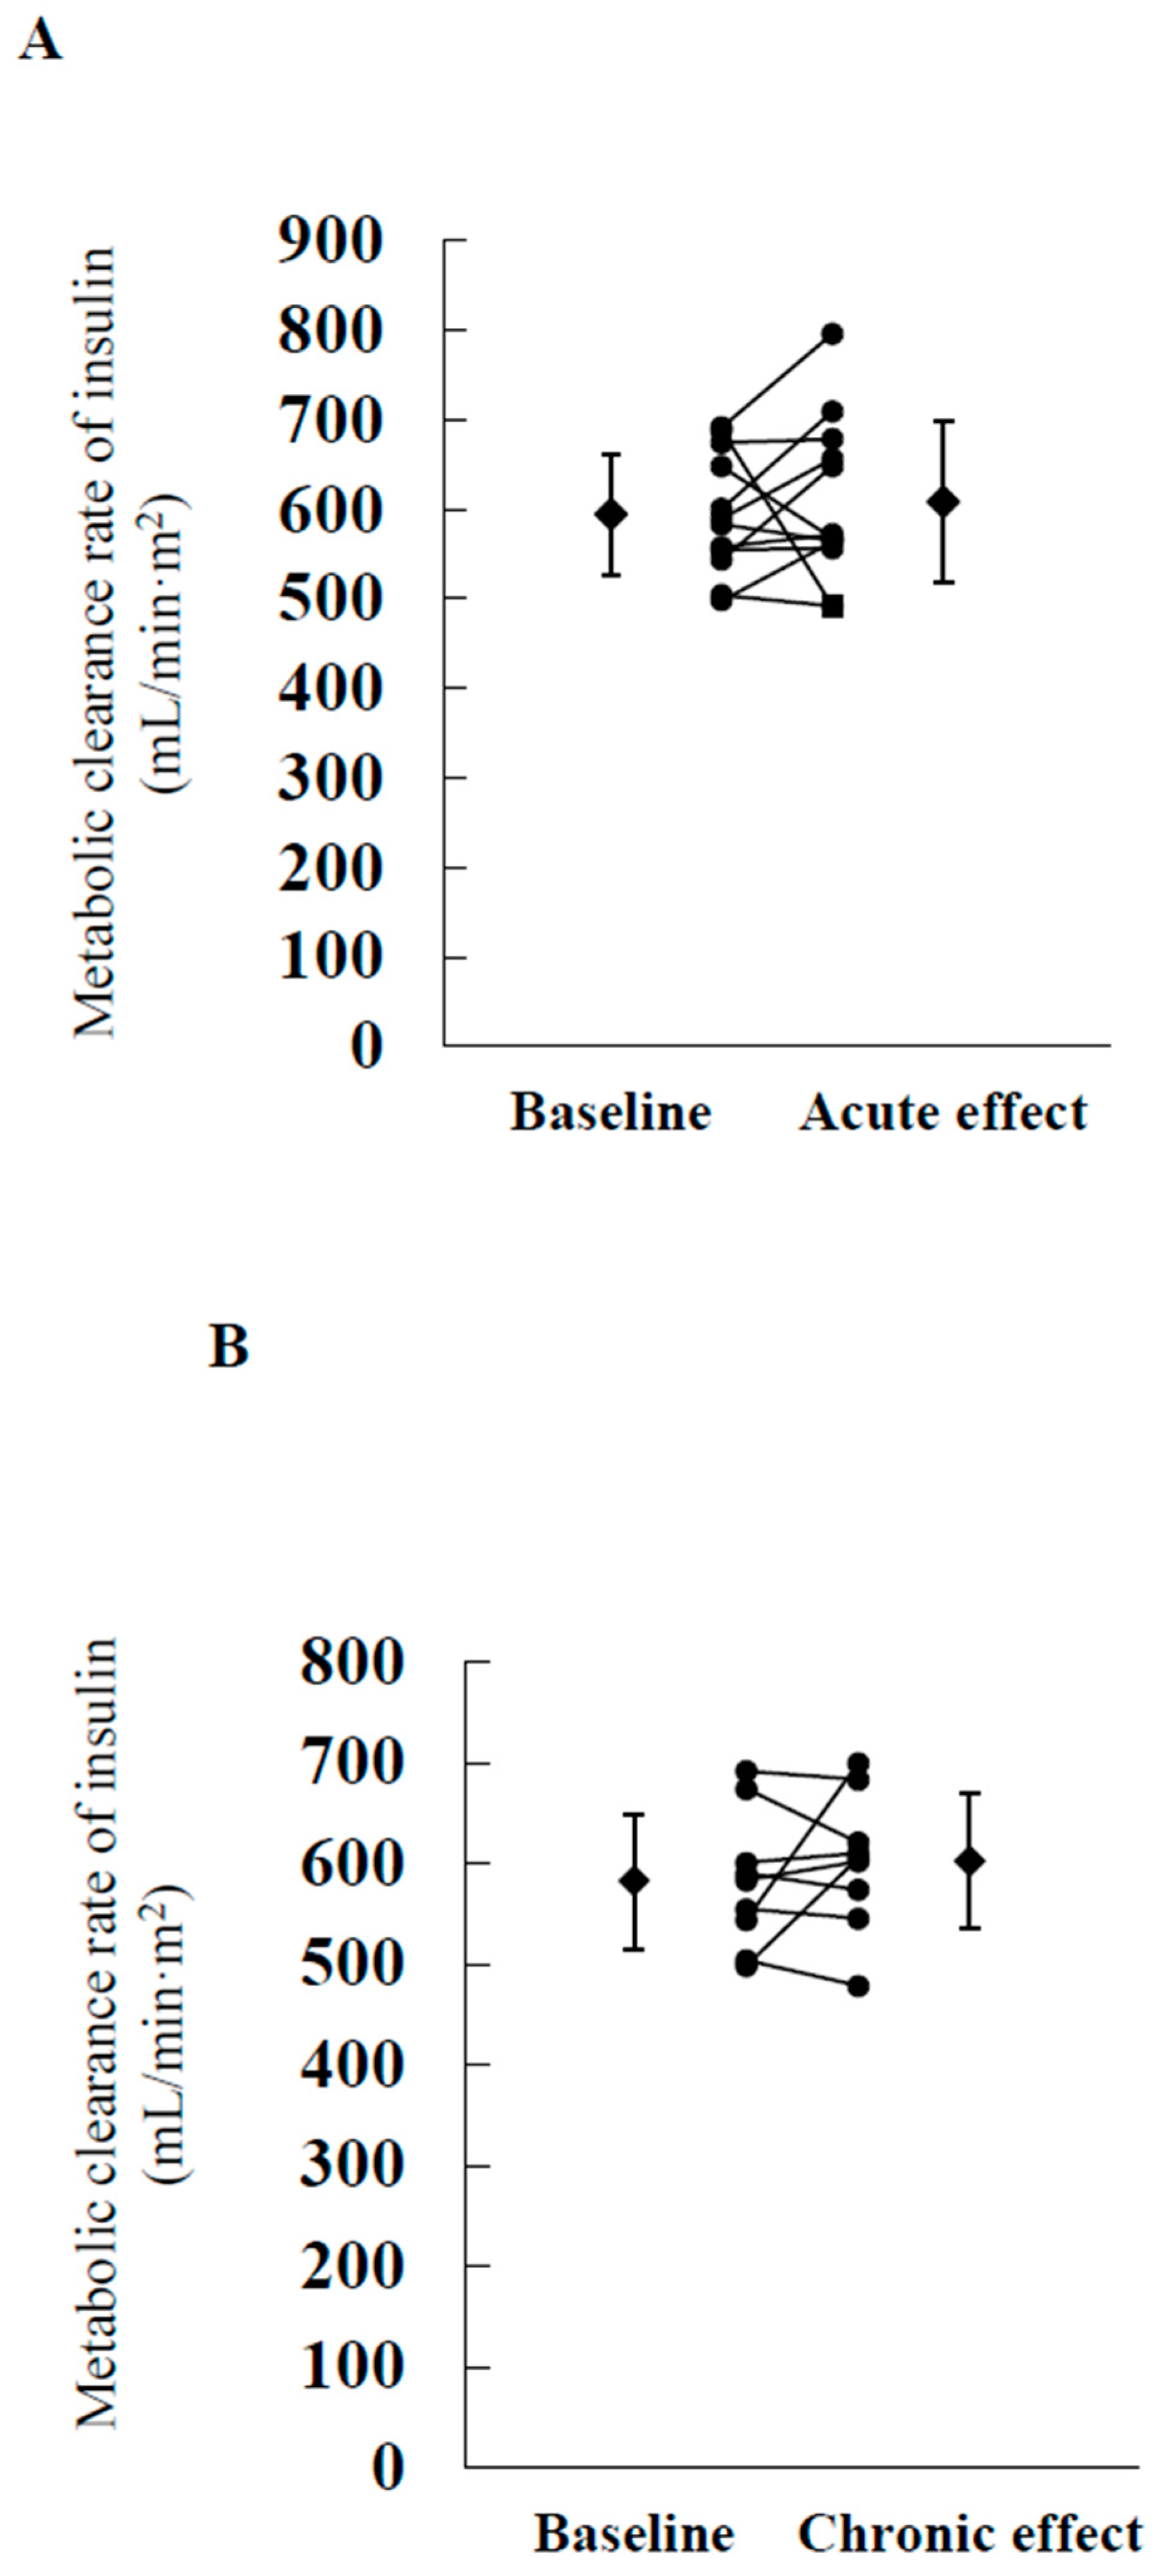
3.1. Acute Effect Study
3.2. Chronic Effect Study
4. Discussion
Supplementary Materials
Author Contributions
Funding
Institutional Review Board Statement
Informed Consent Statement
Data Availability Statement
Acknowledgments
Conflicts of Interest
References
- Reaven, G.M. Role of insulin resistance in human disease. Diabetes 1988, 37, 1595–1607. [Google Scholar] [CrossRef] [PubMed]
- Eschwege, E.; Richard, J.L.; Thibult, N.; Ducimetière, P.; Warnet, J.M.; Claude, J.R.; Rosselin, G.E. Coronary heart disease mortality in relation with diabetes, blood glucose and plasma insulin levels. The Paris prospective study, ten years later. Horm. Metab. Res. Suppl. 1985, 15, 41–46. [Google Scholar]
- El-Atat, F.A.; Stas, S.N.; McFarlane, S.I.; Sowers, J.R. The relationship between hyperinsulinemia, hypertension and progressive renal disease. J. Am. Soc. Nephrol. 2004, 15, 2816–2827. [Google Scholar] [CrossRef] [PubMed] [Green Version]
- Sakata, M.; Kawahara, A.; Kawaguchi, T.; Akiba, J.; Taira, T.; Taniguchi, E.; Abe, M.; Koga, H.; Kage, M.; Sata, M. Decreased expression of insulin and increased expression of pancreatic transcription factor PDX-1 in islets in patients with liver cirrhosis: A comparative investigation using human autopsy specimens. J. Gastroenterol. 2013, 48, 277–285. [Google Scholar] [CrossRef] [PubMed]
- Jung, S.H.; Jung, C.H.; Reaven, G.M.; Kim, S.H. Adapting to insulin resistance in obesity: Role of insulin secretion and clearance. Diabetologia 2018, 61, 681–687. [Google Scholar] [CrossRef] [PubMed] [Green Version]
- Erdmann, J.; Kallabis, B.; Oppel, U.; Sypchenko, O.; Wagenpfeil, S.; Schusdziarra, V. Development of hyperinsulinemia and insulin resistance during the early stage of weight gain. Am. J. Physiol. Endocrinol. Metab. 2008, 294, E568–E575. [Google Scholar] [CrossRef] [Green Version]
- Poy, M.N.; Yang, Y.; Rezaei, K.; Fernstrom, M.A.; Lee, A.D.; Kido, Y.; Erickson, S.K.; Najjar, S.M. CEACAM1 regulates insulin clearance in liver. Nat. Genet. 2002, 30, 270–276. [Google Scholar] [CrossRef]
- Al-Share, Q.Y.; DeAngelis, A.M.; Lester, S.G.; Bowman, T.A.; Ramakrishnan, S.K.; Abdallah, S.L.; Russo, L.; Patel, P.R.; Kaw, M.K.; Raphael, C.K.; et al. Forced hepatic overexpression of CEACAM1 curtails diet-induced insulin resistance. Diabetes 2015, 64, 2780–2790. [Google Scholar] [CrossRef] [Green Version]
- Borges, D.O.; Patarrão, R.S.; Ribeiro, R.T.; de Oliveira, R.M.; Duarte, N.; Belew, G.D.; Martins, M.; Andrade, R.; Costa, J.; Correia, I.; et al. Loss of postprandial insulin clearance control by Insulin-degrading enzyme drives dysmetabolism traits. Metabolism 2021, 118, 154735. [Google Scholar] [CrossRef]
- Villa-Pérez, P.; Merino, B.; Fernández-Díaz, C.M.; Cidad, P.; Lobatón, C.D.; Moreno, A.; Muturi, H.T.; Ghadieh, H.E.; Najjar, S.M.; Leissring, M.A.; et al. Liver-specific ablation of insulin-degrading enzyme causes hepatic insulin resistance and glucose intolerance, without affecting insulin clearance in mice. Metabolism 2018, 88, 1–11. [Google Scholar] [CrossRef] [Green Version]
- Merino, B.; Fernández-Díaz, C.M.; Parrado-Fernández, C.; González-Casimiro, C.M.; Postigo-Casado, T.; Lobatón, C.D.; Leissring, M.A.; Cózar-Castellano, I.; Perdomo, G. Hepatic insulin-degrading enzyme regulates glucose and insulin homeostasis in diet-induced obese mice. Metabolism 2020, 113, 154352. [Google Scholar] [CrossRef] [PubMed]
- Ladwa, M.; Bello, O.; Hakim, O.; Shojaee-Moradie, F.; Boselli, L.; Charles-Edwards, G.; Stadler, M.; Peacock, J.L.; Umpleby, A.M.; Amiel, S.A.; et al. Insulin clearance as the major player in the hyperinsulinaemia of black African men without diabetes. Diabetes Obes. Metab. 2020, 22, 1808–1817. [Google Scholar] [CrossRef]
- Ladwa, M.; Bello, O.; Hakim, O.; Shojaee-Moradie, F.; Boselli, M.L.; Charles-Edwards, G.; Peacock, J.; Umpleby, A.M.; Amiel, S.A.; Bonadonna, R.C.; et al. Ethnic differences in beta cell function occur independently of insulin sensitivity and pancreatic fat in black and white men. BMJ Open Diabetes Res. Care 2021, 9, e002034. [Google Scholar] [CrossRef]
- Valera Mora, M.E.; Scarfone, A.; Calvani, M.; Greco, A.V.; Mingrone, G. Insulin clearance in obesity. J. Am. Coll. Nutr. 2003, 22, 487–493. [Google Scholar] [CrossRef] [PubMed]
- Meistas, M.T.; Margolis, S.; Kowarski, A.A. Hyperinsulinemia of obesity is due to decreased clearance of insulin. Am. J. Physiol. 1983, 245, E155–E159. [Google Scholar] [CrossRef] [PubMed]
- Pivovarova, O.; Bernigau, W.; Bobbert, T.; Isken, F.; Möhlig, M.; Spranger, J.; Weickert, M.O.; Osterhoff, M.; Pfeiffer, A.F.; Rudovich, N. Hepatic insulin clearance is closely related to metabolic syndrome components. Diabetes Care 2013, 36, 3779–3785. [Google Scholar] [CrossRef] [PubMed] [Green Version]
- Bril, F.; Lomonaco, R.; Orsak, B.; Ortiz-Lopez, C.; Webb, A.; Tio, F.; Hecht, J.; Cusi, K. Relationship between disease severity, hyperinsulinemia, and impaired insulin clearance in patients with nonalcoholic steatohepatitis. Hepatology 2014, 59, 2178–2187. [Google Scholar] [CrossRef] [PubMed]
- Kotronen, A.; Juurinen, L.; Tiikkainen, M.; Vehkavaara, S.; Yki-Järvinen, H. Increased liver fat, impaired insulin clearance, and hepatic and adipose tissue insulin resistance in type 2 diabetes. Gastroenterology 2008, 135, 122–130. [Google Scholar] [CrossRef]
- Matsubayashi, Y.; Yoshida, A.; Suganami, H.; Ishiguro, H.; Yamamoto, M.; Fujihara, K.; Kodama, S.; Tanaka, S.; Kaku, K.; Sone, H. Role of fatty liver in the association between obesity and reduced hepatic insulin clearance. Diabetes Metab. 2018, 44, 135–142. [Google Scholar] [CrossRef] [PubMed]
- Eriksson, J.W.; Lundkvist, P.; Jansson, P.A.; Johansson, L.; Kvarnstrom, M.; Moris, L.; Miliotis, T.; Forsberg, G.B.; Riserus, U.; Lind, L.; et al. Effects of dapagliflozin and n-3 carboxylic acids on non-alcoholic fatty liver disease in people with type 2 diabetes: A double-blind randomised placebo-controlled study. Diabetologia 2018, 61, 1923–1934. [Google Scholar] [CrossRef] [Green Version]
- Kuchay, M.S.; Krishan, S.; Mishra, S.K.; Farooqui, K.J.; Singh, M.K.; Wasir, J.S.; Bansal, B.; Kaur, P.; Jevalikar, G.; Gill, H.K.; et al. Effect of empagliflozin on liver fat in patients with type 2 diabetes and nonalcoholic fatty liver disease: A randomized controlled trial (E-LIFT trial). Diabetes Care 2018, 41, 1801–1808. [Google Scholar] [CrossRef] [Green Version]
- Inoue, M.; Hayashi, A.; Taguchi, T.; Arai, R.; Sasaki, S.; Takano, K.; Inoue, Y.; Shichiri, M. Effects of canagliflozin on body composition and hepatic fat content in type 2 diabetes patients with non-alcoholic fatty liver disease. J. Diabetes Investig. 2019, 10, 1004–1011. [Google Scholar] [CrossRef]
- Ohta, A.; Kato, H.; Ishii, S.; Sasaki, Y.; Nakamura, Y.; Nakagawa, T.; Nagai, Y.; Tanaka, Y. Ipragliflozin, a sodium glucose co-transporter 2 inhibitor, reduces intrahepatic lipid content and abdominal visceral fat volume in patients with type 2 diabetes. Expert Opin. Pharmacother. 2017, 18, 1433–1438. [Google Scholar] [CrossRef]
- Sumida, Y.; Murotani, K.; Saito, M.; Tamasawa, A.; Osonoi, Y.; Yoneda, M.; Osonoi, T. Effect of luseogliflozin on hepatic fat content in type 2 diabetes patients with non-alcoholic fatty liver disease: A prospective, single-arm trial (LEAD trial). Hepatol. Res. 2019, 49, 64–71. [Google Scholar] [CrossRef] [PubMed] [Green Version]
- Kahl, S.; Gancheva, S.; Strassburger, K.; Herder, C.; Machann, J.; Katsuyama, H.; Kabisch, S.; Henkel, E.; Kopf, S.; Lagerpusch, M.; et al. Empagliflozin effectively lowers liver fat content in well-controlled type 2 diabetes: A randomized, double-blind, phase 4, placebo-controlled trial. Diabetes Care 2020, 43, 298–305. [Google Scholar] [CrossRef] [Green Version]
- Koike, Y.; Shirabe, S.I.; Maeda, H.; Yoshimoto, A.; Arai, K.; Kumakura, A.; Hirao, K.; Terauchi, Y. Effect of canagliflozin on the overall clinical state including insulin resistance in Japanese patients with type 2 diabetes mellitus. Diabetes Res. Clin. Pract. 2019, 149, 140–146. [Google Scholar] [CrossRef] [PubMed]
- Matsuba, R.; Matsuba, I.; Shimokawa, M.; Nagai, Y.; Tanaka, Y. Tofogliflozin decreases body fat mass and improves peripheral insulin resistance. Diabetes Obes. Metab. 2018, 20, 1311–1315. [Google Scholar] [CrossRef] [PubMed] [Green Version]
- Kario, K.; Okada, K.; Kato, M.; Nishizawa, M.; Yoshida, T.; Asano, T.; Uchiyama, K.; Niijima, Y.; Katsuya, T.; Urata, H.; et al. 24-hour blood pressure-lowering effect of an SGLT-2 inhibitor in patients with diabetes and uncontrolled nocturnal hypertension: Results from the randomized, placebo-controlled SACRA study. Circulation 2018, 139, 2089–2097. [Google Scholar] [CrossRef]
- Zinman, B.; Wanner, C.; Lachin, J.M.; Fitchett, D.; Bluhmki, E.; Hantel, S.; Mattheus, M.; Devins, T.; Johansen, O.E.; Woerle, H.J.; et al. Empagliflozin, cardiovascular outcomes, and mortality in type 2 diabetes. N. Engl. J. Med. 2015, 373, 2117–2128. [Google Scholar] [CrossRef]
- Mahaffey, K.W.; Neal, B.; Perkovic, V.; de Zeeuw, D.; Fulcher, G.; Erondu, N.; Shaw, W.; Fabbrini, E.; Sun, T.; Li, Q.; et al. Canagliflozin for primary and secondary prevention of cardiovascular events: Results from the CANVAS program (canagliflozin cardiovascular assessment study). Circulation 2018, 137, 323–334. [Google Scholar] [CrossRef] [Green Version]
- Wiviott, S.D.; Raz, I.; Bonaca, M.P.; Mosenzon, O.; Kato, E.T.; Cahn, A.; Silverman, M.G.; Zelniker, T.A.; Kuder, J.F.; Murphy, S.A.; et al. Dapagliflozin and cardiovascular outcomes in type 2 diabetes. N. Engl. J. Med. 2019, 380, 347–357. [Google Scholar] [CrossRef]
- Neal, B.; Perkovic, V.; Mahaffey, K.W.; de Zeeuw, D.; Fulcher, G.; Erondu, N.; Shaw, W.; Law, G.; Desai, M.; Matthews, D.R. Canagliflozin and cardiovascular and renal events in type 2 diabetes. N. Engl. J. Med. 2017, 377, 644–657. [Google Scholar] [CrossRef]
- Wanner, C.; Inzucchi, S.E.; Lachin, J.M.; Fitchett, D.; von Eynatten, M.; Mattheus, M.; Johansen, O.E.; Woerle, H.J.; Broedl, U.C.; Zinman, B. Empagliflozin and progression of kidney disease in type 2 diabetes. N. Engl. J. Med. 2016, 375, 323–334. [Google Scholar] [CrossRef] [PubMed]
- Ferrannini, E.; Muscelli, E.; Frascerra, S.; Baldi, S.; Mari, A.; Heise, T.; Broedl, U.C.; Woerle, H.J. Metabolic response to sodium-glucose cotransporter 2 inhibition in type 2 diabetic patients. J. Clin. Investig. 2014, 124, 499–508. [Google Scholar] [CrossRef] [Green Version]
- Matsubayashi, Y.; Yoshida, A.; Suganami, H.; Osawa, T.; Furukawa, K.; Suzuki, H.; Fujihara, K.; Tanaka, S.; Kaku, K.; Sone, H. Association of increased hepatic insulin clearance and change in serum triglycerides or beta-hydroxybutyrate concentration via the sodium/glucose-cotransporter 2 inhibitor tofogliflozin. Diabetes Obes. Metab. 2020, 22, 947–956. [Google Scholar] [CrossRef] [PubMed]
- Bojsen-Moller, K.N.; Lundsgaard, A.M.; Madsbad, S.; Kiens, B.; Holst, J.J. Hepatic Insulin clearance in regulation of systemic insulin concentrations-role of carbohydrate and energy availability. Diabetes 2018, 67, 2129–2136. [Google Scholar] [CrossRef] [PubMed] [Green Version]
- Suzuki, R.; Tamura, Y.; Takeno, K.; Kakehi, S.; Funayama, T.; Furukawa, Y.; Kaga, H.; Sugimoto, D.; Kadowaki, S.; Someya, Y.; et al. Three days of a eucaloric, low-carbohydrate/high-fat diet increases insulin clearance in healthy non-obese Japanese men. Sci. Rep. 2019, 9, 3857. [Google Scholar] [CrossRef] [Green Version]
- Yamasaki, N.; Tamura, Y.; Kaga, H.; Sato, M.; Kiya, M.; Kadowaki, S.; Suzuki, R.; Furukawa, Y.; Sugimoto, D.; Funayama, T.; et al. A decrease in plasma glucose levels is required for increased endogenous glucose production with a single administration of an SGLT2 inhibitor tofogliflozin. Diabetes Obes. Metab. 2020, 23, 1092–1100. [Google Scholar] [CrossRef]
- Merovci, A.; Solis-Herrera, C.; Daniele, G.; Eldor, R.; Fiorentino, T.V.; Tripathy, D.; Xiong, J.; Perez, Z.; Norton, L.; Abdul-Ghani, M.A.; et al. Dapagliflozin improves muscle insulin sensitivity but enhances endogenous glucose production. J. Clin. Investig. 2014, 124, 509–514. [Google Scholar] [CrossRef]
- Kelley, D.E.; McKolanis, T.M.; Hegazi, R.A.; Kuller, L.H.; Kalhan, S.C. Fatty liver in type 2 diabetes mellitus: Relation to regional adiposity, fatty acids, and insulin resistance. Am. J. Physiol. Endocrinol. Metab. 2003, 285, E906–E916. [Google Scholar] [CrossRef] [Green Version]
- Lindegaard, B.; Frosig, C.; Petersen, A.M.; Plomgaard, P.; Ditlevsen, S.; Mittendorfer, B.; Van Hall, G.; Wojtaszewski, J.F.; Pedersen, B.K. Inhibition of lipolysis stimulates peripheral glucose uptake but has no effect on endogenous glucose production in HIV lipodystrophy. Diabetes 2007, 56, 2070–2077. [Google Scholar] [CrossRef] [PubMed] [Green Version]
- Kakehi, S.; Tamura, Y.; Takeno, K.; Sakurai, Y.; Kawaguchi, M.; Watanabe, T.; Funayama, T.; Sato, F.; Ikeda, S.; Kanazawa, A.; et al. Increased intramyocellular lipid/impaired insulin sensitivity is associated with altered lipid metabolic genes in muscle of high responders to a high-fat diet. Am. J. Physiol. Endocrinol. Metab. 2016, 310, E32–E40. [Google Scholar] [CrossRef] [Green Version]
- Steele, R. Influences of glucose loading and of injected insulin on hepatic glucose output. Ann. N. Y. Acad. Sci. 1959, 82, 420–430. [Google Scholar] [CrossRef] [PubMed]
- Abdul-Ghani, M.; DeFronzo, R.A. Fasting hyperglycemia impairs glucose- but not insulin-mediated suppression of glucagon secretion. J. Clin. Endocrinol. Metab. 2007, 92, 1778–1784. [Google Scholar] [CrossRef] [PubMed] [Green Version]
- Ter Horst, K.W.; van Galen, K.A.; Gilijamse, P.W.; Hartstra, A.V.; de Groot, P.F.; van der Valk, F.M.; Ackermans, M.T.; Nieuwdorp, M.; Romijn, J.A.; Serlie, M.J. Methods for quantifying adipose tissue insulin resistance in overweight/obese humans. Int J. Obes. 2017, 41, 1288–1294. [Google Scholar] [CrossRef] [PubMed]
- Elahi, D.; Nagulesparan, M.; Hershcopf, R.J.; Muller, D.C.; Tobin, J.D.; Blix, P.M.; Rubenstein, A.H.; Unger, R.H.; Andres, R. Feedback inhibition of insulin secretion by insulin: Relation to the hyperinsulinemia of obesity. N. Engl. J. Med. 1982, 306, 1196–1202. [Google Scholar] [CrossRef] [PubMed]
- Kaga, H.; Tamura, Y.; Takeno, K.; Kakehi, S.; Funayama, T.; Furukawa, Y.; Nishitani-Yokoyama, M.; Shimada, K.; Daida, H.; Aoki, S.; et al. Correlates of insulin clearance in apparently healthy non-obese Japanese men. Sci. Rep. 2017, 7, 1462. [Google Scholar] [CrossRef] [Green Version]
- Takeno, K.; Tamura, Y.; Kawaguchi, M.; Kakehi, S.; Watanabe, T.; Funayama, T.; Furukawa, Y.; Kaga, H.; Yamamoto, R.; Kim, M.; et al. Relation between insulin sensitivity and metabolic abnormalities in Japanese men with BMI of 23–25 kg/m2. J. Clin. Endocrinol. Metab. 2016, 101, 3676–3684. [Google Scholar] [CrossRef] [Green Version]
- Tamura, Y.; Tanaka, Y.; Sato, F.; Choi, J.B.; Watada, H.; Niwa, M.; Kinoshita, J.; Ooka, A.; Kumashiro, N.; Igarashi, Y.; et al. Effects of diet and exercise on muscle and liver intracellular lipid contents and insulin sensitivity in type 2 diabetic patients. J. Clin. Endocrinol. Metab. 2005, 90, 3191–3196. [Google Scholar] [CrossRef] [Green Version]
- Rudovich, N.; Pivovarova, O.; Fisher, E.; Fischer-Rosinsky, A.; Spranger, J.; Mohlig, M.; Schulze, M.B.; Boeing, H.; Pfeiffer, A.F. Polymorphisms within insulin-degrading enzyme (IDE) gene determine insulin metabolism and risk of type 2 diabetes. J. Mol. Med. 2009, 87, 1145–1151. [Google Scholar] [CrossRef]
- Eaton, R.P.; Allen, R.C.; Schade, D.S. Hepatic removal of insulin in normal man: Dose response to endogenous insulin secretion. J. Clin. Endocrinol. Metab. 1983, 56, 1294–1300. [Google Scholar] [CrossRef]
- Scheen, A.J.; Lefebvre, P.J.; Luyckx, A.S. Glipizide increases plasma insulin but not C-peptide level after a standardized breakfast in type 2 diabetic patients. Eur. J. Clin. Pharmacol. 1984, 26, 471–474. [Google Scholar] [CrossRef] [PubMed]
- Shiba, K.; Tsuchiya, K.; Komiya, C.; Miyachi, Y.; Mori, K.; Shimazu, N.; Yamaguchi, S.; Ogasawara, N.; Katoh, M.; Itoh, M.; et al. Canagliflozin, an SGLT2 inhibitor, attenuates the development of hepatocellular carcinoma in a mouse model of human NASH. Sci. Rep. 2018, 8, 2362. [Google Scholar] [CrossRef] [PubMed] [Green Version]
- Li, M.; Xu, C.; Shi, J.; Ding, J.; Wan, X.; Chen, D.; Gao, J.; Li, C.; Zhang, J.; Lin, Y.; et al. Fatty acids promote fatty liver disease via the dysregulation of 3-mercaptopyruvate sulfurtransferase/hydrogen sulfide pathway. Gut 2018, 67, 2169–2180. [Google Scholar] [CrossRef] [PubMed]
- Yoshida, A.; Matsubayashi, Y.; Nojima, T.; Suganami, H.; Abe, T.; Ishizawa, M.; Fujihara, K.; Tanaka, S.; Kaku, K.; Sone, H. Attenuation of weight loss through improved antilipolytic effect in adipose tissue via the SGLT2 inhibitor tofogliflozin. J. Clin. Endocrinol. Metab. 2019, 104, 3647–3660. [Google Scholar] [CrossRef]
- Strang, B.D.; Bertics, S.J.; Grummer, R.R.; Armentano, L.E. Relationship of triglyceride accumulation to insulin clearance and hormonal responsiveness in bovine hepatocytes. J. Dairy Sci. 1998, 81, 740–747. [Google Scholar] [CrossRef]
- Kotronen, A.; Vehkavaara, S.; Seppala-Lindroos, A.; Bergholm, R.; Yki-Jarvinen, H. Effect of liver fat on insulin clearance. Am. J. Physiol. Endocrinol. Metab. 2007, 293, E1709–E1715. [Google Scholar] [CrossRef] [Green Version]
- Piccinini, F.; Polidori, D.C.; Gower, B.A.; Bergman, R.N. Hepatic but not extrahepatic insulin clearance is lower in African American than in European American women. Diabetes 2017, 66, 2564–2570. [Google Scholar] [CrossRef] [Green Version]
- Jensen, M.D.; Nielsen, S.; Gupta, N.; Basu, R.; Rizza, R.A. Insulin clearance is different in men and women. Metabolism 2012, 61, 525–530. [Google Scholar] [CrossRef] [Green Version]
- Meijer, R.I.; Barrett, E.J. The insulin receptor mediates insulin’s early plasma clearance by liver, muscle, and kidney. Biomedicines 2021, 9, 37. [Google Scholar] [CrossRef]


| Age (years) | 56.3 ± 7.3 |
| Duration of diabetes (years) | 3.3 ± 1.4 |
| Weight (kg) | 72.6 ± 6.9 |
| BMI (kg/m2) | 25.0 ± 2.4 |
| % body fat | 26.6 ± 5.2 |
| Systolic blood pressure (mmHg) | 142.6 ± 18.1 |
| Diastolic blood pressure (mmHg) | 86.7 ± 11.2 |
| Fasting glucose (mmol/L) | 8.88 ± 1.37 |
| Fasting insulin (pmol/mL) | 83.9 ± 45.9 |
| Glycated hemoglobin (%) | 7.7 ± 0.8 |
| . | Baseline Study | Acute Effect Study | p |
|---|---|---|---|
| SSSI (average from 340–360 min) (pmol/L) | 503.7 ± 53.1 | 499.4 ± 76.8 | 0.811 |
| EGP (0 min) (mg/kg·min−1) | 1.95 ± 0.18 | 1.99 ± 0.19 | 0.435 |
| EGP (180 min) (mg/kg·min−1) | 1.73 ± 0.14 | 2.07 ± 0.25 | <0.001 |
| EGP (360 min) (mg/kg·min−1) | 0.21 ± 0.20 | 0.36 ± 0.13 | 0.022 |
| % reduction of EGP (%) | 89.3 ± 10.7 | 81.2 ± 7.0 | 0.032 |
| % reduction of EGP/SSSI (%/μU·mL⁻1) | 1.29 ± 0.24 | 1.19 ± 0.19 | 0.247 |
| Rd (mg/kg FFM·min−1) | 4.11 ± 2.44 | 5.35 ± 2.10 | 0.008 |
| TGU (mg/kg FFM·min−1) | 4.11 ± 2.44 | 4.50 ± 2.12 | 0.209 |
| TGU/SSSI (μg/kg FFM·min−1 μU−1·mL) | 59.0 ± 33.2 | 67.4 ± 36.5 | 0.080 |
| % reduction of NEFA (%) | 78.4 ± 13.2 | 83.9 ± 6.6 | 0.093 |
| %reduction of NEFA/SSSI (%/μU·mL⁻1) | 1.13 ± 0.23 | 1.23 ± 0.22 | 0.158 |
| MCRI (mL/min per m2) | 594.7 ± 19.6 | 608.3 ± 26.2 | 0.605 |
| Baseline Study | Chronic Effect Study | p | |
|---|---|---|---|
| Weight (kg) | 73.2 ± 7.3 | 72.0 ± 7.0 | 0.013 |
| BMI (kg/m2) | 25.3 ± 2.6 | 24.9 ± 2.5 | 0.012 |
| % body fat | 26.7 ± 5.9 | 24.9 ± 4.7 | 0.073 |
| Free fat mass (kg) | 53.5 ± 4.8 | 53.9 ± 4.5 | 0.359 |
| Fat mass (kg) | 19.8 ± 5.4 | 18.1 ± 4.5 | 0.046 |
| Systolic blood pressure (mmHg) | 146.0 ± 18.0 | 125.1 ± 11.1 | <0.001 |
| Diastolic blood pressure (mmHg) | 87.6 ± 11.7 | 77.6 ± 10.8 | 0.003 |
| glycated hemoglobin (%) | 7.7 ± 0.9 | 7.0 ± 0.8 | 0.001 |
| Fasting glucose (mmol/L) | 9.2 ± 1.9 | 7.9 ± 0.9 | 0.025 |
| Fasting insulin (pmol/L) | 78.9 ± 43.1 | 64.6 ± 40.9 | 0.110 |
| Fasting C-peptide (ng/L) | 2.5 ± 0.8 | 2.3 ± 0.9 | 0.395 |
| Fasting glucagon (ng/L) | 51.5 ± 15.4 | 45.0 ± 17.5 | 0.205 |
| Fasting free fatty acids (μmol/L) | 979.1 ± 239.3 | 1001.2 ± 296.2 | 0.816 |
| Adiponectin (μg/mL) | 6.6 ± 2.7 | 6.2 ± 1.9 | 0.381 |
| Triglyceride (mmol/L) | 2.5 ± 1.3 | 3.1 ± 3.2 | 0.859 |
| High-density lipoprotein cholesterol (mmol/L) | 1.4 ± 0.7 | 1.4 ± 0.5 | 0.678 |
| Low-density lipoprotein cholesterol (mmol/L) | 3.3 ± 0.8 | 3.2 ± 1.3 | 0.668 |
| Aspartate transaminase (IU/L) | 26.7 ± 8.4 | 25.4 ± 10.1 | 0.310 |
| Alanine aminotransferase (IU/L) | 37.7 ± 16.5 | 29.4 ± 9.4 | 0.056 |
| High-sensitivity CRP (mg/dL) | 702.4 ± 318.9 | 663.4 ± 523.8 | 0.678 |
| Acetoacetic acid (µmol/L) | 56.1 ± 26.0 | 87.9 ± 71.2 | 0.374 |
| 1.3-hydroxybutyric acid (µmol/L) | 96.9 ± 67.1 | 178.6 ± 170.1 | 0.314 |
| Total ketone body (µmol/L) | 153.0 ± 92.7 | 266.4 ± 240.7 | 0.314 |
| Urinary glucose excretion (mmol/3 h) | 3.6 ± 7.5 | 214.6 ± 160.6 | 0.004 |
| Abdominal visceral fat area (cm2) | 191.2 ± 38.9 | 172.2 ± 32.9 | 0.060 |
| Abdominal subcutaneous fat area (cm2) | 194.7 ± 66.2 | 182.3 ± 65.9 | 0.043 |
| Intrahepatic lipid (%) | 17.6 ± 8.1 | 18.0 ± 8.4 | 0.893 |
| Intramyocellular lipid in TA (S-fat/Cre) | 4.9 ± 2.9 | 4.9 ± 2.5 | 0.933 |
| Intramyocellular lipid in SOL (S-fat/Cre) | 11.1 ± 4.6 | 8.3 ± 2.3 | 0.089 |
| EGP (0 min) (mg/kg·min−1) | 1.94 ± 0.19 | 2.23 ± 0.35 | 0.002 |
| EGP (360 min) (mg/kg·min−1) | 0.26 ± 0.14 | 0.37 ± 0.32 | 0.373 |
| % reduction of EGP (%) | 86.1 ± 7.7 | 87.8 ± 3.4 | 0.564 |
| % reduction of EGP/SSSI (%/μU·mL⁻1) | 1.22 ± 0.18 | 1.29 ± 0.19 | 0.307 |
| Rd (mg/kg FFM·min−1) | 4.26 ± 2.63 | 5.35 ± 2.73 | 0.035 |
| TGU (mg/kg FFM·min−1) | 4.25 ± 2.63 | 5.15 ± 2.74 | 0.059 |
| TGU/SSSI (μg/kg FFM·min−1 μU−1·mL) | 60.5 ± 36.0 | 77.4 ± 50.8 | 0.054 |
| % reduction of NEFA (%) | 76.3 ± 14.6 | 82.8 ± 9.7 | 0.116 |
| % reduction of NEFA/SSSI (%/μU·mL⁻1) | 1.09 ± 0.25 | 1.21 ± 0.23 | 0.260 |
| MCRI (mL/min per m2) | 582.5 ± 22.4 | 602.3 ± 22.3 | 0.405 |
Publisher’s Note: MDPI stays neutral with regard to jurisdictional claims in published maps and institutional affiliations. |
© 2021 by the authors. Licensee MDPI, Basel, Switzerland. This article is an open access article distributed under the terms and conditions of the Creative Commons Attribution (CC BY) license (https://creativecommons.org/licenses/by/4.0/).
Share and Cite
Sato, M.; Tamura, Y.; Kaga, H.; Yamasaki, N.; Kiya, M.; Kadowaki, S.; Sugimoto, D.; Funayama, T.; Someya, Y.; Kakehi, S.; et al. Short-Term SGLT2 Inhibitor Administration Does Not Alter Systemic Insulin Clearance in Type 2 Diabetes. Biomedicines 2021, 9, 1154. https://doi.org/10.3390/biomedicines9091154
Sato M, Tamura Y, Kaga H, Yamasaki N, Kiya M, Kadowaki S, Sugimoto D, Funayama T, Someya Y, Kakehi S, et al. Short-Term SGLT2 Inhibitor Administration Does Not Alter Systemic Insulin Clearance in Type 2 Diabetes. Biomedicines. 2021; 9(9):1154. https://doi.org/10.3390/biomedicines9091154
Chicago/Turabian StyleSato, Motonori, Yoshifumi Tamura, Hideyoshi Kaga, Nozomu Yamasaki, Mai Kiya, Satoshi Kadowaki, Daisuke Sugimoto, Takashi Funayama, Yuki Someya, Saori Kakehi, and et al. 2021. "Short-Term SGLT2 Inhibitor Administration Does Not Alter Systemic Insulin Clearance in Type 2 Diabetes" Biomedicines 9, no. 9: 1154. https://doi.org/10.3390/biomedicines9091154
APA StyleSato, M., Tamura, Y., Kaga, H., Yamasaki, N., Kiya, M., Kadowaki, S., Sugimoto, D., Funayama, T., Someya, Y., Kakehi, S., Nojiri, S., Satoh, H., Kawamori, R., & Watada, H. (2021). Short-Term SGLT2 Inhibitor Administration Does Not Alter Systemic Insulin Clearance in Type 2 Diabetes. Biomedicines, 9(9), 1154. https://doi.org/10.3390/biomedicines9091154