
Significant Implications of APOA1 Gene Sequence Variations and Its Protein Expression in Bladder Cancer


 ,
,
Abstract
:1. Introduction
2. Material and Methods
2.1. Study Subjects
2.2. Extraction of GenomicDNA
2.3. Polymerase Chain Reaction for the Amplification of APOA1 −75 G/A and +83 C/T
2.4. Polymerase Chain Reaction-Restriction Fragment Length Polymorphism (PCR-RFLP)
2.5. Expression of APOA1 in Urine of Bladder Tumor Patients by ELISA
2.6. Statistical Analysis
3. Results
3.1. Analysis of APOA1 −75 G/A Polymorphic Sequence Variation
3.2. Analysis of APOA1 +83 C/T Polymorphic SequenceVariation
3.3. Urinary Protein Expression of APOA1 and Potential Relationship with APOA1 −75 G/A and +83 C/T
4. Discussion
5. Conclusions
Supplementary Materials
Author Contributions
Funding
Institutional Review Board Statement
Informed Consent Statement
Data Availability Statement
Acknowledgments
Conflicts of Interest
References
- Tore, L.A.; Bray, F.; Siegel, R.L.; Ferlay, J.; Lortet-Tieulent, J.; Jemal, A. Global cancer statistics, 2012: Global Cancer Statistics, 2012. CA Cancer J. Clin. 2015, 65, 87–108. [Google Scholar] [CrossRef] [PubMed] [Green Version]
- Parkin, D.M. The global burden of urinary bladder cancer. Scand. J. Urol. Nephrol. 2008, 42, 12–20. [Google Scholar] [CrossRef] [PubMed]
- Ma, J.; Siegel, R.; Jemal, A. Pancreatic Cancer Death Ratesby Race Among US Menand Women, 1970–2009. J. Natl. Cancer Inst. 2013, 105, 1694–1700. [Google Scholar] [CrossRef] [PubMed] [Green Version]
- Clavel, J. Progress in the epidemiological understanding of gene–environment interactions in major diseases: Cancer. ComptesRendus Biol. 2007, 330, 306–317. [Google Scholar] [CrossRef] [Green Version]
- Pandith, A.A.; Siddiqi, M.A. Burden of cancers in the valley of Kashmir: 5 year epidemiological study reveals a different scenario. Tumor Biol. 2012, 33, 1629–1637. [Google Scholar] [CrossRef] [PubMed]
- Segrest, J.P.; Li, L.; Anantharamaiah, G.M.; Harvey, S.C.; Liadaki, K.N.; Zannis, V. Structure and function of apolipoprotein A-I and high-density lipoprotein. Curr. Opin. Lipidol. 2000, 11, 105–115. [Google Scholar] [CrossRef] [PubMed]
- Breslow, J.L.; Ross, D.; McPherson, J.; Williams, H.; Kurnit, D.; Nussbaum, A.L.; Karathanasis, S.K.; Zannis, V. Isolation and characterization of cDNA clones for human apolipoprotein A-I. Proc. Natl. Acad. Sci. USA 1982, 79, 6861–6865. [Google Scholar] [CrossRef] [Green Version]
- Clarke, C.H.; Yip, C.; Badgwell, D.; Fung, E.T.; Coombes, K.; Zhang, Z.; Lu, K.H.; Bast, R.C. Proteomic biomarkers apolipoprotein A1, truncated transthyretin and connective tissue activating protein III enhance the sensitivity of CA125 for detecting early stage epithelial ovarian cancer. Gynecol. Oncol. 2011, 122, 548–553. [Google Scholar] [CrossRef] [Green Version]
- Moore, L.E.; Fung, E.T.; McGuire, M.; Rabkin, C.C.; Molinaro, A.; Wang, Z.; Zhang, F.; Wang, J.; Yip, C.; Meng, X.-Y.; et al. Evaluation of ApolipoproteinA1 and Posttranslationally Modified Forms of Transthyretin as Biomarkers for Ovarian Cancer Detection in an Independent Study Population. Cancer Epidemiol. Biomark. Prev. 2006, 15, 1641–1646. [Google Scholar] [CrossRef] [Green Version]
- Charet, J.C.; Watine, J.; Marre, A.; Charet, P. Prognostic value of serum levels of cholesteroland apolipoprotein A1 in pulmonary cancer. Ann. Biol. Clin. 1997, 55, 52. [Google Scholar]
- Arinami, T.; Hirano, T.; Kobayashi, K.; Yamanouchi, Y.; Hamaguchi, H. Assignment of the apolipoprotein A-I gene to 11q23 based on RFLP in a case with a partial deletion of chromosome 11, del (11) (q23.3?qter). Qual. Life Res. 1990, 85, 39–40. [Google Scholar] [CrossRef]
- Kozak, K.R.; Su, F.; Whitelegge, J.P.; Faull, K.; Reddy, S.; Farias-Eisner, R. Characterization of serum biomarkers for detection of early stage ovarian cancer. Proteomics 2005, 5, 4589–4596. [Google Scholar] [CrossRef]
- Ai, J.; Tan, Y.; Ying, W.; Hong, Y.; Liu, S.; Wu, M.; Qian, X.; Wang, H. Proteome analysis of hepatocellular carcinoma by laser capture microdissection. Proteomics 2006, 6, 538–546. [Google Scholar] [CrossRef] [PubMed]
- Sirniö, P.; Väyrynen, J.P.; Klintrup, K.; Mäkelä, J.; Mäkinen, M.J.; Karttunen, T.J.; Tuomisto, A. Decreased serum apolipoprotein A1 levels are associated with poor survival and systemic inflammatory response in colorectalcancer. Sci. Rep. 2017, 7, 5374. [Google Scholar] [CrossRef]
- Ehmann, M.; Felix, K.; Hartmann, D.; Schnölzer, M.; Nees, M.; Vorderwülbecke, S.; Bogumil, R.; Büchler, M.W.; Friess, H. Identification of Potential Markers for the Detection of Pancreatic Cancer Through Comparative Serum Protein Expression Profiling. Pancreas 2007, 34, 205–214. [Google Scholar] [CrossRef] [PubMed]
- Karathanasis, S.K. Apolipoprotein multigene family: Tandem organization of human apolipoprotein AI, CIII, andAIVgenes. Proc. Natl. Acad. Sci. USA 1985, 82, 6374–6378. [Google Scholar] [CrossRef] [PubMed] [Green Version]
- Saha, N.; Tay, J.S.H.; Low, P.S.; Humphries, S.E. Guanidine to adenine (G/A) substitution in the promoter region of the apolipoprotein AI gene is associated with elevated serum apolipoprotein AI levels in chinese non-smokers. Genet. Epidemiol. 1994, 11, 255–264. [Google Scholar] [CrossRef]
- Wang, X.L.; Badenhop, R.; Humphrey, K.E.; Wilcken, D.E. New MspI polymorphism at +83 bp of the human apolipoprotein AI gene: Association with increased circulating high density lipoprotein cholesterol levels. Genet Epidemiol. 1996, 13, 1–10. [Google Scholar] [CrossRef]
- Dawar, R.; Gurtoo, A.; Singh, R. Apolipoprotein A1 Gene Polymorphism (G −75 A and C + 83 T) in Patients with Myocardial Infarction. Am. J. Clin. Pathol. 2010, 134, 249–255. [Google Scholar] [CrossRef] [Green Version]
- Liu, Z.; Xiao, Y.; Tang, L.; Jiang, L.; Wang, Y.; Zhang, R.; Wei, Q.; Lu, Y. Apolipoprotein A1 -75 G/A and +83 C/T polymorphisms and renal cancer risk. Lipids Health Dis. 2015, 14, 143. [Google Scholar] [CrossRef] [PubMed] [Green Version]
- Li, H.; Li, C.; Wu, H.; Zhang, T.; Wang, J.; Wang, S.; Chang, J. Identification of Apo-A1 as a biomarker for early diagnosis of bladder transitional cell carcinoma. Proteome Sci. 2011, 9, 21. [Google Scholar] [CrossRef] [Green Version]
- Han, C.; Zhang, H.-T.; Du, L.; Liu, X.; Jing, J.; Zhao, X.; Yang, X.; Tian, B. Serum Levels of Leptin, Insulin, and Lipids in Relation to Breast Cancer in China. Endocrine 2005, 26, 19–24. [Google Scholar] [CrossRef]
- Chang, S.-J.; Hou, M.-F.; Tsai, S.-M.; Wu, S.-H.; Hou, L.A.; Ma, H.; Shann, T.-Y.; Tsai, L.-Y. The association between lipid profiles and breast cancer among Taiwanese women. Clin. Chem. Lab. Med. 2007, 45, 1219–1223. [Google Scholar] [CrossRef]
- Jiang, R.; Yang, Z.-H.; Luo, D.-H.; Guo, L.; Sun, R.; Chen, Q.-Y.; Huang, P.-Y.; Qiu, F.; Zou, X.; Cao, K.-J.; et al. Elevated apolipoprotein A-I levels are associated with favorable prognosis in metastatic nasopharyngeal carcinoma. Med. Oncol. 2014, 31, 80. [Google Scholar] [CrossRef] [PubMed]
- Cheng, T.; Dai, X.; Zhou, D.-L.; Lv, Y.; Miao, L.-Y. Correlation of apolipoprotein A-I kinetics with survival and response to first-line platinum-based chemotherapy in advanced non-small cell lung cancer. Med. Oncol. 2015, 32, 407. [Google Scholar] [CrossRef]
- Costa, S.; Pinto, D.; Pereira, D.; Rodrigues, H.; Cameselle-Teijeiro, J.; Medeiros, R.; Schmitt, F. Importance of TP53 codon 72 and intron 3 duplication 16bppolymorphisms in prediction of susceptibility on breast cancer. BMC Cancer 2008, 8, 32. [Google Scholar] [CrossRef] [PubMed] [Green Version]
- Dixit, M.; Choudhuri, G.; Saxena, R.; Mittal, B. Association of Apolipoprotein A1-C3Gene Cluster Polymorphisms with Gall stone Disease. Can. J. Gastroenterol. 2007, 21, 569–575. [Google Scholar] [CrossRef] [PubMed] [Green Version]
- Hamrita, B.; Ben Nasr, H.; Gabbouj, S.; Bouaouina, N.; Chouchane, L.; Chahed, K. Apolipoprotein A1 −75G/A and +83 C/T polymorphisms: Susceptibility and prognostic implications in breast cancer. Mol. Biol. Rep. 2010, 38, 1637–1643. [Google Scholar] [CrossRef] [PubMed]
- Shi, H.; Huang, H.; Pu, J.; Shi, D.; Ning, Y.; Dong, Y.; Han, Y.; Zarogoulidis, P.; Bai, C. Decreased pretherapy serum apolipoprotein A-I is associated with extent of metastasis and poor prognosis of non-small-cell lung cancer. Onco Targets Ther. 2018, 11, 6995–7003. [Google Scholar] [CrossRef] [Green Version]
- Tabet, F.; Vickers, K.C.; Torres, L.F.C.; Wiese, C.B.; Shoucri, B.M.; Lambert, G.W.; Catherinet, C.; Prado-Lourenco, L.; Levin, M.G.; Thacker, S.; et al. HDL-transferred microRNA-223 regulates ICAM-1 expression in endothelial cells. Nat. Commun. 2014, 5, 3292. [Google Scholar] [CrossRef] [Green Version]
- Chistiakov, D.A.; Sobenin, I.A.; Orekhov, A.N.; Bobryshev, Y.V. Human miR-221/222 in Physiological and Atherosclerotic Vascular Remodeling. BioMed Res. Int. 2015, 2015, 354517. [Google Scholar] [CrossRef] [PubMed]
- Fang, L.; Choi, S.-H.; Baek, J.S.; Liu, C.; Almazan, F.; Ulrich, F.; Wiesner, P.; Taleb, A.; Deer, E.; Pattison, J.; et al. Control of angiogenesis by AIBP-mediated cholesterol efflux. Nat. Cell Biol. 2013, 498, 118–122. [Google Scholar] [CrossRef] [Green Version]
- Kadane, J.B.; A Lazar, N. Methods and Criteria for Model Selection. J. Am. Stat. Assoc. 2004, 99, 279–290. [Google Scholar] [CrossRef] [Green Version]
- Beuten, J.; Gelfond, J.A.; Franke, J.L.; Weldon, K.S.; Crandall, A.C.; Johnson-Pais, T.L.; Thompson, I.M.; Leach, R.J. Single and multi-genic analysis of theassociation between variants in 12 steroid hormone metabolism genes andrisk of prostate cancer. Cancer Epidemiol. Biomark. Prev. 2009, 18, 1869–1880. [Google Scholar] [CrossRef] [PubMed] [Green Version]
- Schottenfeld, D. Genetic and environmental factors in humancarcinogenesis. J. Clin. Epidemiol. 1986, 39, 1021–1030. [Google Scholar]
- Kamboh, M.; Aston, C.E.; Nestlerode, C.M.; McAllister, A.E.; Hamman, R.F. Haplotype analysis of two APOA1/MspI polymorphisms in relation to plasma levels of Apo A-I and HDL-cholesterol. Atherosclerosis 1996, 127, 255–262. [Google Scholar] [CrossRef]
- Luo, X.-L.; Zhong, G.-Z.; Hu, L.-Y.; Chen, J.; Liang, Y.; Chen, Q.-Y.; Liu, Q.; Rao, H.-L.; Chen, K.-L.; Cai, Q.-Q. Serum apolipoprotein A-I is a novel prognostic indicator for non-metastatic nasopharyngeal carcinoma. Oncotarget 2015, 6, 44037–44048. [Google Scholar] [CrossRef] [Green Version]
- Li, C.; Li, H.; Zhang, T.; Li, J.; Liu, L.; Chang, J. Discovery of Apo-A1 as a potential bladder cancer biomarker by urine proteomics and analysis. Biochem. Biophys. Res. Commun. 2014, 446, 1047–1052. [Google Scholar] [CrossRef] [PubMed]

| Genotyp | Cases (%) (n = 108) | Controls (%) (n = 150) | O.R (95% C.I) | p Value * |
|---|---|---|---|---|
| −75 GG | 48 (44.4) | 81 (54) | Ref. | |
| −75 GA | 40 (37.0) | 60 (40) | 1.2 (0.6–1.9) | 0.5 |
| −75 AA | 20 (18.5) | 09 (06) | 3.7 (1.24–10.3) | 0.001 |
| GA + AA | 60 (55.5) | 69 (46) | 1.2 (0.56–1.99) | 0.5 |
| −75 G allele | 136 (62.9) | 222 (74.0) | Ref. | |
| −75 A allele | 80 (37.1) | 78 (26.0) | 1.6 (1.03–2.61) | 0.004 |
| +83 CC | 44 (40.3) | 84 (55.0) | Ref. | |
| +83 CT | 54 (50.0) | 48 (33.0) | 2.1 (1.07–3.97) | 0.005 |
| +83 TT | 10 (9.7) | 18 (12.0) | 1.0 (0.54–3.8) | 0.9 |
| CT + TT | 64 (59.7) | 66 (45.0) | 1.3 (0.98–3.34) | 0.19 |
| +83 C allele | 142 (66.7) | 215 (72.0) | Ref. | |
| +83 T allele | 74 (33.3) | 85 (28.0) | 1.3 (0.53–1.40) | 0.17 |
| Parameter | Cases APOA1 −75 | Controls | O.R (95% C.I) | p Value | Cases APOA1 +85 | Controls | O.R (95% C.I) | p Value | ||||
|---|---|---|---|---|---|---|---|---|---|---|---|---|
| GG | GA + AA | GG | GA + AA | CC | CT + TT | CC | CT + TT | |||||
| Age | ||||||||||||
| <50 years | 18 | 21 | 26 | 19 | 1.5 (0.67–3.70) | 0.4 | 20 | 21 | 25 | 20 | 1.4 (0.54–3.70) | 0.4 |
| ≥50 years | 30 | 39 | 55 | 50 | 1.4 (0.66–3.09) | 0.4 | 28 | 39 | 56 | 49 | 1.5 (0.71–3.48) | 0.3 |
| Sex | ||||||||||||
| Male | 40 | 50 | 69 | 54 | 1.3 (0.67–2.66) | 0.4 | 42 | 48 | 61 | 60 | 1.2 (0.61–2.34) | 0.6 |
| Female | 8 | 10 | 12 | 15 | 1.6 (0.41–6.07) | 0.7 | 6 | 12 | 20 | 9 | 4.4 (1.3–15.4) | 0.03 |
| Smoking Status | ||||||||||||
| Smoker | 43 | 50 | 61 | 54 | 1.3 (0.65–2.47) | 0.5 | 39 | 54 | 68 | 47 | 1.5 (0.72–3.22) | 0.1 |
| Non-Smoker | 5 | 10 | 20 | 15 | 2.4 (0.52–11.10) | 0.4 | 5 | 10 | 16 | 19 | 1.2 (0.41–3.99) | 0.4 |
| Grade | ||||||||||||
| Low | 43 | 45 | Ref | 18 | 18 | |||||||
| High | 5 | 15 | 3.2 (0.07–1.24) | 0.04 | 14 | 23 | 1.6 (0.23–1.55) | 0.2 | ||||
| Pathologic Stage | ||||||||||||
| Ta | 16 | 14 | Ref | 9 | 8 | Ref | ||||||
| T1 | 29 | 34 | 0.7 (0.3–1.7) | 0.7 | 17 | 19 | 0.3 (0.8–1.5) | 0.17 | ||||
| T2 | 3 | 12 | 4.4 (3.03–12.3) | 0.05 | 5 | 13 | 0.6 (0.22–1.89) | 0.2 | ||||
| Haplotypes | Cases 108 (%) | Controls 150 (%) | OR (95%CI) | p Value * | |
|---|---|---|---|---|---|
| APOA1 −75 | APOA1 +83 | ||||
| G | C | 74 (34.2) | 82 (27.4) | 1(Ref) | |
| G | T | 6 (2.8) | 28 (9.4) | 0.2 (0.06–0.94) | 0.03 |
| A | C | 4 (1.9) | 10 (3.4) | 0.4 (0.08–2.5) | 0.4 |
| A | T | 10 (4.6) | 2 (0.07) | 5.5 (0.6–49.3) | 0.2 |
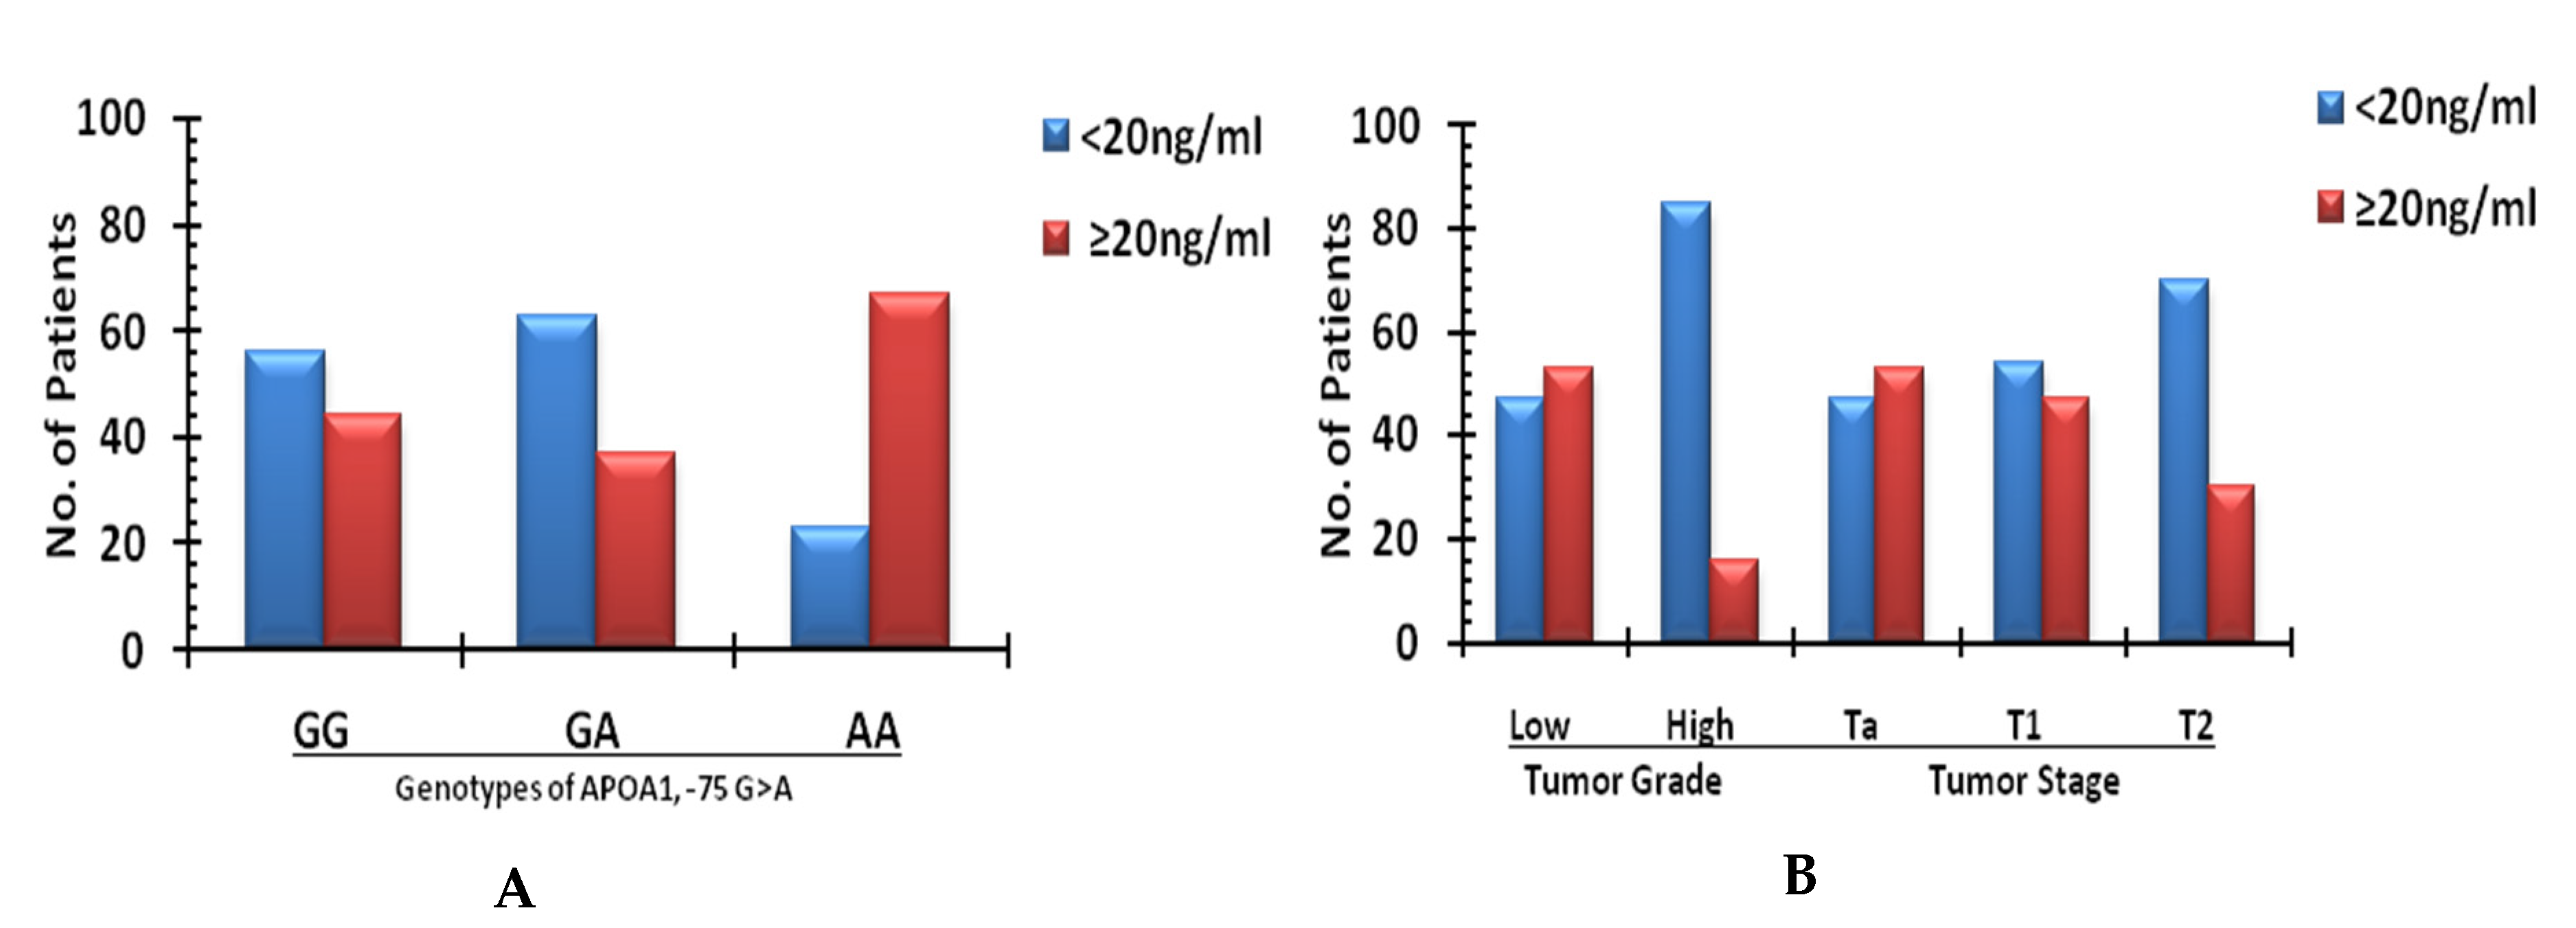
| Genotype | Cases (%) APO Expression | O.R (95% C.I) | p Value * | |
|---|---|---|---|---|
| <20 ng/mL | ≥20 ng/mL | |||
| APOA1 | ||||
| −75 GG | 29 (60.4) | 19 (39.5) | Ref | |
| −75 GA | 22 (63.0) | 18 (37.0) | 0.8 (0.30–2.64) | 0.9 |
| −75 AA | 6 (30.0) | 14 (70.0) | 1.5 (0.34–4.59) | 0.03 |
| APOA1 | ||||
| +83 CC | 30 (65.5) | 14 (34.5) | Ref | |
| +83 CT | 30 (44.5) | 24 (55.5) | 0.6 (0.66–5.24) | 0.2 |
| +83 TT | 05 (57.1) | 05 (42.9) | 0.5 (0.54–16.07) | 0.5 |
| Grade | ||||
| Low | 42 (47.5) | 46 (52.5) | Ref | |
| High | 17 (84.6) | 3 (15.4) | 6.08 (1.24–29.8) | 0.002 |
| Stage | ||||
| Ta | 15 (47.6) | 15 (52.4) | Ref | |
| T1 | 33 (52.3) | 30 (47.7) | (0.34–2.81) | 1 |
| T2 | 11 (73.3) | 4 (26.7) | 2.7 (0.71–10.6) | 0.2 |
| Smoking Status | ||||
| Yes | 54 (58.0) | 39 (41.9) | Ref | |
| No | 10 (66.7) | 5 (33.3) | 1.4 (0.46–4.5) | 0.5 |
| Gender | ||||
| Male | 54 (50.0) | 36 (33.4) | Ref | |
| Female | 5 (25.0) | 13 (75.0) | 4.5 (1.10–18.34) | 0.02 |
| Age | ||||
| ≥50 | 37 (49.4) | 38 (50.6) | Ref | |
| <50 | 21 (63.6) | 12 (36.4) | 0.5 (0.2–1.60) | 0.2 |
Publisher’s Note: MDPI stays neutral with regard to jurisdictional claims in published maps and institutional affiliations. |
© 2021 by the authors. Licensee MDPI, Basel, Switzerland. This article is an open access article distributed under the terms and conditions of the Creative Commons Attribution (CC BY) license (https://creativecommons.org/licenses/by/4.0/).
Share and Cite
Magray, J.A.; Pandith, A.A.; Qasim, I.; Khateeb, M.; Hamid, A.; Koul, A.; Shah, Z.A.; Baba, S.M.; Mansoor, S.; Charifi, W.; et al. Significant Implications of APOA1 Gene Sequence Variations and Its Protein Expression in Bladder Cancer. Biomedicines 2021, 9, 938. https://doi.org/10.3390/biomedicines9080938
Magray JA, Pandith AA, Qasim I, Khateeb M, Hamid A, Koul A, Shah ZA, Baba SM, Mansoor S, Charifi W, et al. Significant Implications of APOA1 Gene Sequence Variations and Its Protein Expression in Bladder Cancer. Biomedicines. 2021; 9(8):938. https://doi.org/10.3390/biomedicines9080938
Chicago/Turabian StyleMagray, Javid A., Arshad A. Pandith, Iqbal Qasim, Muzzain Khateeb, Arif Hamid, Aabid Koul, Zafar A. Shah, Shahid M. Baba, Sheikh Mansoor, Wafa Charifi, and et al. 2021. "Significant Implications of APOA1 Gene Sequence Variations and Its Protein Expression in Bladder Cancer" Biomedicines 9, no. 8: 938. https://doi.org/10.3390/biomedicines9080938
APA StyleMagray, J. A., Pandith, A. A., Qasim, I., Khateeb, M., Hamid, A., Koul, A., Shah, Z. A., Baba, S. M., Mansoor, S., Charifi, W., Ahmad, A., & Wani, M. S. (2021). Significant Implications of APOA1 Gene Sequence Variations and Its Protein Expression in Bladder Cancer. Biomedicines, 9(8), 938. https://doi.org/10.3390/biomedicines9080938