
Liver Fibrosis and 8-Year All-Cause Mortality Trajectories in the Aging Cohort of the Salus in Apulia Study

 ,
,  ,
, 
 , ,
, ,  , , , ,
 and
and
Abstract
:1. Introduction
2. Methods
2.1. Study Population
2.2. Clinical and Laboratory Examination
2.3. Multimorbidity, Non-Communicable Diseases, and Cardiovascular Risk Score
2.4. Anthropometric Assessment
2.5. Assessment of Physical Frailty and Liver Frailty
2.6. Alcohol Intake Assessment
2.7. Non-Invasive Liver Fibrosis Assessment
2.8. Statistical Analysis
3. Results
4. Discussion
Author Contributions
Funding
Institutional Review Board Statement
Informed Consent Statement
Data Availability Statement
Acknowledgments
Conflicts of Interest
References
- Chang, A.Y.; Skirbekk, V.F.; Tyrovolas, S.; Kassebaum, N.J.; Dieleman, J.L. Measuring population ageing: An analysis of the Global Burden of Disease Study 2017. Lancet Public Health 2019, 4, e159–e167. [Google Scholar] [CrossRef] [Green Version]
- Zupo, R.; Castellana, F.; Donghia, R.; Lampignano, L.; Guerra, V.; De Pergola, G.; Lozupone, M.; Bortone, I.; De Nucci, S.; Tatoli, R.; et al. Liver frailty and all-cause mortality in the older participants of the Salus in Apulia Study. GeroScience 2021. [Google Scholar] [CrossRef] [PubMed]
- GBD 2015 Mortality and Causes of Death Collaborators Global, Regional, and National Life Expectancy, All-Cause Mortality, and Cause-Specific Mortality for 249 Causes of Death, 1980–2015: A Systematic Analysis for the Global Burden of Disease Study 2015. Lancet 2016, 388, 1459–1544. [CrossRef] [Green Version]
- GBD 2015 Neurological Disorders Collaborator Group Global, Regional, and National Burden of Neurological Disorders during 1990–2015: A Systematic Analysis for the Global Burden of Disease Study 2015. Lancet Neurol. 2017, 16, 877–897.
- Asrani, S.K.; Devarbhavi, H.; Eaton, J.; Kamath, P.S. Burden of liver diseases in the world. J. Hepatol. 2019, 70, 151–171. [Google Scholar] [CrossRef] [PubMed]
- Pimpin, L.; Cortez-Pinto, H.; Negro, F.; Corbould, E.; Lazarus, J.V.; Webber, L.; Sheron, N.; EASL HEPAHEALTH Steering Committee. Burden of Liver Disease in Europe: Epidemiology and Analysis of Risk Factors to Identify Prevention Policies. J. Hepatol. 2018, 69, 718–735. [Google Scholar] [PubMed]
- Angulo, P.; Kleiner, D.E.; Dam-Larsen, S.; Adams, L.A.; Bjornsson, E.S.; Charatcharoenwitthaya, P.; Mills, P.R.; Keach, J.C.; Lafferty, H.D.; Stahler, A.; et al. Liver Fibrosis, but No Other Histologic Features, Is Associated With Long-term Outcomes of Patients With Nonalcoholic Fatty Liver Disease. Gastroenterology 2015, 149, 389–397.e10. [Google Scholar] [CrossRef] [Green Version]
- Solfrizzi, V.; Scafato, E.; Custodero, C.; Loparco, F.; Ciavarella, A.; Panza, F.; Seripa, D.; Imbimbo, B.P.; Lozupone, M.; Napoli, N.; et al. Liver fibrosis score, physical frailty, and the risk of dementia in older adults: The Italian Longitudinal Study on Aging. Alzheimer’s Dement. Transl. Res. Clin. Interv. 2020, 6, e12065. [Google Scholar] [CrossRef] [PubMed]
- Taylor, R.S.; Taylor, R.J.; Bayliss, S.; Hagström, H.; Nasr, P.; Schattenberg, J.M.; Ishigami, M.; Toyoda, H.; Wong, V.W.-S.; Peleg, N.; et al. Association Between Fibrosis Stage and Outcomes of Patients With Nonalcoholic Fatty Liver Disease: A Systematic Review and Meta-Analysis. Gastroenterology 2020, 158, 1611–1625.e12. [Google Scholar] [CrossRef] [PubMed] [Green Version]
- Palmieri, V.O.; Santovito, D.; Margari, F.; Lozupone, M.; Minerva, F.; Di Gennaro, C.; Todarello, O.; Palasciano, G. Psychopathological Profile and Health-Related Quality of Life (HRQOL) in Patients with Hepatocellular Carcinoma (HCC) and Cirrhosis. Clin. Exp. Med. 2015, 15, 65–72. [Google Scholar] [CrossRef]
- Sterling, R.K.; Lissen, E.; Clumeck, N.; Sola, R.; Correa, M.C.; Montaner, J.; Sulkowski, M.S.; Torriani, F.J.; Dieterich, D.T.; Thomas, D.L.; et al. Development of a simple noninvasive index to predict significant fibrosis in patients with HIV/HCV coinfection. Hepatology 2006, 43, 1317–1325. [Google Scholar] [CrossRef]
- Li, Y.; Regan, J.; Fajnzylber, J.; Coxen, K.; Corry, H.; Wong, C.; Rosenthal, A.; Atyeo, C.; Fischinger, S.; Gillespie, E.; et al. Liver fibrosis index FIB-4 is associated with mortality in COVID-19. Hepatol. Commun. 2021, 5, 434–445. [Google Scholar] [CrossRef] [PubMed]
- So-Armah, K.A.; Lim, J.K.; Re, V.L., III; Tate, J.P.; Chang, C.C.H.; Butt, A.A.; Gibert, C.L.; Rimland, D.; Marconi, V.C.; Goetz, M.B.; et al. FIB-4 stage of liver fibrosis is associated with incident heart failure with preserved, but not reduced, ejection fraction among people with and without HIV or hepatitis C. Prog. Cardiovasc. Dis. 2020, 63, 184–191. [Google Scholar] [CrossRef]
- De Vincentis, A.; Costanzo, L.; Vespasiani-Gentilucci, U.; Picardi, A.; Bandinelli, S.; Ferrucci, L.; Incalzi, R.A.; Pedone, C. Association between non-invasive liver fibrosis scores and occurrence of health adverse outcomes in older people. Dig. Liver Dis. 2019, 51, 1330–1336. [Google Scholar] [CrossRef] [PubMed]
- Sardone, R.; Castellana, F.; Bortone, I.; Lampignano, L.; Zupo, R.; Lozupone, M.; Griseta, C.; Dibello, V.; Seripa, D.; Guerra, V.; et al. Association Between Central and Peripheral Age-Related Hearing Loss and Different Frailty Phenotypes in an Older Population in Southern Italy. JAMA Otolaryngol. Neck Surg. 2021, 147, 561–571. [Google Scholar] [CrossRef]
- Castellana, F.; Lampignano, L.; Bortone, I.; Zupo, R.; Lozupone, M.; Griseta, C.; Daniele, A.; De Pergola, G.; Giannelli, G.; Sardone, R.; et al. Physical Frailty, Multimorbidity, and All-Cause Mortality in an Older Population From Southern Italy: Results from the Salus in Apulia Study. J. Am. Med. Dir. Assoc. 2021, 22, 598–605. [Google Scholar] [CrossRef] [PubMed]
- Goff, D.C.; Lloyd-Jones, D.M.; Bennett, G.; Coady, S.; D’agostino, R.B.; Gibbons, R.; Greenland, P.; Lackland, D.T.; Levy, D.; O’donnell, C.J.; et al. 2013 ACC/AHA guideline on the assessment of cardiovascular risk: A report of the American College of Cardiology/American Heart Association Task Force on Practice Guidelines. J. Am. Coll. Cardiol. 2014, 63, 2935–2959. [Google Scholar] [CrossRef] [Green Version]
- Ulijaszek, S.J. Obesity: Preventing and Managing the Global Epidemic. Report of a WHO Consultation. WHO Technical Report Series 894. Pp. 252. (World Health Organization, Geneva, 2000.) SFr 56.00, ISBN 92-4-120894-5, paperback. J. Biosoc. Sci. 2003, 35, 624–625. [Google Scholar] [CrossRef]
- Zupo, R.; Sardone, R.; Donghia, R.; Castellana, F.; Lampignano, L.; Bortone, I.; Misciagna, G.; De Pergola, G.; Panza, F.; Lozupone, M.; et al. Traditional Dietary Patterns and Risk of Mortality in a Longitudinal Cohort of the Salus in Apulia Study. Nutrients 2020, 12, 1070. [Google Scholar] [CrossRef] [PubMed]
- Carnovale, E.; Miuccio, F.C. Tabelle Di Composizione Degli Alimenti. In European Food Composition Tables in Translation; Arab, L., Wittler, M., Schettler, G., Eds.; Springer: Berlin/Heidelberg, Germany, 1987; pp. 63–67. [Google Scholar]
- European Association for the Study of the Liver (EASL); European Association for the Study of Diabetes (EASD); European Association for the Study of Obesity (EASO). EASL-EASD-EASO Clinical Practice Guidelines for the Management of Non-Alcoholic Fatty Liver Disease. J. Hepatol. 2016, 64, 1388–1402. [Google Scholar] [CrossRef] [PubMed]
- McPherson, S.; Hardy, T.; Dufour, J.-F.; Petta, S.; Romero-Gomez, M.; Allison, M.; Oliveira, C.P.; Francque, S.; Van Gaal, L.; Schattenberg, J.M.; et al. Age as a Confounding Factor for the Accurate Non-Invasive Diagnosis of Advanced NAFLD Fibrosis. Am. J. Gastroenterol. 2017, 112, 740–751. [Google Scholar] [CrossRef] [PubMed] [Green Version]
- Loaeza-Del-Castillo, A.; Paz-Pineda, F.; Oviedo-Cárdenas, E.; Sánchez-Ávila, F.; Vargas-Vorácková, F. AST to platelet ratio index (APRI) for the noninvasive evaluation of liver fibrosis. Ann. Hepatol. 2008, 7, 350–357. [Google Scholar] [CrossRef]
- Grissom, R.J.; Kim, J.J. Effect Sizes for Research: A Broad Practical Approach; Lawrence Erlbaum Associates Publishers: Mahwah, NI, USA, 2005. [Google Scholar]
- Villén, N.; Guisado-Clavero, M.; Fernández-Bertolín, S.; Troncoso-Mariño, A.; Foguet-Boreu, Q.; Amado, E.; Pons-Vigués, M.; Roso-Llorach, A.; Violán, C. Multimorbidity Patterns, Polypharmacy and Their Association with Liver and Kidney Abnormalities in People over 65 Years of Age: A Longitudinal Study. BMC Geriatr. 2020, 20, 206. [Google Scholar] [CrossRef] [PubMed]
- Shah, A.G.; Lydecker, A.; Murray, K.; Tetri, B.N.; Contos, M.J.; Sanyal, A.J. Nash Clinical Research Network Comparison of Noninvasive Markers of Fibrosis in Patients with Nonalcoholic Fatty Liver Disease. Clin. Gastroenterol. Hepatol. 2009, 7, 1104–1112. [Google Scholar] [CrossRef] [PubMed] [Green Version]
- Park, H.J.; Park, J.Y.; Jung, S.M.; Song, J.J.; Park, Y.-B.; Lee, S.-W. Fibrosis-4 index at diagnosis is associated with all-cause mortality in patients with microscopic polyangiitis and granulomatosis with polyangiitis. BMC Gastroenterol. 2019, 19, 1–6. [Google Scholar] [CrossRef] [PubMed] [Green Version]
- Kim, S.U.; Kim, B.K.; Park, J.Y.; Kim, D.Y.; Ahn, S.H.; Park, Y.-B.; Han, K.-H.; Lee, S.-W. Fibrosis-4 index at diagnosis can predict all-cause mortality in patients with rheumatoid arthritis: A retrospective monocentric study. Mod. Rheumatol. 2020, 30, 70–77. [Google Scholar] [CrossRef] [PubMed]
- Sato, Y.; Yoshihisa, A.; Kanno, Y.; Watanabe, S.; Yokokawa, T.; Abe, S.; Misaka, T.; Sato, T.; Suzuki, S.; Oikawa, M.; et al. Liver stiffness assessed by Fibrosis-4 index predicts mortality in patients with heart failure. Open Heart 2017, 4, e000598. [Google Scholar] [CrossRef]
- Singh, S.; Allen, A.M.; Wang, Z.; Prokop, L.J.; Murad, M.H.; Loomba, R. Fibrosis Progression in Nonalcoholic Fatty Liver vs Nonalcoholic Steatohepatitis: A Systematic Review and Meta-analysis of Paired-Biopsy Studies. Clin. Gastroenterol. Hepatol. 2015, 13, 643–654.e9. [Google Scholar] [CrossRef] [Green Version]
- Jayakumar, S.; Harrison, S.A.; Loomba, R. Noninvasive Markers of Fibrosis and Inflammation in Nonalcoholic Fatty Liver Disease. Curr. Hepatol. Rep. 2016, 15, 86–95. [Google Scholar] [CrossRef] [PubMed] [Green Version]
- Kurokawa, T.; Ohkohchi, N. Platelets in liver disease, cancer and regeneration. World J. Gastroenterol. 2017, 23, 3228–3239. [Google Scholar] [CrossRef]
- Jármay, K.; Karácsony, G.; Nagy, A.; Schaff, Z. Changes in Lipid Metabolism in Chronic Hepatitis C. World J. Gastroenterol. 2005, 11, 6422–6428. [Google Scholar] [CrossRef]
- Guy, J.; Peters, M.G. Liver Disease in Women: The Influence of Gender on Epidemiology, Natural History, and Patient Outcomes. Gastroenterol. Hepatol. 2013, 9, 633–639. [Google Scholar]
- Burra, P.; De Martin, E.; Gitto, S.; Villa, E. Influence of Age and Gender Before and After Liver Transplantation. Liver Transpl. 2013, 19, 122–134. [Google Scholar] [CrossRef] [PubMed]
- Stroffolini, T.; Sagnelli, E.; Sagnelli, C.; Morisco, F.; Babudieri, S.; Furlan, C.; Pirisi, M.; Russello, M.; Smedile, A.; Pisaturo, M.; et al. The association between education level and chronic liver disease of any etiology. Eur. J. Intern. Med. 2020, 75, 55–59. [Google Scholar] [CrossRef]
- Lee, J.; Vali, Y.; Boursier, J.; Spijker, R.; Anstee, Q.M.; Bossuyt, P.M.; Zafarmand, M.H. Prognostic Accuracy of FIB-4, NAFLD Fibrosis Score and APRI for NAFLD-Related Events: A Systematic Review. Liver Int. 2021, 41, 261–270. [Google Scholar] [CrossRef] [PubMed]
- Cozzolongo, R.; Osella, A.; Elba, S.; Petruzzi, J.; Buongiorno, G.; Giannuzzi, V.; Leone, G.; Bonfiglio, C.; Lanzilotta, E.; Manghisi, O.G.; et al. Epidemiology of HCV Infection in the General Population: A Survey in a Southern Italian Town. Am. J. Gastroenterol. 2009, 104, 2740–2746. [Google Scholar] [CrossRef]


| FIB-4 Score | Effect Size ‡ | |||||
|---|---|---|---|---|---|---|
| Low (a) | Intermediate (b) | High (c) | (a) vs. (b) | (a) vs. (c) | (b) vs. (c) | |
| Proportions (%) | 1120 (58.10) | 374 (19.40) | 435 (22.60) | |||
| Observation time (months) | 55.61 ± 22.32 | 55.93 ± 21.49 | 55.79 ± 22.51 | −0.01 (−0.13 to 0.10) | −0.01 (−0.11 to 0.10) | −0.01 (−0.13 to 0.14) |
| Sociodemographic variables | ||||||
| Age (years) | 71.98 ± 5.71 | 74.56 ± 5.99 | 76.77 ± 6.61 | −0.44 (−0.56 to −0.32) | −0.80 (−0.91 to −0.68) | −0.34 (−0.48 to −0.20) |
| Sex | ||||||
| Males | 508 (45.40) | 210 (56.10) | 256 (58.90) | −10.79 (−16.61 to −4.98) | −13.49 (−18.96 to −8.03) | −2.70 (−9.53 to 4.13) |
| Females | 612 (54.60) | 164 (43.90) | 179 (41.10) | |||
| BMI (kg/m2) | 28.47 ± 4.85 | 28.2 ± 4.74 | 28.55 ± 5.08 | 0.05 (−0.06 to 0.17) | −0.01 (−0.12 to 0.09) | −0.07 (−0.21 to 0.06) |
| Education (years) | 7.19 ± 3.85 | 6.9 ± 3.97 | 6.32 ± 3.57 | 0.07 (−0.04 to 0.19) | 0.23 (0.11 to 0.34) | 0.15 (0.01 to 0.29) |
| Smoking habits (%) | 97 (8.70) | 27 (7.20) | 27 (6.20) | −1.44 (−4.54 to 1.66) | −2.45 (−5.26 to 0.35) | 0.16 (0.02 to 0.30) |
| SBP (mmHg) | 132.7 ± 14.27 | 133.26 ± 14.71 | 133.79 ± 14.87 | −0.03 (−0.15 to 0.07) | −0.07 (−0.18 to 0.03) | −0.03 (−0.17 to 0.12) |
| DBP (mmHg) | 78.55 ± 7.54 | 77.91 ± 7.84 | 77.03 ± 8.86 | 0.08 (−0.03 to 0.20) | 0.17 (0.06 to 0.28) * | 0.10 (−0.04 to 0.24) * |
| Blood biomarkers | ||||||
| FBG (mg/dL) | 105.1 ± 27.33 | 107.33 ± 31.9 | 106.54 ± 27.7 | −0.07 (−0.19 to 0.05) * | 0.02 (−0.11 to 0.16) * | 0.03 (−0.11 to 0.17) * |
| HbA1c (mmol/mol) | 40.18 ± 9.91 | 41.15 ± 12.41 | 40.76 ± 10.24 | −0.08 (−0.20 to 0.04) * | −0.05 (−0.16 to 0.05) * | 0.03 (−0.10 to 0.17) * |
| Insulin (μU/mL) | 9.51 ± 7.02 | 8.34 ± 5.56 | 8.03 ± 6.14 | 0.21 (0.09 to 0.33) * | 0.24 (0.13 to 0.35) * | 0.05 (−0.09 to 0.19) * |
| TC (mg/dL) | 187.93 ± 37.28 | 181.83 ± 37.2 | 174.2 ± 35.29 | 0.16 (0.04 to 0.28) | 0.37 (0.26 to 0.48) | 0.21 (0.07 to 0.34) |
| HDL C (mg/dL) | 49.3 ± 12.94 | 48.25 ± 13.4 | 47.21 ± 12.81 | 0.08 (−0.03 to 0.19) | 0.16 (0.05 to 0.27) | 0.07 (−0.05 to 0.21) |
| LDL C (mg/dL) | 115.79 ± 31.3 | 110.86 ± 32.19 | 106.27 ± 28.93 | 0.15 (0.03 to 0.27) | 0.31 (0.19 to 0.42) | 0.15 (0.01 to 0.28) |
| Triglycerides (mg/dL) | 109.61 ± 62.48 | 106.85 ± 56.9 | 97.88 ± 60.66 | 0.04 (−0.07 to 0.16) | 0.18 (0.07 to 0.30) | 0.16 (0.02 to 0.30) |
| 25(OH)D3 (ng/mL) | 38.65 ± 17.85 | 39.65 ± 17.68 | 39.55 ± 17.37 | −0.05 (−0.17 to 0.06) | −0.05 (−0.16 to 0.06) | 0.01 (−0.13 to 0.14) |
| RBC (106 cells/mm3) | 4.83 ± 1.19 | 4.78 ± 0.49 | 4.7 ± 0.56 | 0.10 (−0.02 to 0.21) * | 0.24 (0.12 to 0.35) * | 0.15 (0.01 to 0.29) * |
| Inflammatory profile | ||||||
| CRP (mg/L) | 0.6 ± 0.93 | 0.54 ± 0.74 | 0.59 ± 0.74 | 0.09 (−0.03 to 0.21) * | 0.02 (−0.09 to 0.13) * | −0.06 (−0.20 to 0.06) * |
| Interleukin-6 (pg/mL) | 3.62 ± 6.36 | 4.18 ± 6.11 | 4.57 ± 7.99 | −0.09 (−0.21 to 0.03) * | −0.12 (−0.23 to −0.01) * | −0.05 (−0.19 to 0.08) * |
| TNF-α (pg/mL) | 2.62 ± 2.98 | 2.96 ± 4.28 | 3.17 ± 4.52 | −0.08 (−0.20 to 0.04) * | −0.12 (−0.23 to −0.01) * | −0.04 (−0.18 to 0.08) * |
| WBC (103 cells/mm3) | 6.3 ± 1.89 | 6.04 ± 1.82 | 5.76 ± 1.77 | 0.13 (0.02 to 0.25) | 0.28 (0.17 to 0.40) | 0.15 (0.01 to 0.29) |
| Liver Metabolism | ||||||
| FIB-4 Score | 1.43 ± 0.35 | 2.27 ± 0.18 | 4.83 ± 3.2 | −4.60 (−4.80 to−4.40) * | −1.06 (−1.18 to −0.94) * | −0.80 (−0.94, −0.66) * |
| APRI Score | 0.24 ± 0.08 | 0.36 ± 0.12 | 0.78 ± 0.60 | −1.02 (−1.31 to −0.89) * | −0.90 (−1.17, −0.79) * | −0.70 (−0.84 to −0.55) * |
| Platelets (103 cells/mm3) | 244.72 ± 57.75 | 201.85 ± 44.15 | 184.09 ± 53.58 | 0.78 (0.66 to 0.78) | 1.07 (0.95 to 1.18) | 0.35 (0.21 to 0.49) |
| AST (U/L) | 22.46 ± 6.86 | 29.46 ± 14.64 | 57.17 ± 46.12 | −0.48 (−0.60 to −0.36) * | −0.75 (−0.87 to −0.64) * | −0.60 (−0.74 to −0.46) * |
| ALT (U/L) | 25.54 ± 18.93 | 24.39 ± 18.59 | 27.45 ± 25.32 | 0.06 (−0.06 to 0.18) | −0.08 (−0.19 to 0.04) * | −0.12 (−0.26 to 0.02) * |
| GGT (U/L) | 28.94 ± 31.61 | 32.57 ± 34.63 | 46.52 ± 44.01 | −0.11 (−0.22 to 0.01) * | −0.40 (−0.51 to −0.29) * | −0.40 (−0.51 to −0.29) * |
| Non-communicable Diseases | ||||||
| Diabetes mellitus (%) | 132 (11.80) | 55 (14.70) | 58 (13.30) | 2.92 (−1.14 to 6.98) | 1.55 (−2.16 to 5.26) | −1.37 (−6.18 to 3.43) |
| ASCVD risk score | 14.8 ± 5.99 | 15.9 ± 6.10 | 15.9 ± 5.83 | −0.19 (−0.30 to −0.07) | −0.18 (−0.29 to −0.07) | 0.01 (−0.13 to 0.15) |
| Physical Frailty (%) | 145 (7.50) | 67 (17.90) | 74 (17.00) | 7.66 (0.98 to 14.34) | 6.77 (0.07 to 13.47) | 0.94 (0.65 to 1.35) |
| Peripheral ARHL (%) | 211 (18.80) | 89 (23.80) | 125 (28.70) | 4.96 (0.07 to 9.84) | 9.90 (5.07 to 14.73) | 4.94 (−1.12 to 11.00) |
| Hypertension (%) | 783 (69.90) | 262 (70.10) | 302 (69.40) | 0.14 (−5.22 to 5.51) | −0.49 (−5.58 to 4.61) | −0.63 (−6.98 to 5.72) |
| CI (%) | 54 (4.80) | 34 (9.10) | 41 (9.40) | 4.27 (1.10 to 7.44) | 4.60 (1.59 to 7.62) | 0.33 (−3.67 to 4.34) |
| Asthma (%) | 108 (9.60) | 38 (10.20) | 32 (7.40) | 0.52 (−3.00 to 4.03) | −2.29 (−5.29 to 0.71) | −2.80 (−6.73 to 1.12) |
| Vision loss (%) | 40 (3.60) | 12 (3.20) | 20 (4.60) | −0.36 (−2.45 to 1.73) | 1.03 (−1.22, 3.27) | 1.39 (−1.27 to 4.05) |
| COPD (%) | 196 (17.50) | 78 (20.90) | 69 (15.90) | 3.36 (−1.32 to 8.04) | −1.64 (−5.73 to 2.45) | −4.99 (−10.35 to 0.37) |
| LLD (%) | 80 (7.90) | 26 (8.30) | 34 (8.50) | 0.40 (−3.08 to 3.88) | 0.59 (−2.60 to 3.79) | 0.19 (−3.91 to 4.29) |
| Metabolic syndrome (%) | 134 (12.00) | 49 (10.79) | 51 (11.70) | −1.27 (−4.93 to 2.39) | −0.24 (−3.81 to 3.33) | 1.03 (−3.32 to 5.38) |
| Multimorbidity (%) | 17.93 ± 12.52 | 19.92 ± 13.74 | 19.64 ± 13.20 | −0.14 (−0.26 to −0.02) * | −0.07 (−0.18 to 0.03) | 0.05 (−0.08 to 0.19) |
| FIB-4 Score | APRI Score | ||||
|---|---|---|---|---|---|
| HR | 95% CI | HR | 95% CI | ||
| Model 1 | Model 1 | ||||
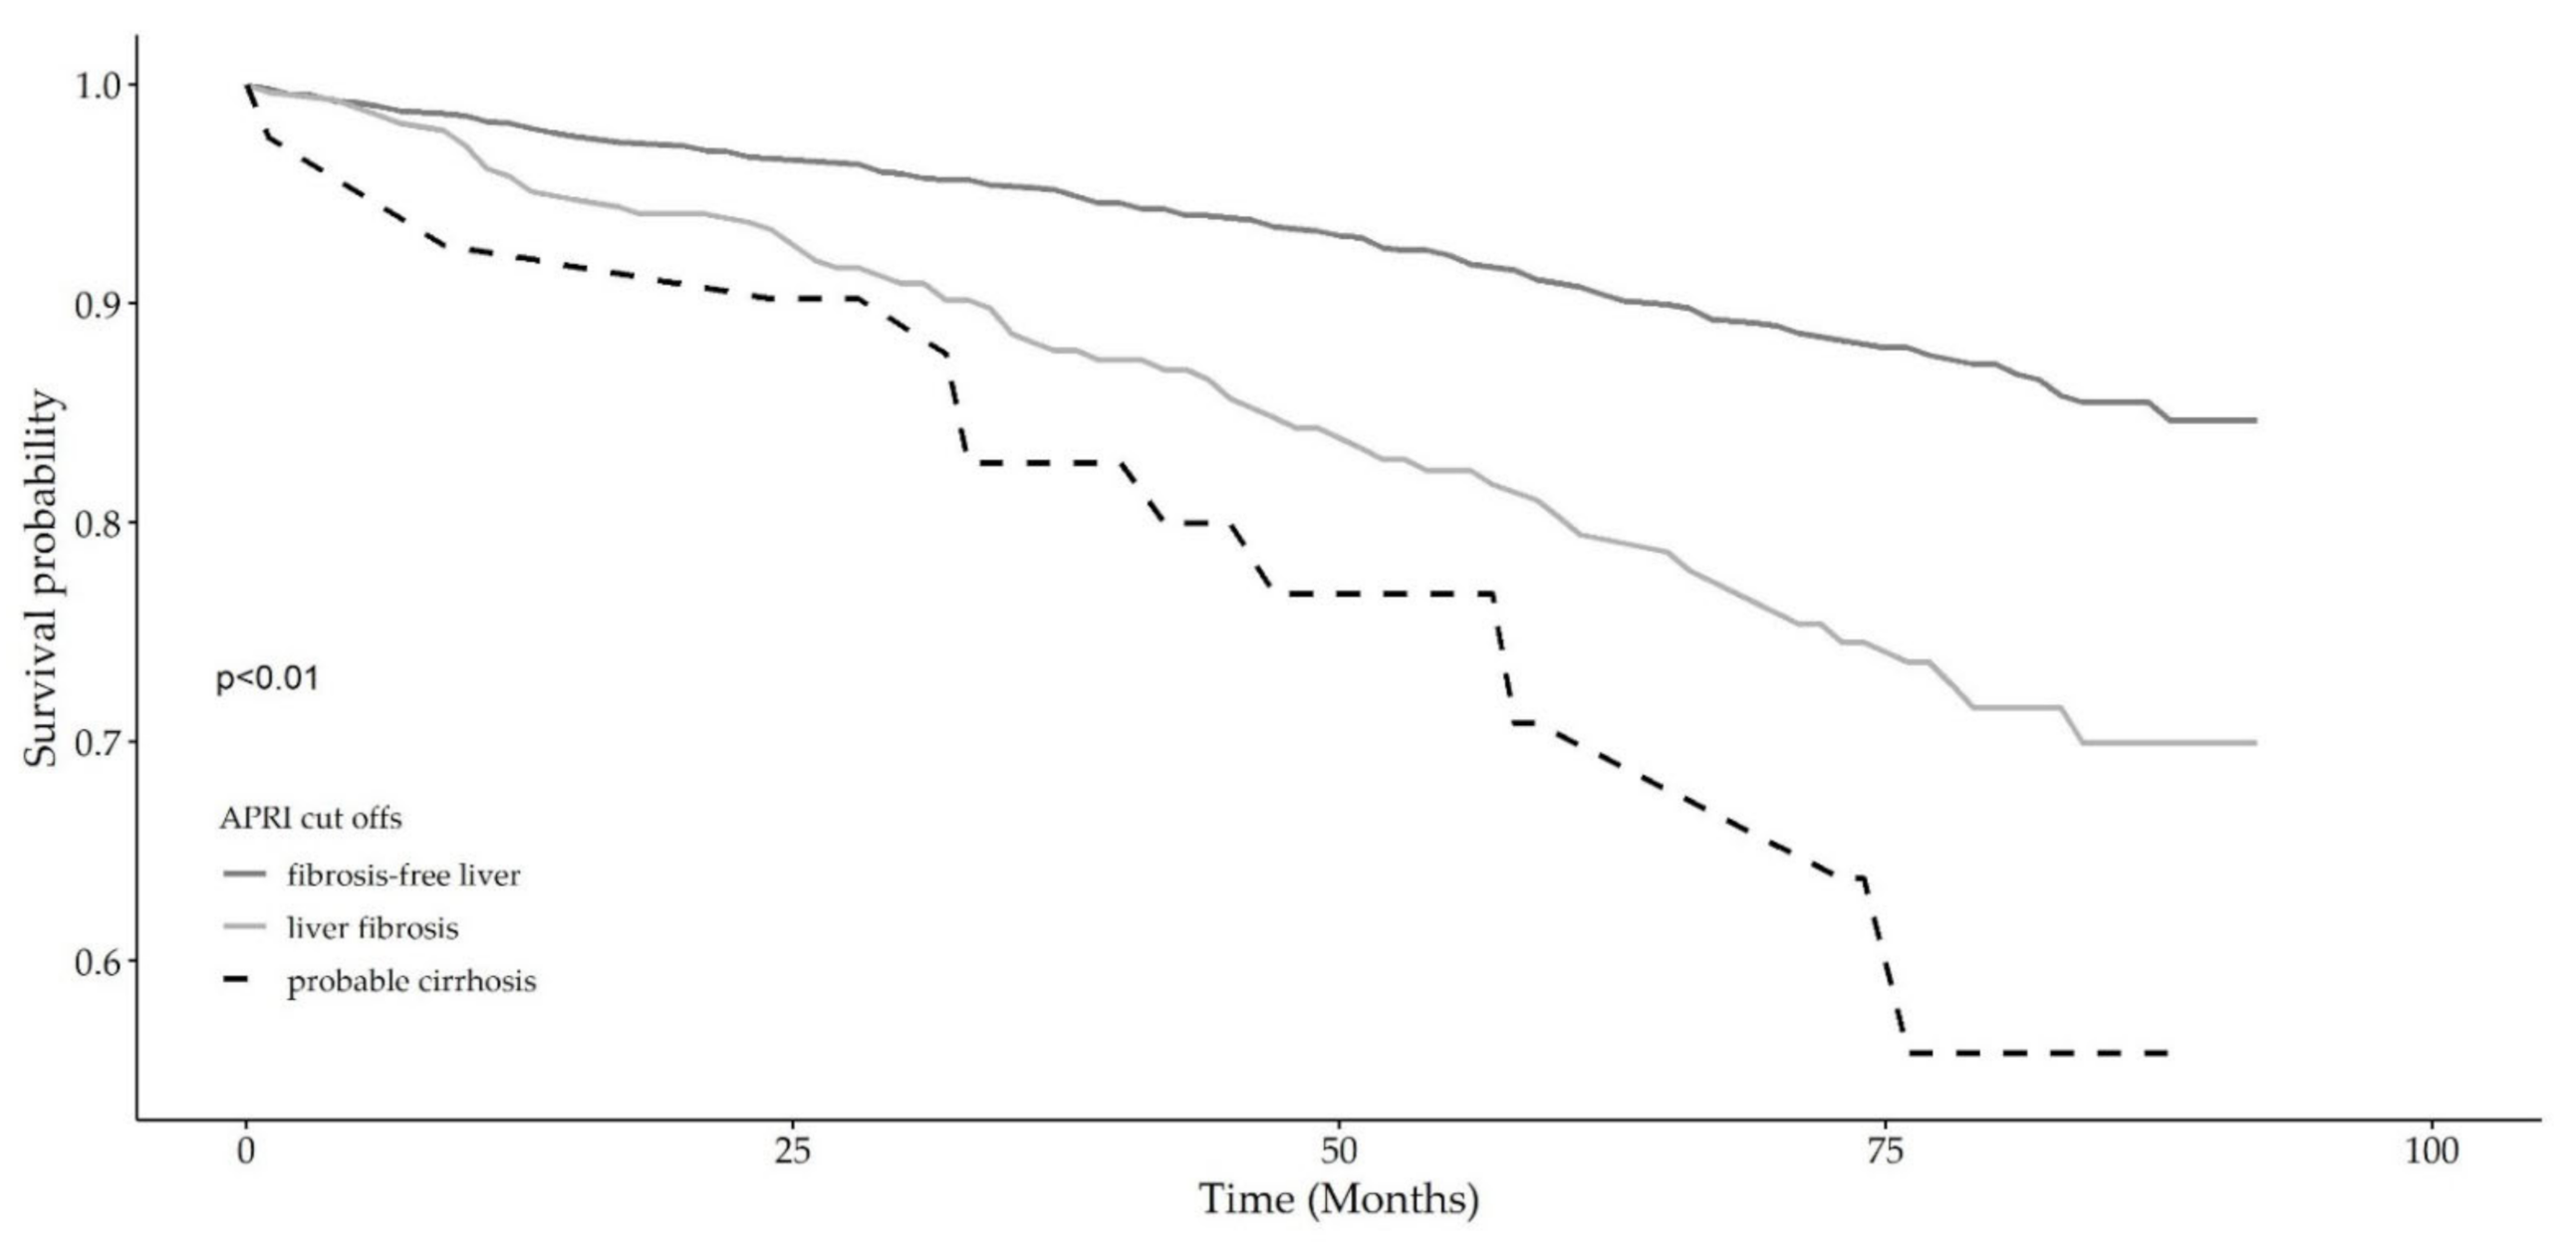
| Intermediate FIB-4 score | 1.51 | 1.04 to 2.21 | Liver Fibrosis | 2.31 | 1.71 to 3.13 |
| High FIB-4 score | 3.01 | 2.24 to 4.06 | Probable Cirrhosis | 3.60 | 1.99 to 6.49 |
| Model 2 | Model 2 | ||||
| Intermediate FIB-4 score | 1.16 | 0.76 to 1.69 | Liver Fibrosis | 1.70 | 1.25 to 2.32 |
| High FIB-4 score | 1.76 | 1.28 to 2.41 | Probable Cirrhosis | 2.09 | 1.14 to 3.80 |
| Model 3 | Model 3 | ||||
| Intermediate FIB-4 score | 1.12 | 0.77 to 1.64 | Liver Fibrosis | 1.69 | 1.24 to 2.30 |
| High FIB-4 score | 1.80 | 1.31 to 2.47 | Probable Cirrhosis | 2.18 | 1.19 to 3.98 |
Publisher’s Note: MDPI stays neutral with regard to jurisdictional claims in published maps and institutional affiliations. |
© 2021 by the authors. Licensee MDPI, Basel, Switzerland. This article is an open access article distributed under the terms and conditions of the Creative Commons Attribution (CC BY) license (https://creativecommons.org/licenses/by/4.0/).
Share and Cite
Zupo, R.; Castellana, F.; De Nucci, S.; De Pergola, G.; Lozupone, M.; Bortone, I.; Castellana, M.; Sborgia, G.; Lampignano, L.; Giannelli, G.; et al. Liver Fibrosis and 8-Year All-Cause Mortality Trajectories in the Aging Cohort of the Salus in Apulia Study. Biomedicines 2021, 9, 1617. https://doi.org/10.3390/biomedicines9111617
Zupo R, Castellana F, De Nucci S, De Pergola G, Lozupone M, Bortone I, Castellana M, Sborgia G, Lampignano L, Giannelli G, et al. Liver Fibrosis and 8-Year All-Cause Mortality Trajectories in the Aging Cohort of the Salus in Apulia Study. Biomedicines. 2021; 9(11):1617. https://doi.org/10.3390/biomedicines9111617
Chicago/Turabian StyleZupo, Roberta, Fabio Castellana, Sara De Nucci, Giovanni De Pergola, Madia Lozupone, Ilaria Bortone, Marco Castellana, Giancarlo Sborgia, Luisa Lampignano, Gianluigi Giannelli, and et al. 2021. "Liver Fibrosis and 8-Year All-Cause Mortality Trajectories in the Aging Cohort of the Salus in Apulia Study" Biomedicines 9, no. 11: 1617. https://doi.org/10.3390/biomedicines9111617
APA StyleZupo, R., Castellana, F., De Nucci, S., De Pergola, G., Lozupone, M., Bortone, I., Castellana, M., Sborgia, G., Lampignano, L., Giannelli, G., Panza, F., & Sardone, R. (2021). Liver Fibrosis and 8-Year All-Cause Mortality Trajectories in the Aging Cohort of the Salus in Apulia Study. Biomedicines, 9(11), 1617. https://doi.org/10.3390/biomedicines9111617