Lung Microbiome Differentially Impacts Survival of Patients with Non-Small Cell Lung Cancer Depending on Tumor Stroma Phenotype

 ,
, 
 , , and
Abstract
1. Introduction
2. Materials and Methods
2.1. Ethics Statement
2.2. Sample Collection
2.3. Immunohistochemical Study
2.4. Quantitative PCR (qPCR)
2.5. 16S rRNA Gene Library Preparation and MiSeq Sequencing
2.6. Bioinformatics Treatment
Availability of Data
2.7. Statistical Analyses
3. Results
3.1. Clinical Samples
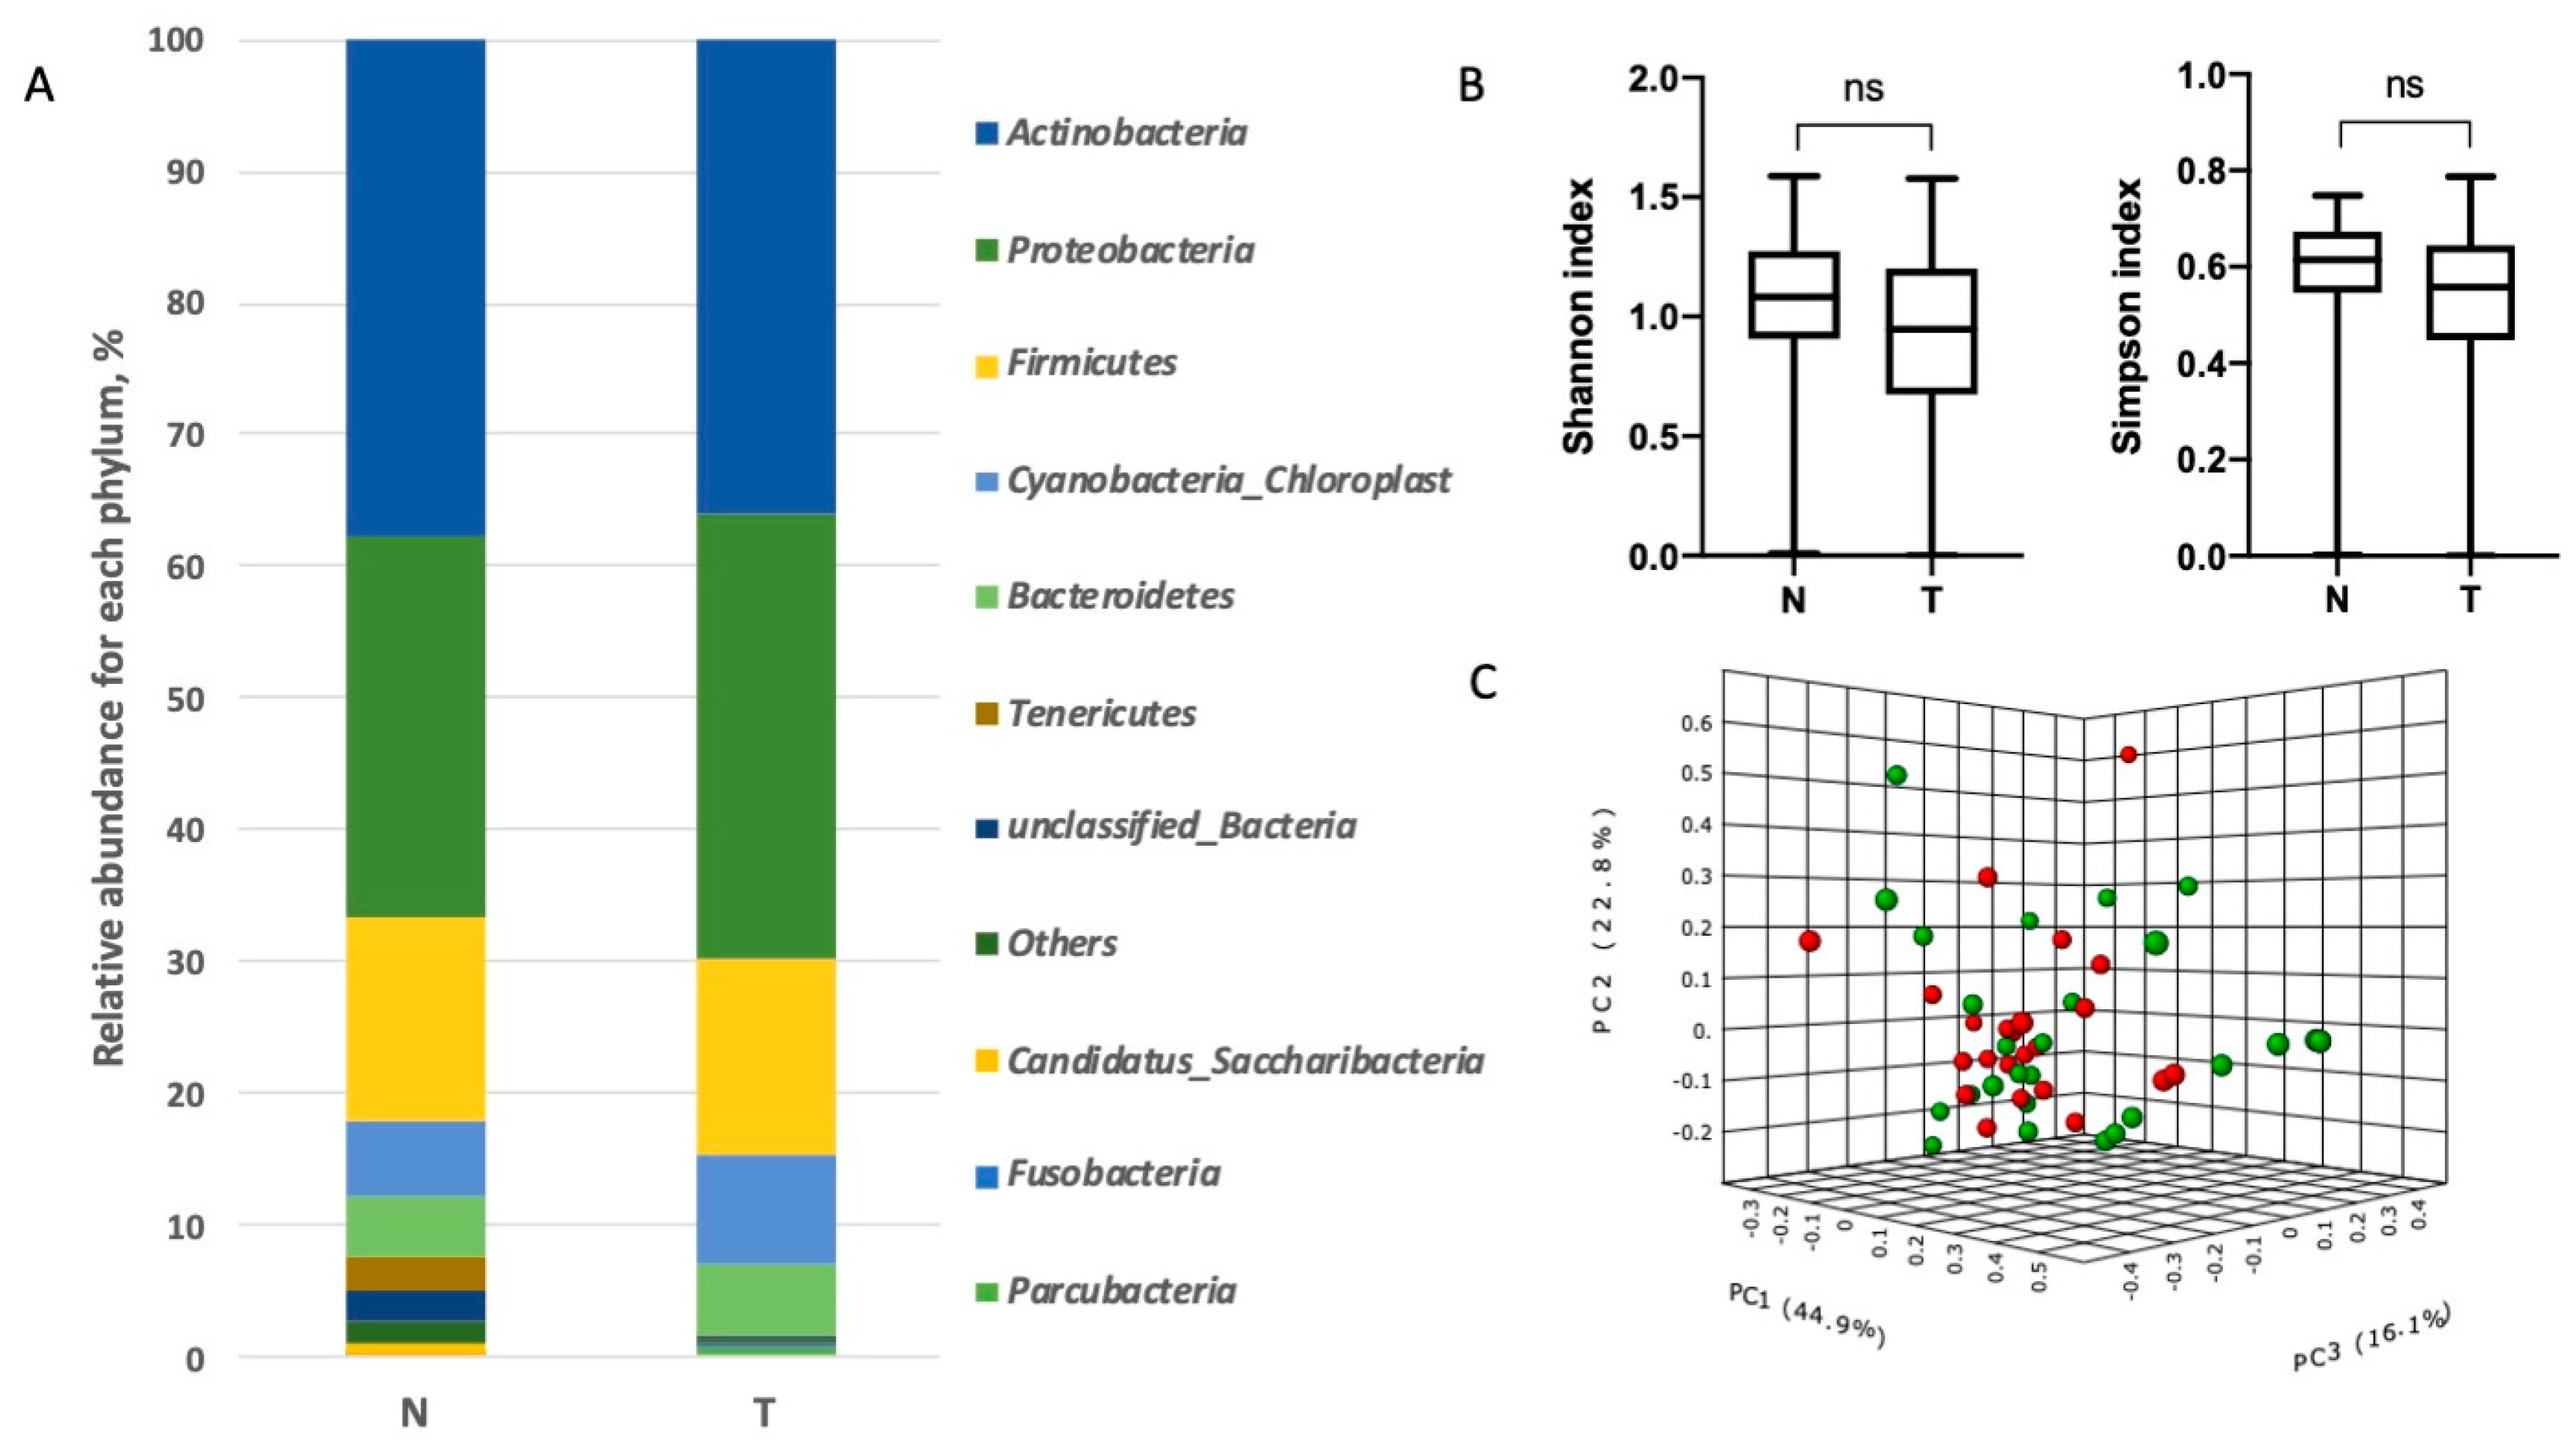
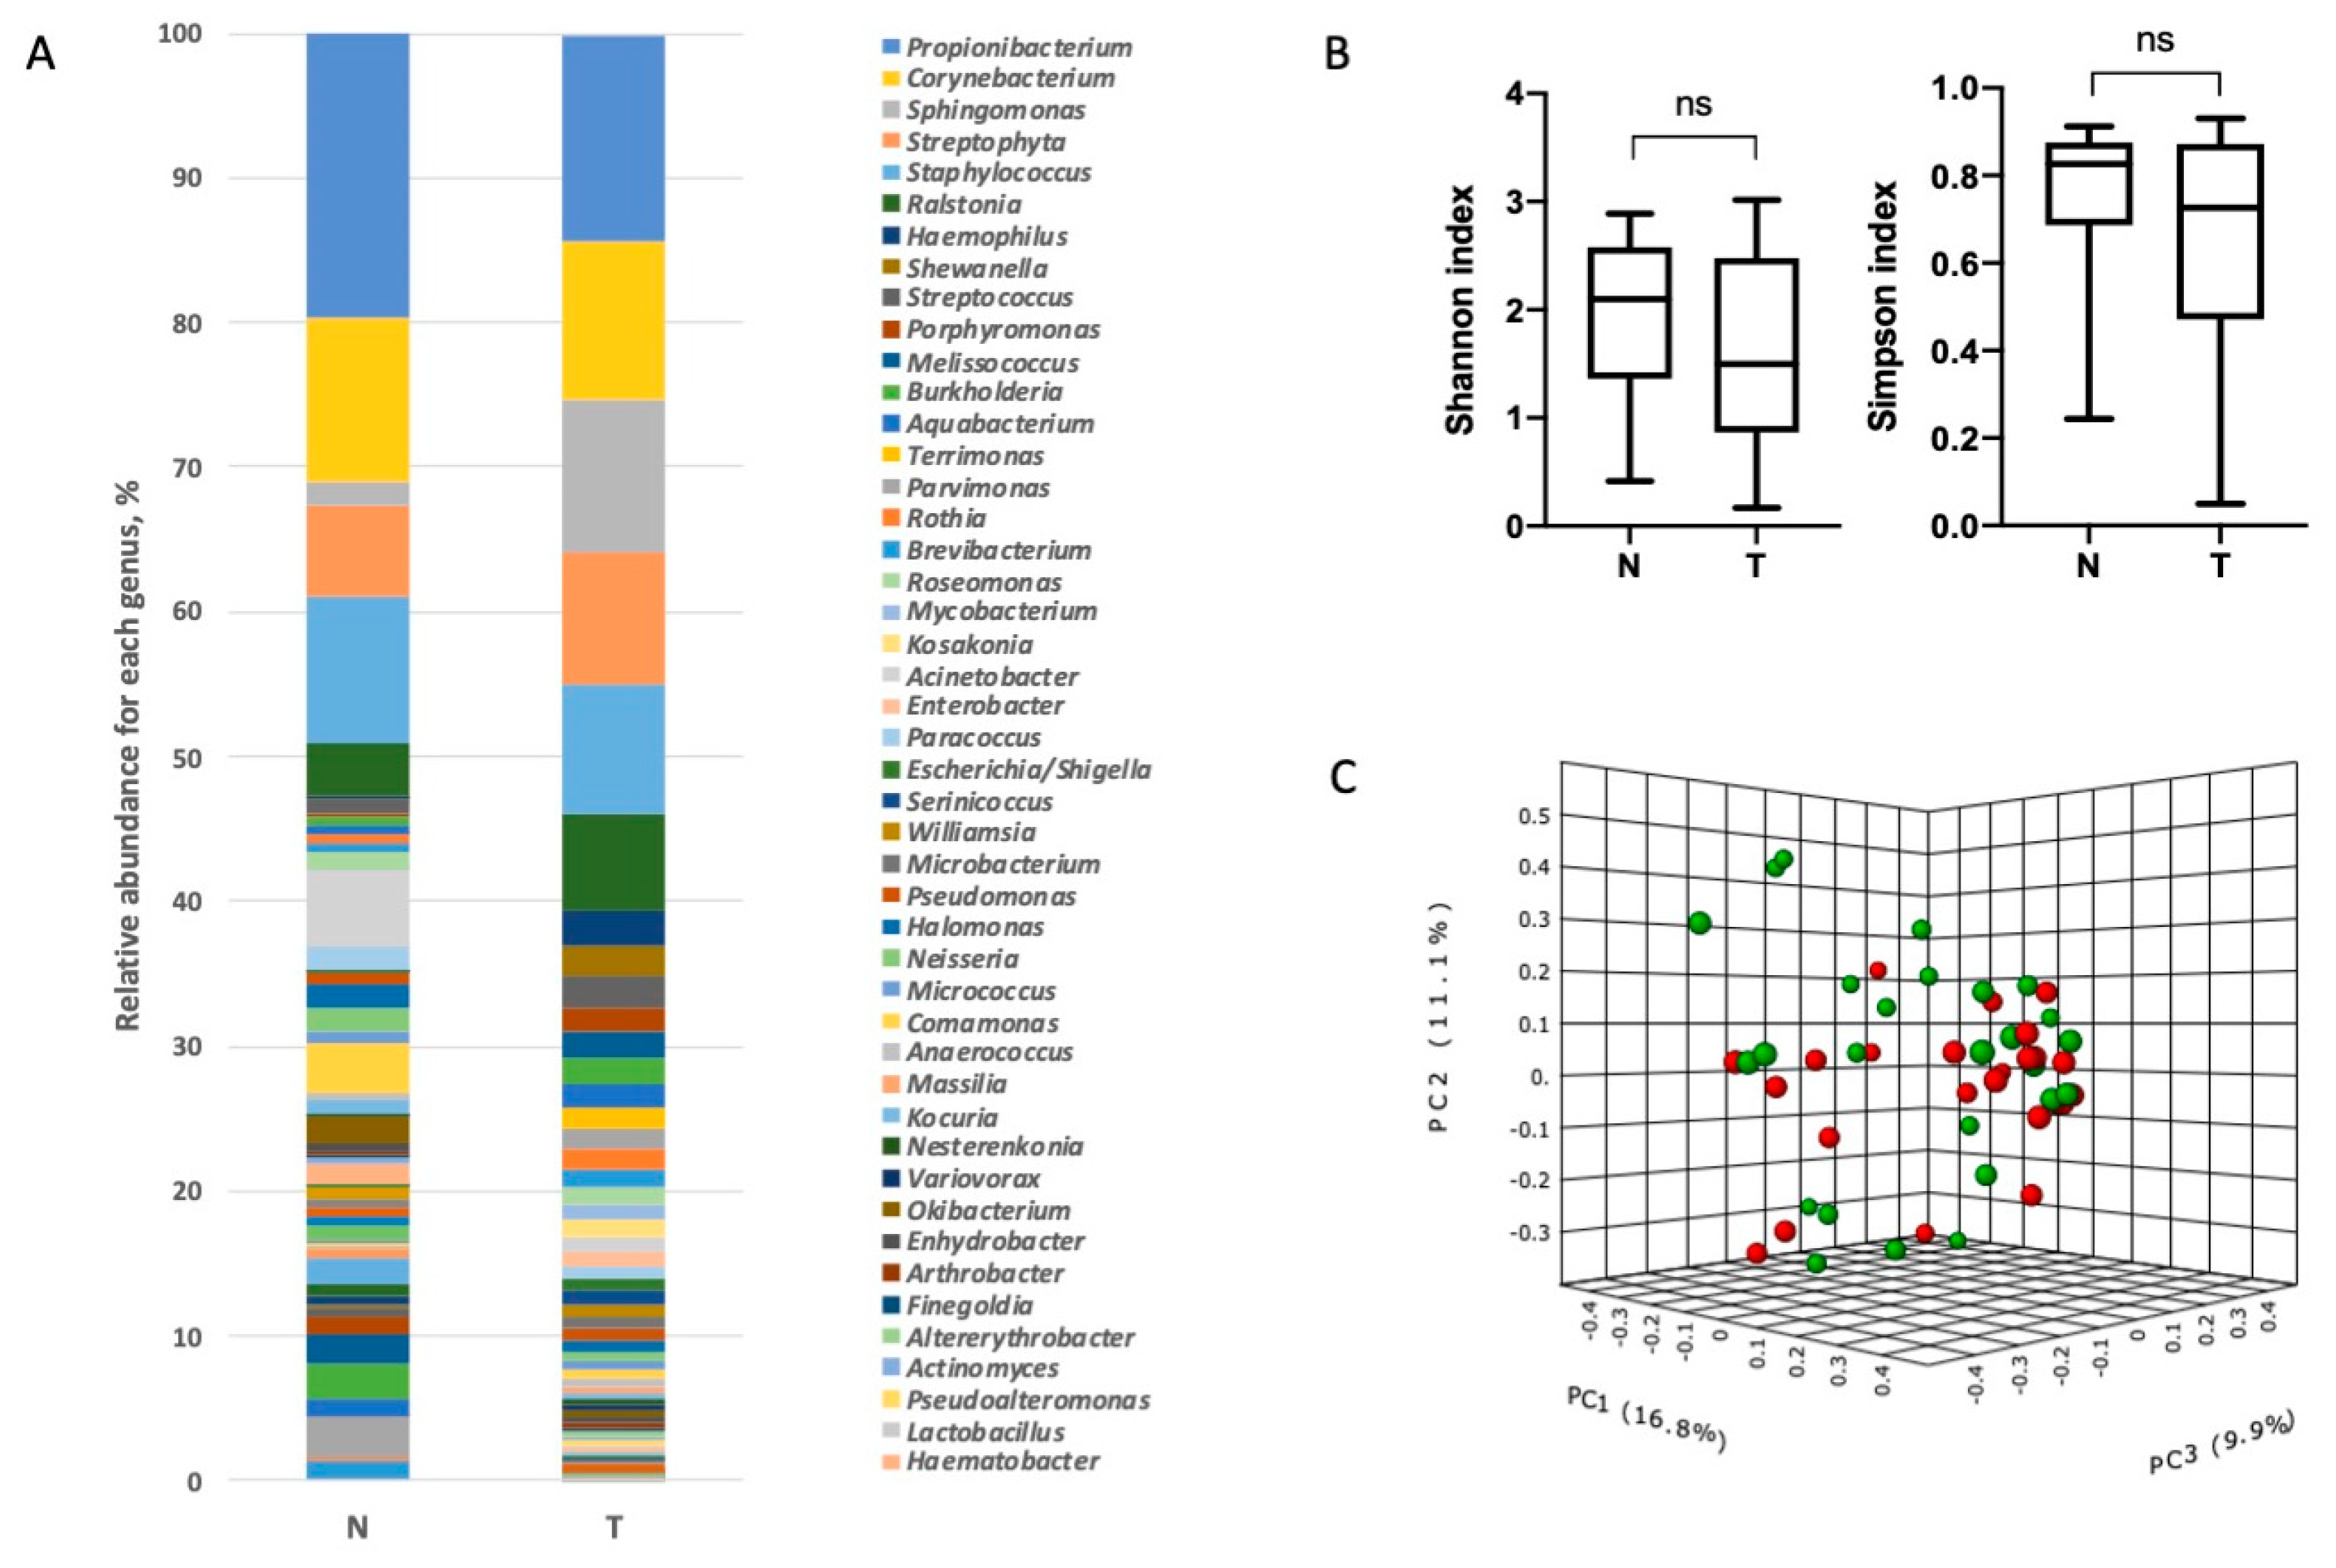
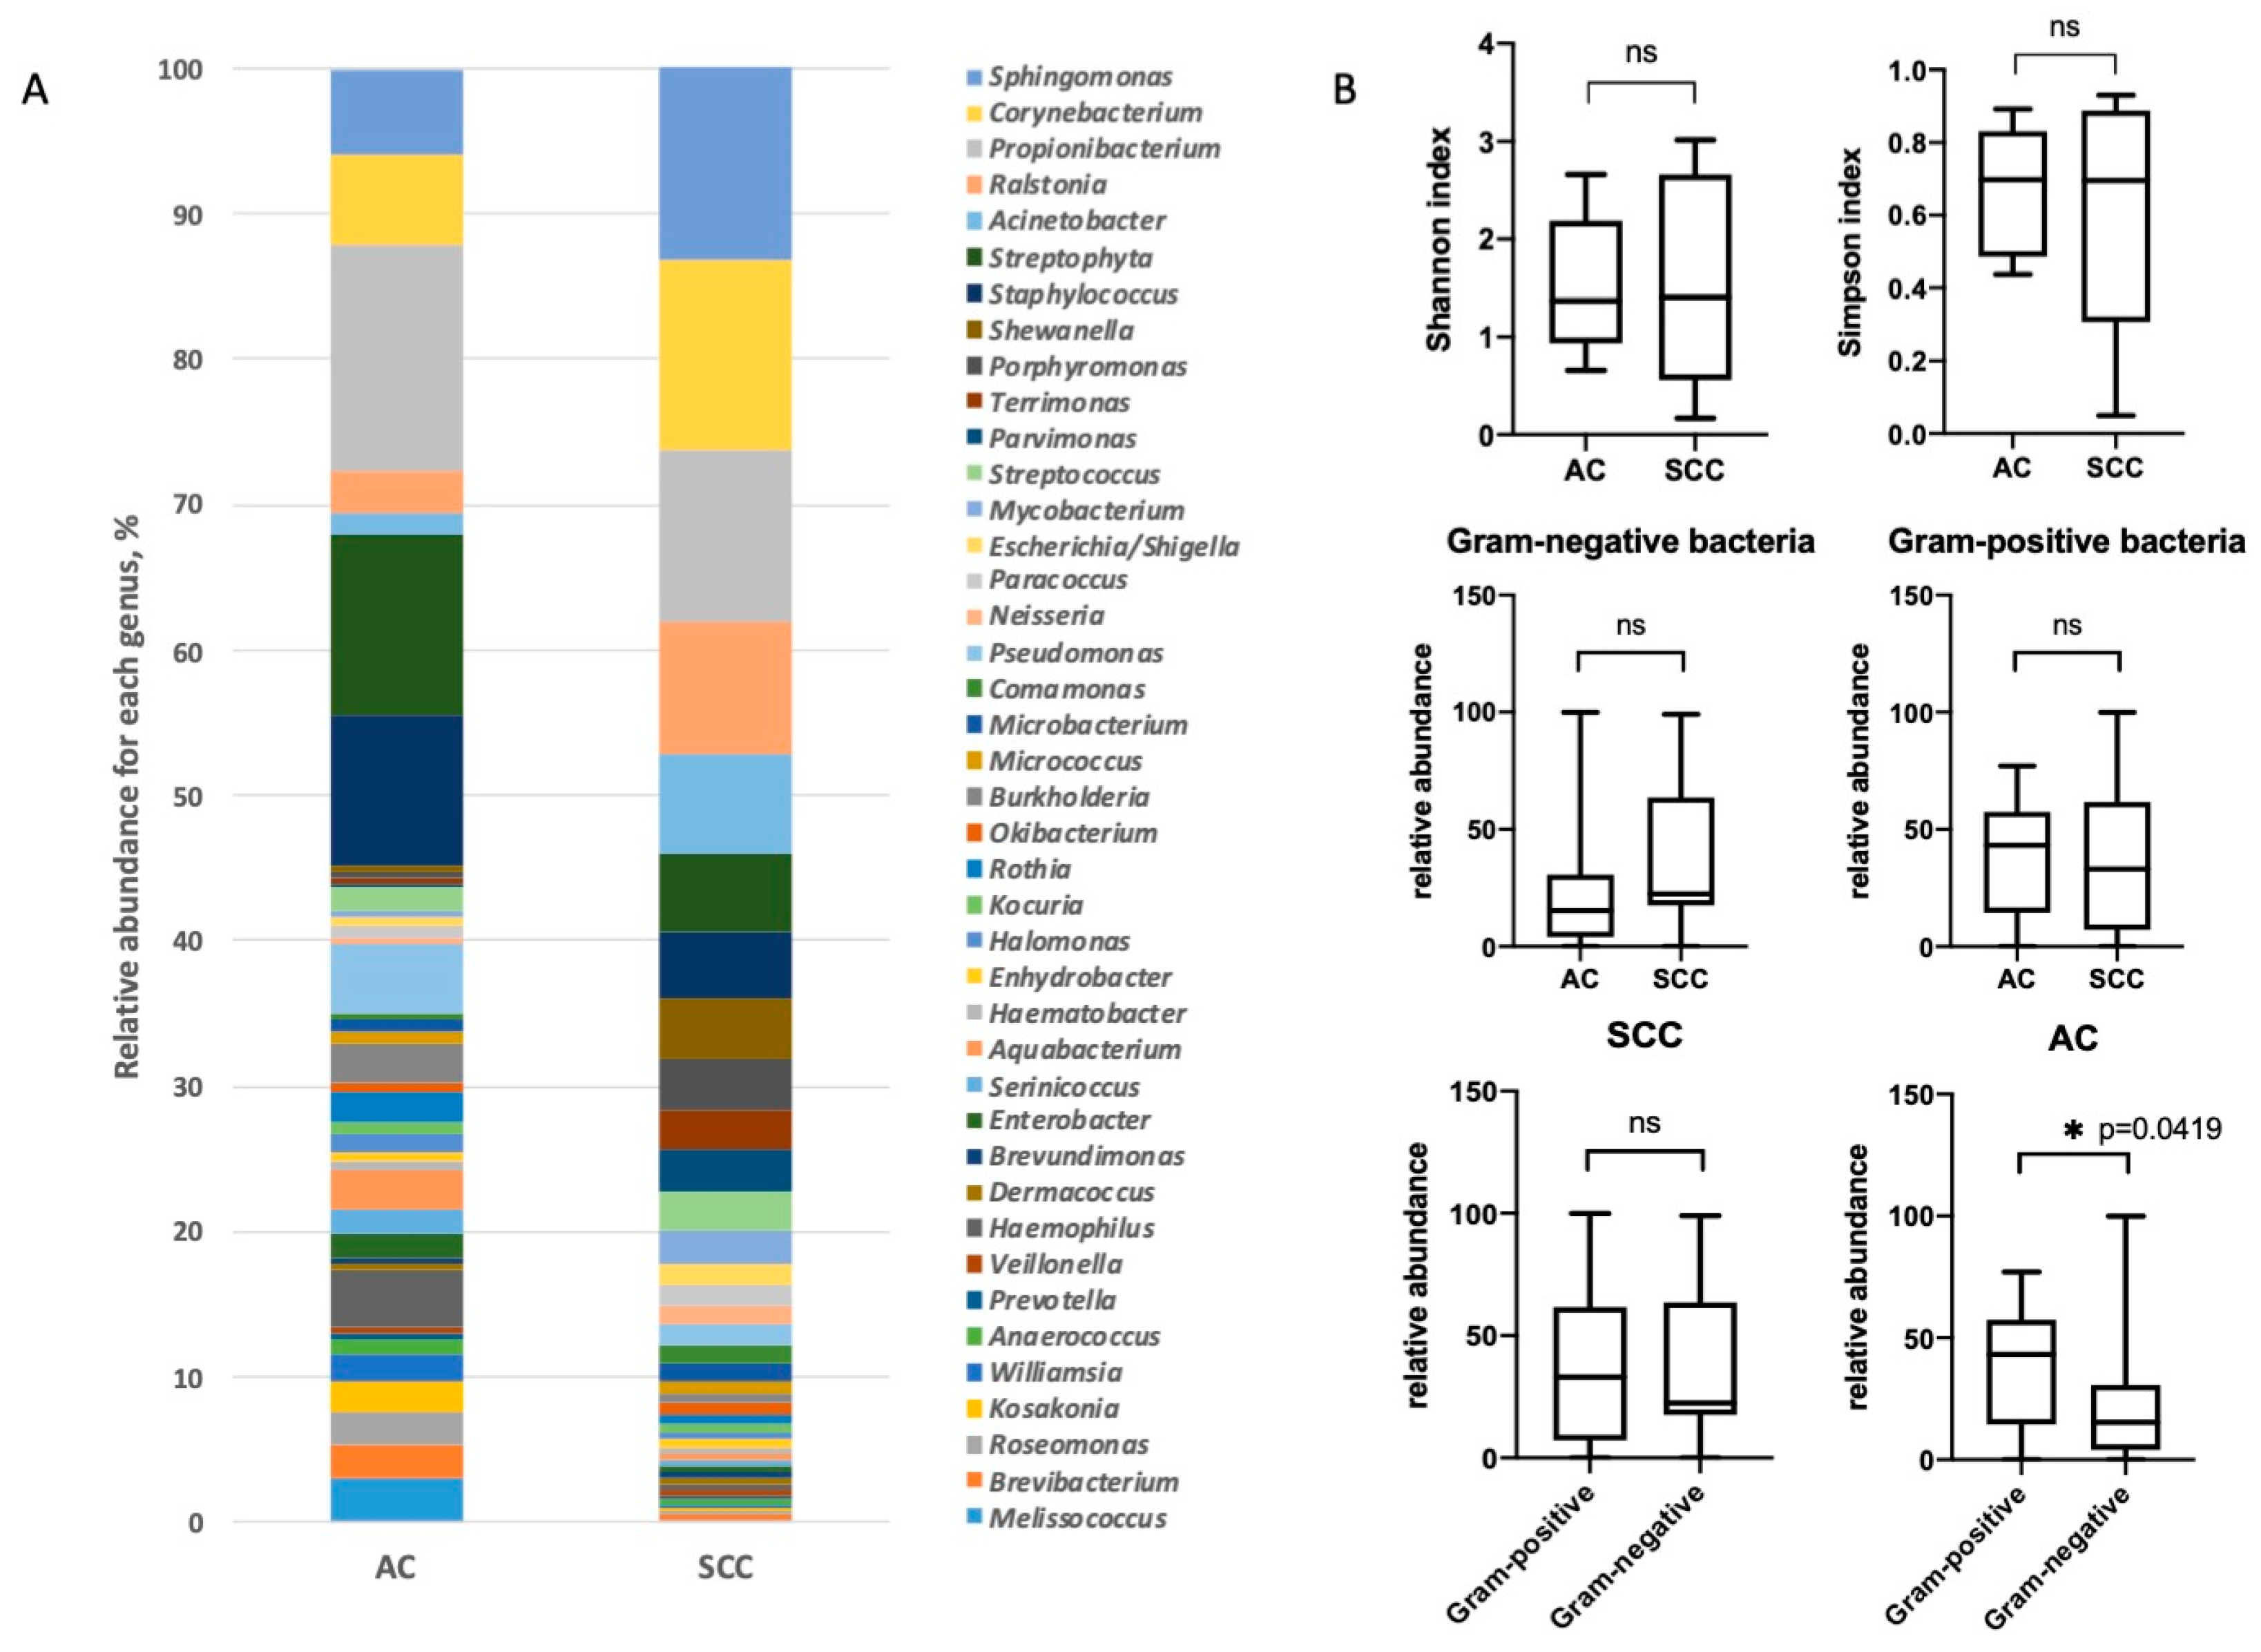
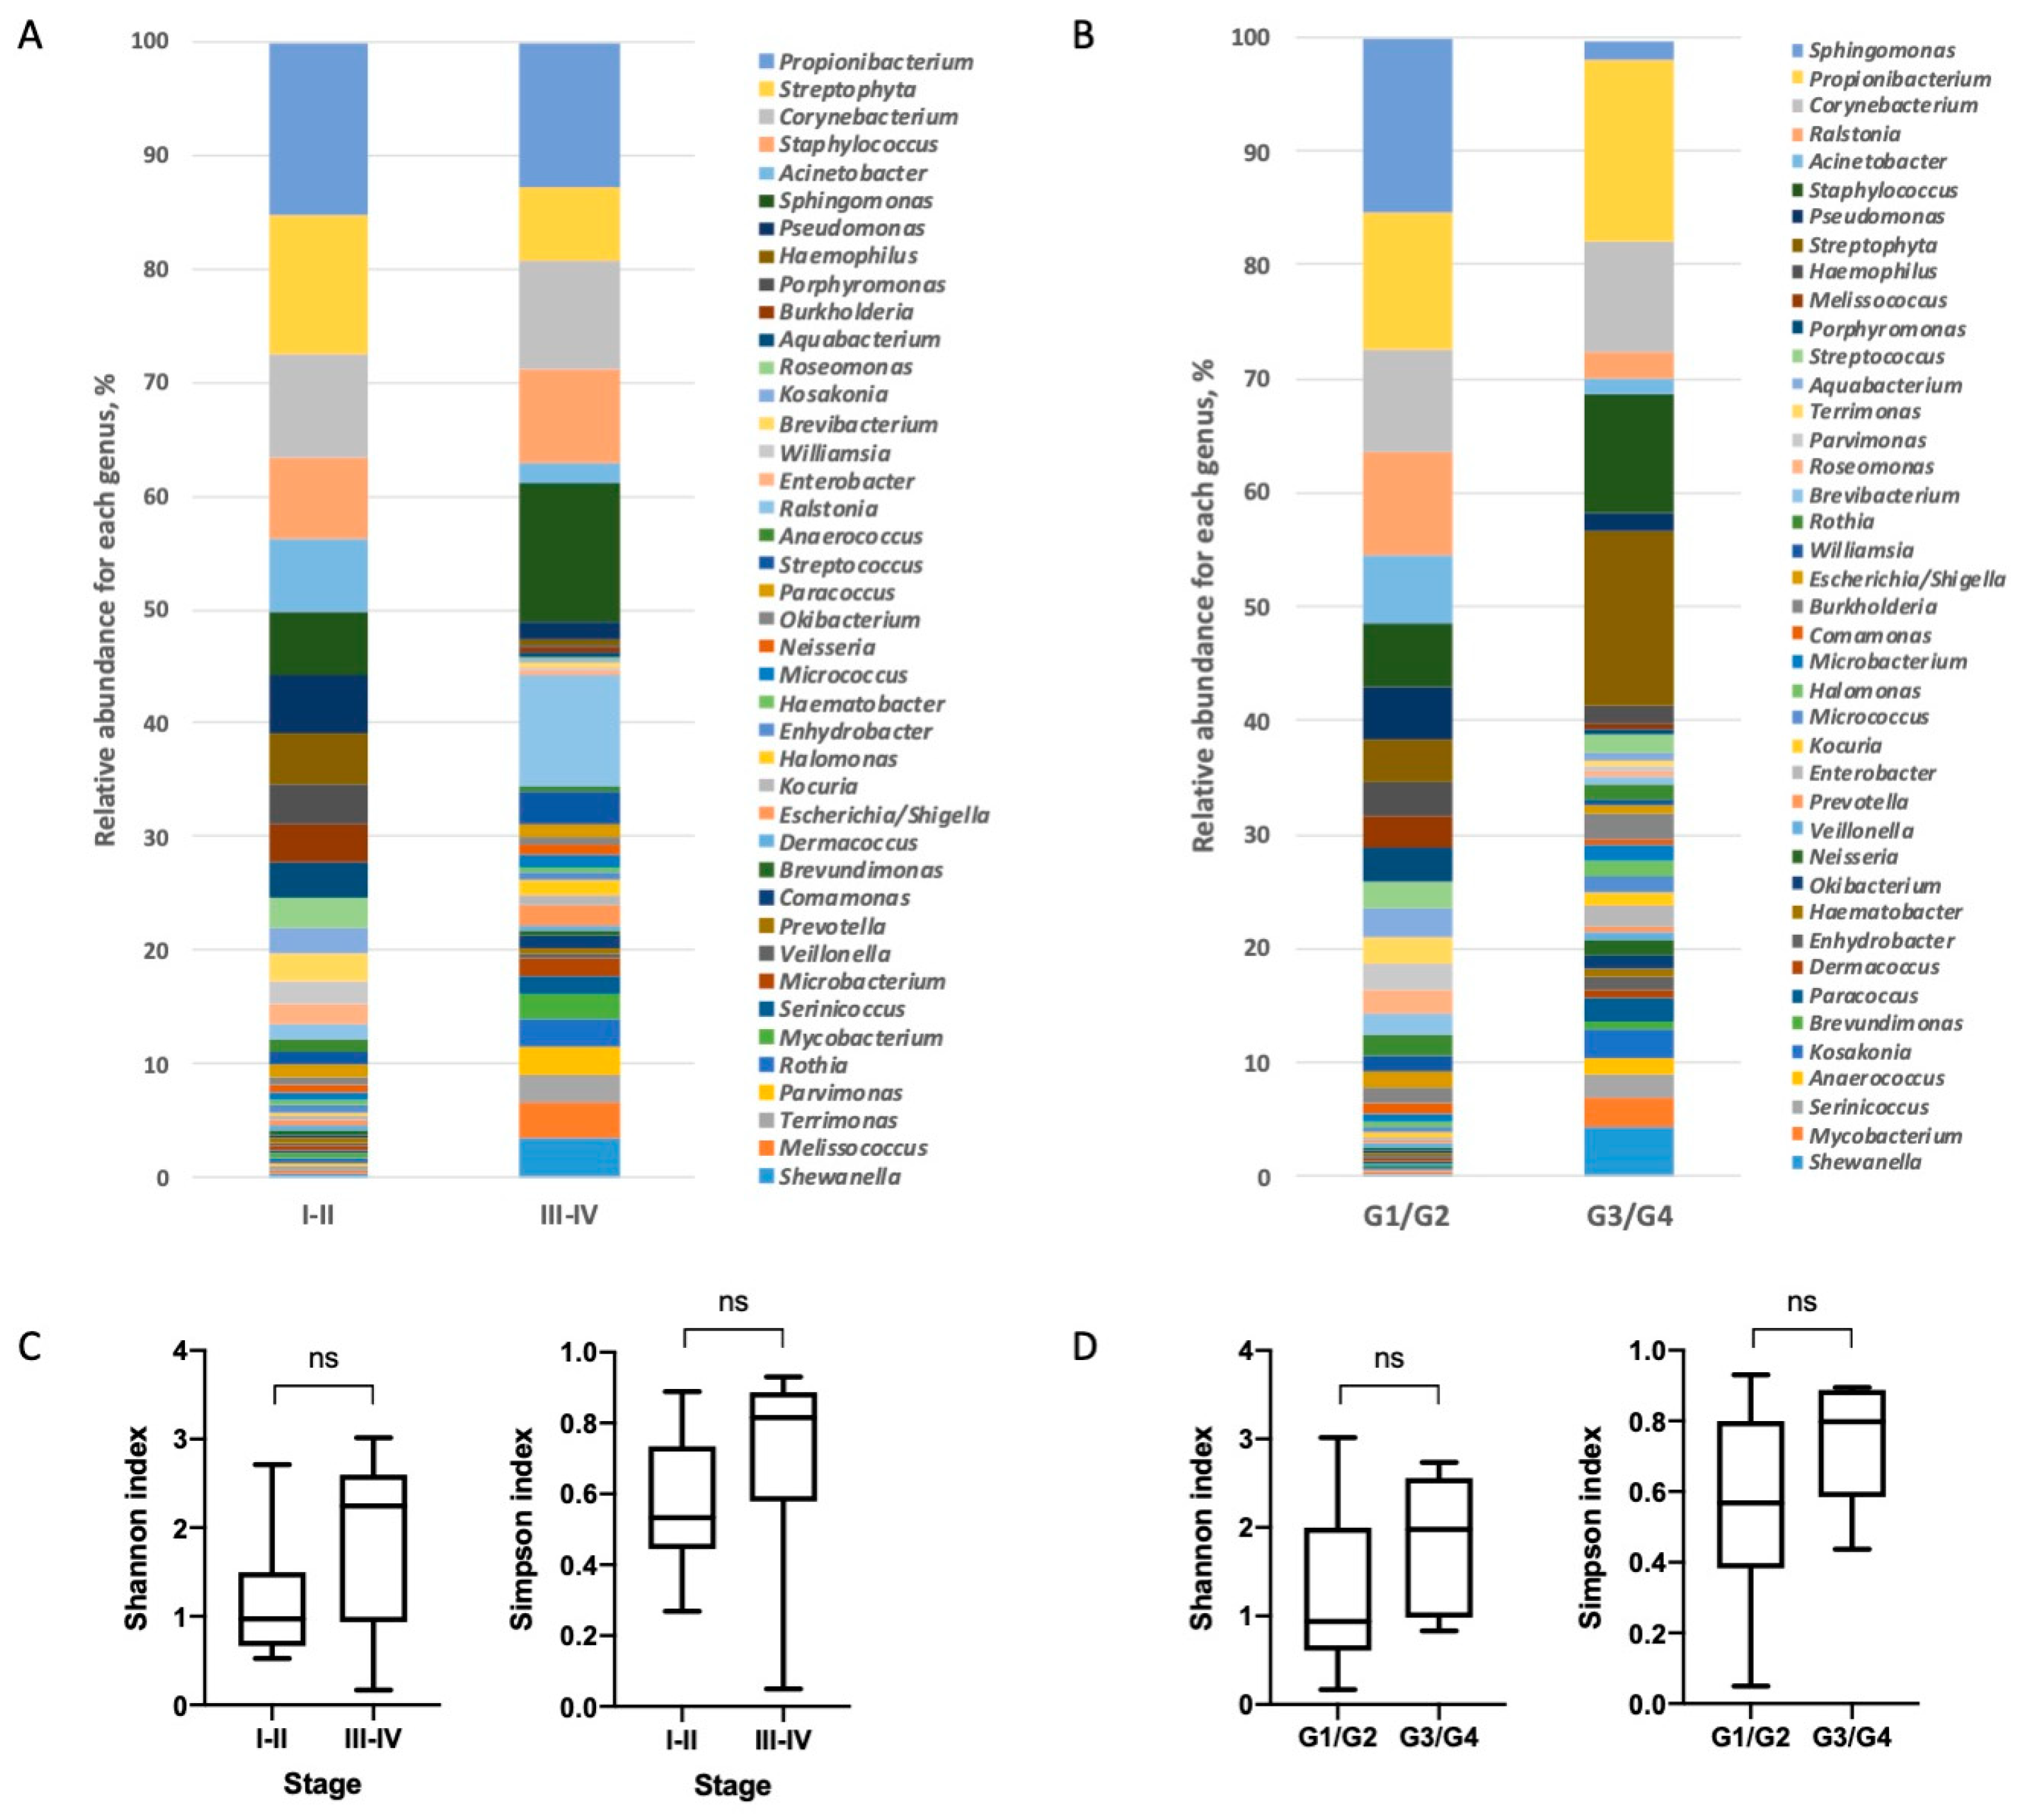
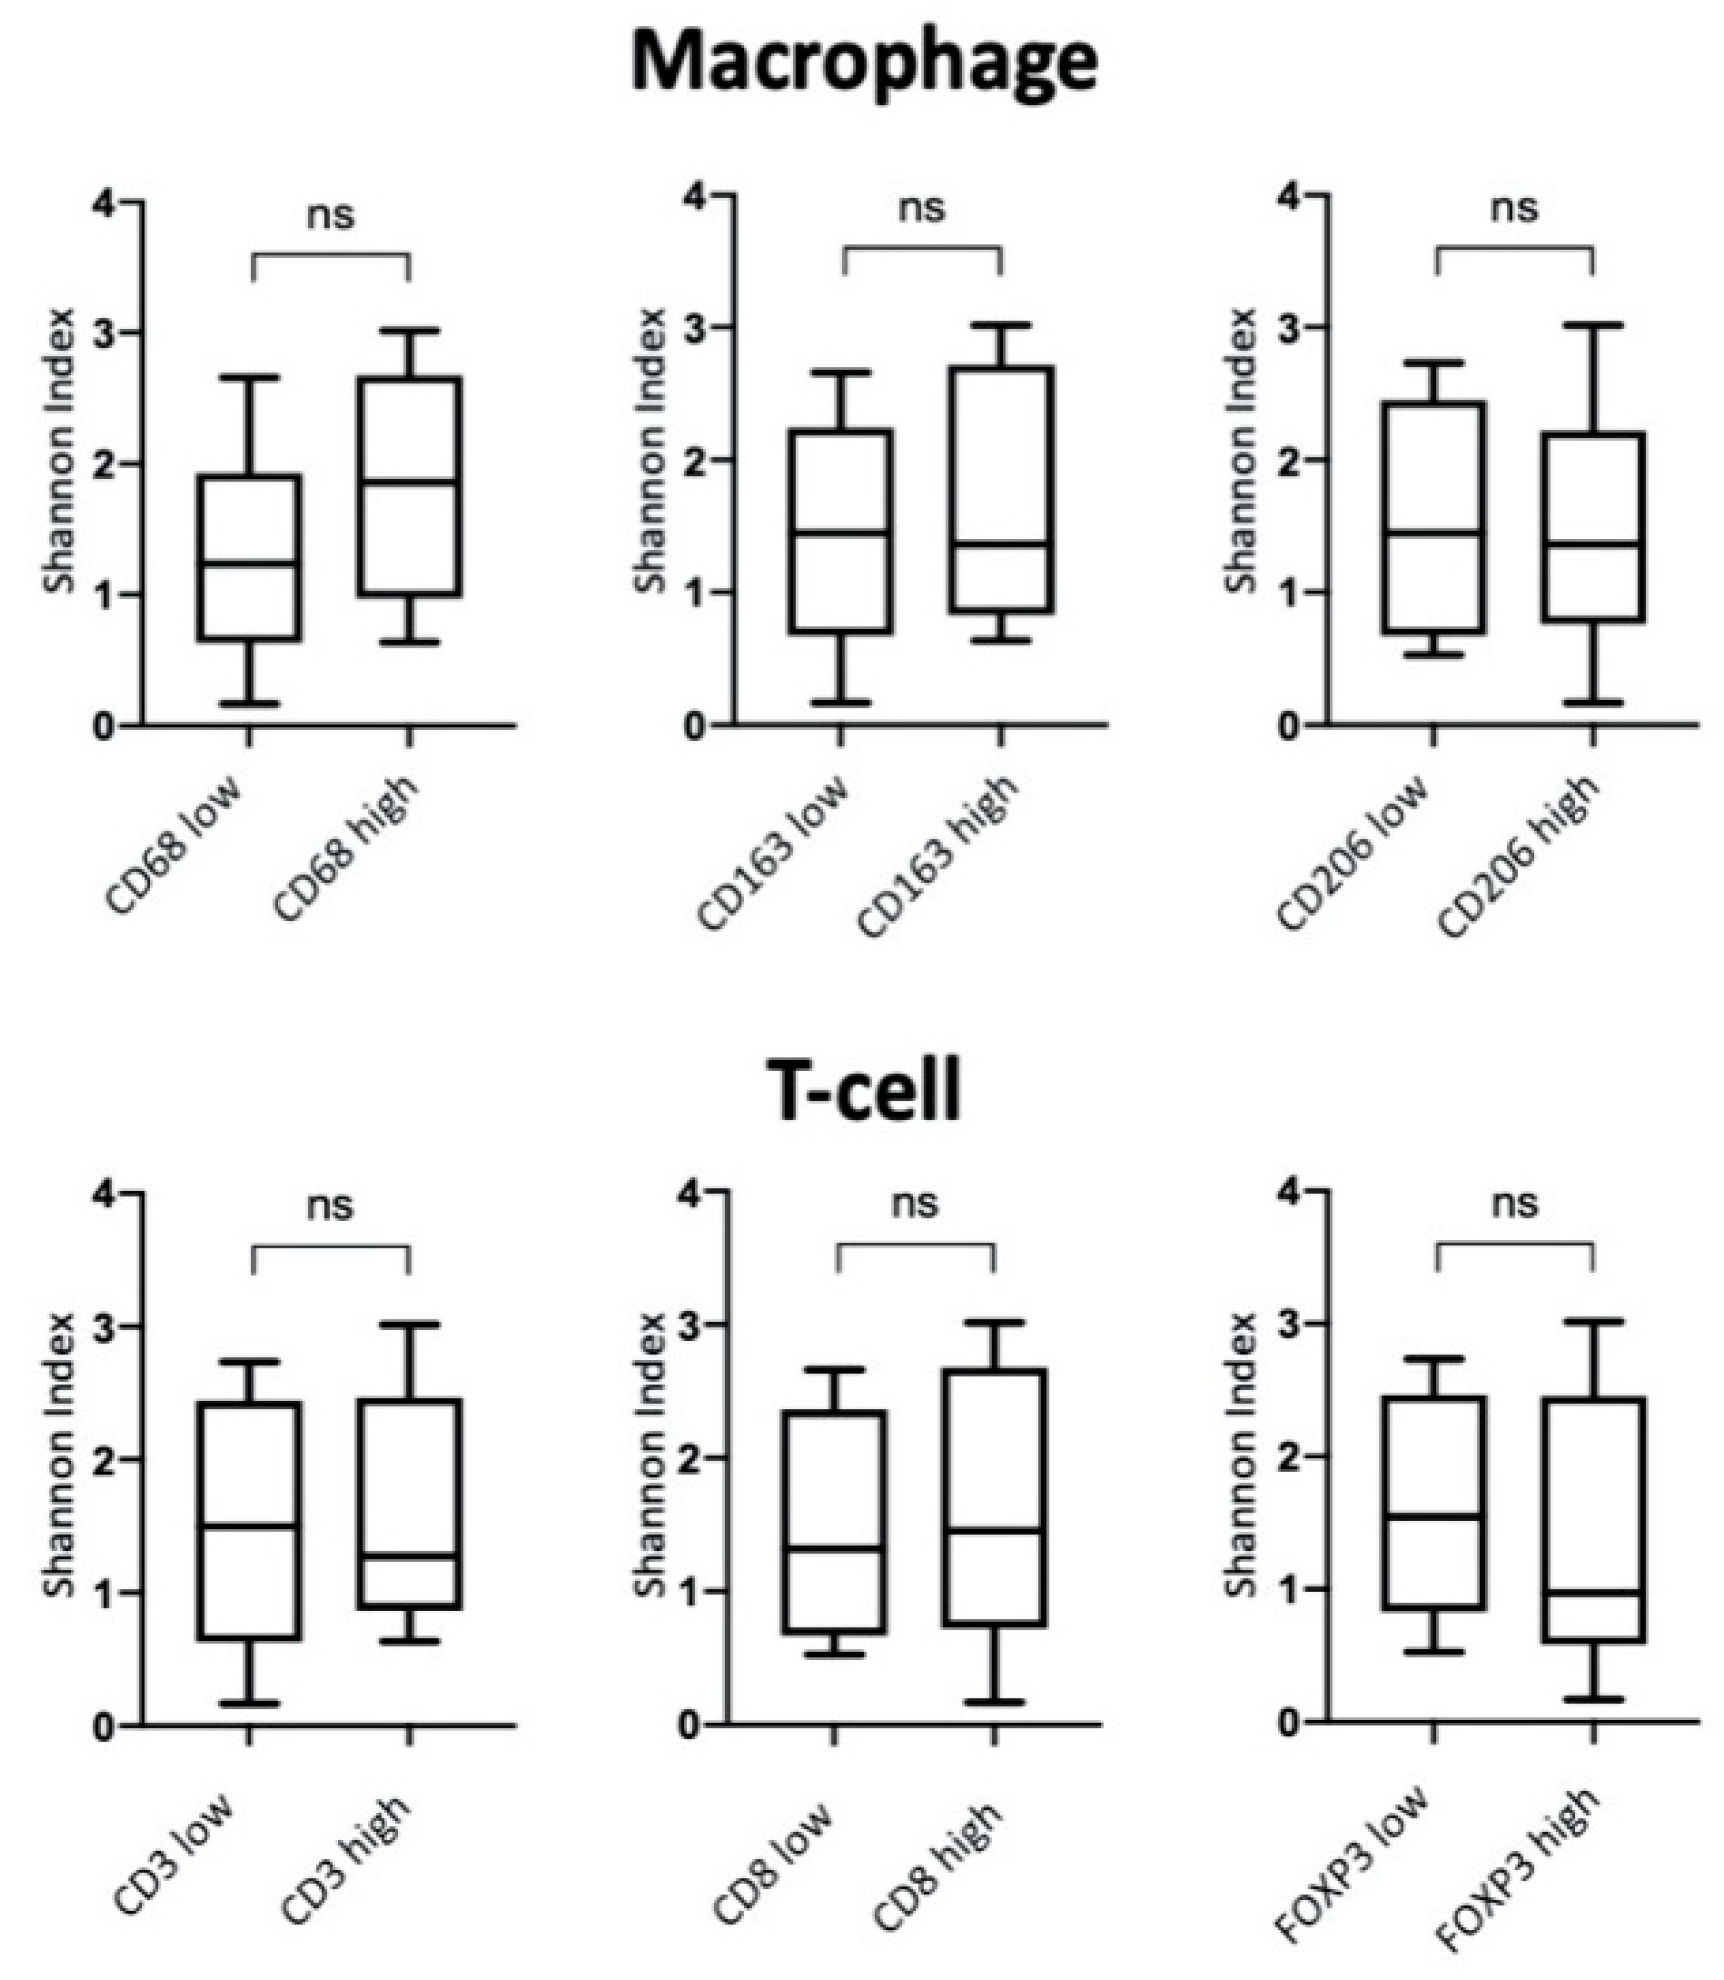
3.2. Characterization of Lung Bacterial Communities
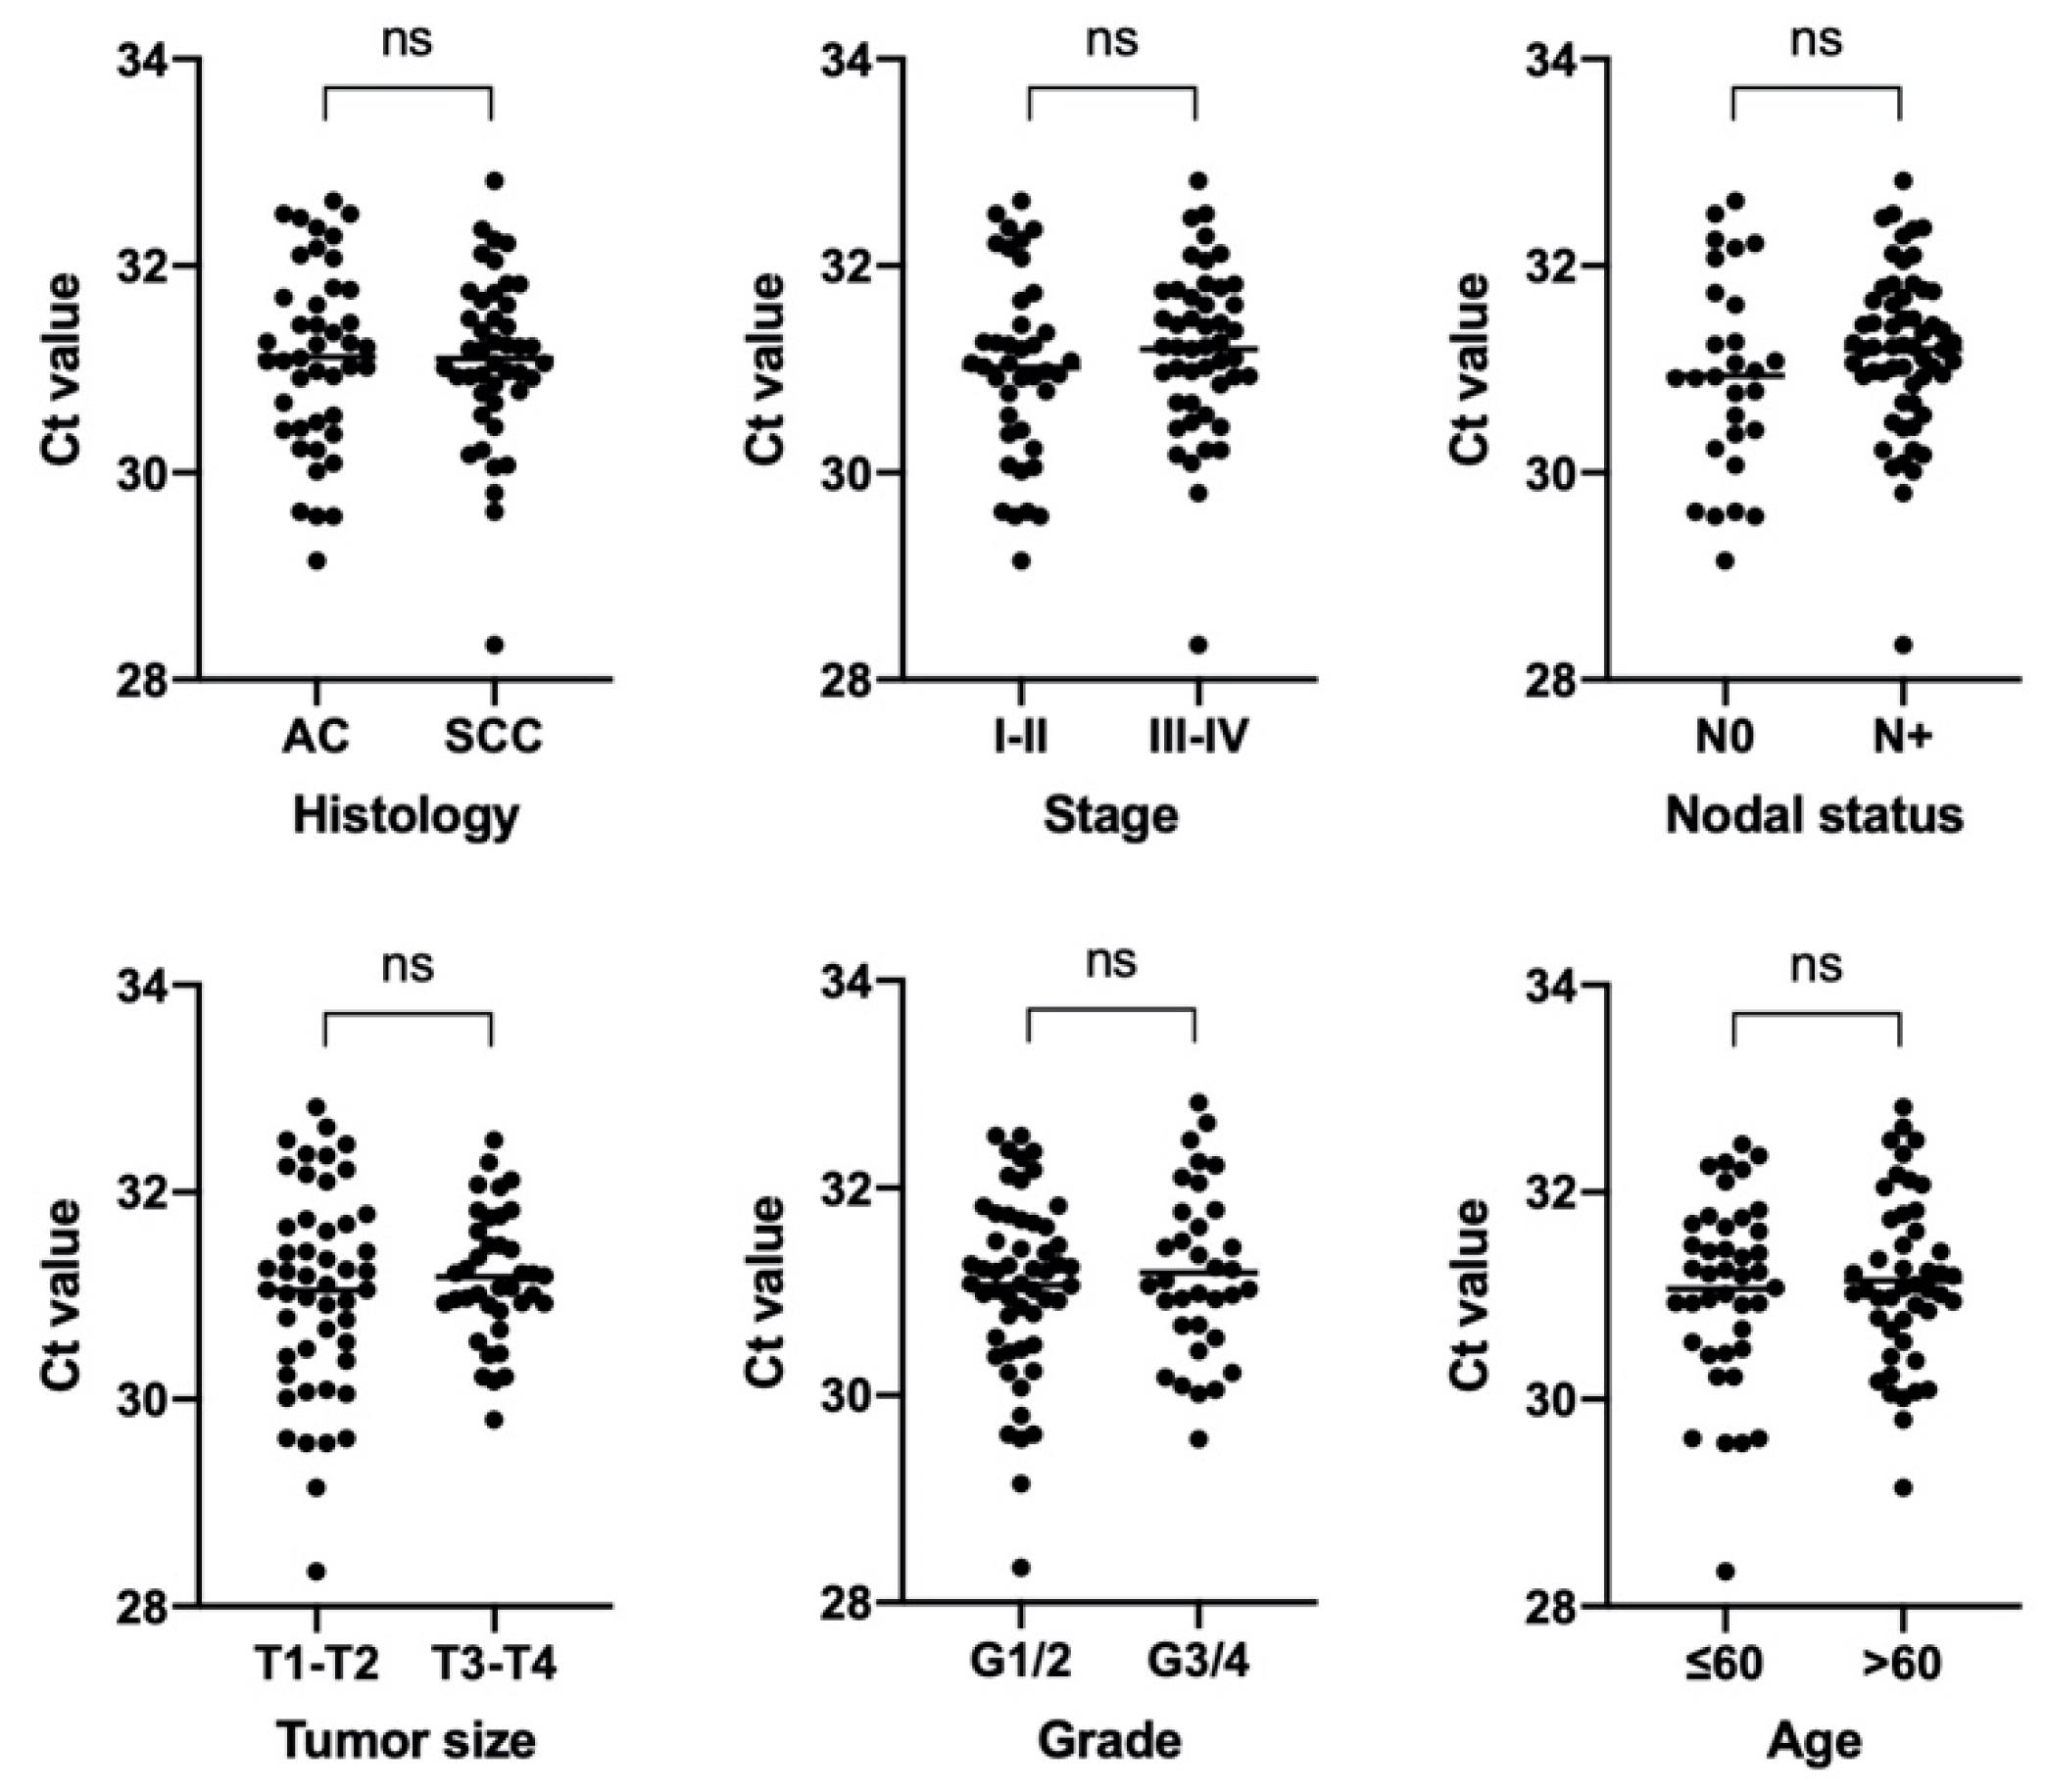
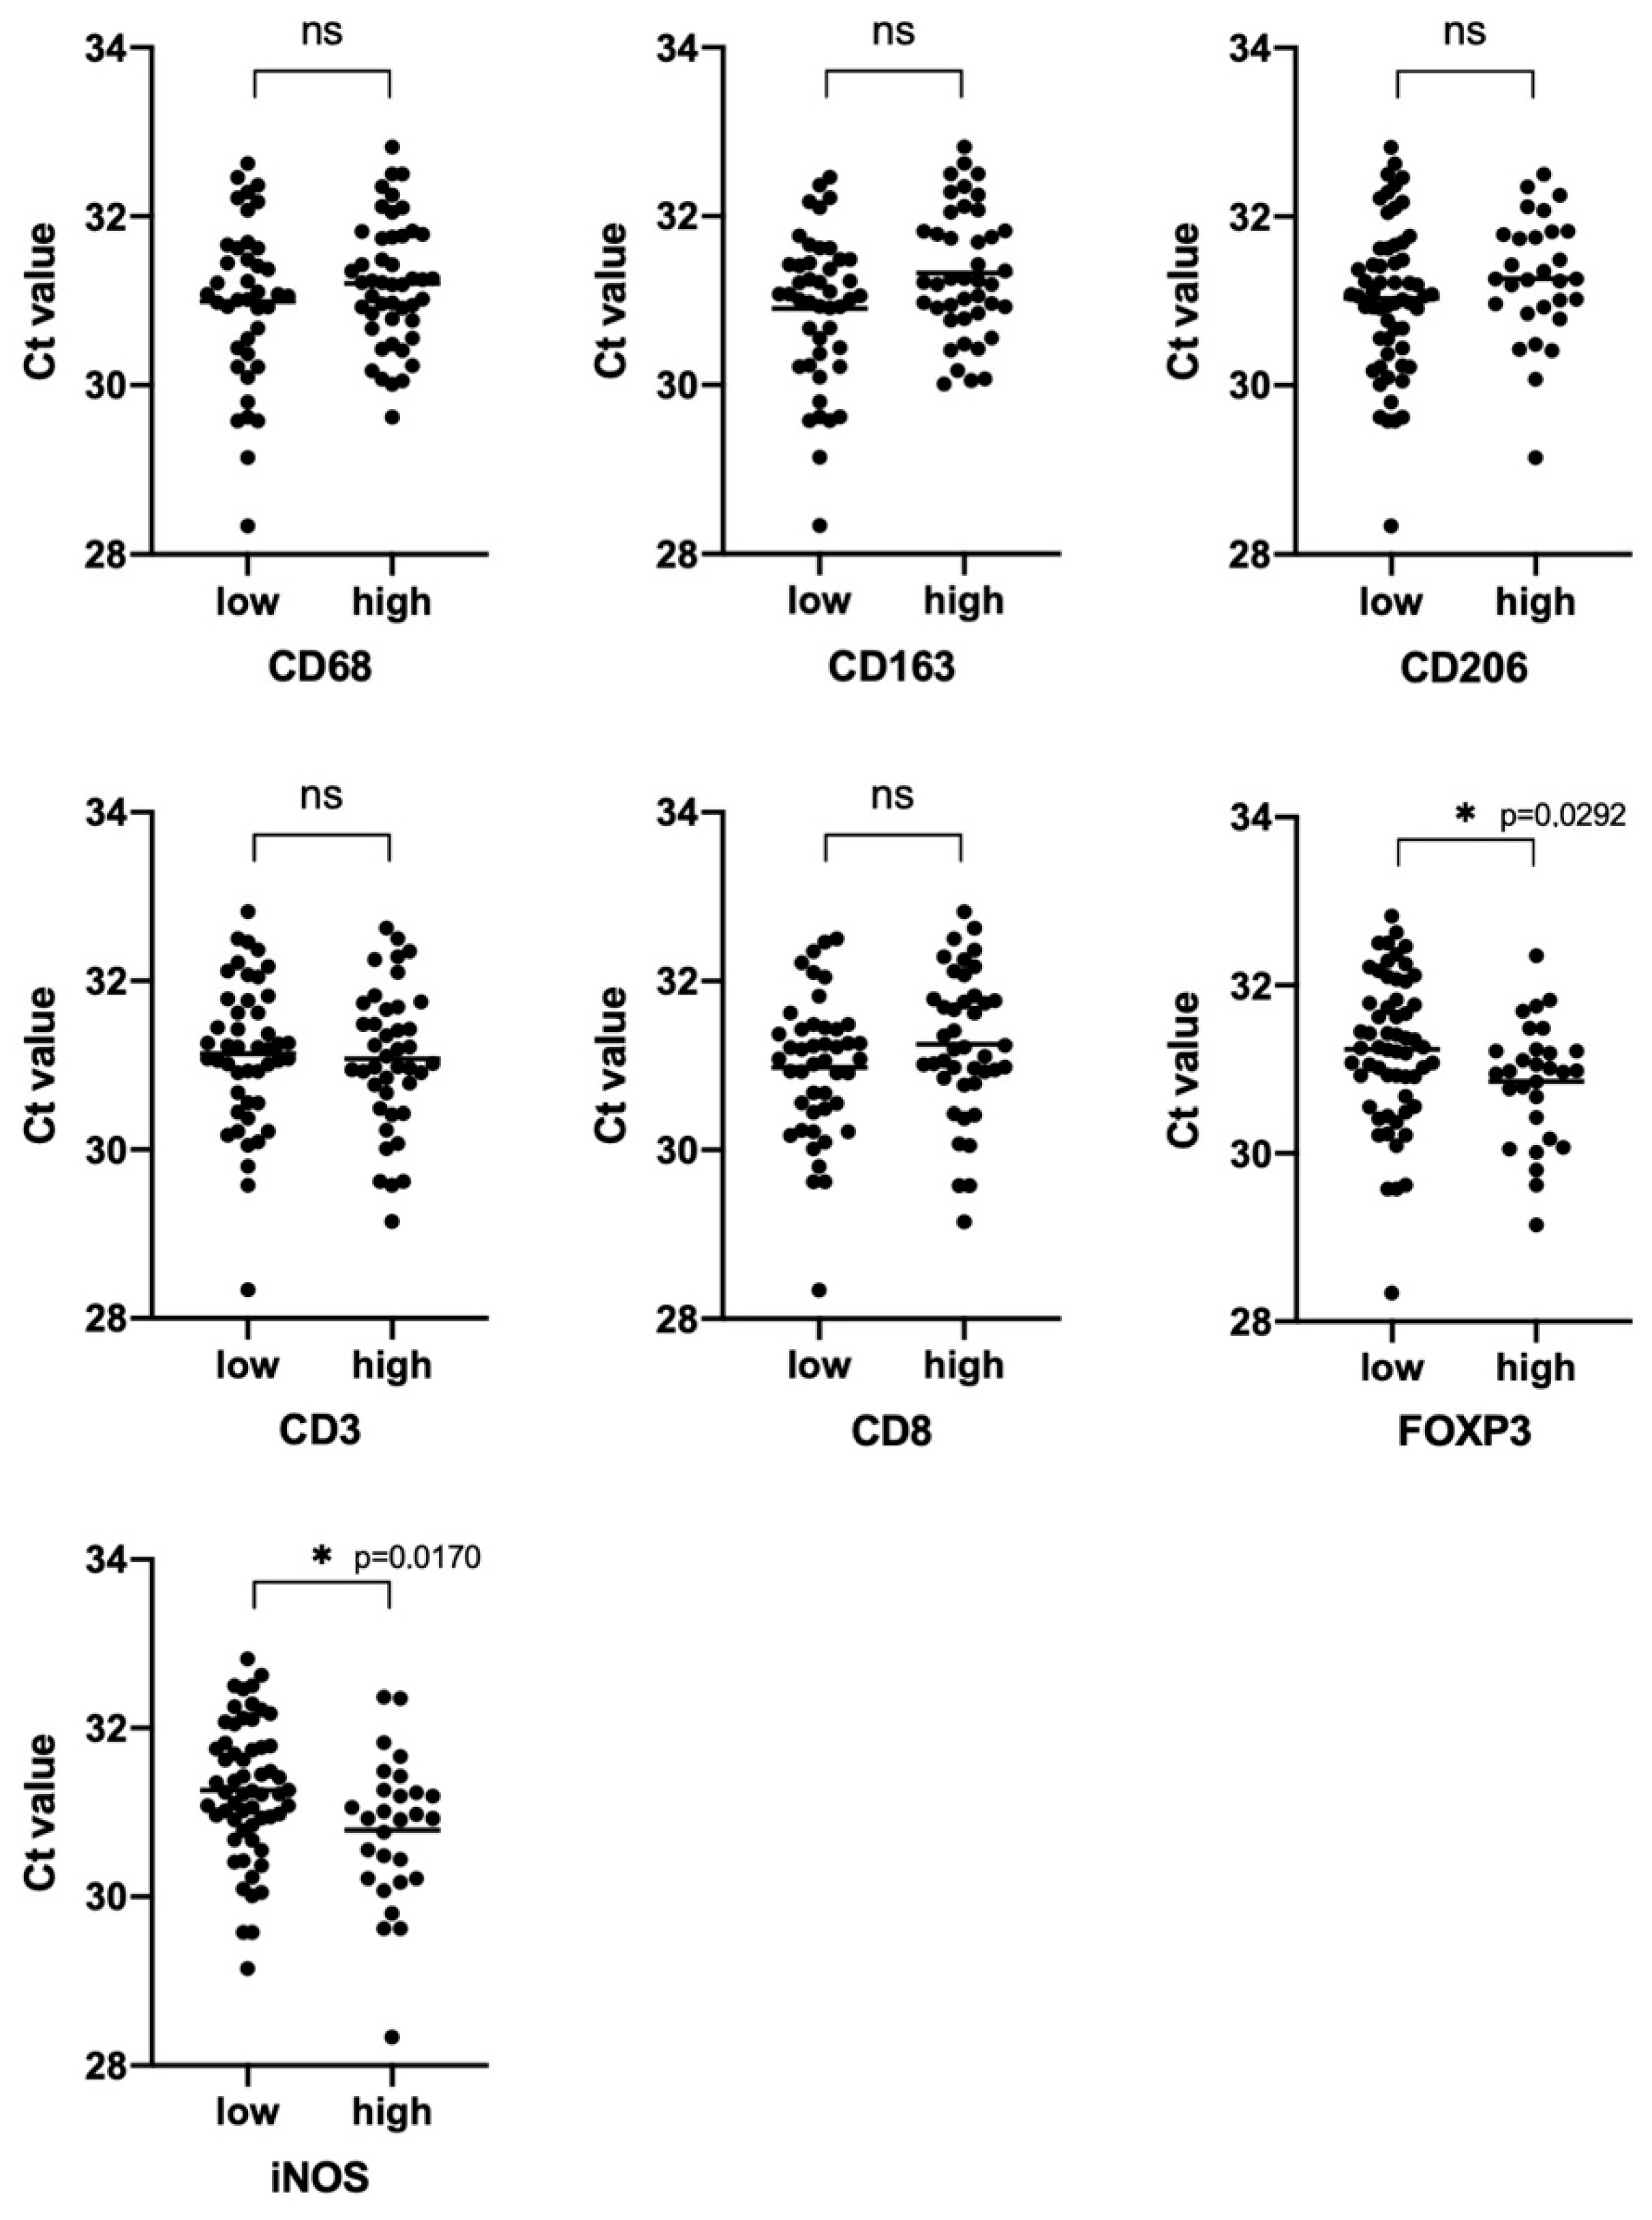
3.3. Characterization of NSCLC Stroma
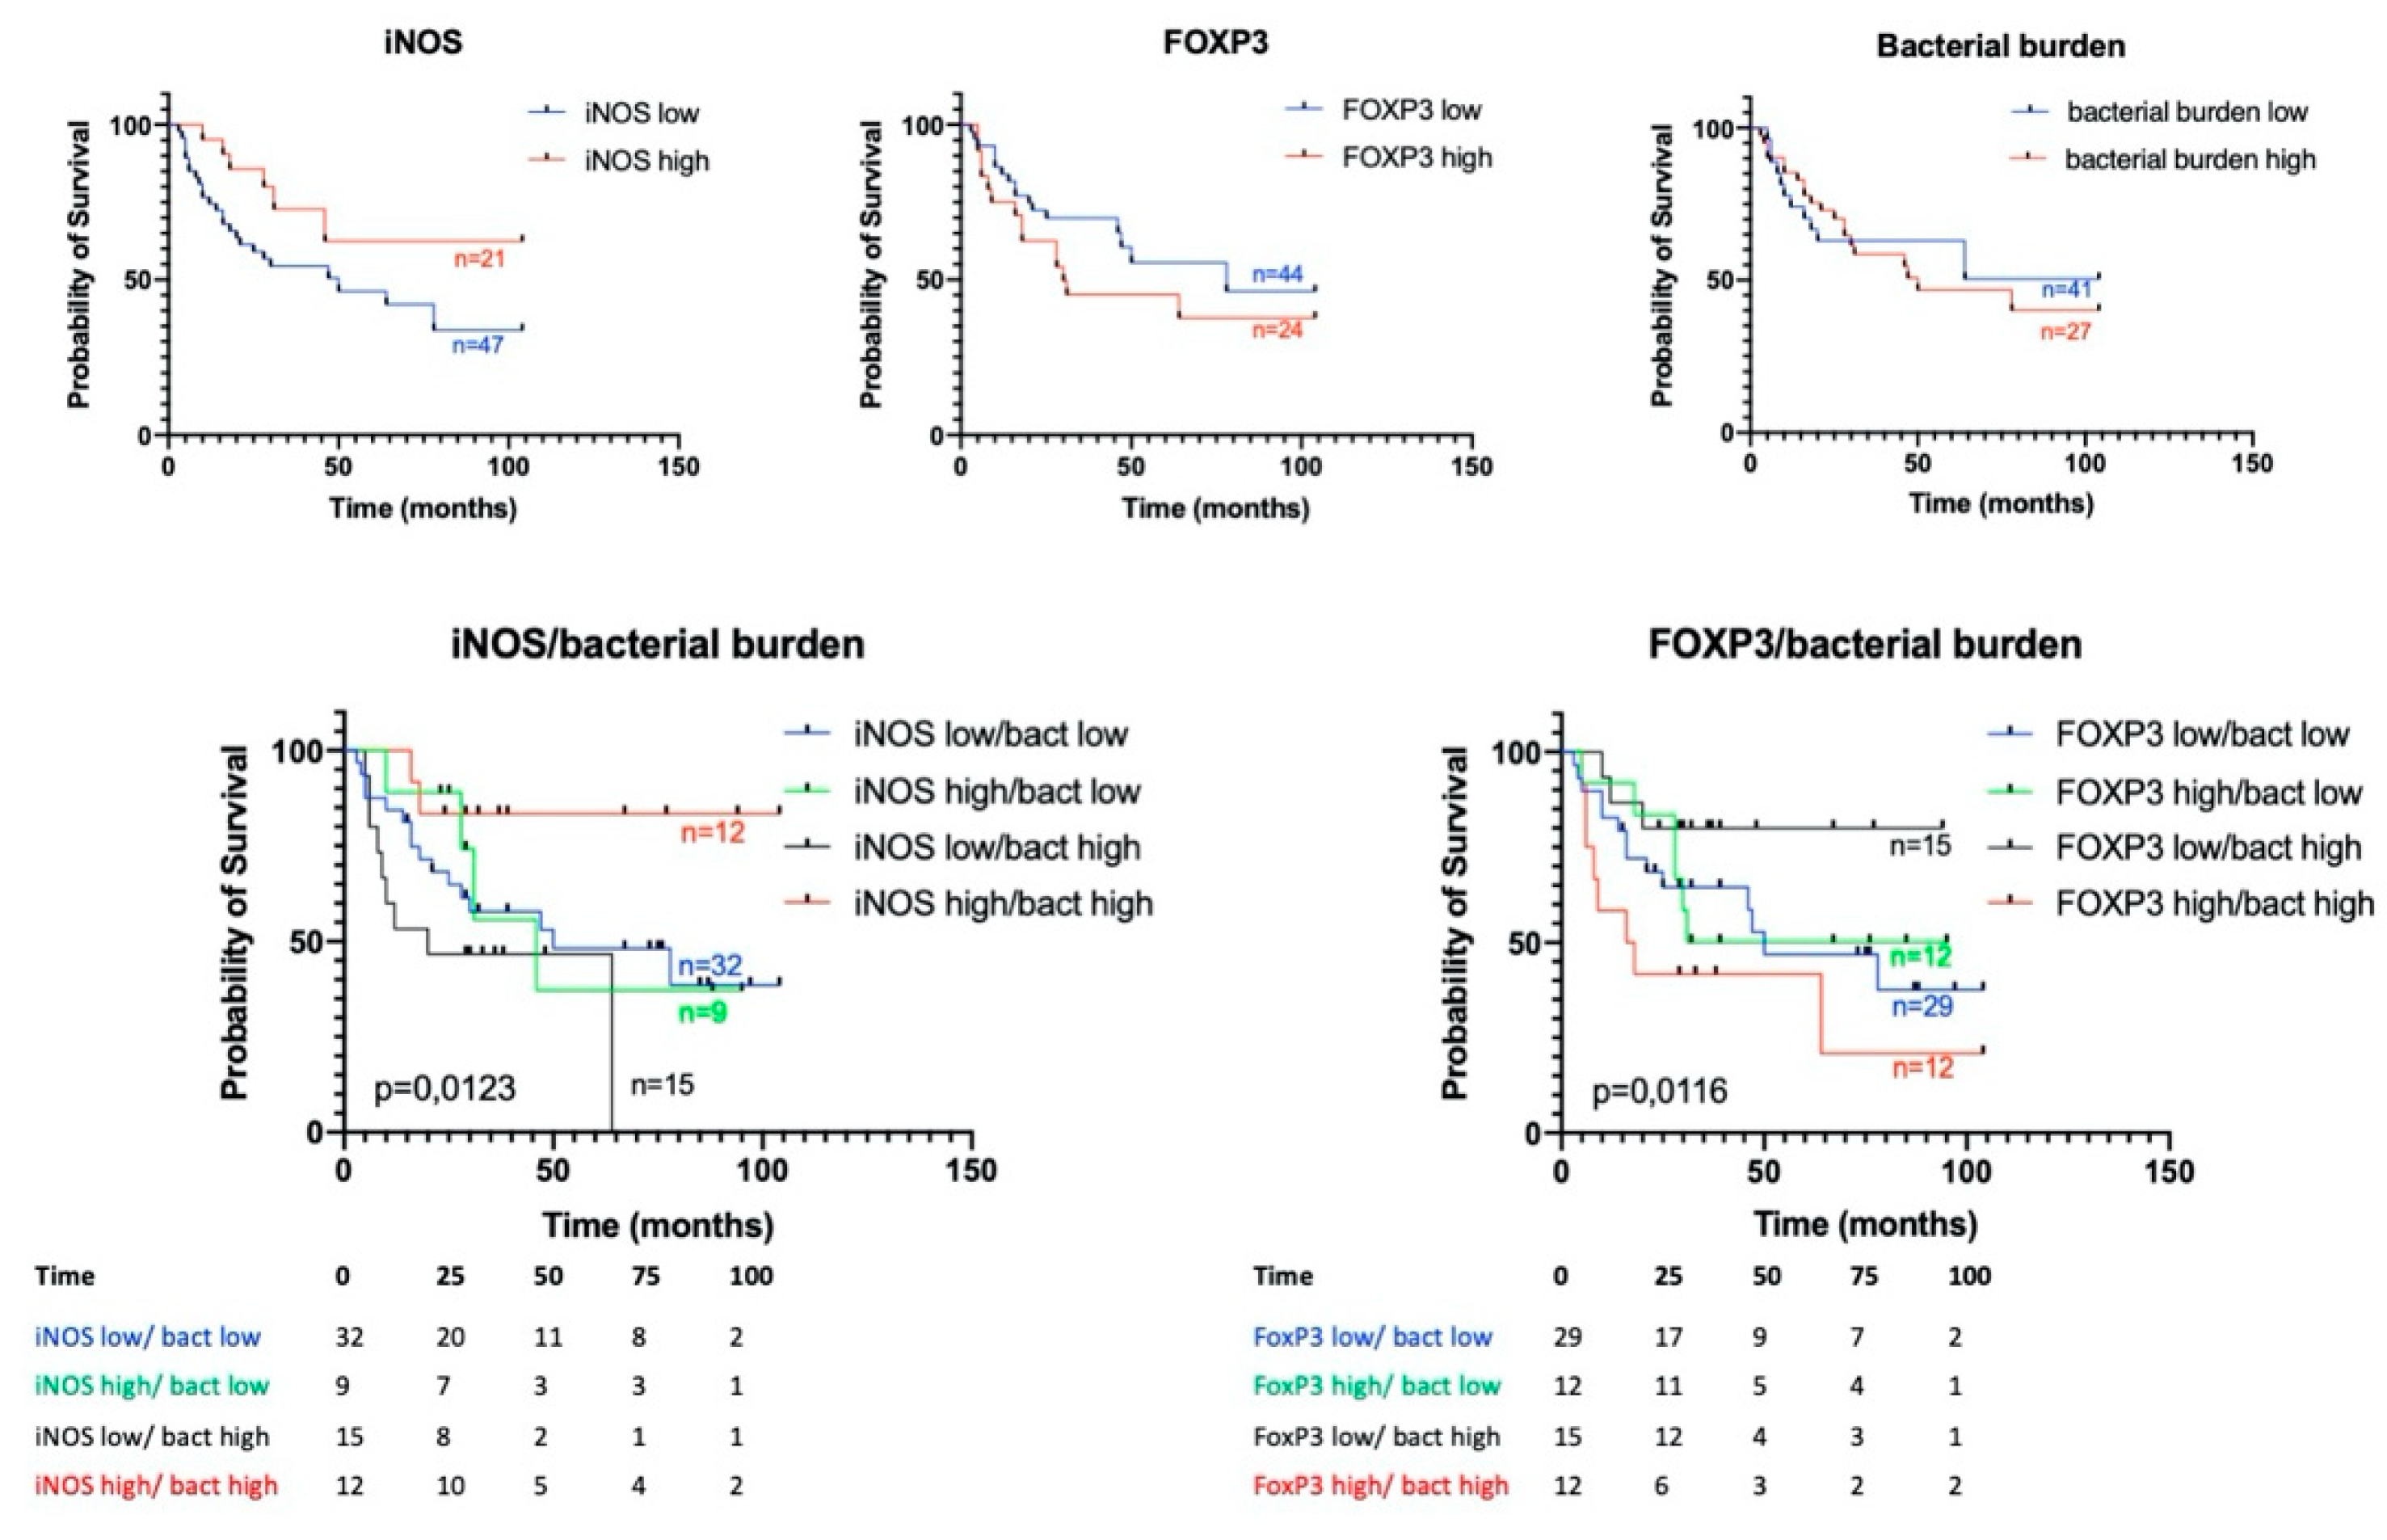
3.4. Prognostic Significance of Studied Markers/Survival
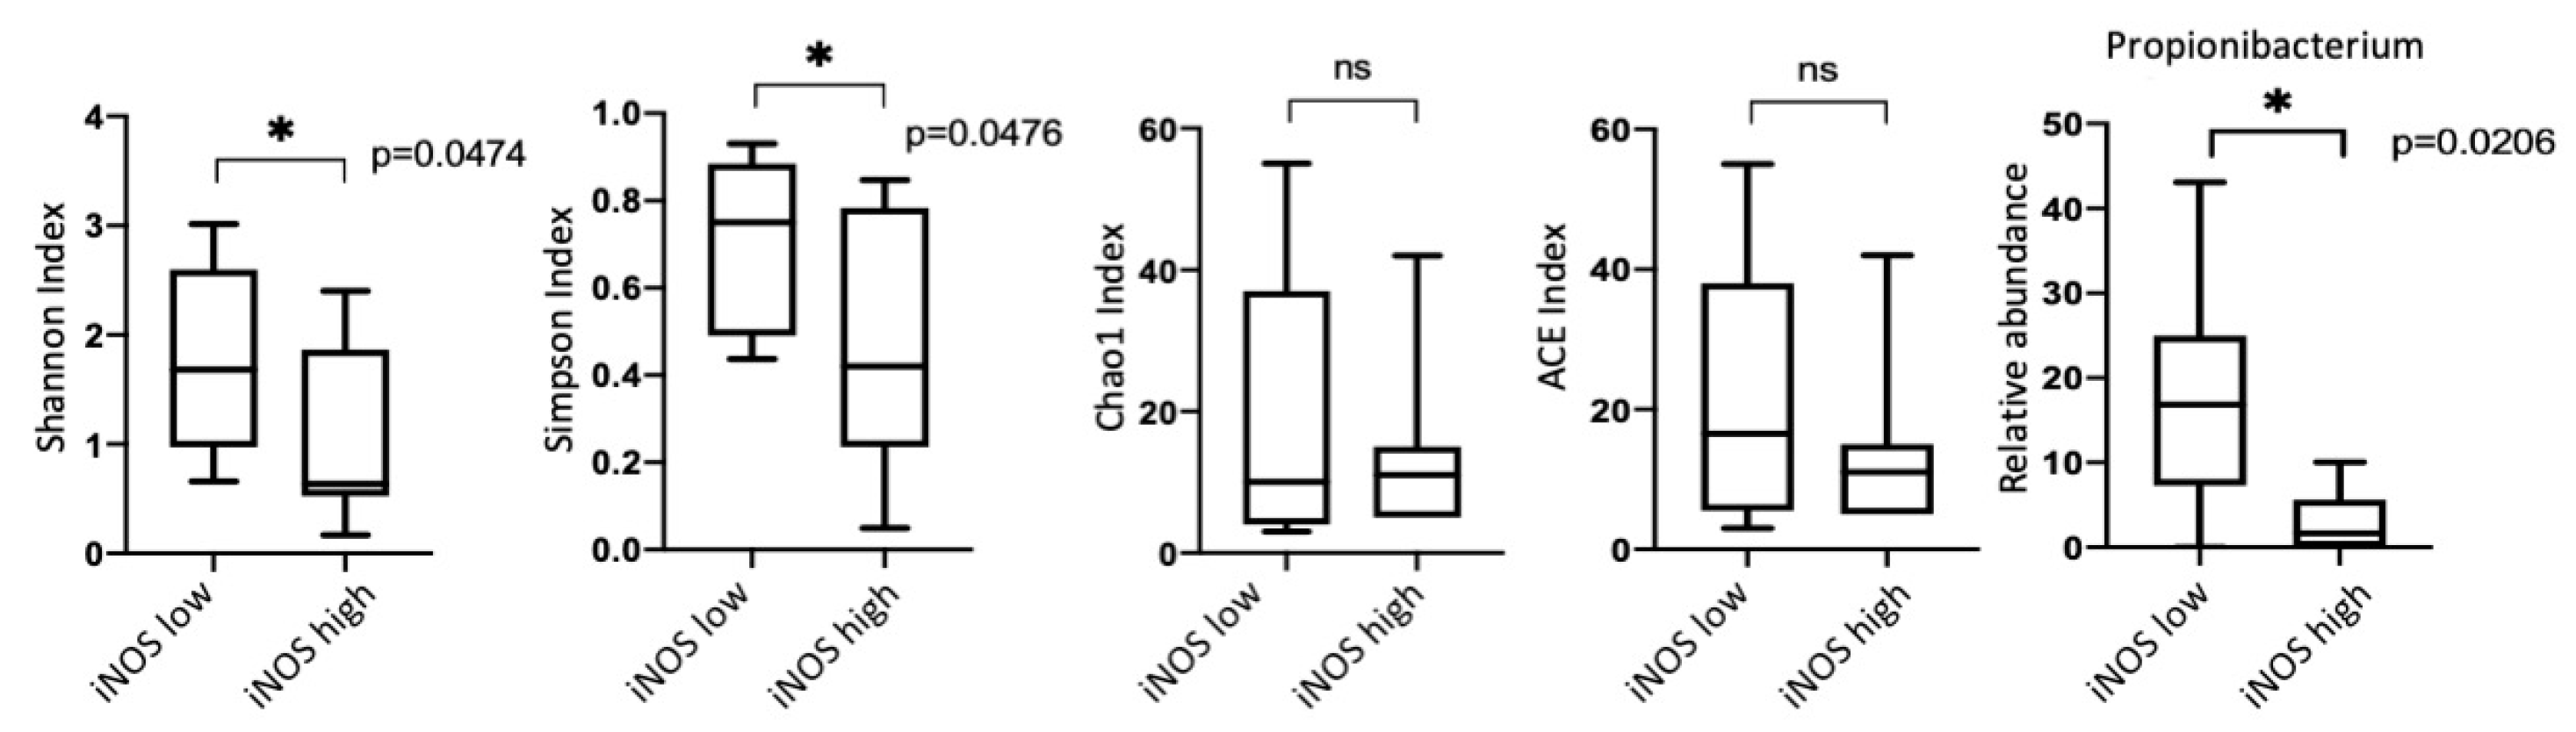
3.5. iNOS Features
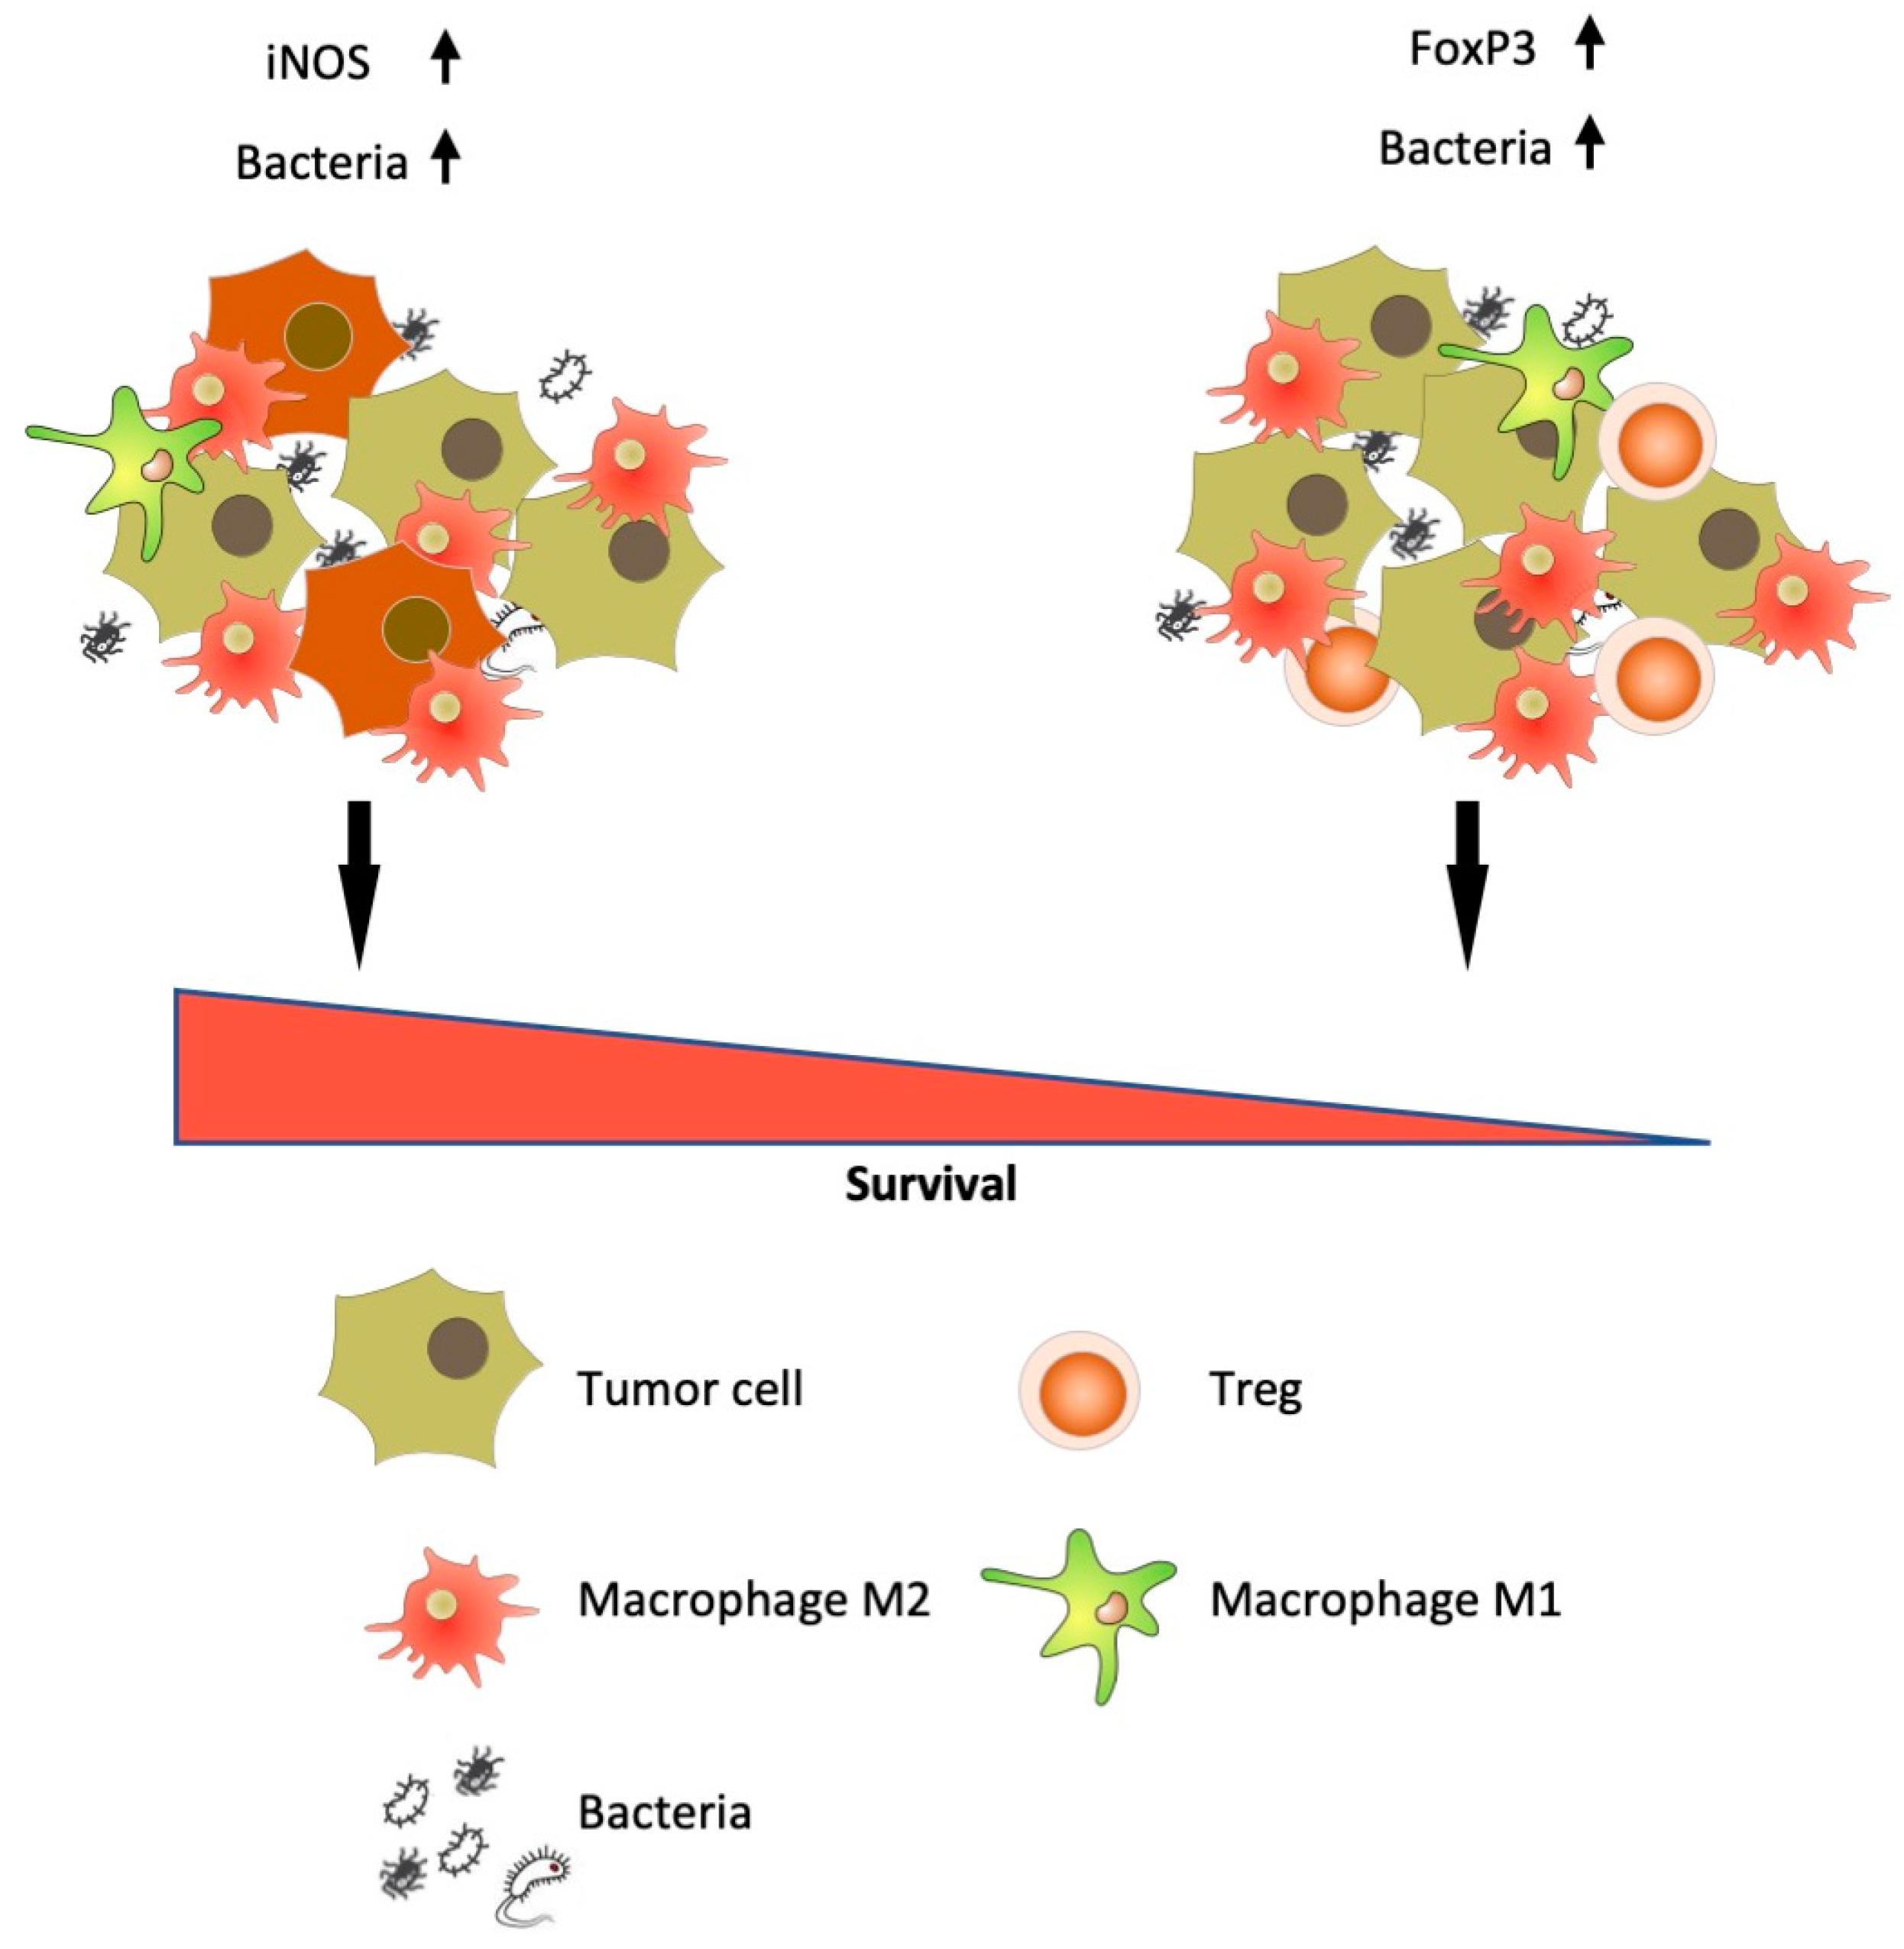
4. Discussion
Supplementary Materials
Author Contributions
Funding
Conflicts of Interest
References
- Hilty, M.; Burke, C.; Pedro, H.; Cardenas, P.; Bush, A.; Bossley, C.; Davies, J.; Ervine, A.; Poulter, L.; Pachter, L.; et al. Disordered microbial communities in asthmatic airways. PLoS ONE 2010, 5, e8578. [Google Scholar] [CrossRef] [PubMed]
- Ramirez-Labrada, A.G.; Isla, D.; Artal, A.; Arias, M.; Rezusta, A.; Pardo, J.; Galvez, E.M. The Influence of Lung Microbiota on Lung Carcinogenesis, Immunity, and Immunotherapy. Trends Cancer 2020, 6, 86–97. [Google Scholar] [CrossRef] [PubMed]
- Morris, A.; Beck, J.M.; Schloss, P.D.; Campbell, T.B.; Crothers, K.; Curtis, J.L.; Flores, S.C.; Fontenot, A.P.; Ghedin, E.; Huang, L.; et al. Comparison of the respiratory microbiome in healthy nonsmokers and smokers. Am. J. Respir. Crit. Care Med. 2013, 187, 1067–1075. [Google Scholar] [CrossRef] [PubMed]
- Beck, J.M.; Young, V.B.; Huffnagle, G.B. The microbiome of the lung. Transl. Res. J. Lab. Clin. Med. 2012, 160, 258–266. [Google Scholar] [CrossRef] [PubMed]
- Kovaleva, O.V.; Romashin, D.; Zborovskaya, I.B.; Davydov, M.M.; Shogenov, M.S.; Gratchev, A. Human Lung Microbiome on the Way to Cancer. J. Immunol. Res. 2019, 2019, 1394191. [Google Scholar] [CrossRef]
- Gomes, S.; Cavadas, B.; Ferreira, J.C.; Marques, P.I.; Monteiro, C.; Sucena, M.; Sousa, C.; Vaz Rodrigues, L.; Teixeira, G.; Pinto, P.; et al. Profiling of lung microbiota discloses differences in adenocarcinoma and squamous cell carcinoma. Sci. Rep. 2019, 9, 12838. [Google Scholar] [CrossRef]
- Greathouse, K.L.; White, J.R.; Vargas, A.J.; Bliskovsky, V.V.; Beck, J.A.; von Muhlinen, N.; Polley, E.C.; Bowman, E.D.; Khan, M.A.; Robles, A.I.; et al. Interaction between the microbiome and TP53 in human lung cancer. Genome Biol. 2018, 19, 123. [Google Scholar] [CrossRef]
- Yan, X.; Yang, M.; Liu, J.; Gao, R.; Hu, J.; Li, J.; Zhang, L.; Shi, Y.; Guo, H.; Cheng, J.; et al. Discovery and validation of potential bacterial biomarkers for lung cancer. Am. J. Cancer Res. 2015, 5, 3111–3122. [Google Scholar]
- Yu, G.; Gail, M.H.; Consonni, D.; Carugno, M.; Humphrys, M.; Pesatori, A.C.; Caporaso, N.E.; Goedert, J.J.; Ravel, J.; Landi, M.T. Characterizing human lung tissue microbiota and its relationship to epidemiological and clinical features. Genome Biol. 2016, 17, 163. [Google Scholar] [CrossRef]
- Cao, L.; Che, X.; Qiu, X.; Li, Z.; Yang, B.; Wang, S.; Hou, K.; Fan, Y.; Qu, X.; Liu, Y. M2 macrophage infiltration into tumor islets leads to poor prognosis in non-small-cell lung cancer. Cancer Manag. Res. 2019, 11, 6125–6138. [Google Scholar] [CrossRef]
- Rakaee, M.; Busund, L.R.; Jamaly, S.; Paulsen, E.E.; Richardsen, E.; Andersen, S.; Al-Saad, S.; Bremnes, R.M.; Donnem, T.; Kilvaer, T.K. Prognostic Value of Macrophage Phenotypes in Resectable Non-Small Cell Lung Cancer Assessed by Multiplex Immunohistochemistry. Neoplasia 2019, 21, 282–293. [Google Scholar] [CrossRef] [PubMed]
- Zeng, D.Q.; Yu, Y.F.; Ou, Q.Y.; Li, X.Y.; Zhong, R.Z.; Xie, C.M.; Hu, Q.G. Prognostic and predictive value of tumor-infiltrating lymphocytes for clinical therapeutic research in patients with non-small cell lung cancer. Oncotarget 2016, 7, 13765–13781. [Google Scholar] [CrossRef] [PubMed]
- Riquelme, E.; Zhang, Y.; Zhang, L.; Montiel, M.; Zoltan, M.; Dong, W.; Quesada, P.; Sahin, I.; Chandra, V.; San Lucas, A.; et al. Tumor Microbiome Diversity and Composition Influence Pancreatic Cancer Outcomes. Cell 2019, 178, 7. [Google Scholar] [CrossRef] [PubMed]
- Sobin, L.H. (Ed.) TNM Classification of Malignant Tumours, 7th ed.; Wiley-Blackwell: Hoboken, NJ, USA, 2009. [Google Scholar]
- Travis, W.D.; Brambilla, E.; Nicholson, A.G.; Yatabe, Y.; Austin, J.H.M.; Beasley, M.B.; Chirieac, L.R.; Dacic, S.; Duhig, E.; Flieder, D.B.; et al. The 2015 World Health Organization Classification of Lung Tumors: Impact of Genetic, Clinical and Radiologic Advances Since the 2004 Classification. J. Thorac. Oncol. 2015, 10, 1243–1260. [Google Scholar] [CrossRef]
- Maniecki, M.B.; Etzerodt, A.; Ulhoi, B.P.; Steiniche, T.; Borre, M.; Dyrskjot, L.; Orntoft, T.F.; Moestrup, S.K.; Moller, H.J. Tumor-promoting macrophages induce the expression of the macrophage-specific receptor CD163 in malignant cells. Int. J. Cancer. J. Int. Cancer 2012, 131, 2320–2331. [Google Scholar] [CrossRef]
- Klindworth, A.; Pruesse, E.; Schweer, T.; Peplies, J.; Quast, C.; Horn, M.; Glockner, F.O. Evaluation of general 16S ribosomal RNA gene PCR primers for classical and next-generation sequencing-based diversity studies. Nucleic Acids Res. 2013, 41, e1. [Google Scholar] [CrossRef]
- Conway Morris, A.; Gadsby, N.; McKenna, J.P.; Hellyer, T.P.; Dark, P.; Singh, S.; Walsh, T.S.; McAuley, D.F.; Templeton, K.; Simpson, A.J.; et al. 16S pan-bacterial PCR can accurately identify patients with ventilator-associated pneumonia. Thorax 2017, 72, 1046–1048. [Google Scholar] [CrossRef]
- Zhang, J.; Kobert, K.; Flouri, T.; Stamatakis, A. PEAR: A fast and accurate Illumina Paired-End reAd mergeR. Bioinformatics 2014, 30, 614–620. [Google Scholar] [CrossRef]
- Bolger, A.M.; Lohse, M.; Usadel, B. Trimmomatic: A flexible trimmer for Illumina sequence data. Bioinformatics 2014, 30, 2114–2120. [Google Scholar] [CrossRef]
- Edgar, R.C. UPARSE: Highly accurate OTU sequences from microbial amplicon reads. Nat. Methods 2013, 10, 996–998. [Google Scholar] [CrossRef]
- Edgar, R.C. UCHIME2: Improved chimera prediction for amplicon sequencing. BioRxiv 2016. [Google Scholar] [CrossRef]
- Wang, Q.; Garrity, G.M.; Tiedje, J.M.; Cole, J.R. Naive Bayesian classifier for rapid assignment of rRNA sequences into the new bacterial taxonomy. Appl. Environ. Microbiol. 2007, 73, 5261–5267. [Google Scholar] [CrossRef] [PubMed]
- Dhariwal, A.; Chong, J.; Habib, S.; King, I.L.; Agellon, L.B.; Xia, J. MicrobiomeAnalyst: A web-based tool for comprehensive statistical, visual and meta-analysis of microbiome data. Nucleic Acids Res. 2017, 45, W180–W188. [Google Scholar] [CrossRef] [PubMed]
- Mc, C.W.; Mason, J.M., 3rd. Enterococcal endocarditis associated with carcinoma of the sigmoid; report of a case. J. Med. Assoc. State Ala 1951, 21, 162–166. [Google Scholar]
- Sears, C.L.; Pardoll, D.M. Perspective: Alpha-bugs, their microbial partners, and the link to colon cancer. J. Infect. Dis. 2011, 203, 306–311. [Google Scholar] [CrossRef]
- Tjalsma, H.; Boleij, A.; Marchesi, J.R.; Dutilh, B.E. A bacterial driver-passenger model for colorectal cancer: Beyond the usual suspects. Nat. Rev. Microbiol. 2012, 10, 575–582. [Google Scholar] [CrossRef]
- Murray, G.I.; Ewen, S.W. Enzyme histochemistry on freeze-substituted glycol methacrylate-embedded tissue. J. Histochem. Cytochem. Off. J. Histochem. Soc. 1990, 38, 95–101. [Google Scholar] [CrossRef]
- Hajishengallis, G.; Darveau, R.P.; Curtis, M.A. The keystone-pathogen hypothesis. Nat. Rev. Microbiol. 2012, 10, 717–725. [Google Scholar] [CrossRef]
- Herbst, R.S.; Heymach, J.V.; Lippman, S.M. Lung cancer. N. Engl. J. Med. 2008, 359, 1367–1380. [Google Scholar] [CrossRef]
- Liu, H.X.; Tao, L.L.; Zhang, J.; Zhu, Y.G.; Zheng, Y.; Liu, D.; Zhou, M.; Ke, H.; Shi, M.M.; Qu, J.M. Difference of lower airway microbiome in bilateral protected specimen brush between lung cancer patients with unilateral lobar masses and control subjects. Int. J. Cancer. J. Int. Cancer 2018, 142, 769–778. [Google Scholar] [CrossRef]
- Huang, D.; Su, X.; Yuan, M.; Zhang, S.; He, J.; Deng, Q.; Qiu, W.; Dong, H.; Cai, S. The characterization of lung microbiome in lung cancer patients with different clinicopathology. Am. J. Cancer Res. 2019, 9, 2047–2063. [Google Scholar] [PubMed]
- Lee, S.H.; Sung, J.Y.; Yong, D.; Chun, J.; Kim, S.Y.; Song, J.H.; Chung, K.S.; Kim, E.Y.; Jung, J.Y.; Kang, Y.A.; et al. Characterization of microbiome in bronchoalveolar lavage fluid of patients with lung cancer comparing with benign mass like lesions. Lung Cancer 2016, 102, 89–95. [Google Scholar] [CrossRef] [PubMed]
- Pauly, J.L.; Paszkiewicz, G. Cigarette smoke, bacteria, mold, microbial toxins, and chronic lung inflammation. J. Oncol. 2011, 2011, 819129. [Google Scholar] [CrossRef] [PubMed]
- Invernizzi, R.; Barnett, J.; Rawal, B.; Nair, A.; Ghai, P.; Kingston, S.; Chua, F.; Wu, Z.; Wells, A.U.; Renzoni, E.R.; et al. Bacterial burden in the lower airways predicts disease progression in idiopathic pulmonary fibrosis and is independent of radiological disease extent. Eur. Respir. J. 2020, 55. [Google Scholar] [CrossRef]
- Jin, C.; Lagoudas, G.K.; Zhao, C.; Bullman, S.; Bhutkar, A.; Hu, B.; Ameh, S.; Sandel, D.; Liang, X.S.; Mazzilli, S.; et al. Commensal Microbiota Promote Lung Cancer Development via gammadelta T Cells. Cell 2019, 176, 998–1013 e1016. [Google Scholar] [CrossRef]
- Elkrief, A.; Derosa, L.; Kroemer, G.; Zitvogel, L.; Routy, B. The negative impact of antibiotics on outcomes in cancer patients treated with immunotherapy: A new independent prognostic factor? Ann. Oncol. Off. J. Eur. Soc. Med Oncol. Esmo 2019, 30, 1572–1579. [Google Scholar] [CrossRef]
- Ohri, C.M.; Shikotra, A.; Green, R.H.; Waller, D.A.; Bradding, P. Macrophages within NSCLC tumour islets are predominantly of a cytotoxic M1 phenotype associated with extended survival. Eur. Respir. J. 2009, 33, 118–126. [Google Scholar] [CrossRef]
- Ma, J.; Liu, L.; Che, G.; Yu, N.; Dai, F.; You, Z. The M1 form of tumor-associated macrophages in non-small cell lung cancer is positively associated with survival time. BMC Cancer 2010, 10, 112. [Google Scholar] [CrossRef]
- Puhakka, A.; Kinnula, V.; Napankangas, U.; Saily, M.; Koistinen, P.; Paakko, P.; Soini, Y. High expression of nitric oxide synthases is a favorable prognostic sign in non-small cell lung carcinoma. APMIS Acta Pathol. Microbiol. Immunol. Scand. 2003, 111, 1137–1146. [Google Scholar] [CrossRef]
- Zhao, S.; Jiang, T.; Zhang, L.; Yang, H.; Liu, X.; Jia, Y.; Zhou, C. Clinicopathological and prognostic significance of regulatory T cells in patients with non-small cell lung cancer: A systematic review with meta-analysis. Oncotarget 2016, 7, 36065–36073. [Google Scholar] [CrossRef]
- Wei, M.Q.; Mengesha, A.; Good, D.; Anne, J. Bacterial targeted tumour therapy-dawn of a new era. Cancer Lett. 2008, 259, 16–27. [Google Scholar] [CrossRef] [PubMed]


| Characteristic | Adenocarcinoma (AC; n = 44) | Squamous Cell Carcinoma (SSC; n = 45) | All (n = 89) |
|---|---|---|---|
| Age, mean ± SD | 62.8 ± 10.5 | 61.8 ± 9.2 | 62.3 ± 9.9 |
| Overall survival, mean ± SD | 41.4 ± 27.7 | 36.5 ± 29.6 | 33.2 ± 19.2 |
| Stage, n (%) | 3 (7%) | 2 (4%) | 5 (6%) |
| I | 21 (48%) | 15 (33%) | 36 (40%) |
| II | 16 (36%) | 26 (63%) | 42 (47%) |
| II | 4 (9%) | 2 (4%) | 6 (7%) |
| IV | |||
| Differentiation, n (%) | |||
| G1–G2 | 24 (55%) | 31 (69%) | 55 (62%) |
| G3–G4 | 20 (45%) | 14 (31%) | 34 (38%) |
| N, n (%) | |||
| N = 0 | 19 (43%) | 10 (22%) | 29 (33%) |
| N³ 1 | 25 (57%) | 35 (78%) | 60 (67%) |
| T, n (%) | |||
| T = 1–2 | 31 (70%) | 19 (42%) | 50 (56%) |
| T = 3–4 | 13 (30%) | 26 (58%) | 39 (44%) |
| CD68 | CD163 | CD206 | iNOS | |||||||||
|---|---|---|---|---|---|---|---|---|---|---|---|---|
| High | Low | p | High | Low | p | High | Low | p | High | Low | p | |
| Histology | ||||||||||||
| AC | 18 | 26 | 0.0343 * | 17 | 27 | 0.1387 | 14 | 30 | 0.8233 | 5 | 39 | <0.0001 * |
| SCC | 29 | 16 | 25 | 20 | 16 | 29 | 23 | 22 | ||||
| Stage | ||||||||||||
| I–II | 22 | 19 | >0.999 | 21 | 20 | 0.5276 | 28 | 13 | 0.0578 | 12 | 29 | 0.8194 |
| III–IV | 25 | 23 | 21 | 27 | 23 | 25 | 16 | 32 | ||||
| Nodal status | ||||||||||||
| N− | 13 | 16 | 0.3666 | 13 | 16 | 0.8229 | 20 | 31 | 0.1703 | 6 | 22 | 0.1505 |
| N+ | 34 | 26 | 29 | 31 | 9 | 29 | 23 | 38 | ||||
| Tumor size | ||||||||||||
| T1–T2 | 27 | 23 | 0.8332 | 24 | 26 | >0.9999 | 32 | 18 | 0.1957 | 13 | 37 | 0.2532 |
| T3–T4 | 20 | 19 | 18 | 21 | 19 | 20 | 15 | 24 | ||||
| Grade | ||||||||||||
| G1/2 | 27 | 28 | 0.3918 | 26 | 29 | >0.9999 | 36 | 19 | 0.0769 | 23 | 32 | 0.0095 * |
| G3/4 | 20 | 14 | 16 | 18 | 15 | 19 | 5 | 29 | ||||
| Age | ||||||||||||
| ≤60 | 15 | 26 | 0.0059 | 13 | 28 | 0.0103 * | 20 | 21 | 0.1969 | 17 | 24 | 0.0706 |
| >60 | 32 | 16 | 29 | 19 | 31 | 17 | 11 | 37 | ||||
| CD3 | CD8 | FOXP3 | |||||||
|---|---|---|---|---|---|---|---|---|---|
| High | Low | p | High | Low | p | High | Low | p | |
| Histology | |||||||||
| AC | 20 | 24 | >0.9999 | 21 | 23 | >0.9999 | 8 | 36 | 0.0014 * |
| SCC | 21 | 24 | 22 | 23 | 23 | 22 | |||
| Stage | |||||||||
| I–II | 24 | 17 | 0.0347 * | 25 | 16 | 0.0343 * | 13 | 28 | >0.9999 |
| III–IV | 17 | 31 | 18 | 30 | 18 | 30 | |||
| Nodal status | |||||||||
| N− | 16 | 25 | 0.2625 | 18 | 11 | 0.1124 | 8 | 21 | 0.6304 |
| N+ | 13 | 35 | 25 | 35 | 23 | 37 | |||
| Tumor size | |||||||||
| T1-T2 | 29 | 21 | 0.0179 * | 30 | 20 | 0.0184 * | 16 | 34 | 0.6548 |
| T3-T4 | 12 | 27 | 13 | 26 | 15 | 24 | |||
| Grade | |||||||||
| G1/2 | 25 | 30 | >0.9999 | 27 | 28 | >0.9999 | 21 | 34 | 0.6495 |
| G3/4 | 16 | 18 | 16 | 18 | 10 | 24 | |||
| Age | |||||||||
| ≤60 | 19 | 22 | >0.9999 | 14 | 27 | 0.0191 * | 10 | 31 | 0.0227 * |
| >60 | 22 | 26 | 29 | 19 | 21 | 27 | |||
© 2020 by the authors. Licensee MDPI, Basel, Switzerland. This article is an open access article distributed under the terms and conditions of the Creative Commons Attribution (CC BY) license (http://creativecommons.org/licenses/by/4.0/).
Share and Cite
Kovaleva, O.; Podlesnaya, P.; Rashidova, M.; Samoilova, D.; Petrenko, A.; Zborovskaya, I.; Mochalnikova, V.; Kataev, V.; Khlopko, Y.; Plotnikov, A.; et al. Lung Microbiome Differentially Impacts Survival of Patients with Non-Small Cell Lung Cancer Depending on Tumor Stroma Phenotype. Biomedicines 2020, 8, 349. https://doi.org/10.3390/biomedicines8090349
Kovaleva O, Podlesnaya P, Rashidova M, Samoilova D, Petrenko A, Zborovskaya I, Mochalnikova V, Kataev V, Khlopko Y, Plotnikov A, et al. Lung Microbiome Differentially Impacts Survival of Patients with Non-Small Cell Lung Cancer Depending on Tumor Stroma Phenotype. Biomedicines. 2020; 8(9):349. https://doi.org/10.3390/biomedicines8090349
Chicago/Turabian StyleKovaleva, Olga, Polina Podlesnaya, Madina Rashidova, Daria Samoilova, Anatoly Petrenko, Irina Zborovskaya, Valeria Mochalnikova, Vladimir Kataev, Yuri Khlopko, Andrey Plotnikov, and et al. 2020. "Lung Microbiome Differentially Impacts Survival of Patients with Non-Small Cell Lung Cancer Depending on Tumor Stroma Phenotype" Biomedicines 8, no. 9: 349. https://doi.org/10.3390/biomedicines8090349
APA StyleKovaleva, O., Podlesnaya, P., Rashidova, M., Samoilova, D., Petrenko, A., Zborovskaya, I., Mochalnikova, V., Kataev, V., Khlopko, Y., Plotnikov, A., & Gratchev, A. (2020). Lung Microbiome Differentially Impacts Survival of Patients with Non-Small Cell Lung Cancer Depending on Tumor Stroma Phenotype. Biomedicines, 8(9), 349. https://doi.org/10.3390/biomedicines8090349