
Crosstalk Between Metabolic Biomarkers and Pulse Wave Analysis in Hypertensive Patients

 ,
,  ,
, 
Abstract
1. Introduction
2. Materials and Methods
2.1. Study Population
2.2. Pulse Wave Analysis
2.3. Serum Lipids
2.3.1. Standard Serum Lipoproteins
2.3.2. Lipid Ratios
- AIP—Atherogenic Index of Plasma is calculated as Log TG/HDL-C
- AC—Atherogenic coefficient or AI—Atherogenic Index is calculated as Non-HDL/HDL
- CRI I—Castelli Risk Index I is calculated as TC/HDL-C
- CRI II—Castelli Risk Index II is calculated as LDL-C/HDL-C
- LI—Lipid Index was calculated, reflecting the pathological or protective effects of serum lipoproteins, adding:
- (+1) if TC > 200 mg/dL
- (+1) if LDL > 130 mg/dL
- (+1) if HDL < 40 mg/dL
- (−1) if HDL > 50 mg/dL
- (+1) if TG > 150 mg/dL
- (+1) if CRI I > 4.5%
- LBI—Lipid Balance Index was calculated as LI (Lipid Index) − LLD (Lipid Lowering Drugs), LLD = number of lipid-lowering drugs.
- (+1) Statins,
- (+1) Fibrates,
- (+1) Omega 3
- (+1) Ezetimib
2.4. Metabolic Syndrome (MetS)
2.5. TyG Index—A Biomarker of Insulin Resistance (IR)
2.6. Non-Alcoholic Fatty Liver Disease (NAFLD)
2.7. Statistical Data Analysis
3. Results
3.1. Characteristics of the Study Participants
3.2. Correlations
3.3. Multiple Linear Regression Analysis
4. Discussion
4.1. Serum Lipids and Pulse Wave Analysis
4.2. TyG Index—A Biomarker of Insulin Resistance (IR) and Pulse Wave Analysis
4.3. Metabolic Syndrome and Arterial Stiffness
4.4. The Interplay Between NAFLD, Cholesterol Metabolism, and Insulin Resistance
4.5. Study Limitations and Strengths of the Study
5. Conclusions
Author Contributions
Funding
Institutional Review Board Statement
Informed Consent Statement
Data Availability Statement
Conflicts of Interest
Abbreviations
| PWA | Pulse wave analysis |
| PWV | Pulse wave velocity |
| AI | Augmentation index |
| LDL | Low-density lipoproteins |
| HDL | High-density lipoproteins |
| Non-HDL | Non-high-density lipoproteins |
| TC | Total cholesterol |
| SCORE2 | Systemic Coronary Risk Estimation 2 |
| SCORE2-OP | Systemic Coronary Risk Estimation 2 Older Persons |
| TG | Triglycerides |
| VLDL | Very-low-density lipoproteins |
| AC | Atherogenic Coefficient |
| AIP | Atherogenic Index of Plasma |
| CRI I | Castelli Risk Index I |
| CRI II | Castelli Risk Index II |
| LI | Lipid Index |
| LBI | Lipid Balance Index |
| PP | Pulse pressure |
| SBP | Systolic blood pressure |
| DBP | Diastolic blood pressure |
| MAP | Mean arterial pressure |
| NVA | Normal vascular ageing |
| SUPERNOVA | Supernormal vascular ageing |
| EVA | Early vascular aging |
| LLD | Lipid lowering drugs |
| MetS | Metabolic syndrome |
| BMI | Body mass index |
| HbA1c | Hemoglobin A1c |
| TyG Index | Triglyceride-glucose Index |
| IR | Insulin Resistance |
| NAFLD | Non-alcoholic fatty liver disease |
| AST | Aspartate aminotransferase |
| ALT | Alanine aminotransferase |
| ACE inhibitors | Angiotensin-converting enzyme inhibitors |
| ARB | Angiotensin receptor blockers |
| MRA | Mineralocorticoid receptor antagonists |
| ARNI | Angiotensin receptor/neprilysin inhibitor |
| SGLT2 inhibitors | Sodium-glucose co-transporter-2 inhibitors |
| GLP 1 agonists | Glucagon-like peptide 1 agonists |
| r | Bravais-Pearson correlation coefficient |
| p | Significance level |
References
- Roth, G.A.; Mensah, G.A.; Johnson, C.O.; Addolorato, G.; Ammirati, E.; Baddour, L.M.; Barengo, N.C.; Beaton, A.Z.; Benjamin, E.J.; Benziger, C.P.; et al. Global Burden of Cardiovascular Diseases and Risk Factors, 1990–2019: Update From the GBD 2019 Study. J. Am. Coll. Cardiol. 2020, 76, 2982–3021, Erratum in J. Am. Coll. Cardiol. 2021, 77, 1958–1959. [Google Scholar] [CrossRef]
- Si, X.B.; Liu, W. Relationship between blood lipid and arterial stiffness in hypertension. Clin. Investig. Med. 2019, 42, E47–E55. [Google Scholar] [CrossRef] [PubMed]
- Wang, L.; Zhi, F.; Gao, B.; Ni, J.; Liu, Y.; Mo, X.; Huang, J. Association between lipid profiles and arterial stiffness: A secondary analysis based on a cross-sectional study. J. Int. Med. Res. 2020, 48, 300060520938188. [Google Scholar] [CrossRef] [PubMed]
- Laurent, S.; Boutouyrie, P.; Asmar, R.; Gautier, I.; Laloux, B.; Guize, L.; Ducimetiere, P.; Benetos, A. Aortic Stiffness Is an Independent Predictor of All-Cause and Cardiovascular Mortality in Hypertensive Patients. Hypertension 2001, 37, 1236–1241. [Google Scholar] [CrossRef]
- Boutouyrie, P.; Chowienczyk, P.; Humphrey, J.D.; Mitchell, G.F. Arterial Stiffness and Cardiovascular Risk in Hypertension. Circ. Res. 2021, 128, 864–886. [Google Scholar] [CrossRef]
- Mozos, I.; Jianu, D.; Gug, C.; Stoian, D. Links between High-Sensitivity C-Reactive Protein and Pulse Wave Analysis in Mid-dle-Aged Patients with Hypertension and High Normal Blood Pressure. Dis. Markers 2019, 2019, 2568069. [Google Scholar] [CrossRef]
- Vlachopoulos, C.; Aznaouridis, K.; Stefanadis, C. Prediction of Cardiovascular Events and All-Cause Mortality with Arterial Stiffness. J. Am. Coll. Cardiol. 2010, 55, 1318–1327. [Google Scholar] [CrossRef]
- Zhang, Y.; Lacolley, P.; Protogerou, A.D.; Safar, M.E. Arterial Stiffness in Hypertension and Function of Large Arteries. Am. J. Hypertens. 2020, 33, 291–296. [Google Scholar] [CrossRef]
- Triantafyllou, A.; Elia, S.A.; Park, C.; Climie, R.E.; Mayer, C.C.; Mozos, I.; Pucci, G.; Weber, T.; Panayiotou, A.G. Developing a Questionnaire on Knowledge, Perceptions and Application of Vascular-Aging Measurements. J. Cardiovasc. Dev. Dis. 2023, 10, 80. [Google Scholar] [CrossRef] [PubMed]
- Ramírez-Melo, L.M.; Estrada-Luna, D.; Rubio-Ruiz, M.E.; Castañeda-Ovando, A.; Fernández-Martínez, E.; Jiménez-Osorio, A.S.; Pérez-Méndez, Ó.; Carreón-Torres, E. Relevance of Lipoprotein Composition in Endothelial Dysfunction and the Development of Hypertension. Int. J. Mol. Sci. 2025, 26, 1125. [Google Scholar] [CrossRef]
- Močnik, M.; Marčun Varda, N. Lipid Biomarkers and Atherosclerosis—Old and New in Cardiovascular Risk in Childhood. Int. J. Mol. Sci. 2023, 24, 2237. [Google Scholar] [CrossRef] [PubMed]
- Visseren, F.L.J.; Mach, F.; Smulders, Y.M.; Carballo, D.; Koskinas, K.C.; Back, M.; Benetos, A.; Biffi, A.; Boavida, J.M.; Capo-danno, D.; et al. ESC Guidelines on cardiovascular disease prevention in clinical practice. Eur. Heart J. 2021, 42, 3227–3337. [Google Scholar] [CrossRef]
- Gimbrone, M.A., Jr.; García-Cardeña, G. Endothelial cell dysfunction and the pathobiology of atherosclerosis. Circ. Res. 2016, 118, 620–636. [Google Scholar] [CrossRef] [PubMed]
- Deanfield, J.E.; Halcox, J.P.; Rabelink, T.J. Endothelial Function and Dysfunction: Testing and Clinical Relevance. Circulation 2007, 115, 1285–1295. [Google Scholar] [CrossRef] [PubMed]
- Libby, P. Inflammation in atherosclerosis. Nature 2002, 420, 868–874. [Google Scholar] [CrossRef]
- Csányi, G.; Miller, F.J., Jr. Oxidative stress in cardiovascular disease. Int. J. Mol. Sci. 2014, 15, 6002–6008. [Google Scholar] [CrossRef]
- Basatemur, G.L.; Jørgensen, H.F.; Clarke, M.C.; Bennett, M.R.; Mallat, Z. Vascular smooth muscle cells in atherosclerosis. Nat. Rev. Cardiol. 2019, 16, 727–744. [Google Scholar] [CrossRef]
- Laurent, S.; Cockroft, J.; Van Bortel, L.; Boutouyrie, P.; Giannattasio, C.; Hayoz, D.; Pannier, B.; Vlachopoulos, C.; Wilkinson, I.; Struijker-Boudier, H. Expert consensus document on arterial stiffness: Methodological issues and clinical applications. Eur. Heart J. 2006, 27, 2588–2605. [Google Scholar] [CrossRef]
- Van Bortel, L. Arterial stiffness: From surrogate marker to therapeutic target. Artery Res. 2016, 14, 10–14. [Google Scholar] [CrossRef]
- Mozos, I.; Filimon, L. Arterial age and shift work. Int. J. Collab. Res. Intern. Med. Public Health 2013, 5, 340–347. [Google Scholar]
- Assempoor, R.; Daneshvar, M.S.; Taghvaei, A.; Abroy, A.S.; Azimi, A.; Nelson, J.R.; Hosseini, K. Atherogenic index of plasma and coronary artery disease: A systematic review and meta-analysis of observational studies. Cardiovasc. Diabetol. 2025, 24, 35. [Google Scholar] [CrossRef] [PubMed]
- Liu, H.; Chen, J.; Qin, Q.; Yan, S.; Wang, Y.; Li, J.; Ding, S. Association between TyG index trajectory and new-onset lean NAFLD: A longitudinal study. Front. Endocrinol. 2024, 15, 1321922. [Google Scholar] [CrossRef]
- Calling, S.; Johansson, S.E.; Wolff, M.; Sundquist, J.; Sundquist, K. The ratio of total cholesterol to high density lipoprotein cholesterol and myocardial infarction in Women’s health in the Lund area (WHILA): A 17-year follow-up cohort study. BMC Cardiovasc. Disord. 2019, 19, 239. [Google Scholar] [CrossRef]
- Xu, J.; Jing, C.; Yingxian, L.; Ying, S.; Lin, J.; Shaodi, Y.; Wenyu, G.; Yi, Y.; Sida, J.; Deshan, Y.; et al. The effect of LDL-C/HDL-C ratio on severity of coronary artery disease and 2-year long-term prognosis in patients with premature coronary heart disease—A multicenter, observational results. Eur. Heart J. 2023, 44, ehad655.1441. [Google Scholar] [CrossRef]
- Dobrowolski, P.; Prejbisz, A.; Kuryłowicz, A.; Baska, A.; Burchardt, P.; Chlebus, K.; Dzida, G.; Jankowski, P.; Jaroszewicz, J.; Jaworski, P.; et al. Metabolic syndrome—A new definition and management guidelines: A joint position paper by the Polish Society of Hypertension, Polish Society for the Treatment of Obesity, Polish Lipid Association, Polish Association for Study of Liver, Polish Society of Family Medicine, Polish Society of Lifestyle Medicine, Division of Prevention and Epidemiology Polish Cardiac Society, “Club 30” Polish Cardiac Society, and Division of Metabolic and Bariatric Surgery Society of Polish Surgeons. Arch. Med. Sci. 2022, 18, 1133–1156. [Google Scholar] [CrossRef]
- Primo, D.; Izaola, O.; de Luis, D.A. Triglyceride-Glucose Index Cutoff Point Is an Accurate Marker for Predicting the Prevalence of Metabolic Syndrome in Obese Caucasian Subjects. Ann. Nutr. Metab. 2023, 79, 238–245, Erratum in Ann. Nutr. Metab. 2023, 79, 403. [Google Scholar] [CrossRef]
- Ulfah, M.; Sukandar, H.; Afiatin. 81 Correlation of Total Cholesterol Level and Blood Pressure in Jatinangor. J. Hypertens. 2017, 35, e12. [Google Scholar] [CrossRef]
- Ademolu, A. Correlation between hyperlipidemia and hypertension, mean arterial pressure, pulse pressure among Africans. Endocrinol. Metab. Int. J. 2017, 5, 330–334. [Google Scholar] [CrossRef]
- He, G.-D.; Liu, X.-C.; Liu, L.; Yu, Y.-L.; Chen, C.-L.; Huang, J.-Y.; Lo, K.; Huang, Y.-Q.; Feng, Y.-Q. A nonlinear association of total cholesterol with all-cause and cause-specific mortality. Nutr. Metab. 2021, 18, 25. [Google Scholar] [CrossRef]
- Huang, L.; Liu, Z.; Zhang, H.; Li, D.; Li, Z.; Huang, J.; He, J.; Lu, L.; Wen, H.; Yuan, H.; et al. The Association between Serum Lipid Profile Levels and Hypertension Grades: A Cross-Sectional Study at a Health Examination Center. High. Blood Press. Cardiovasc. Prev. 2025, 32, 87–98. [Google Scholar] [CrossRef]
- Chen, H.; Chen, Y.; Wu, W.; Cai, Z.; Chen, Z.; Yan, X.; Wu, S. Total cholesterol, arterial stiffness, and systolic blood pressure: A me-diation analysis. Sci. Rep. 2021, 11, 1330. [Google Scholar] [CrossRef]
- Zhang, Y.; Murugesan, P.; Huang, K.; Cai, H. NADPH oxidases and oxidase crosstalk in cardiovascular diseases: Novel therapeutic targets. Nat. Rev. Cardiol. 2020, 17, 170–194. [Google Scholar] [CrossRef] [PubMed]
- Kröller-Schön, S.; Steven, S.; Kossmann, S.; Scholz, A.; Daub, S.; Oelze, M.; Xia, N.; Hausding, M.; Mikhed, Y.; Zinssius, E.; et al. Molecular mechanisms of the crosstalk between mitochondria and NADPH oxidase through reactive oxygen species-studies in white blood cells and in animal models. Antioxid. Redox Signal. 2014, 20, 247–266. [Google Scholar] [CrossRef] [PubMed]
- Calvillo, L.; Gironacci, M.M.; Crotti, L.; Meroni, P.L.; Parati, G. Neuroimmune crosstalk in the pathophysiology of hypertension. Nat. Rev. Cardiol. 2019, 16, 476–490. [Google Scholar] [CrossRef] [PubMed]
- Pereira, A.C.; Sposito, A.C.; Mota, G.F.; Cunha, R.S.; Herkenhoff, F.L.; Mill, J.G.; Krieger, J.E. Endothelial nitric oxide synthase gene variant modulates the relationship between serum cholesterol levels and blood pressure in the general population: New evidence for a direct effect of lipids in arterial blood pressure. Atherosclerosis 2006, 184, 193–200. [Google Scholar] [CrossRef]
- Yu, F.; Zong, B.; Ji, L.; Sun, P.; Jia, D.; Wang, R. Free Fatty Acids and Free Fatty Acid Receptors: Role in Regulating Arterial Function. Int. J. Mol. Sci. 2024, 25, 7853. [Google Scholar] [CrossRef] [PubMed]
- Birkenfeld, A.L.; Budziarek, P.; Boschmann, M.; Moro, C.; Adams, F.; Franke, G.; Berlan, M.; Marques, M.A.; Sweep, F.C.; Luft, F.C.; et al. Atrial natriuretic peptide induces postprandial lipid oxidation in humans. Diabetes 2008, 57, 3199–3204. [Google Scholar] [CrossRef]
- Miyamoto, J.; Kasubuchi, M.; Nakajima, A.; Irie, J.; Itoh, H.; Kimura, I. The role of short-chain fatty acid on blood pressure regulation. Curr. Opin. Nephrol. Hypertens. 2016, 25, 379–383. [Google Scholar] [CrossRef]
- Wang, H.; Li, Q.; Zhu, Y.; Zhang, X. Omega-3 Polyunsaturated Fatty Acids: Versatile Roles in Blood Pressure Regulation. Antioxid. Redox Signal. 2021, 34, 800–810. [Google Scholar] [CrossRef]
- Wu, J.; Guo, J. Non-high-density lipoprotein cholesterol to high-density lipoprotein cholesterol ratio (NHHR) and hypertension in American adults: A NHANES cross-sectional study. Front. Physiol. 2024, 15, 1398793. [Google Scholar] [CrossRef]
- Zhang, F.; Li, Z.; Wang, M.; Wang, Y.; Lu, C. Association of non-highdensity lipoprotein cholesterol to highdensity lipoprotein cholesterol ratio (NHHR) and subsequent hypertension and heart diseases: Findings from the CHARLS cohort. Aging Clin. Exp. Res. 2025, 37, 26. [Google Scholar] [CrossRef] [PubMed]
- Baba, M.; Maris, M.; Jianu, D.; Luca, C.T.; Stoian, D.; Mozos, I. The Impact of the Blood Lipids Levels on Arterial Stiffness. J. Cardiovasc. Dev. Dis. 2023, 10, 127. [Google Scholar] [CrossRef]
- Murakami, T.; Horibata, Y.; Tateno, S.; Kawasoe, Y.; Niwa, K. Early vascular aging in adult patients with congenital heart disease. Hypertens. Res. 2021, 44, 1122–1128. [Google Scholar] [CrossRef] [PubMed]
- Li, H.; Wang, X.; Lu, X.; Zhu, H.; Li, S.; Duan, S.; Zhao, X.; Zhang, F.; Alterovitz, G.; Wang, F.; et al. Co-expression network analysis identified hub genes critical to triglyceride and free fatty acid metabolism as key regulators of age-related vascular dysfunction in mice. Aging 2019, 11, 7620–7638. [Google Scholar] [CrossRef]
- Nimri, L.; Grajeda-Iglesias, C.; Volkova, N.; Aviram, M. Pro-atherogenic and pro-oxidant crosstalk between adipocytes and macrophages. Eur. J. Nutr. 2019, 58, 879–893. [Google Scholar] [CrossRef]
- Yamagishi, S.; Fukami, K.; Matsui, T. Crosstalk between advanced glycation end products (AGEs)-receptor RAGE axis and di-peptidyl peptidase-4-incretin system in diabetic vascular complications. Cardiovasc. Diabetol. 2015, 14, 2. [Google Scholar] [CrossRef]
- Kim, J.Y.; Lee, K.J.; Kang, J.; Kim, B.J.; Han, M.K.; Kang, K.; Park, J.M.; Park, T.H.; Park, H.K.; Cho, Y.J.; et al. Fasting and Non-Fasting Triglycerides in Patients With Acute Ischemic Stroke. J. Korean Med. Sci. 2022, 37, e100. [Google Scholar] [CrossRef]
- Mule, G.; Nardi, E.; Geraci, G.; Schillaci, M.K.; Cottone, S. The relationships between lipid ratios and arterial stiffness. J. Clin. Hypertens. 2017, 19, 777–779. [Google Scholar] [CrossRef] [PubMed]
- Millán, J.; Pintó, X.; Muñoz, A.; Zúñiga, M.; Rubiés-Prat, J.; Pallardo, L.F.; Masana, L.; Mangas, A.; Hernández-Mijares, A.; González-Santos, P.; et al. Lipoprotein ratios: Physiological significance and clinical usefulness in cardiovascular prevention. Vasc. Health Risk Manag. 2009, 5, 757–765. [Google Scholar]
- Kurniawan, L.B. Triglyceride-Glucose Index as ABiomarker of Insulin Resistance Diabetes Mellitus Metabolic Syndrome and Cardiovascular Disease: A Review. EJIFCC 2024, 35, 44–51. [Google Scholar]
- Zhang, S.; Du, T.; Zhang, J.; Lu, H.; Lin, X.; Xie, J.; Yang, Y.; Yu, X. The triglyceride and glucose index (TyG) is an effective biomarker to identify nonalcoholic fatty liver disease. Lipids Health Dis. 2017, 16, 15. [Google Scholar] [CrossRef] [PubMed]
- Wang, D.; Li, W.; Zhou, M.; Ma, J.; Guo, Y.; Yuan, J.; He, M.; Zhang, X.; Chen, W. Association of the triglyceride-glucose index variability with blood pressure and hypertension: A cohort study. QJM Int. J. Med. 2024, 117, 277–282. [Google Scholar] [CrossRef]
- Lee, D.H.; Park, J.E.; Kim, S.Y.; Jeon, H.J.; Park, J.H. Association between the triglyceride-glucose (TyG) index and increased blood pressure in normotensive subjects: A population-based study. Diabetol. Metab. Syndr. 2022, 14, 161. [Google Scholar] [CrossRef] [PubMed]
- Tan, L.; Liu, Y.; Liu, J.; Zhang, G.; Liu, Z.; Shi, R. Association between insulin resistance and uncontrolled hypertension and arterial stiffness among US adults: A population-based study. Cardiovasc. Diabetol. 2023, 22, 311. [Google Scholar] [CrossRef]
- Wu, Z.; Lan, Y.; Wu, D.; Chen, S.; Jiao, R.; Wu, S. Arterial stiffness mediates insulin re-sistance-related risk of atherosclerotic cardiovascular disease: A real-life, prospective cohort study. Eur. J. Preventive Cardiol. 2025, zwaf030. [Google Scholar] [CrossRef]
- Wang, A.; Su, Z.; Liu, X.; Yang, Y.; Chen, S.; Wang, S.; Luo, Y.; Guo, X.; Zhao, X.; Wu, S. Brachial-ankle pulse wave velocity and metabolic syndrome in general population: The APAC study. BMC Cardiovasc. Disord. 2016, 16, 228. [Google Scholar] [CrossRef]
- Kim, H.J.; Kim, B.S.; Kim, D.W.; Shin, J.H. Estimated pulse wave velocity as a forefront indicator of developing metabolic syndrome in Korean adults. Korean J. Intern. Med. 2024, 39, 612–624. [Google Scholar] [CrossRef]
- Roes, S.D.; Alizadeh Dehnavi, R.; Westenberg, J.J.; Lamb, H.J.; Mertens, B.J.; Tamsma, J.T.; de Roos, A. Assessment of aortic pulse wave velocity and cardiac diastolic function in subjects with and without the metabolic syndrome: HDL cholesterol is independently associated with cardiovascular function. Diabetes Care 2008, 31, 1442–1444. [Google Scholar] [CrossRef]
- Jucevičienė, A.; Puronaitė, R.; Badarienė, J.; Ryliškytė, L. Aortic pulse wave velocity predicts cardiovascular mortality among mid-dle-aged metabolic syndrome subjects without overt cardiovascular disease. Nutr. Metab. 2024, 21, 98. [Google Scholar] [CrossRef] [PubMed]
- Safar, M.E.; Balkau, B.; Lange, C.; Protogerou, A.D.; Czernichow, S.; Blacher, J.; Levy, B.I.; Smulyan, H. Hypertension and vascular dy-namics in men and women with metabolic syndrome. J. Am. Coll. Cardiol. 2013, 61, 12–19. [Google Scholar] [CrossRef] [PubMed]
- Lopes-Vicente, W.R.P.; Rodrigues, S.; Cepeda, F.X.; Jordão, C.P.; Costa-Hong, V.; Dutra-Marques, A.C.B.; Carvalho, J.C.; Alves, M.J.N.N.; Bortolotto, L.A.; Trombetta, I.C. Arterial stiffness and its association with clustering of metabolic syndrome risk factors. Diabetol. Metab. Syndr. 2017, 9, 87. [Google Scholar] [CrossRef] [PubMed]
- Paapstel, K.; Kals, J. Metabolomics of Arterial Stiffness. Metabolites 2022, 12, 370. [Google Scholar] [CrossRef] [PubMed]
- Kim, O.Y.; Lim, H.H.; Lee, M.J.; Kim, J.Y.; Lee, J.H. Association of fatty acid composition in serum phospholipids with metabolic syndrome and arterial stiffness. Nutr. Metab. Cardiovasc. Dis. 2013, 23, 366–374. [Google Scholar] [CrossRef]
- Kasper, P.; Martin, A.; Lang, S.; Kütting, F.; Goeser, T.; Demir, M.; Steffen, H.M. NAFLD and cardiovascular diseases: A clinical review. Clin. Res. Cardiol. 2021, 110, 921–937. [Google Scholar] [CrossRef]
- Pereira, E.N.G.d.S.; Araujo, B.P.d.; Rodrigues, K.L.; Silvares, R.R.; Guimarães, F.V.; Martins, C.S.M.; Flores, E.E.I.; Silva, P.M.R.e.; Daliry, A. Cholesterol Exacerbates the Pathophysiology of Non-Alcoholic Steatohepatitis by Upregulating Hy-poxia-Inducible Factor 1 and Modulating Microcirculatory Dysfunction. Nutrients 2023, 15, 5034. [Google Scholar] [CrossRef]
- Chen, J.; Rao, H.; Zheng, X. Identification of novel targets associated with cholesterol metabolism in nonalcoholic fatty liver disease: A comprehensive study using Mendelian randomization combined with transcriptome analysis. Front. Genet. 2024, 15, 1464865. [Google Scholar] [CrossRef]
- Abderrahmani, A.; Yengo, L.; Caiazzo, R.; Canouil, M.; Cauchi, S.; Raverdy, V.; Plaisance, V.; Pawlowski, V.; Lobbens, S.; Maillet, J.; et al. Increased Hepatic PDGF-AA Signaling Mediates Liver Insulin Resistance in Obesity-Associated Type 2 Diabetes. Diabetes 2018, 67, 1310–1321. [Google Scholar] [CrossRef]
- Guo, W.; Lu, J.; Qin, P.; Li, X.; Zhu, W.; Wu, J.; Xu, N.; Zhang, Q. The triglyceride-glucose index is associated with the severity of hepatic steatosis and the presence of liver fibrosis in non-alcoholic fatty liver disease: A cross-sectional study in Chinese adults. Lipids Health Dis. 2020, 19, 218. [Google Scholar] [CrossRef]
- Huang, W.; Wang, H.; Shen, Z.; Wang, X.; Yu, X. Association between TyG index and risk of carotid atherosclerosis in NAFLD patients: A retrospective cohort study. Front. Endocrinol. 2024, 15, 1448359. [Google Scholar] [CrossRef] [PubMed]
- Zhao, J.; Fan, H.; Wang, T.; Yu, B.; Mao, S.; Wang, X.; Zhang, W.; Wang, L.; Zhang, Y.; Ren, Z.; et al. TyG index is positively associated with risk of CHD and coronary atherosclerosis severity among NAFLD patients. Cardiovasc. Diabetol. 2022, 21, 123. [Google Scholar] [CrossRef]
- Hu, H.; Han, Y.; Liu, Y.; Guan, M.; Wan, Q. Triglyceride: A mediator of the association between waist-to-height ratio and non-alcoholic fatty liver disease: A second analysis of a population-based study. Front. Endocrinol. 2022, 13, 973823. [Google Scholar] [CrossRef] [PubMed]


| Variable | Intervals |
|---|---|
| Cardiovascular risk factors | |
| Age (years) | 64 ± 10 |
| Male | 36 patients (55%) |
| BMI (kg/m2) | 29.9 ± 5 |
| Obesity | 31 patients (47%) |
| Obesity and overweight | 55 patients (83%) |
| Smoking | 29 patients (44%) |
| Dyslipidemia | 62 patients (94%) |
| Diabetes | 19 patients (29%) |
| Diabetes and prediabetes | 23 patients (36%) |
| Metabolic syndrome | 28 patients (42%) |
| Number of MetS criteria | 1.43 ± 1.73 |
| NAFLD | 48 patients (73%) |
| Insulin resistance | 55 patients (83%) |
| Pulse wave analysis | |
| AI (%) | 23.49 ± 16.56 |
| PWV (m/s) | 9.45 ± 1.48 |
| SBP (mmHg) | 135 ± 19 |
| DBP (mmHg) | 85 ± 11 |
| PP (mmHg) | 51 ± 13 |
| MAP (mmHg) | 106 ± 18 |
| EVA | 16 patients (24%) |
| Serum lipids and ratios | |
| Lipid index | 1.32 ± 1.77 |
| Lipid balance index | 0.61 ± 1.89 |
| TC (mg/dL) | 196.91 ± 51.87 |
| TG (mg/dL) | 191.23 ± 213.58 |
| Non HDL (mg/dL) | 147.12 ± 51.62 |
| LDL (mg/dL) | 122.86 ± 46 |
| HDL (mg/dL) | 49.15 ± 13.6 |
| AIP | 5.36 ± 11.49 |
| AC | 3.29 ± 1.71 |
| CRI I | 4.28 ± 1.71 |
| CRI II | 2.62 ± 1.16 |
| TyG | 4.86 ± 0.39 |
| Biochemical profile | |
| Glucose (mg/dL) | 117 ± 40 |
| HbA1c (%) | 6.3 ± 1.1 |
| Creatinine (mg/dL) | 0.9 ± 0.3 |
| Uric acid (mg/dL) | 6.4 ± 1.6 |
| AST (mg/dL) | 25 ± 10 |
| ALT (mg/dL) | 27 ± 14 |
| Medication | |
| ACE inhibitors | 34 (51.5%) |
| ARB | 18 (27.3%) |
| Calcium channel antagonists | 34 (51.5%) |
| Loop diuretics | 6 (9.1%) |
| MRA | 5 (7.6%) |
| Thiazide-like diuretics | 25 (37.9%) |
| Beta-blockers | 38 (57.6%) |
| If channel inhibitors | 4 (6.1%) |
| Potassium channel blockers | 4 (6.1%) |
| Centrally active antihypertensives | 7 (10.6%) |
| Nitrates | 7 (10.6%) |
| Metabolic anti-ischemic drugs | 5 (7.6%) |
| Antiplatelet drugs | 30 (45.5%) |
| Anticoagulant drugs | 4 (6.1%) |
| ARNI | 2 (3%) |
| SGLT2 inhibitors | 2 (3%) |
| GLP 1 agonist | 1 (1.5%) |
| Statins | 45 (68.2%) |
| Selective cholesterol- absorbtion inhibitors | 5 (7.6%) |
| Fibrates | 7 (10.6%) |
| Polyunsaturated fats Omega 3 | 2 (3%) |
| Biguanides | 8 (12.1%) |
| Sulphonylureas | 6 (9%) |
| Insulin | 5 (7.6%) |
| Correlation Between | r(p) |
|---|---|
| SBP-AC | 0.13 (0.29) |
| DBP-TC | 0.25 (0.042) |
| DBP-non-HDL | 0.27 (0.026) |
| DBP-nonHDL (adjusted for age and BMI) | 0.267 (0.032) |
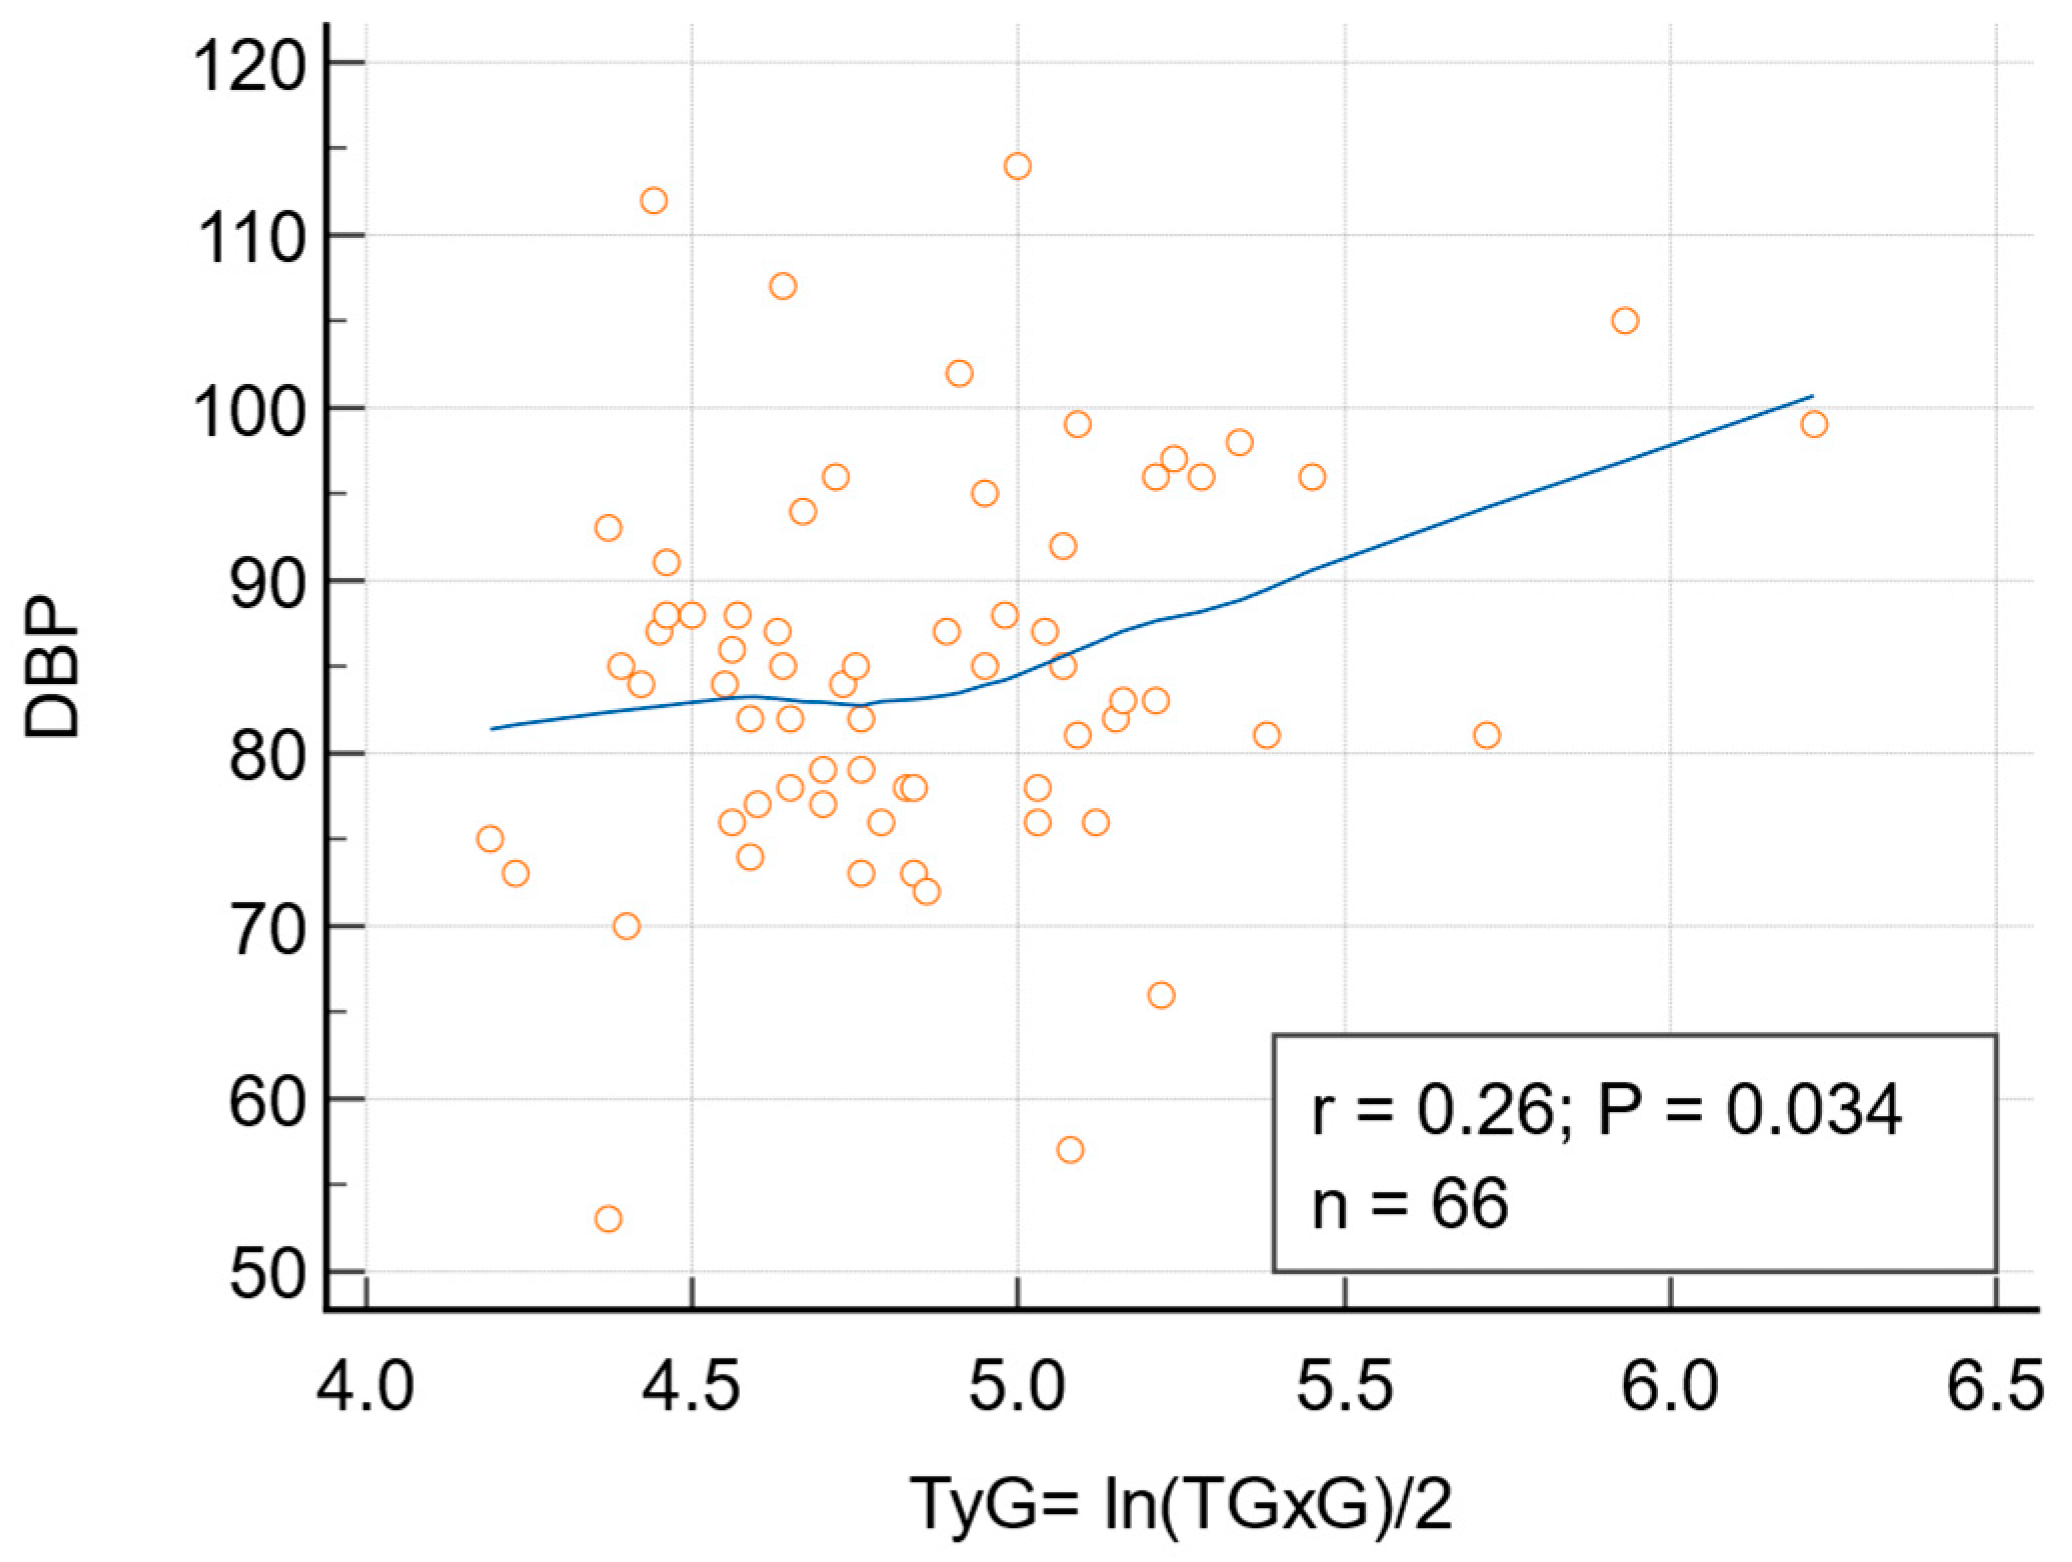
| DBP-TyG | 0.2617 (0.0338) |
| DBP-TyG (adjusted for age and BMI) | 0.207 (0.0995) |
| MAP-nonHDL | 0.21 (0.08) |
| PP-CRI II | 0.08 (0.49) |
| PP-HDL | −0.10 (0.42) |
| PWV-CRI I | −0.10 (0.41) |
| PWV-TG | −0.18 (0.15) |
| PWV-LDL | 0.13 (0.31) |
| AI-AIP | −0.18 (0.14) |
| Variable | LI (r/p) | LBI (r/p) |
|---|---|---|
| AI | −0.13 (0.30) | −0.16 (0.21) |
| PWV | 0.0092 (0.94) | 0.04 (0.73) |
| SBP | 0.22 (0.071) | 0.29 (0.02) |
| DBP | 0.19 (0.12) | 0.24 (0.05) |
| MAP | 0.094 (0.45) | 0.16 (0.21) |
| PP | 0.15 (0.214) | 0.21 (0.09) |
| EVA | 0.16 (0.19) | 0.24 (0.053) |
| NAFLD | 0.34 (0.0048) | 0.29 (0.019) |
| IR | 0.29 (0.019) | 0.25 (0.041) |
| Nr. Criteria MetS | 0.057 (0.65) | 0.008 (0.95) |
| Correlation Between | r(p) |
|---|---|
| PWV-MetS | rho = −0.33 (0.007) rK = 0.27 (0.0012) |
| PWV-IR | rho = −0.216 (0.0821) rk = −0.179 (0.033) |
| PWV-NAFLD | rho = −0.221 (0.075) rK = −0.183 (0.029) |
| SBP-LBI | rho = 0.263 (0.0331) rK = 0.188 (0.0259) |
| SBP-TyG | rho = 0.237 (0.0555) rK = 0.169 (0.0457) |
| MAP-TC | rho = 0.256 (0.0384) rK = 0.186 (0.0274) |
| EVA-TG | rho = 0.207 (0.0953) rK = 0.171 (0.044) |
| EVA-LBI | rho = 0.23 (0.064) rK = 0.201 (0.018) |
| EVA-TyG | rho = 0.234 (0.059) rK = 0.193 (0.0224) |
| NAFLD-LI | rho = 0.333 (0.0063) rK = 0.294 (0.0005) |
| NAFLD-LBI | rho = 0.281 (0.0222) rK = 0.246 (0.0036) |
| IR-LI | rho = 0.285 (0.0203) rK = 0.252 (0.0029) |
| IR-LBI | rho = 0.26 (0.037) rK = 0.224 (0.0081) |
| Dependent Variable | Independent Variables | Multiple R | R Square | Adjusted R Square | 95% Confidence Interval | Significance |
|---|---|---|---|---|---|---|
| DBP | TC | 0.2507 | 0.06286 | 0.04822 | 0.001961 to 0.1076 | 0.0423 |
| DBP | LDL > 130 mg/dL | 0.2816 | 0.07928 | 0.06489 | 0.9594 to 11.9181 | 0.022 |
| DBP | LBI | 0.2424 | 0.05875 | 0.04404 | 0.0006489 to 2.8954 | 0.0499 |
| SBP | CRI I > 4.5% | 0.2915 | 0.08496 | 0.07067 | 2.1562 to 21.7359 | 0.0176 |
| SBP | LBI | 0.2867 | 0.08222 | 0.06787 | 0.4818 to 5.3349 | 0.0196 |
| IR | LI | 0.2888 | 0.08343 | 0.06910 | 0.01054 to 0.1118 | 0.0187 |
| NAFLD | TyG (p < 0.0001) TG (p = 0.0001) | 0.7433 | 0.5525 | 0.7433 | 1.0028 to 1.6696 −0.00189 to −0.0006916 | <0.0001 |
| NAFLD | LI | 0.3428 | 0.1037 | 0.1037 | 0.02738 to 0.1461 | 0.0048 |
| NAFLD | IR | 0.7303 | 0.5333 | 0.5260 | 0.6689 to 1.0766 | <0.0001 |
| Metabolic syndrome | PWV | 0.2780 | 0.07726 | 0.2780 | −0.1737 to −0.01278 | 0.0238 |
| Metabolic syndrome | Age | 0.3703 | 0.1371 | 0.1237 | −0.0296 to −0.006813 | 0.0022 |
Disclaimer/Publisher’s Note: The statements, opinions and data contained in all publications are solely those of the individual author(s) and contributor(s) and not of MDPI and/or the editor(s). MDPI and/or the editor(s) disclaim responsibility for any injury to people or property resulting from any ideas, methods, instructions or products referred to in the content. |
© 2025 by the authors. Licensee MDPI, Basel, Switzerland. This article is an open access article distributed under the terms and conditions of the Creative Commons Attribution (CC BY) license (https://creativecommons.org/licenses/by/4.0/).
Share and Cite
Baba, M.; Maris, M.I.; Bucur, A.; Jianu, D.; Moroz, S.M.; Stoian, D.; Luca, C.T.; Mozos, I. Crosstalk Between Metabolic Biomarkers and Pulse Wave Analysis in Hypertensive Patients. Biomedicines 2025, 13, 1514. https://doi.org/10.3390/biomedicines13071514
Baba M, Maris MI, Bucur A, Jianu D, Moroz SM, Stoian D, Luca CT, Mozos I. Crosstalk Between Metabolic Biomarkers and Pulse Wave Analysis in Hypertensive Patients. Biomedicines. 2025; 13(7):1514. https://doi.org/10.3390/biomedicines13071514
Chicago/Turabian StyleBaba, Mirela, Mihaela Ioana Maris, Adina Bucur, Daniela Jianu, Simina Mariana Moroz, Dana Stoian, Constantin Tudor Luca, and Ioana Mozos. 2025. "Crosstalk Between Metabolic Biomarkers and Pulse Wave Analysis in Hypertensive Patients" Biomedicines 13, no. 7: 1514. https://doi.org/10.3390/biomedicines13071514
APA StyleBaba, M., Maris, M. I., Bucur, A., Jianu, D., Moroz, S. M., Stoian, D., Luca, C. T., & Mozos, I. (2025). Crosstalk Between Metabolic Biomarkers and Pulse Wave Analysis in Hypertensive Patients. Biomedicines, 13(7), 1514. https://doi.org/10.3390/biomedicines13071514