Abstract
Background/Objectives: Metabolic dysfunction-associated steatohepatitis (MASH) has become the leading cause of hepatocellular carcinoma and liver disorders globally. Nevertheless, only one expensive drug, resmetirom (Res), has been approved by the FDA for MASH treatment to date. However, its high price has imposed a heavy financial burden on patients. Methods: In this study, half-dose Res and low-dose metformin (Met) (referred to as RM) were administered in combination to treat MASH models in vitro and in vivo. We utilized transcriptome and lipidomics sequencing to assess the efficacy of RM in improving MASH. Our goal was to systemically compare the therapeutic effects of RM, Met, and Res on MASH and elucidate the underlying mechanisms. Results: Our results demonstrated that RM was comparable to Res and superior to Met in reducing lipid production in vitro, attenuating lipid accumulation, inhibiting inflammation, and improving fibrosis in vivo. Transcriptome and lipidome analyses further revealed that RM regulated the expression of genes and lipids in a manner similar to Res, particularly in pathways related to cholesterol metabolism and inflammation. Further validation showed that RM facilitated cholesterol transformation by robustly promoting the expression of CYP7A1, thereby mitigating MASH. Conclusions: Collectively, our findings highlight that a combination of half-dose Res and Met is equivalent to Res alone in terms of MASH treatment efficacy. This study provides a novel therapeutic strategy that is not only effective for MASH treatment but also reduces the economic burden on patients.
1. Introduction
Metabolic dysfunction-associated steatotic liver disease (MASLD, previously known as NAFLD) is a common liver disorder that affects approximately 30% of the global population, with an increasing incidence [1]. Given its complex pathogenesis, MASLD is also closely related to obesity, lipodystrophy, and type 2 diabetes mellitus (T2DM), severely threatening human health [2]. MASLD is a progressive disease, and metabolic dysfunction-associated steatohepatitis (MASH, previously known as NASH) represents a more advanced stage [3]. MASH is characterized by lipid accumulation, inflammation, and fibrosis in the liver [4]. Mechanistically, excessive lipid deposition in hepatocytes contributes to lipid metabolism disorder, which includes increased lipid uptake and biosynthesis, as well as decreased lipid degradation [5]. Free fatty acids (FFA) are lipotoxic to hepatocytes, causing inflammation and necrosis of hepatocytes while also activating macrophages and hepatic stellate cells. This activation leads to liver inflammation and fibrosis. As the disease progresses, MASH can further develop into cirrhosis and hepatocellular carcinoma (HCC) [6].
Although MASH has attracted widespread attention due to its high prevalence and potential progression, few effective therapies have been approved. Resmetirom (Res), a thyroid hormone receptor-beta (THR-β) agonist, was approved by the FDA in March 2024 and became the only listed drug for MASH treatment [7,8]. The recommended clinical dose of Res is 80 mg/kg or 100 mg/kg; however, its high cost, USD 47,400 per year, limits its accessibility for MASH patients [9,10]. Additionally, MASH is a chronic disease, and patients need to take long-term medication, which may increase the risk of adverse reactions [11]. Based on the WHO-VigiAccess database (https://www.vigiaccess.org (accessed on 19 May 2025)), the most common types of adverse reactions to resmetirom were gastrointestinal disorders, with 182 cases reported (21%). Additionally, nausea was identified as a common adverse reaction to resmetirom, which was related to gastrointestinal disorders [12]. Currently, other drugs used in metabolic disease therapies, including hypoglycemic agents, can also be employed to assist MASH treatment [13,14]. It is noteworthy that T2DM is bidirectionally associated with MASLD [15]. It was estimated that 55.5% of T2DM patients have MASLD [16], while the prevalence of T2DM in MASLD and MASH patients is 22.5% and 43.63% [17]. Moreover, T2DM accelerates the progression of liver fibrosis and increases the risk of HCC in patients with MASLD [18]. Metformin (Met), the first-line drug for treating T2DM, has been shown to have positive effects in MASLD treatment in numerous studies [19]. However, long-term use of Met may lead to potential side effects due to its high clinical oral dose, such as gastrointestinal symptoms [20]. Therefore, to reduce the required dose and treatment cost of Res, we proposed and evaluated the combined effect of a half-dose of Res and Met in the MASH model and explored its underlying molecular mechanisms.
A plethora of evidence indicates the critical role of cholesterol homeostasis disorders in the pathogenesis of MASH, as they can induce oxidative stress and inflammation. Hepatocytes obtain cholesterol mainly through endogenous synthesis (with the rate-limiting enzyme being 3-hydroxy-3-methylglutaryl coenzyme A reductase (HMGCR)) and exogenous uptake [21]. Hepatocytes uptake low-density lipoprotein particles and chylomicron remnants via low-density lipoprotein receptor (LDLR)-mediated endocytosis, which helps to remove cholesterol from the circulation and maintain normal cholesterol levels in the plasma [22]. The primary way to clear cholesterol in hepatocytes is to convert it into bile acids, with cholesterol 7 alpha-hydroxylase (cytochrome P450 family 7 subfamily A member 1, CYP7A1) and sterol-27-hydroxylase (cytochrome P450 family 27 subfamily A member 1, CYP27A1) serving as the rate-limiting enzymes [23,24]. Subsequently, ATP-binding cassette subfamily G member 5 or G member 8 (ABCG5/G8) excretes bile acids into the bile [24]. Therefore, intervening in these pathways to counteract liver lipid accumulation is a potential strategy to relieve MASH.
In this study, we evaluated the protective effects of the combination of Res and Met at a halved clinical dose, both in vitro and in vivo. RM had the same effect as Res and Met on ameliorating lipid deposition and liver fibrosis, but its role in improving inflammation was better than that of Res and Met in db/db mice. Our experimental data elucidated that RM mitigated MASH comparably to Res, while better than Met. These findings confirmed that the combination of a halved clinical dose of Res and Met can be used as an innovative and effective therapy for MASH treatment, which lowers the huge economic burden on patients caused by clinical-dose Res.
2. Materials and Methods
2.1. Animals
Male C57BL/6J and db/db mice (6-week-old) were purchased from Cavens Experimental Animal Co., Ltd. (Changzhou, China). All mice were fed under a 12-h light–dark cycle at a constant temperature (22 ± 2 °C) and humidity (56 ± 5%), with sufficient normal diet and water. All animal experiments were approved by the Ethical Committee on Animal Experimentation of the Chinese Academy of Medical Sciences and Peking Union Medical College (ethical code: SLXD-20240430010). After one week of adaptation, mice were randomly divided into the control group, model group, Met treatment group (Metformin, Bristol-Myers Squibb (China) (Shanghai, China), 205 mg/kg and 410 mg/kg, i.g.), Res treatment group (Resmetirom, Shanghai Yuanye Bio-Technology Co., Ltd., Shanghai, China, 16.4 mg/kg, i.g.), and RM treatment group (metformin 205 mg/kg + resmetirom 8.2 mg/kg, i.g.). After nine weeks of administration, all mice were sacrificed. Serum was collected, and livers were frozen in liquid nitrogen and fixed in 4% paraformaldehyde.
2.2. Cell Culture and Treatment
The HepG2 cell line was purchased from Pricella Biosciences (Suzhou, China) and AML12 cells were obtained from the Cell Bank/Stem Cell Bank, Chinese Academy of Sciences. Both cell lines were cultured in DMEM (GIBCO BRL, Grand Island, NY, USA) supplemented with 10% FBS (GIBCO BRL, Grand Island, NY, USA) and 1% ampicillin/streptomycin (GIBCO BRL, Grand Island, NY, USA) in an incubator at 37 °C with 5% CO2. HepG2 cells were seeded at a density of 1 × 10⁴ cells/well in 96-well plates (or 6 × 10⁵ cells/well in 6-well plates) and allowed to adhere for 24 h prior to treatment. AML12 cells were seeded at a density of 5 × 10³ cells/well in 96-well plates (or 3 × 10⁵ cells/well in 6-well plates) and allowed to adhere for 24 h prior to treatment. Subsequently, the cells were exposed to FFA (0, 0.25, 0.5, 1, 1.5, and 2 mM) composed of oleic acid (Sigma-Aldrich, St. Louis, MO, USA) and palmitic acid (Sigma-Aldrich, St. Louis, MO, USA) (2:1 ratio) for 24 h. Cell viability and TG content were detected using a cell counting kit-8 (CCK8) kit (GLPBIO, Montclair, CA, USA) and a TG assay kit (Nanjing Jiancheng Biotechnology Research Institute Co., Ltd., Nanjing, China), respectively.
To detect therapeutic effects, HepG2 and AML12 cells were seeded in 6-well plates and cultured for 24 h. Then, HepG2 cells were treated with 1 mM FFA, and AML12 cells were treated with 1.5 mM FFA, both in the presence or absence of drugs (50 μM Res, 10 μM Met, 40 μM Met, 25 μM Res + 10 μM Met (RM)) for 24 h. After treatment, cells were collected for RNA extraction or for detection of TG and TC content using the TG and TC assay kit (Nanjing Jiancheng Biotechnology Research Institute Co., Ltd., Nanjing, China) according to the manufacturer’s instructions. For Oil Red O and Bodipy staining, HepG2 and AML12 cells were seeded at a density of 2 × 10⁵ and 1 × 10⁵ cells/well, respectively, on glass coverslips in 12-well plates and cultured for 24 h. The cells were then treated as described above. After that, the cells were fixed with 4% paraformaldehyde (Solarbio, Beijing, China) and stained with the corresponding reagents according to the Oil Red O assay kit (Beyotime Biotechnology Co., Ltd., Shanghai, China) or Bodipy reagent (Invitrogen, Carlsbad, CA, USA) protocols. The nuclei were stained with hematoxylin (Beyotime Biotechnology Co., Ltd., Shanghai, China) or DAPI (Zhongshan Golden Bridge Biological Technology Co., Ltd., Beijing, China), respectively. The stained cells were visualized by TissueGnostics (Vienna, Austria).
2.3. Real-Time Quantitative Polymerase Chain Reaction (RT-qPCR)
Total RNA was extracted from HepG2 cells, AML12 cells, and liver tissues using Trizol reagent (Takara Bio, Shiga, Japan). After the RNA concentration was measured by NanoDrop (Thermo Fisher Scientific, Waltham, MA, USA), cDNA was synthesized through reverse transcriptional reaction using a reverse transcriptase kit (Takara Bio, Shiga, Japan). Then, RT-qPCR was performed via fluorescence quantification kits (Takara Bio, Shiga, Japan). All primer sequences are displayed in Table 1.

Table 1.
The sequences of primers used for RT-qPCR.
2.4. Blood Biochemical Parameters
The levels of triglyceride (TG), total cholesterol (TC), alanine aminotransferase (ALT), and aspartate aminotransferase (AST) in mouse serum were detected using the Beckman Coulter AU480 automatic biochemical analyzer according to the manufacturer’s protocols (Biosano, Beijing, China). The levels of tumor necrosis factor-alpha (TNF-α) and interleukin (IL)-10 in serum were measured with enzyme-linked immunosorbent assay (ELISA) kits (Elabscience, Wuhan, China) according to the instructions provided.
2.5. Histopathology
After the liver tissues were fully fixed with 4% paraformaldehyde, they were embedded in paraffin to make slices. Liver sections of every sample were stained with hematoxylin and eosin (H&E), Sirius red, and Masson reagents. Subsequently, the histological changes were assessed with a microscope (LeicaFS1000, Wetzlar, Germany).
For Oil Red O staining, the fixed liver tissues were rinsed and then embedded with OCT to make slices. Liver sections of every sample were stained with Oil Red O reagents. Subsequently, the histological features of liver tissues were observed with the microscope (LeicaFS1000, Wetzlar, Germany).
2.6. Transmission Electron Microscope (TEM)
After mice sacrifice, the liver tissues were immersed in electron microscope liquid, and the following operation was the same as previously described [25]. Ultimately, the ultrastructure of liver tissues was observed by TEM (Hitachi, Tokyo, Japan).
2.7. Protein Extraction and Western Blot
Proteins in liver tissues were extracted using RIPA lysis buffer (CW2333S, CWBIO) with protease inhibitors (CW2200S, CWBIO). Protein samples were separated using sodium dodecyl-sulfate polyacrylamide gel (SDS-PAGE) electrophoresis and transferred onto an NC membrane (Cytiva, Uppsala, Sweden). Then, the membrane was blocked at room temperature for 2 h and incubated with anti-CYP7A1 (18054-1-AP, Proteintech, Wuhan, China), anti-ABCG5 (27722-1-AP, Proteintech, Wuhan, China), anti-LDLR (10785-1-AP, Proteintech, Wuhan, China), and anti-β-ACTIN (AC026, ABclonal Technology, Wuhan, China) primary antibodies overnight at 4 °C. Subsequently, membranes were incubated with corresponding secondary antibodies and imaged using a Touch Imager System (e-BLOT, Shanghai, China). Finally, ImageJ 1.53k software (National Institutes of Health, Bethesda, MD, USA) was applied to analyze the protein expression, and β-ACTIN was used as the control.
2.8. Transcriptomic Sequencing Analysis
After total RNA extraction of mice liver tissues, the integrity and total amount of RNA were examined accurately by Agilent 2100 bioanalyzer (Agilent Technologies, Santa Clara, CA, USA). Then, mRNA was purified from total RNA by using poly-T oligo-attached magnetic beads for library preparation.
After the library was qualified, different libraries were pooled together for Illumina sequencing according to the effective concentration and the amount of target offline data. All raw reads were processed by fastp software (version 0.19.7), and all downstream analysis was based on these high-quality clean data. Next, differential expression analysis, GO and KEGG enrichment analysis of DEGs, GSEA, and other analyses were all performed.
2.9. Lipidomics Sequencing Analysis
Precooled methanol and MTBE were added to 100 mg of liver tissue powder and incubated. Subsequently, MS-grade water was added to the mix, and the upper organic phase was collected by centrifugation. The solvent mixture was added to the lower layer to re-extract and collect the upper organic phase. The twice collected organic phase was concentrated and redissolved with isopropanol and then analyzed by the LC-MS/MS system. UHPLC-MS/MS analyses were performed using a Vanquish UHPLC system (Thermo Fisher, Dreieich, Germany) coupled with an Orbitrap Q ExactiveTM HF mass spectrometer (Thermo Fisher, Dreieich, Germany). Samples were injected into a Thermo Accucore C30 column (150 × 2.1 mm, 2.6 μm) at a flow rate of 0.35 mL/min. The column temperature was 40 °C. Mobile phase buffer A was acetonitrile/water (6/4) with 10 mM ammonium acetate and 0.1% formic acid, whereas buffer B was acetonitrile/isopropanol (1/9) with 10 mM ammonium acetate and 0.1% formic acid. The Q ExactiveTM HF mass spectrometer was operated in positive and negative polarity modes to further analyze samples.
The raw data files generated by UHPLC-MS/MS were processed using Lipidsearch to perform peak alignment, peak picking, and quantitation for each metabolite. Ultimately, qualitative and quantitative information about the substances in different samples was obtained. Further data processing and analysis were performed by using the R language (version R-3.4.3) and corresponding R packages (version R-3.4.3).
2.10. Statistical Analysis
Statistical analysis was performed by the software GraphPad Prism 8.0. All quantitative data were assessed for normality using the Shapiro-Wilk test. The homogeneity of variances was verified using Bartlett’s test for parametric data. Datasets satisfying both normality and equal variance were analyzed with parametric tests. Comparisons of multiple groups were determined by one-way ANOVA with Tukey’s post hoc. All results were represented as means ± SD, and p < 0.05 was considered statistically significant.
3. Results
3.1. A Combination of Half-Dose Res and Met Alleviated Lipid Metabolism Disorders in HepG2 Cells Treated with FFA
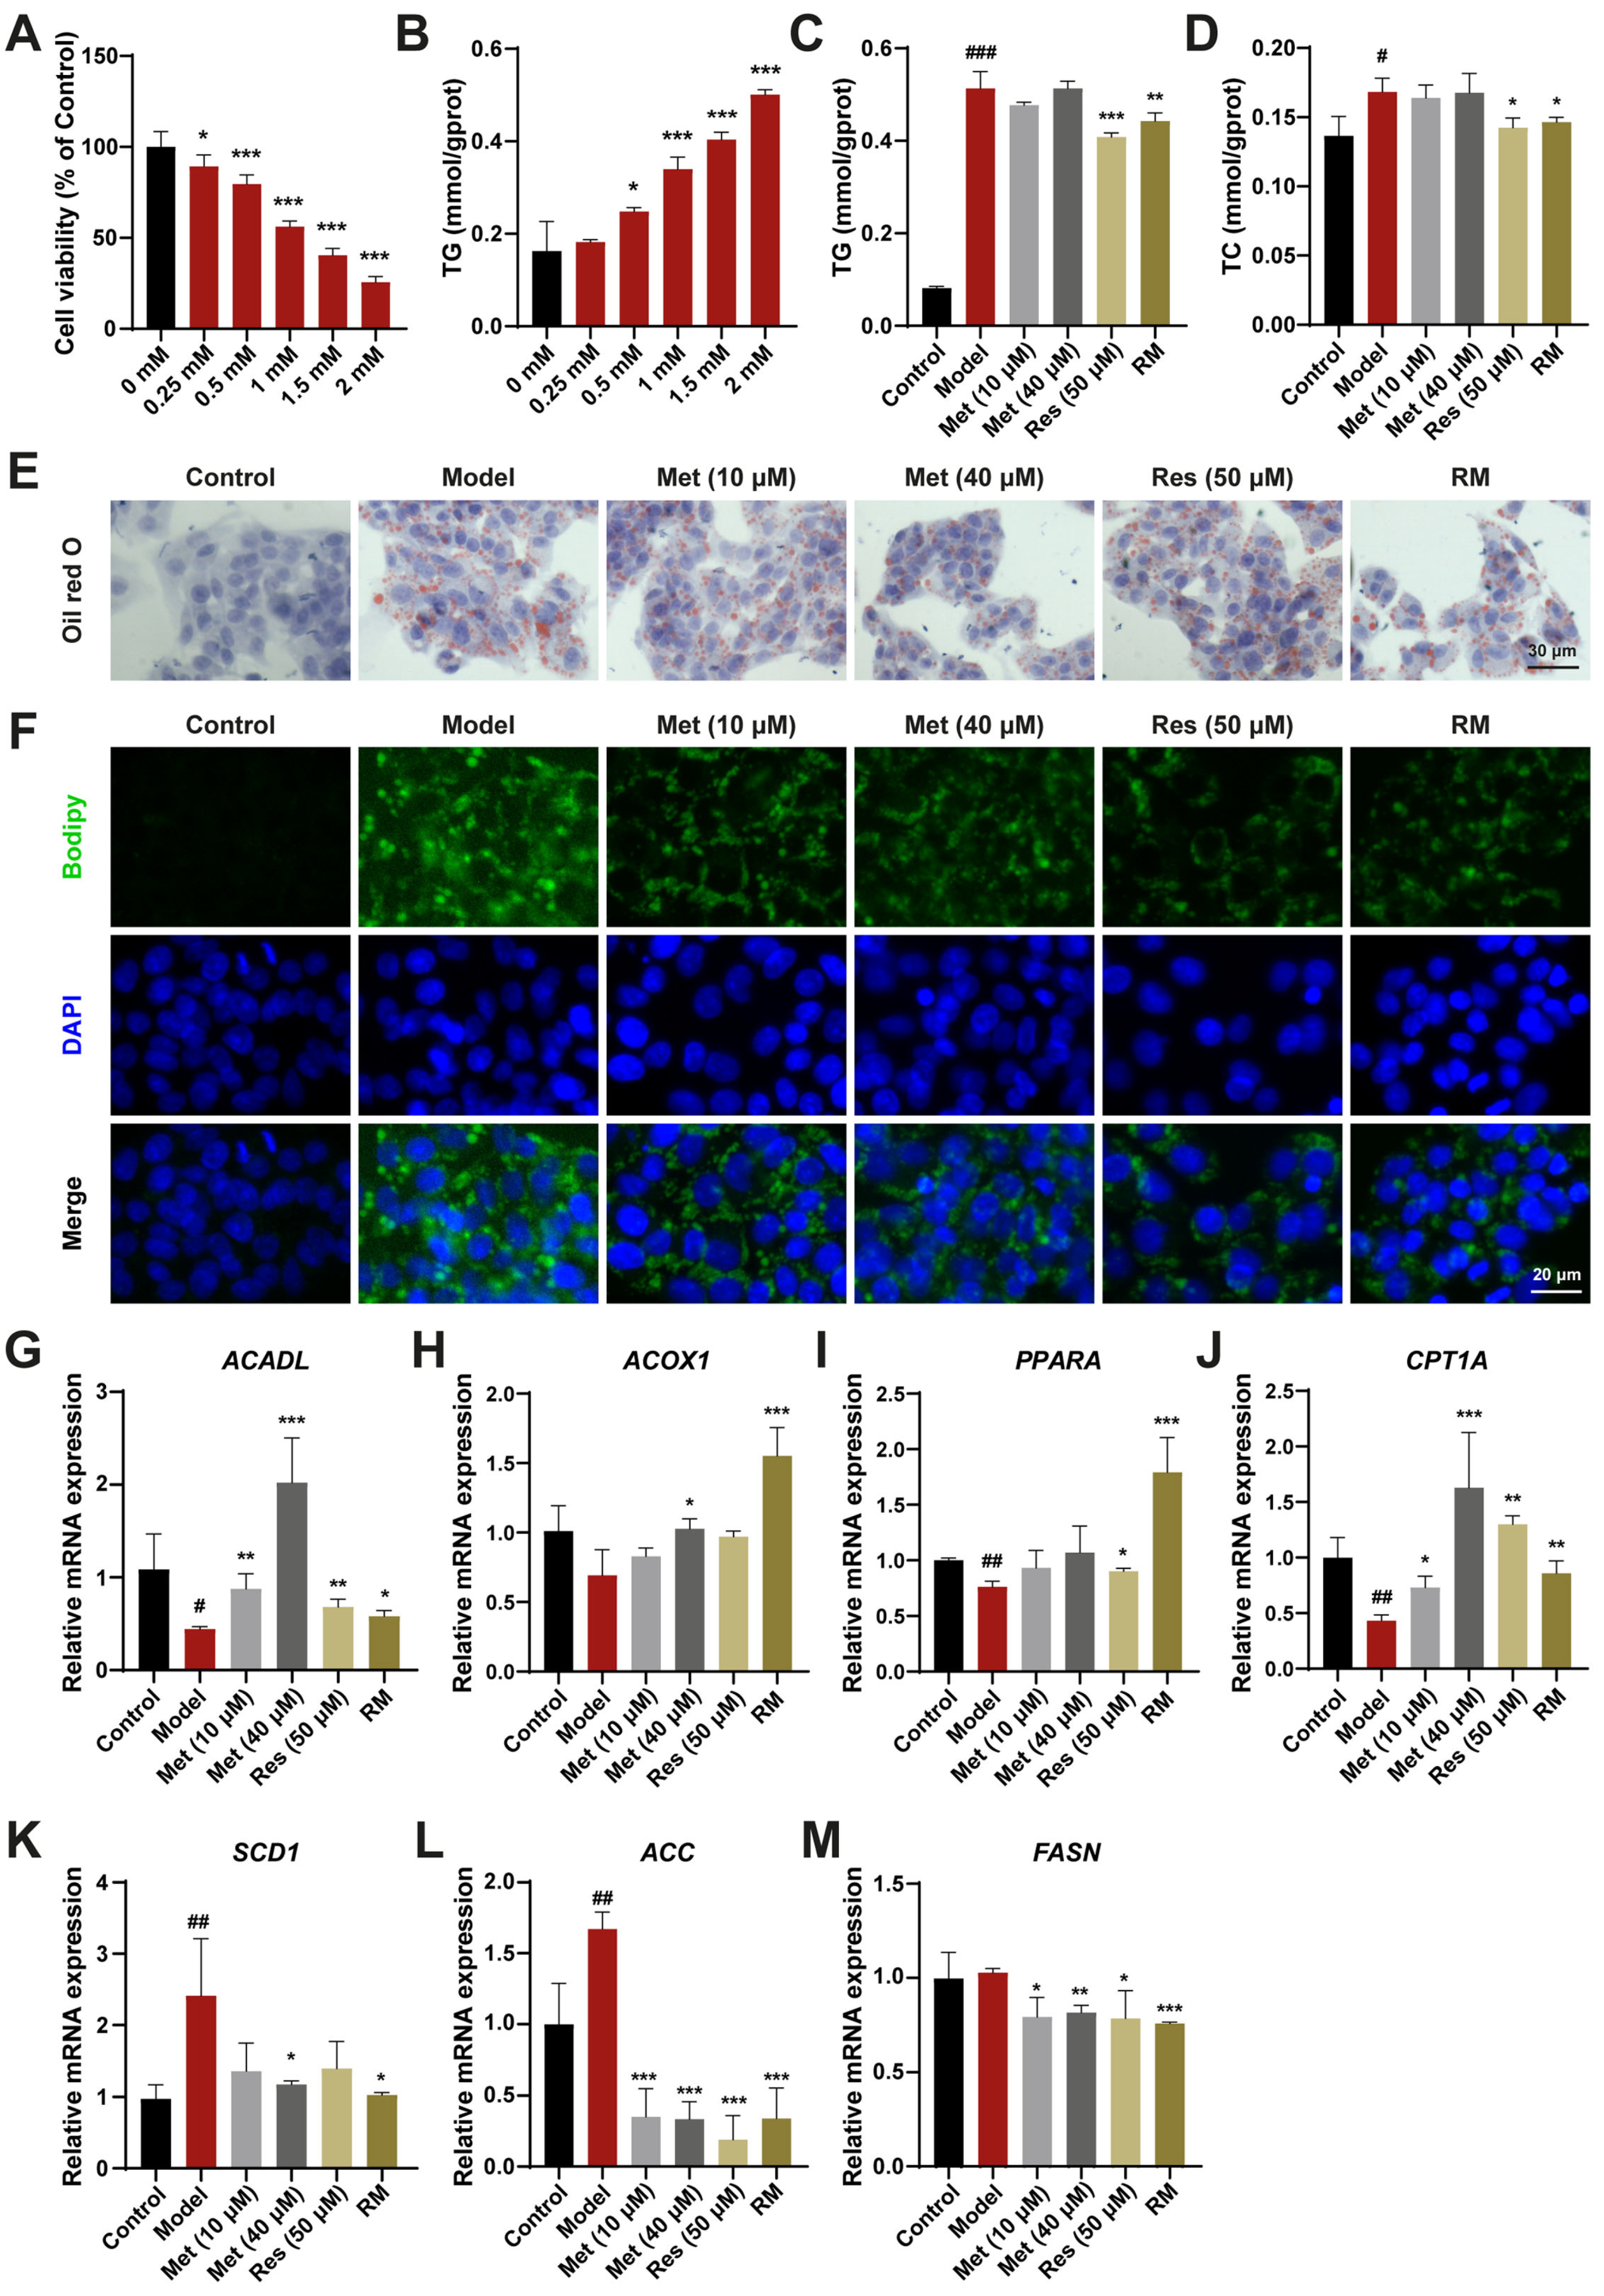
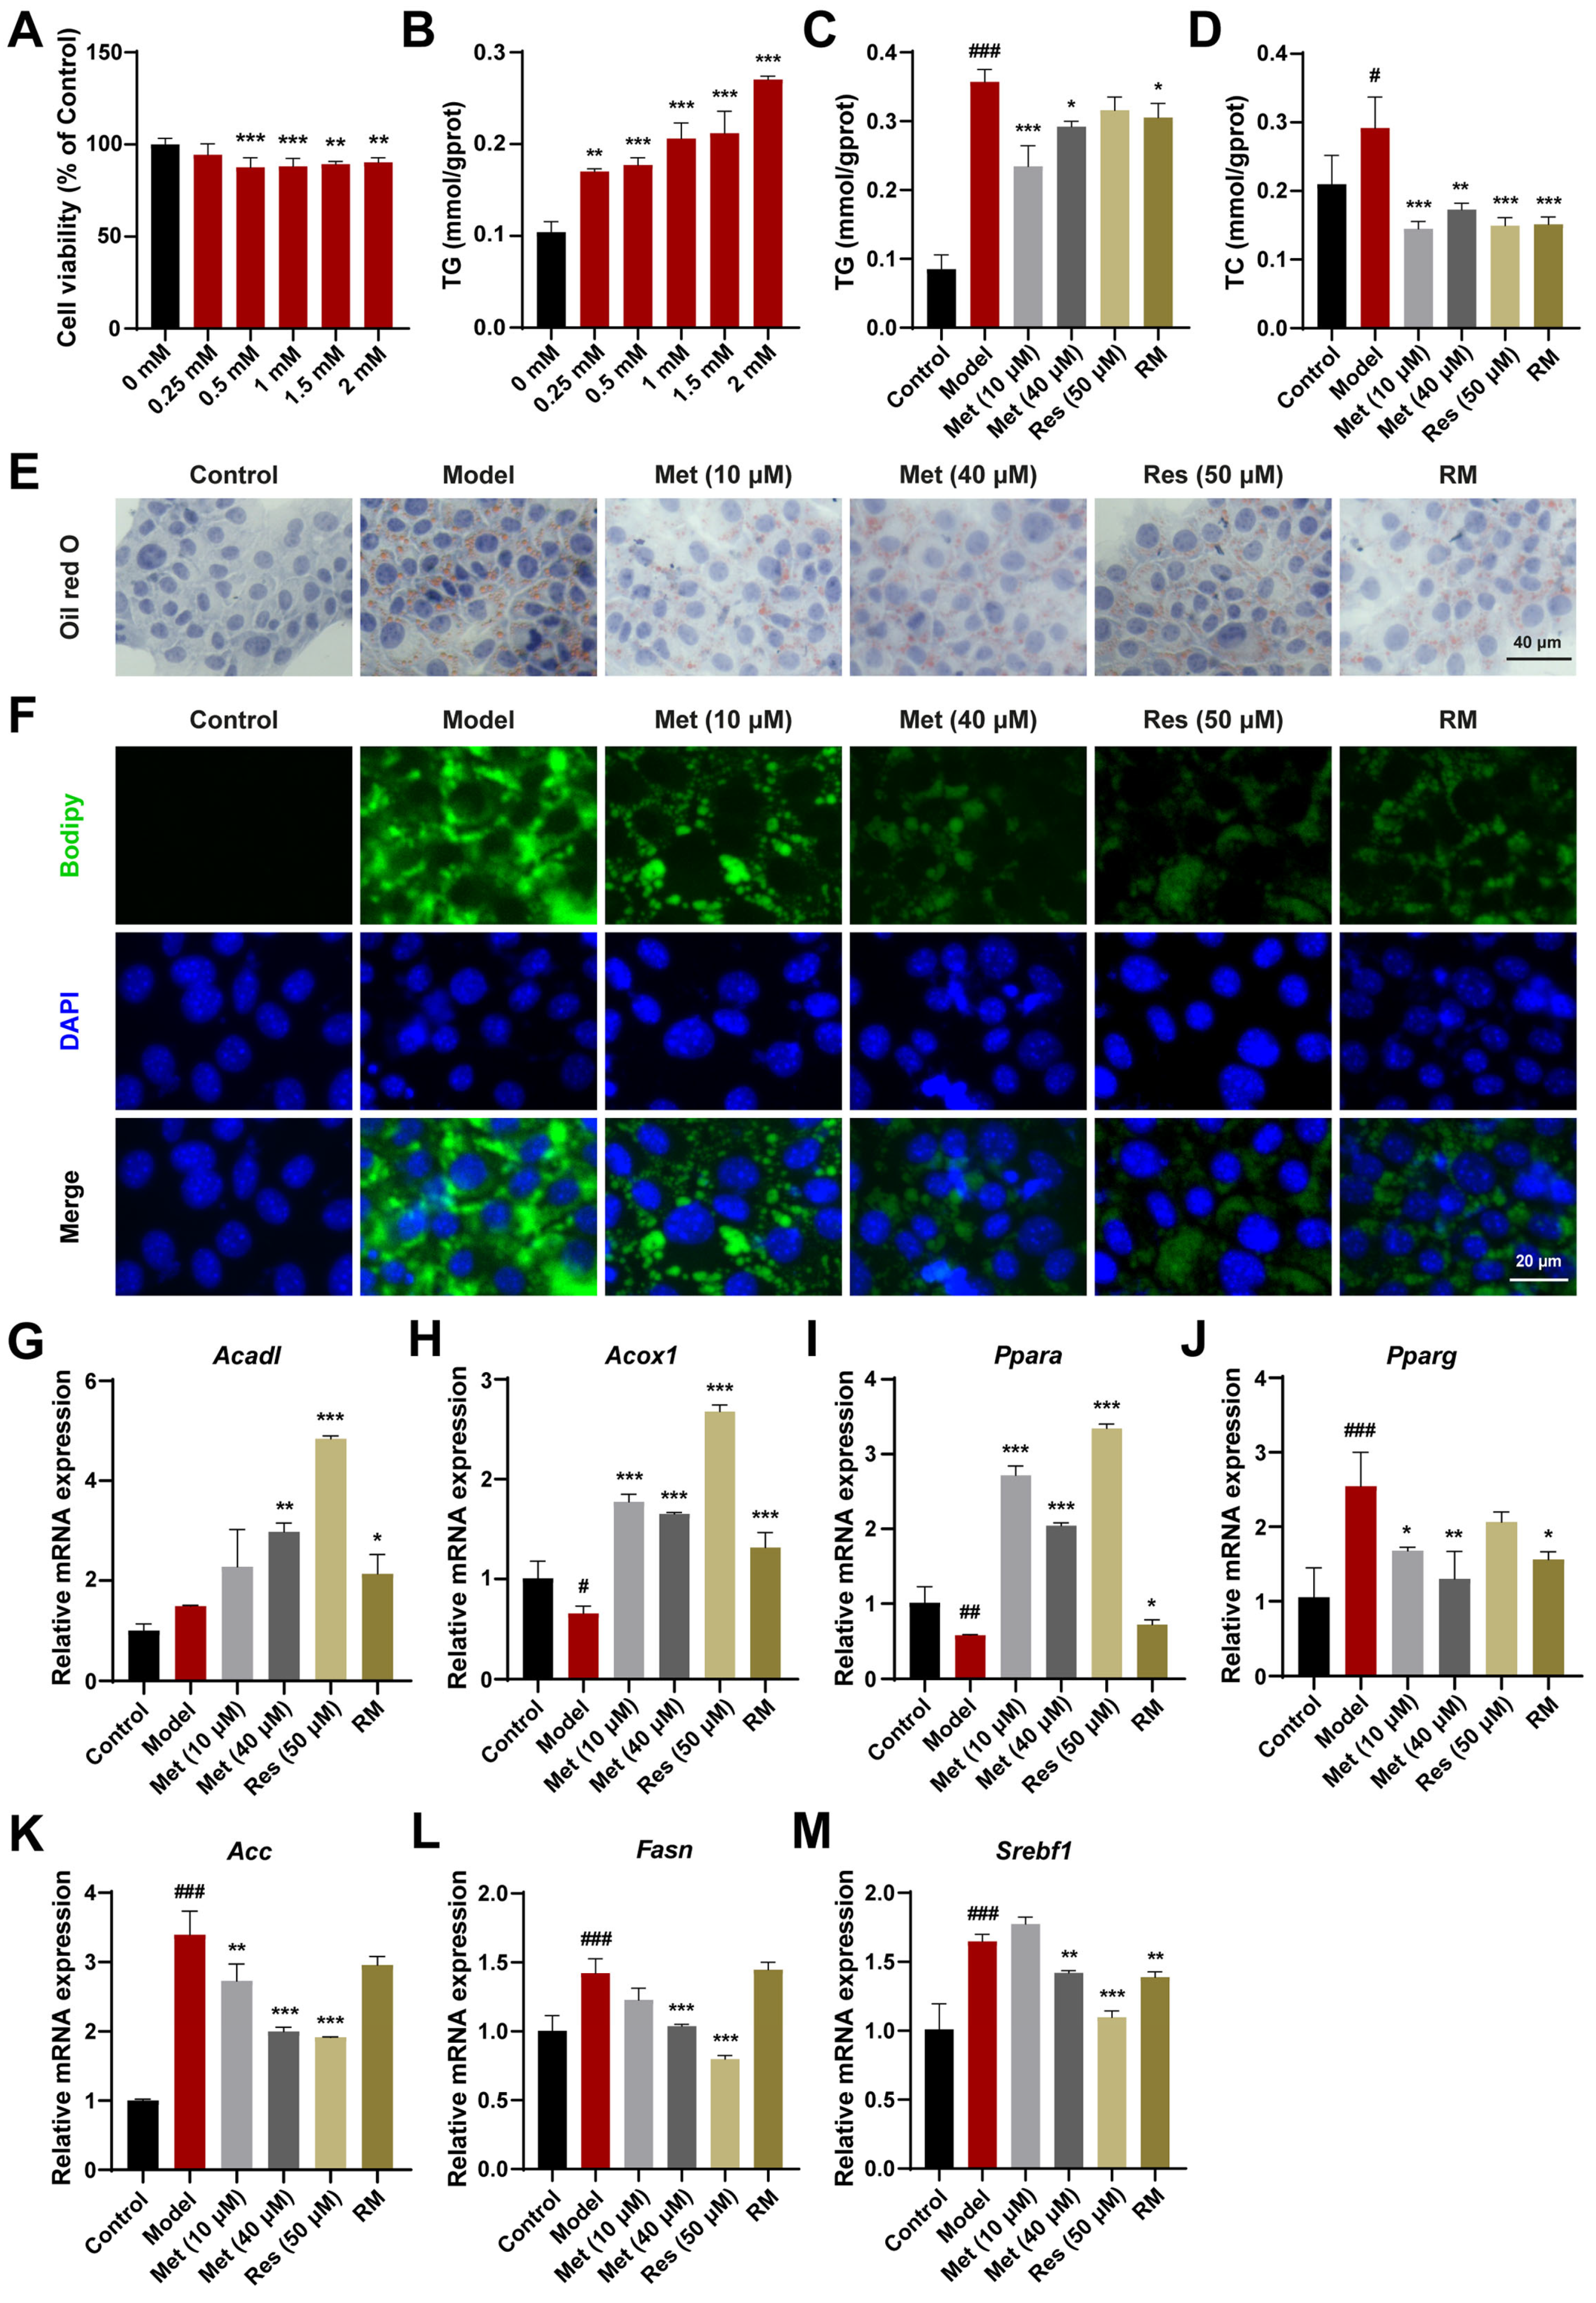
To assess the curative effects of Res and Met on MASH, a HepG2 cell model treated with FFA was established. Upon treatment with 1 mM FFA, HepG2 cells exhibited significantly reduced cell viability and a marked increase in TG content (Figure 1A,B). The lipid-lowering effects of RM and Res were confirmed by measuring TG and TC contents in FFA-induced cells, whereas these effects were not significant in the low- and high-dose Met groups (Figure 1C,D). Oil Red O and Bodipy staining results further demonstrated that RM clearly decreased cellular lipid accumulation in FFA-treated cells. The RM group had fewer Oil Red O areas and lower green fluorescence intensity than the Met (10 μM) group and was equivalent to the Res and Met (40 μM) groups (Figure 1E,F).
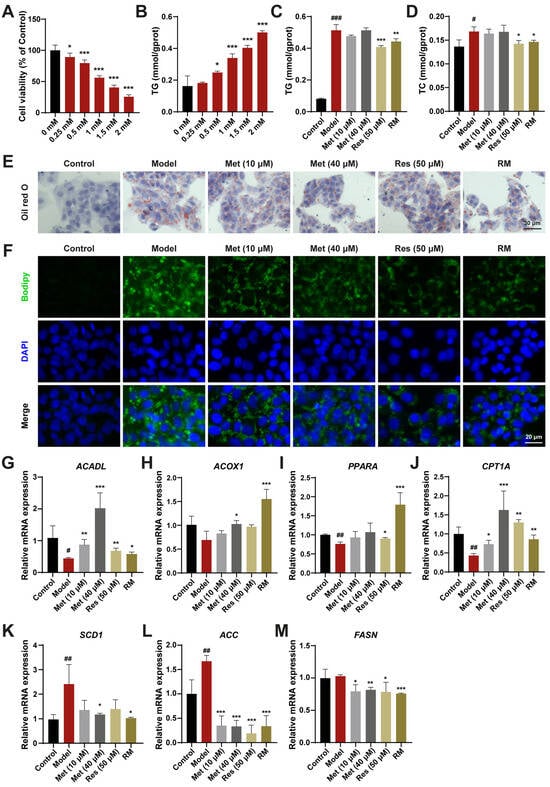
Figure 1.
RM ameliorated lipid homeostasis in HepG2 cells treated with FFA. (A) Effects of FFA (0, 0.25, 0.5, 1, 1.5, and 2 mM) on HepG2 cell viability (n = 6). (B) Effects of FFA (0, 0.25, 0.5, 1, 1.5, and 2 mM) on HepG2 cell TG levels (n = 3). (C,D) The levels of TG and TC in HepG2 cells (n = 3). (E,F) Representative images of Oil Red O and Bodipy staining of HepG2 cells (n = 3, scale bar: 30 μm and 20 μm). (G–M) The mRNA levels of HepG2 cells were examined by RT-qPCR (n = 3). Data represent mean ± SD; # p < 0.05, ## p < 0.01, ### p < 0.001 versus the control group; * p < 0.05, ** p < 0.01, and *** p < 0.001 versus the model group.
To elucidate the mechanisms underlying the reduction of lipid accumulation by these drugs, we evaluated the expression level of genes involved in fatty acid oxidation and lipogenesis. Compared with the model group, HepG2 cells treated with Met (10 μM and 40 μM), Res, and RM exhibited increased mRNA expression of genes modulating fatty acid degradation, including long-chain acyl-coenzyme A dehydrogenase (ACADL), acyl-coenzyme A oxidase 1 (ACOX1), proliferator-activated receptor α (PPARA), and carnitine palmitoyltransferase 1α (CPT1A). Conversely, the expression of genes regulating fatty acid synthesis, such as stearoyl-CoA desaturase 1 (SCD1), acetyl-CoA carboxylase (ACC), and fatty acid synthase (FASN), was decreased (Figure 1G–M). Interestingly, Met enhanced the expression of lipid metabolism-related genes in a dose-dependent manner, and RM achieved the same efficacy as high-dose Res or Met alone (Figure 1G–M). These results suggest that RM effectively protects HepG2 cells from lipid metabolism disorders induced by FFA.
3.2. A Combination of Half-Dose Res and Met Decreased Lipid Accumulation in AML12 Cells Treated with FFA
AML12 cells, a mouse hepatocyte cell line, were also used to validate the therapeutic effects. Based on the results of CCK8 and TG assays, a concentration of 1.5 mM FFA was selected for subsequent cell experiments (Figure 2A,B). Met (10 μM and 40 μM), Res, and RM reduced TC and TG levels in AML12 cells treated with FFA (Figure 2C,D). The reduction in lipid accumulation was further confirmed by Oil Red O and Bodipy staining. With RM treatment, AML12 cells displayed fewer Oil Red O areas and less green fluorescence intensity in comparison with the model group (Figure 2E,F). Of note is that the RM group showed fewer Oil Red O areas and green fluorescence intensity compared to the low-dose Met group and was comparable to the high-dose Met and Res groups in that (Figure 2E,F).

Figure 2.
RM improved lipid metabolism in AML12 cells treated with FFA. (A) Effects of FFA (0, 0.25, 0.5, 1, 1.5, and 2 mM) on AML12 cell viability (n = 6). (B) Effects of FFA (0, 0.25, 0.5, 1, 1.5, and 2 mM) on AML12 cell TG levels (n = 3). (C,D) The levels of TG and TC in AML12 cells (n = 3). (E,F) Representative images of Oil Red O and Bodipy staining of AML12 cells (n = 3, scale bar: 40 μm and 20 μm). (G–M) The mRNA levels of AML12 cells were examined by RT-qPCR (n = 3). Data represent mean ± SD; # p < 0.05, ## p < 0.01, ### p < 0.001 versus the control group; * p < 0.05, ** p < 0.01, and *** p < 0.001 versus the model group.
In addition, to elucidate the mechanism of lipid reduction, we evaluated the expression levels of genes regulating fatty acid oxidation and lipogenesis in AML12 cells. Compared with the model group, Met (10 μM and 40 μM), Res, and RM effectively upregulated the expression of genes modulating fatty acid degradation (Acadl, Acox1, and Ppara) and downregulated the expression of genes regulating fatty acid synthesis (proliferator-activated receptor γ (Pparg), Acc, Fasn, and sterol regulatory element binding transcription factor 1 (Srebf1)) in AML12 cells (Figure 2G–M). These results indicate that RM effectively protects AML12 cells against lipid accumulation induced by FFA and exhibits comparable therapeutic effects to Res.
3.3. Concomitant Half-Dose Res and Met Ameliorated Hepatic Lipid Accumulation and Metabolism Disorders in db/db Mice
To determine the therapeutic effects of RM on MASH progression in vivo, we treated db/db mice with RM, Res, and low and high doses of Met via oral gavage for 9 weeks (Figure 3A). Macroscopical changes were observed in liver tissues among these groups (Figure 3B). Compared with the control group, the livers of untreated db/db mice featured hepatomegaly, passivated liver edge, yellow coloration, and a greasy appearance. In contrast, Res, Met, and RM attenuated these alterations (Figure 3B). Histopathological results of H&E and Oil Red O staining showed balloon-like changes, inflammatory cell infiltration, and excessive lipid droplet accumulation in the livers of db/db mice (Figure 3C,D). TEM of liver ultrastructure in the model group showed increased large lipid droplets and broken mitochondria (Figure 3E). However, Met administration improved these histological and microscopic changes in a dose-dependent manner, and RM equivalently ameliorated these pathological differences compared to Res (Figure 3C,E).
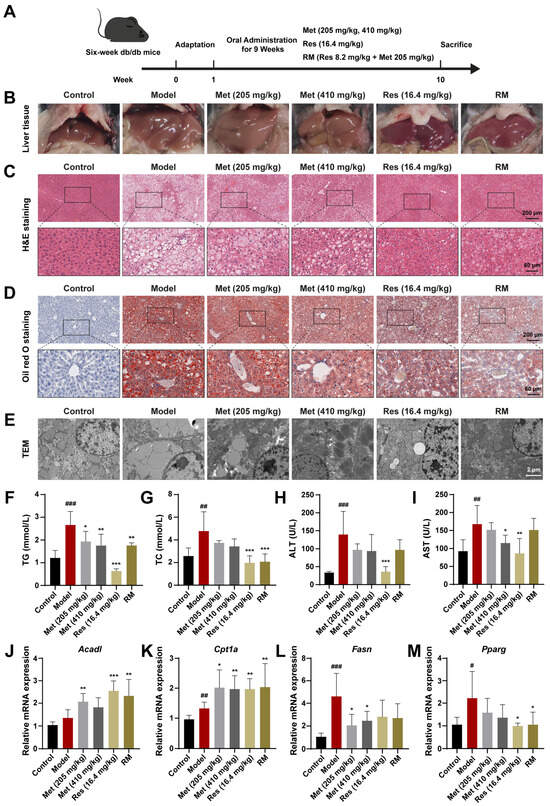
Figure 3.
Met, Res, and RM improved systemic lipid homeostasis in db/db mice (n = 6/group). (A) Procedure for the administration of Met, Res, and RM. (B–E) Representative images of the liver specimen, H&E staining (scale bars: 200 µm and 60 µm; magnification: 20× and 63×), Oil Red O staining (scale bars: 200 µm and 60 µm; magnification: 20× and 63×), and TEM (scale bars: 2 µm; magnification: 6000×). (F) Serum TG levels. (G) Serum TC levels. (H) Serum ALT levels. (I) Serum AST levels. (J–M) The mRNA levels of liver tissues were examined by RT-qPCR. Data represent mean ± SD; # p < 0.05, ## p < 0.01, and ### p < 0.001 versus the control group; * p < 0.05, ** p < 0.01, and *** p < 0.001 versus the model group.
Additionally, several indices related to systemic lipid metabolism and liver function were detected. Compared to the control group, serum levels of TG, TC, ALT, and AST were prominently elevated in the model group (Figure 3F–I). Administration of Res and RM significantly reduced both TG and TC levels, but the effect of Met on improving TC was not as good as that of TG (Figure 3F,G). Meanwhile, although Met (205 and 410 mg/kg) and RM clearly led to decreased ALT and AST levels, these reductions were not as significant as those observed with Res (Figure 3H,I).
Moreover, the results of RT-qPCR revealed that the expression of Acad1 and Cpt1a was elevated by more than 1.5-fold vs. control, while the expression of Fasn and Pparg was downregulated following treatment with Met, Res, and RM (Figure 3J–M). These findings suggest that these medications remedy liver lipid metabolism disorders in db/db mice. Collectively, RM supplementation obviously mitigated lipid metabolism disorders and liver function deterioration in MASH mice.
3.4. Combination Therapies Improved Inflammation and Liver Fibrosis in db/db Mice
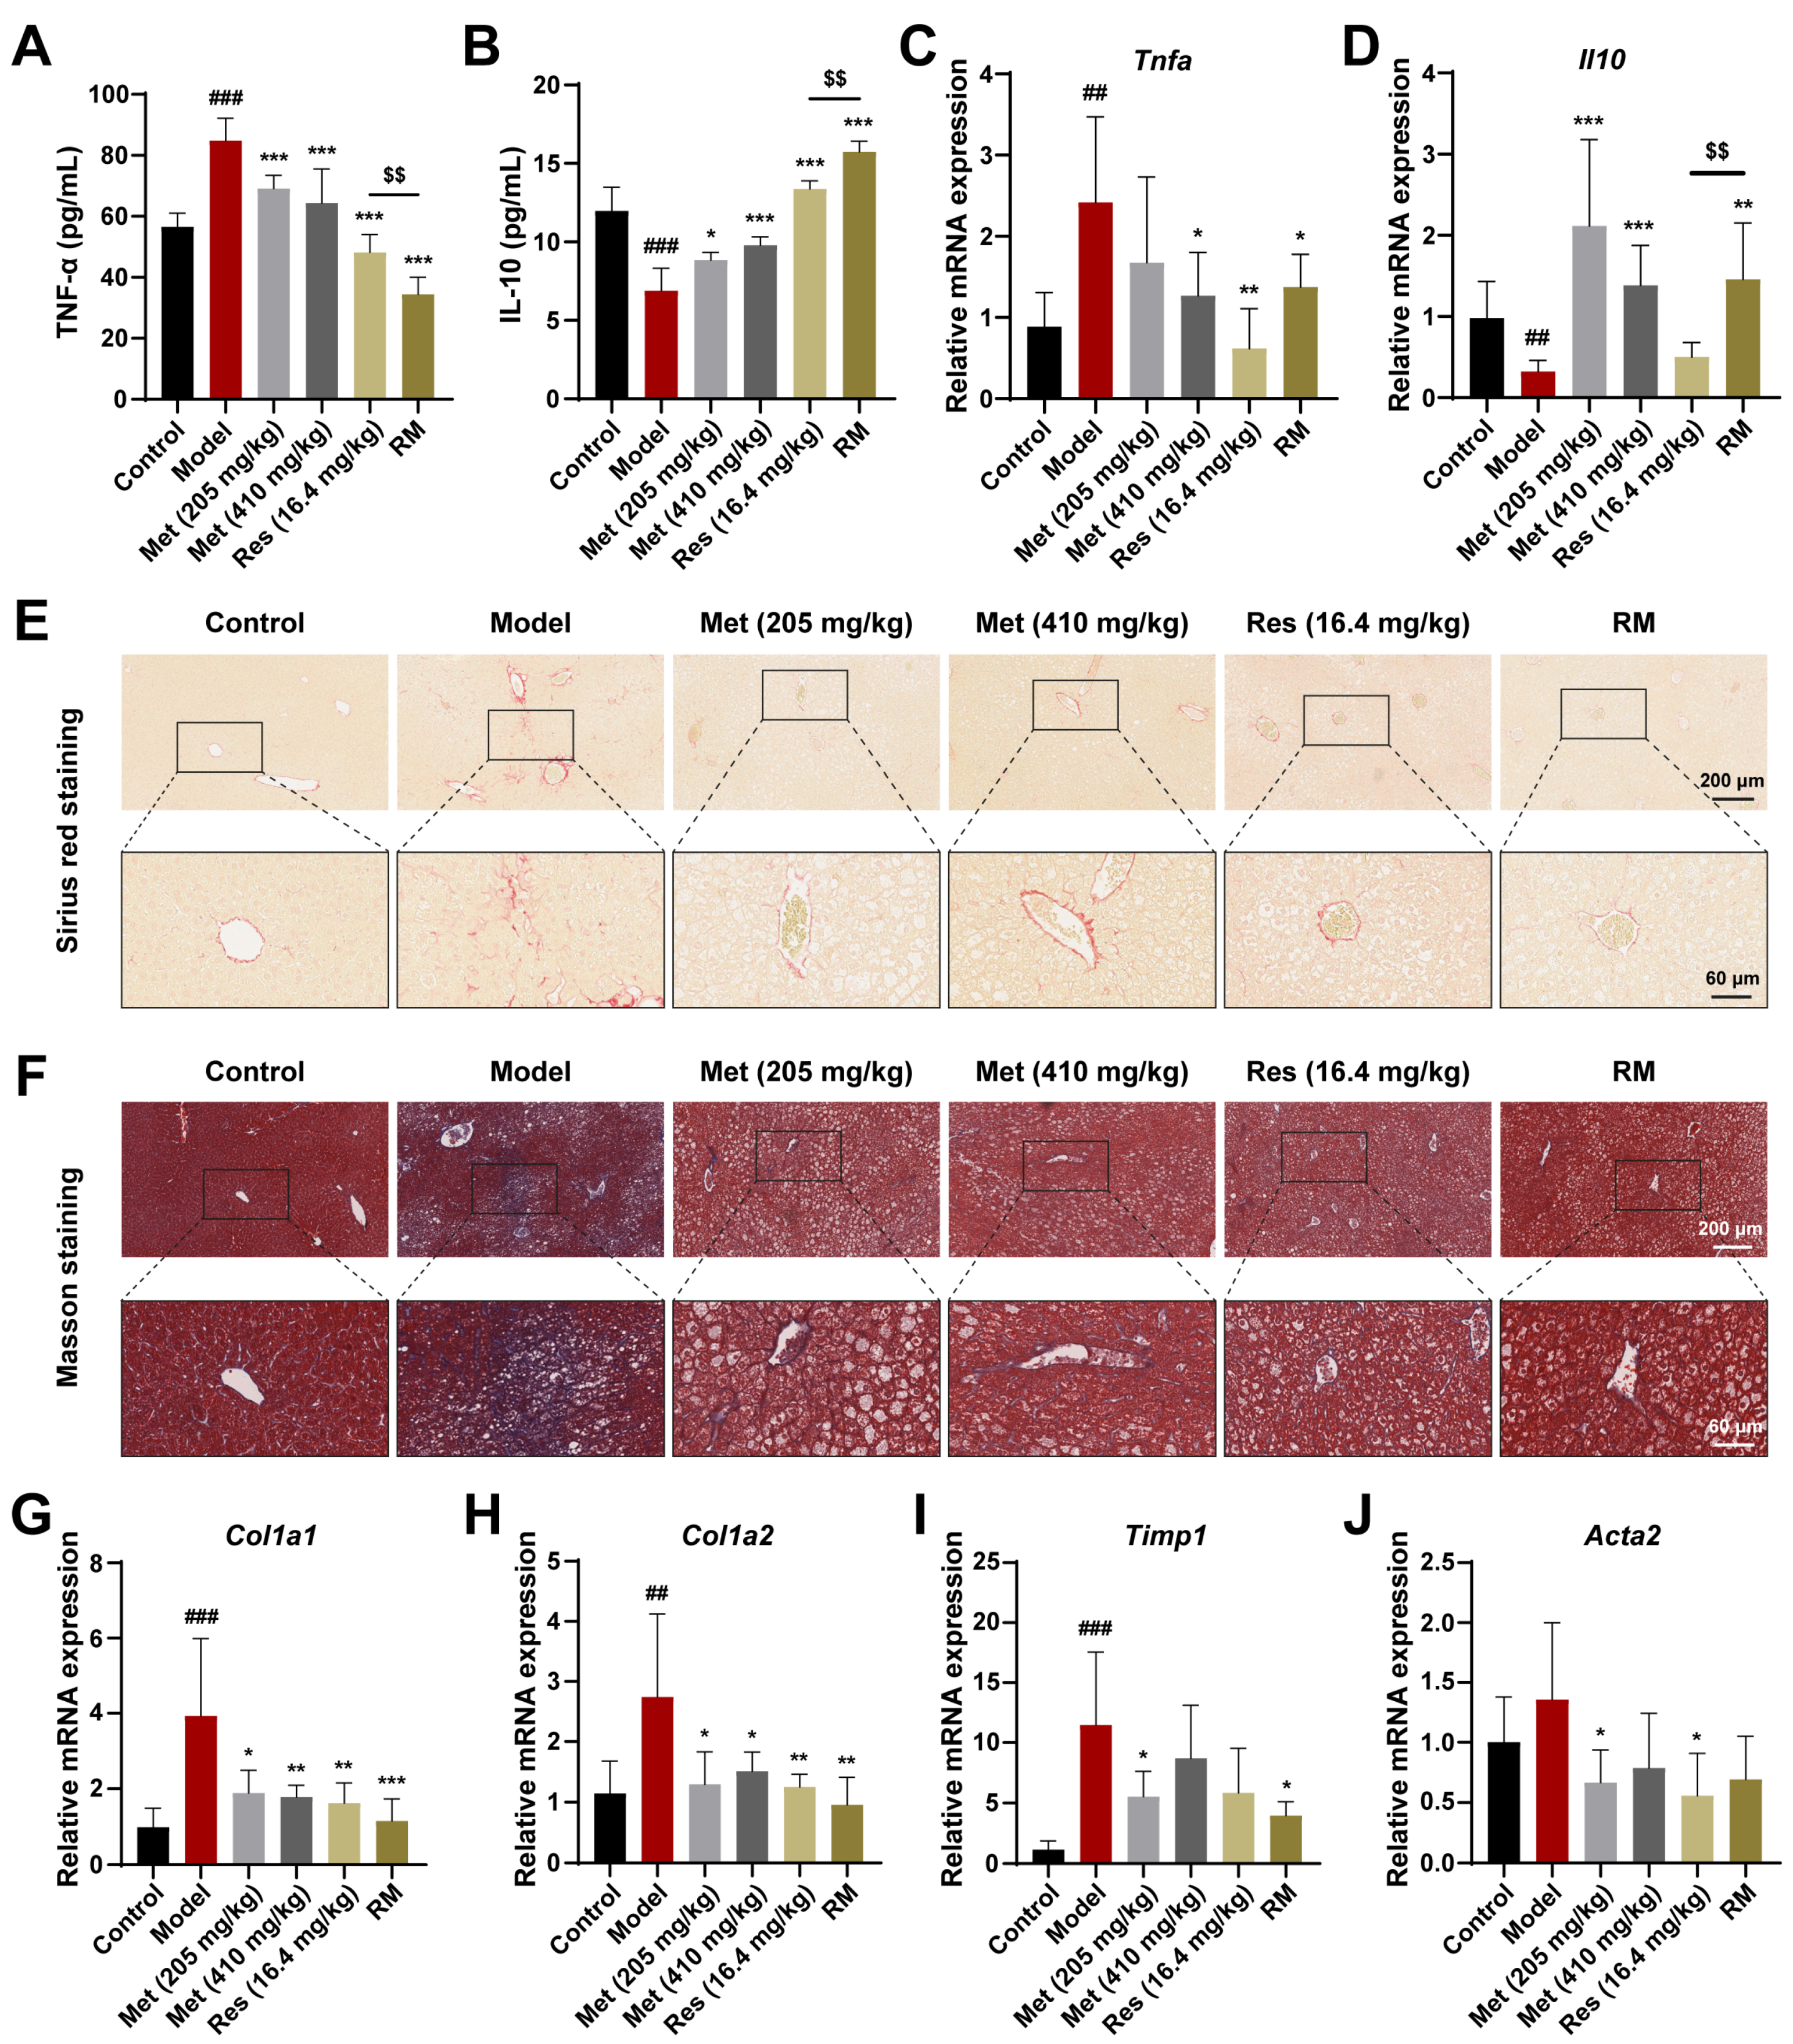
To further confirm whether Met, Res, and RM could attenuate inflammation in vivo, we detected serum inflammatory factors using ELISA kits. In the model mice, TNF-α levels were significantly increased, while IL-10 levels were significantly decreased; however, these changes were reversed in all four treatment groups (Figure 4A,B). Interestingly, Met blunted the inflammation response in a dose-dependent manner, and RM was more effective than Res in this regard (Figure 4A,B). Meanwhile, the mRNA levels of TNF-α and IL-10 in liver tissues mirrored the ELISA data (Figure 4C,D).

Figure 4.
Met, Res, and RM improved inflammation and liver fibrosis in db/db mice (n = 6/group). (A) Serum TNF-α levels by ELISA. (B) Serum IL-10 levels by ELISA. (C,D) The mRNA levels of liver tissues were examined by RT-qPCR. (E,F) Representative images of Sirius red staining (scale bars: 200 µm and 60 µm; magnification: 20× and 63×) and Masson staining (scale bars: 200 µm and 60 µm; magnification: 20× and 63×). (G–J) The mRNA levels of liver tissues were examined by RT-qPCR. Data represent mean ± SD; ## p < 0.01, ### p < 0.001 versus the control group; * p < 0.05, ** p < 0.01, and *** p < 0.001 versus the model group; $$ p < 0.01 versus Res (16.4 mg/kg) group.
Next, to investigate the fibrotic changes in MASH progression, we performed Sirius red and Masson staining on liver tissues from db/db mice receiving or not receiving drug treatment. The results unveiled that the fibrosis was aggravated in the model mice, but this phenomenon was improved by Met, Res, and RM treatments (Figure 4E,F). Similarly, the mRNA levels of profibrotic markers (collagen type I alpha 1 (Col1a1), collagen type I alpha 2 (Col1a2), tissue inhibitor of metal protease 1 (Timp1), and alpha actin 2 (Acta2)) were obviously restored in the livers of db/db mice after administrating Met, Res, and RM (Figure 4G–J). Intriguingly, RM was as effective as Res and high-dose Met (410 mg/kg) in ameliorating liver fibrosis (Figure 4G–J). These data reveal that RM notably inhibits both inflammation and hepatic fibrosis in the MASH model. Importantly, RM was more effective in reducing inflammation than either Res or high-dose Met alone.
3.5. Resmetirom and Metformin Extensively Regulated the Expression of Genes and Multiple Metabolism Processes in the Liver
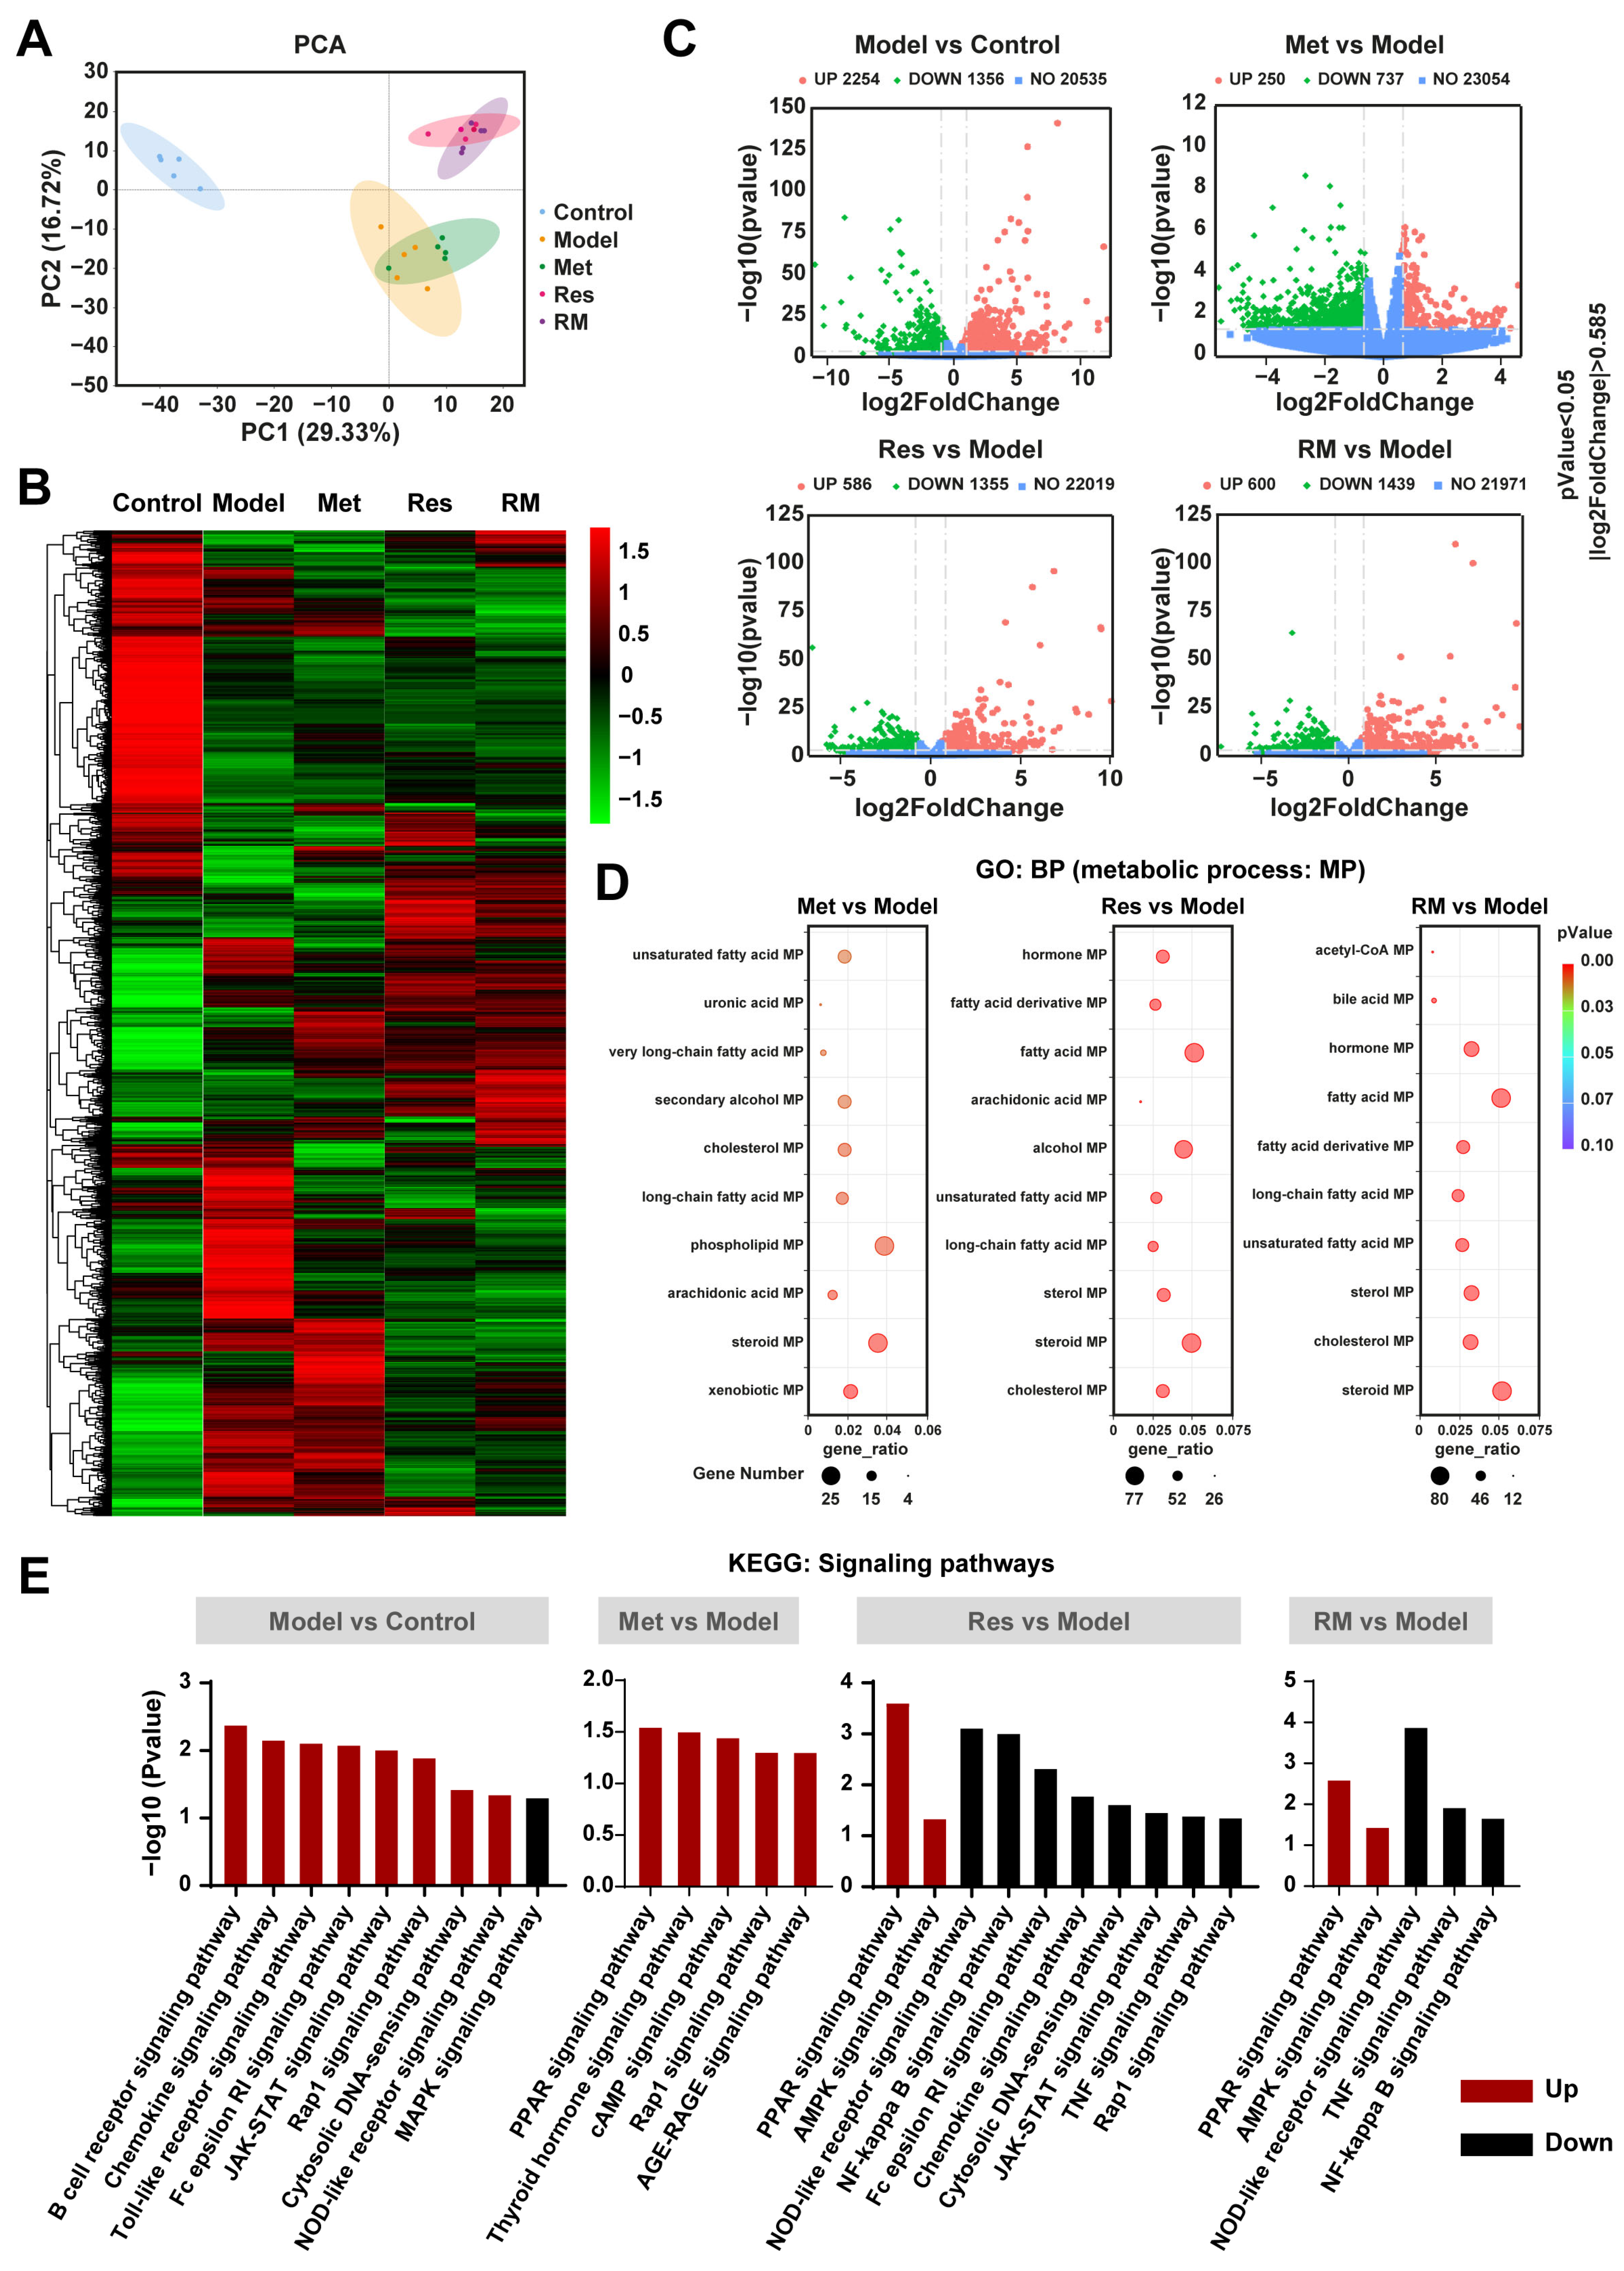
To further study the underlying molecular mechanisms of RM in relieving MASH, we performed RNA-sequencing analysis. The principal components analysis (PCA) plot revealed a clear separation between the model group and the control group, with the three treatment groups also distinctly separated from the model group (Figure 5A). Notably, the RM and Res groups exhibited no separation, indicating their similar molecular profiles (Figure 5A). This observation was further corroborated by the heatmap analysis, which showed highly similar gene expression profiles between the RM and Res groups (Figure 5B). Met, Res, and RM treatment significantly changed the gene expression profile in the liver of db/db mice, with a substantial number of differentially expressed genes (DEGs) undergoing both upregulation and downregulation (Figure 5C). Gene ontology (GO) enrichment analysis identified multiple biological processes (BP) that were related to lipid metabolic processes (MP), such as sterol MP, steroid MP, and cholesterol MP (Figure 5D). Subsequently, we conducted a Kyoto Encyclopedia of Genes and Genomes (KEGG) enrichment analysis. The data of signaling pathway enrichment indicated that several inflammation-related pathways were upregulated in the model mice compared to the control mice, while the MAPK signaling pathway was downregulated. Met was found to activate PPAR, thyroid hormone, cAMP, Rap1, and AGE-RAGE signaling pathways. Importantly, both Res and RM not only upregulated PPAR and AMPK signaling pathways but also downregulated NOD-like receptor, TNF, and NF-kappa B signaling pathways (Figure 5E). These findings imply that RM may attenuate MASH through mechanisms similar to those of Res, and all three administration methods remarkably modulate lipid metabolism processes.

Figure 5.
RM improved MASH in a similar way to Res based on transcriptomics analysis of mice liver tissue samples (n = 5/group). (A) PCA analysis of the control group, model group, Met group (410 mg/kg), Res group, and RM group. (B) Heatmap of RNA-sequencing among these five groups. (C) Volcano plots of upregulated and downregulated DEGs between two groups (p < 0.05 and |log2FoldChange| > 0.585). (D) Bubble diagrams of GO enrichment between two groups. (E) KEGG analysis of DEGs between two groups.
3.6. Met, Res, and RM Extensively Changed the Lipid Profile in the Liver
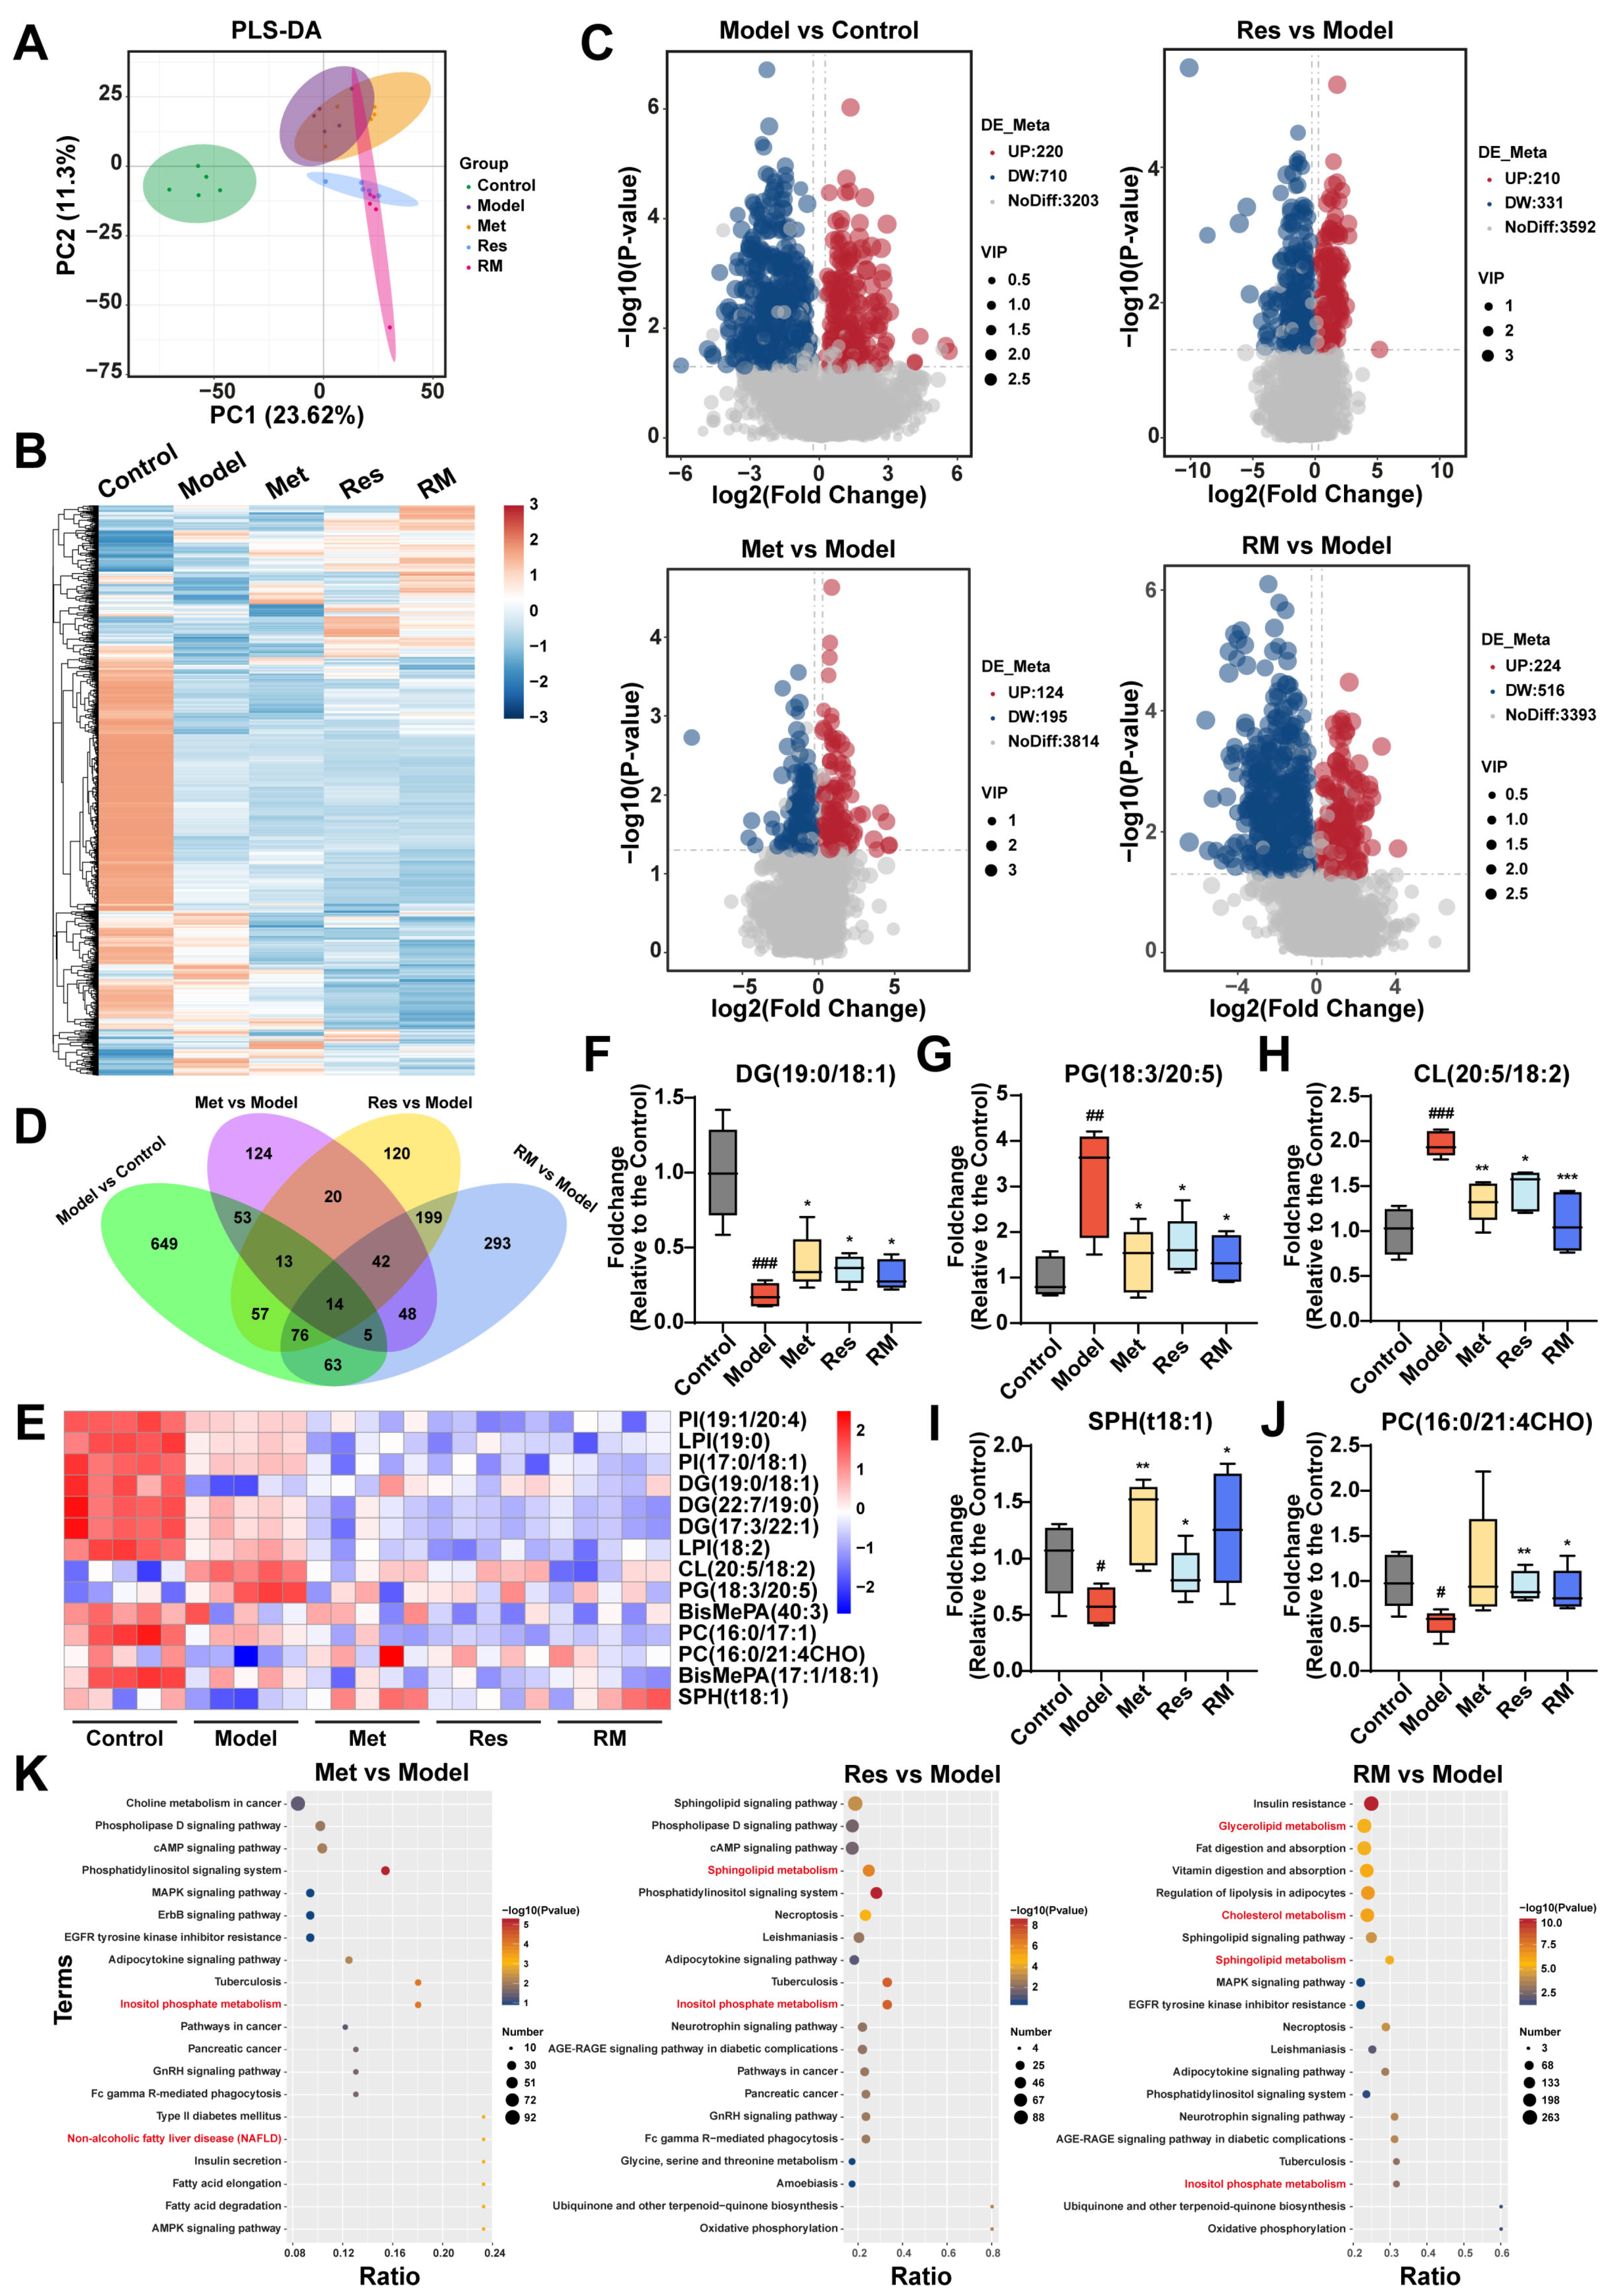
To further explore the impact of Met, Res, and RM on lipid metabolism in MASH, we conducted a lipidomic analysis to examine the hepatic lipid profile transformations among control, model, Met (410 mg/kg), Res, and RM groups. Partial least squares discrimination analysis (PLS-DA) was employed to provide an overview of the separation degree among these five groups, suggesting distinct alterations in liver lipids between C57BL/6 mice and db/db mice (Figure 6A). Interestingly, the RM group showed a distant relationship with the model group but closer proximity to the Res group, consistent with the findings from transcriptomic analysis (Figure 5A and Figure 6A). Heatmap and volcano plots of differentially altered lipids (DALs) further demonstrated that the hepatic lipid profiles were significantly disrupted in db/db mice, while Met, Res, and RM treatments effectively adjusted the dysregulation of lipid metabolism (Figure 6B,C). By comparing DALs between the groups, 14 common DALs were screened from the control, model, and administration groups (Figure 6D). A heatmap was generated to illustrate the expression levels of these 14 DALs among the five groups (Figure 6E). Compared to control mice, the model mice exhibited significantly decreased levels of diradylglycerols (DG) (19:0/18:1), sphingoid bases (SPH) (t18:1), and glycerophosphocholines (PC) (16:0/21:4CHO) in their livers. Conversely, the levels of glycerophosphoglycerols (PG) (18:3/20:5) and glycerophosphoglycerophosphoglycerols (CL) (20:5/18:2) were notably increased in the model group. However, treatment with Met, Res, and RM markedly restored the levels of these lipids (Figure 6F–J).

Figure 6.
Met, Res, and RM improved liver lipid profiles of db/db mice (n = 5/group). (A) PLS-DA plot of the control group, model group, Met group (410 mg/kg), Res group, and RM group. (B) Heatmap of DALs among these five groups. (C) Volcano plots of upregulated and downregulated DALs between two groups (p < 0.05 and |log2FoldChange| > 0.263). (D) Venn plot of common DALs among four compare pairs. (E) Heatmap of 14 common DALs selected from four compare pairs. (F–J) Fold changes of five representative DALs selected from 14 common DALs. (K) KEGG analysis of DALs between two groups. Data represent mean ± SD; # p < 0.05, ## p < 0.01, and ### p < 0.001 versus the control group; * p < 0.05, ** p < 0.01, and *** p < 0.001 versus the model group.
Thereafter, KEGG analysis was further performed, as depicted in Figure 6K. DALs in Met, Res, and RM groups compared to the model were significantly enriched in terms related to lipid metabolism, such as inositol phosphate metabolism, sphingolipid metabolism, cholesterol metabolism, and glycerolipid metabolism (Figure 6K). These observations collectively suggest that Met, Res, and RM effectively modulate the intrahepatic lipid profiles in db/db mice, thereby potentially ameliorating lipid metabolic disturbances associated with MASH.
3.7. Comprehensive Analysis of Transcriptomics and Lipidomics in db/db Mice Treated with RM
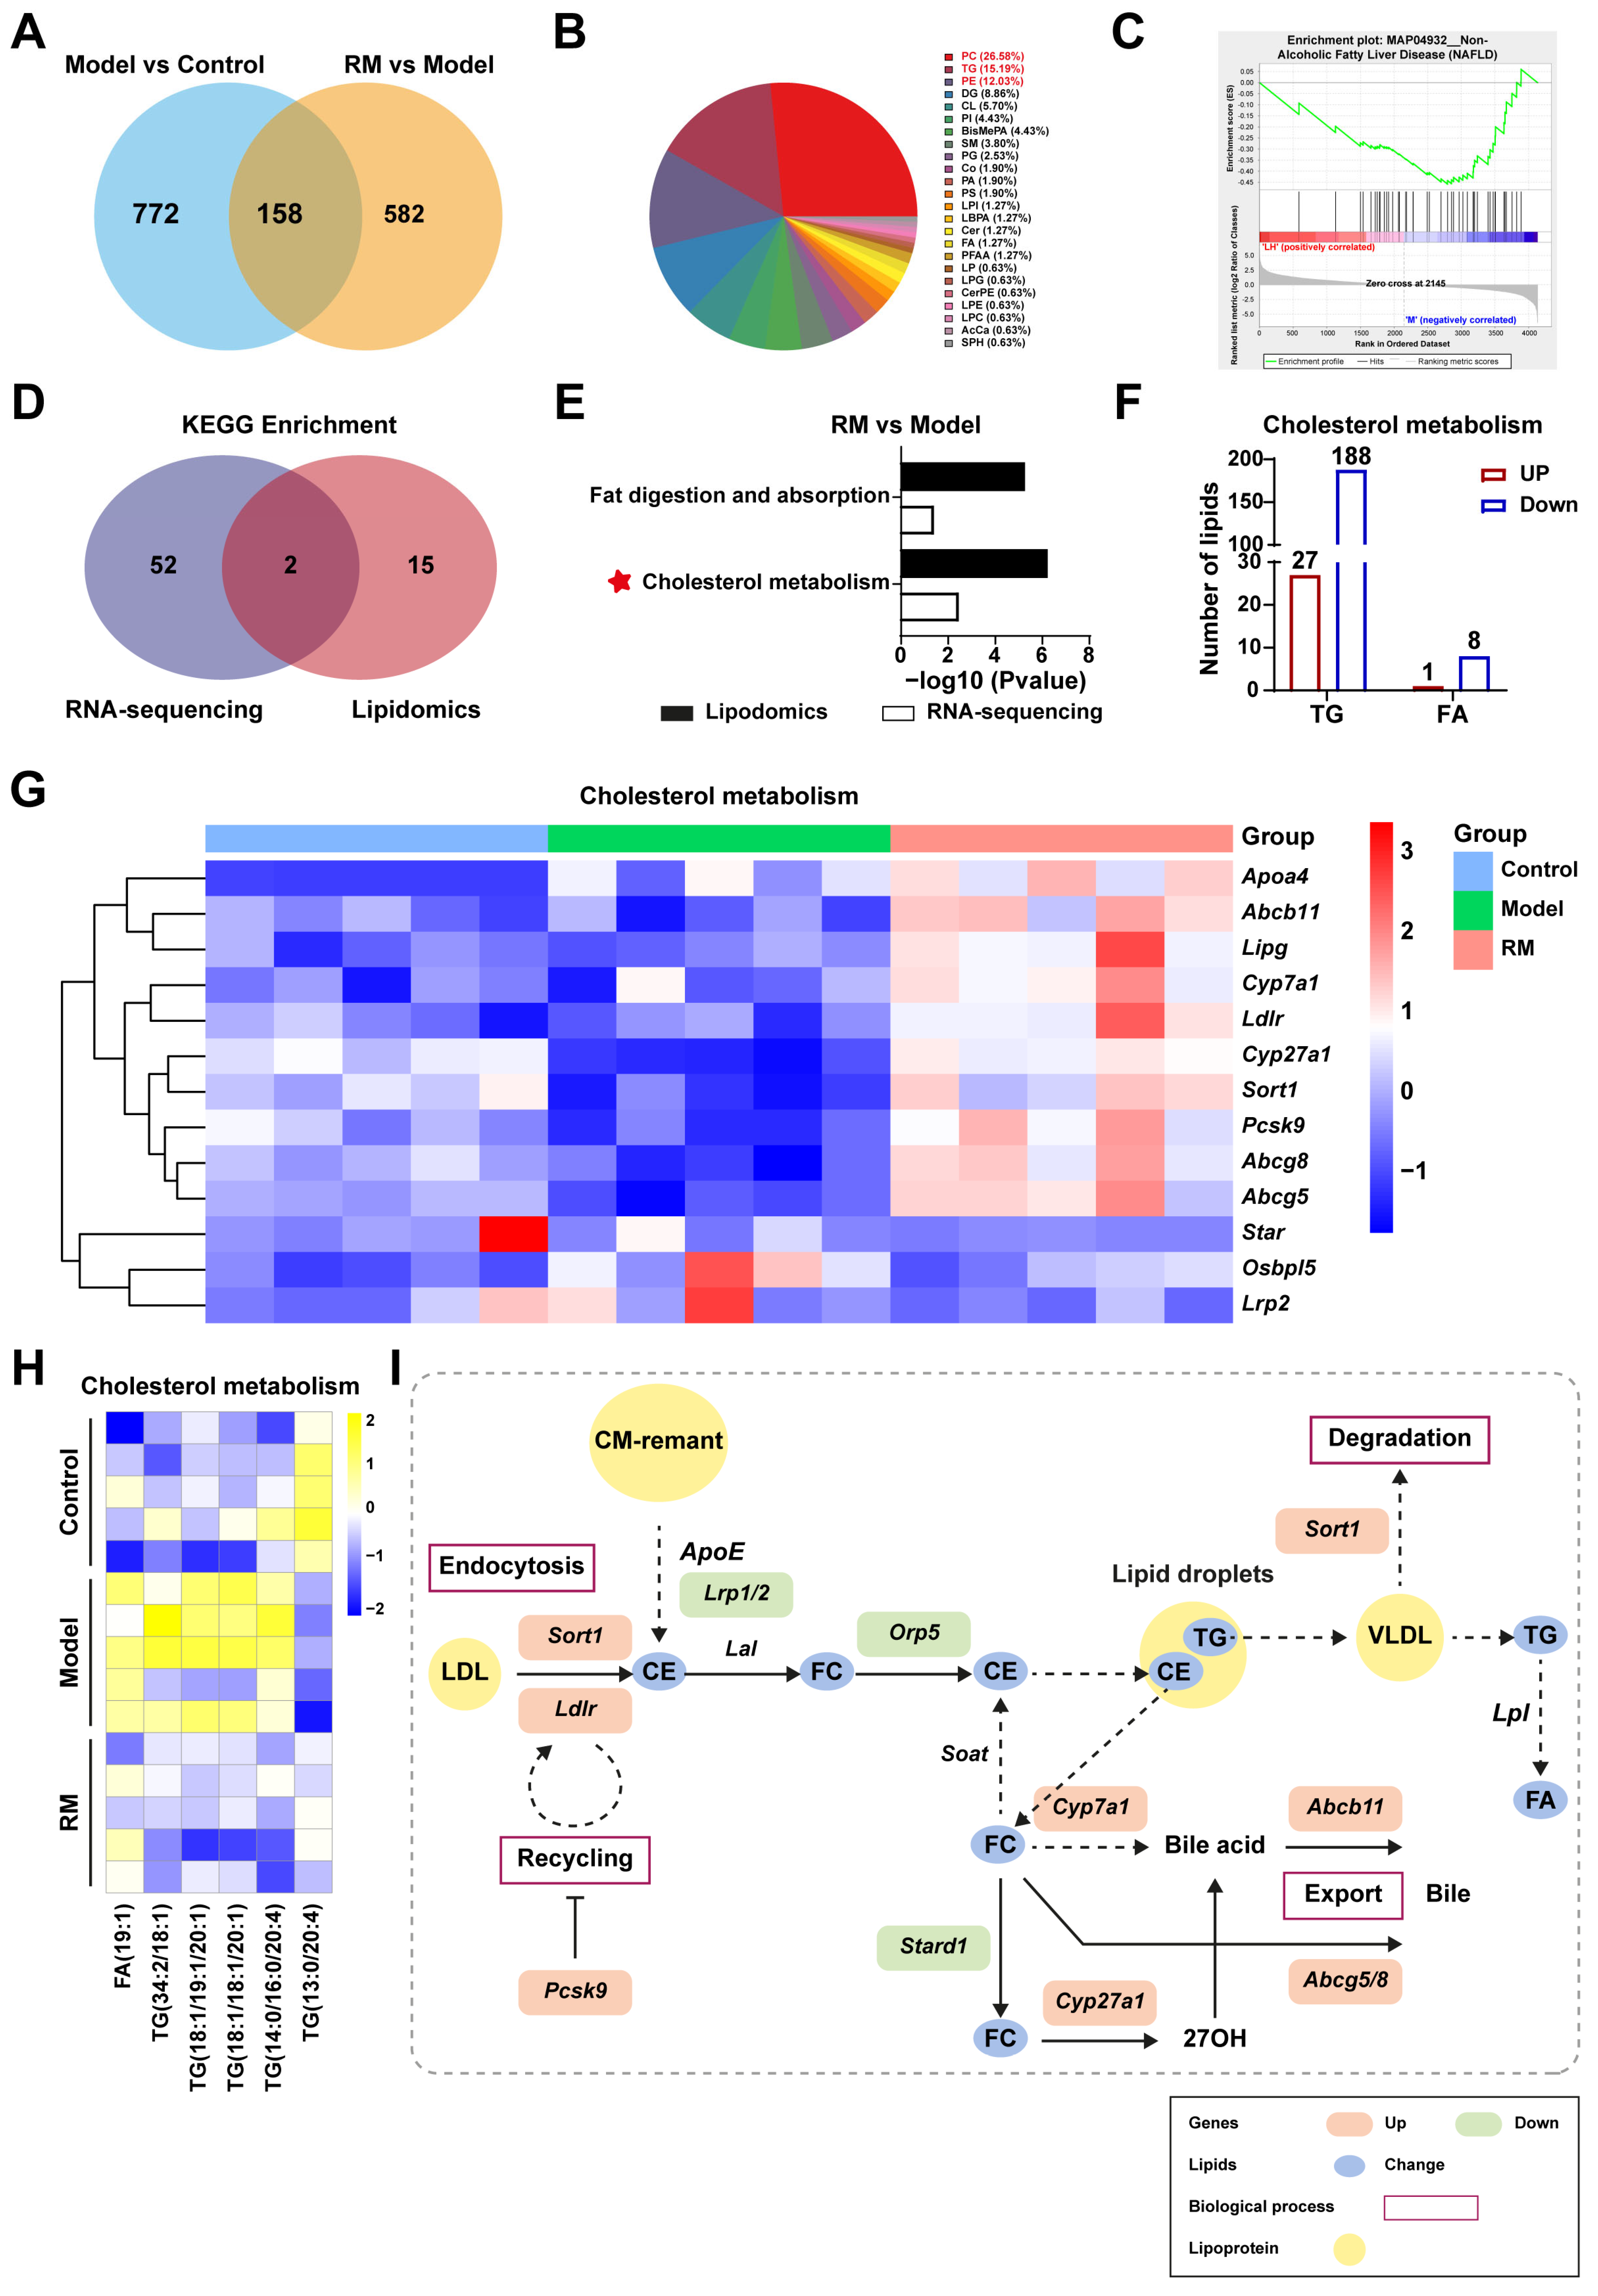
To further explore the specific mechanism of RM improving lipid metabolism in db/db mice, we conducted conjoint analysis of transcriptomics and lipidomics. RM treatment restored the levels of 158 DALs, as shown in Figure 7A. These DALs were further categorized into 24 distinct lipid classes and mainly concentrated in PC (26.58%), TG (15.19%), and glycerophosphoethanolamines (PE) (12.03%) (Figure 7B). Gene set enrichment analysis (GSEA) revealed that the downregulated lipids associated with NAFLD (KEGG entry: MAP04932) were significantly enriched in the RM group with an NES value of -1.579 and a p-value of 0.013 (Figure 7C). These results indicated that RM could impede MASH aggravation by modulating lipid homeostasis.

Figure 7.
Comprehensive analysis of the transcriptomics and lipidomics in MASH mice treated with RM (n = 5/group). (A) Venn plot of common DALs among the control, model, and RM groups. (B) Pie chart of 158 common DALs selected from two compare pairs based on their lipid classes. (C) GSEA plot for KEGG entry: NAFLD based on DALs in the RM group vs. the model group. (D) Venn plot of the number of KEGG pathways among the control, model, and RM groups. (E) Bar plot of KEGG pathways among the control, model, and RM groups. (F) The number and type of DALs in the cholesterol metabolism pathway between the RM group and the model group. (G) Heatmap of gene expression profile related to cholesterol metabolism among the control, model, and RM groups. (H) Heatmap of six representative DALs selected from DALs related to cholesterol metabolism. (I) The biological process of cholesterol metabolism. The orange and green rectangles represented upregulated and downregulated genes after RM treatment, respectively. The blue dots represented altered lipids upon RM treatment. The yellow dots represented lipoproteins.
Next, we identified the overlapping pathways between the RM group and the model group through an integrated analysis of RNA sequencing and lipidomics, as illustrated in Figure 7D. RM was found to significantly impact pathways of fat digestion and absorption and cholesterol metabolism (Figure 7E). Dysregulation of cholesterol metabolism is a critical factor in MASH progression. Our data showed that RM increased the levels of 27 TGs and 1 FA, while decreasing the levels of 188 TGs and 8 FAs associated with cholesterol metabolism (Figure 7F). Disordered lipid levels were significantly corrected by RM (Figure 7H). Meanwhile, a heatmap was provided to better observe the changes of DEGs involved in cholesterol metabolic pathways (Figure 7G). Several key genes in lipoprotein uptake, cholesterol transformation, and bile excretion were displayed in Figure 7G, such as Ldlr, Cyp7a1, Cyp27a1, Abcb11, and Abcg5/8. Finally, an outline map was provided to intuitively illustrate the relationship between screened DALs and DEGs, which were significantly enriched in the livers of MASH mice after RM treatment (Figure 7I). Along with these findings, we refined the scope of our study to focus solely on cholesterol metabolism for subsequent validation.
3.8. RM Ameliorated MASH by Promoting Cholesterol Metabolism in the Fatty Liver of db/db Mice
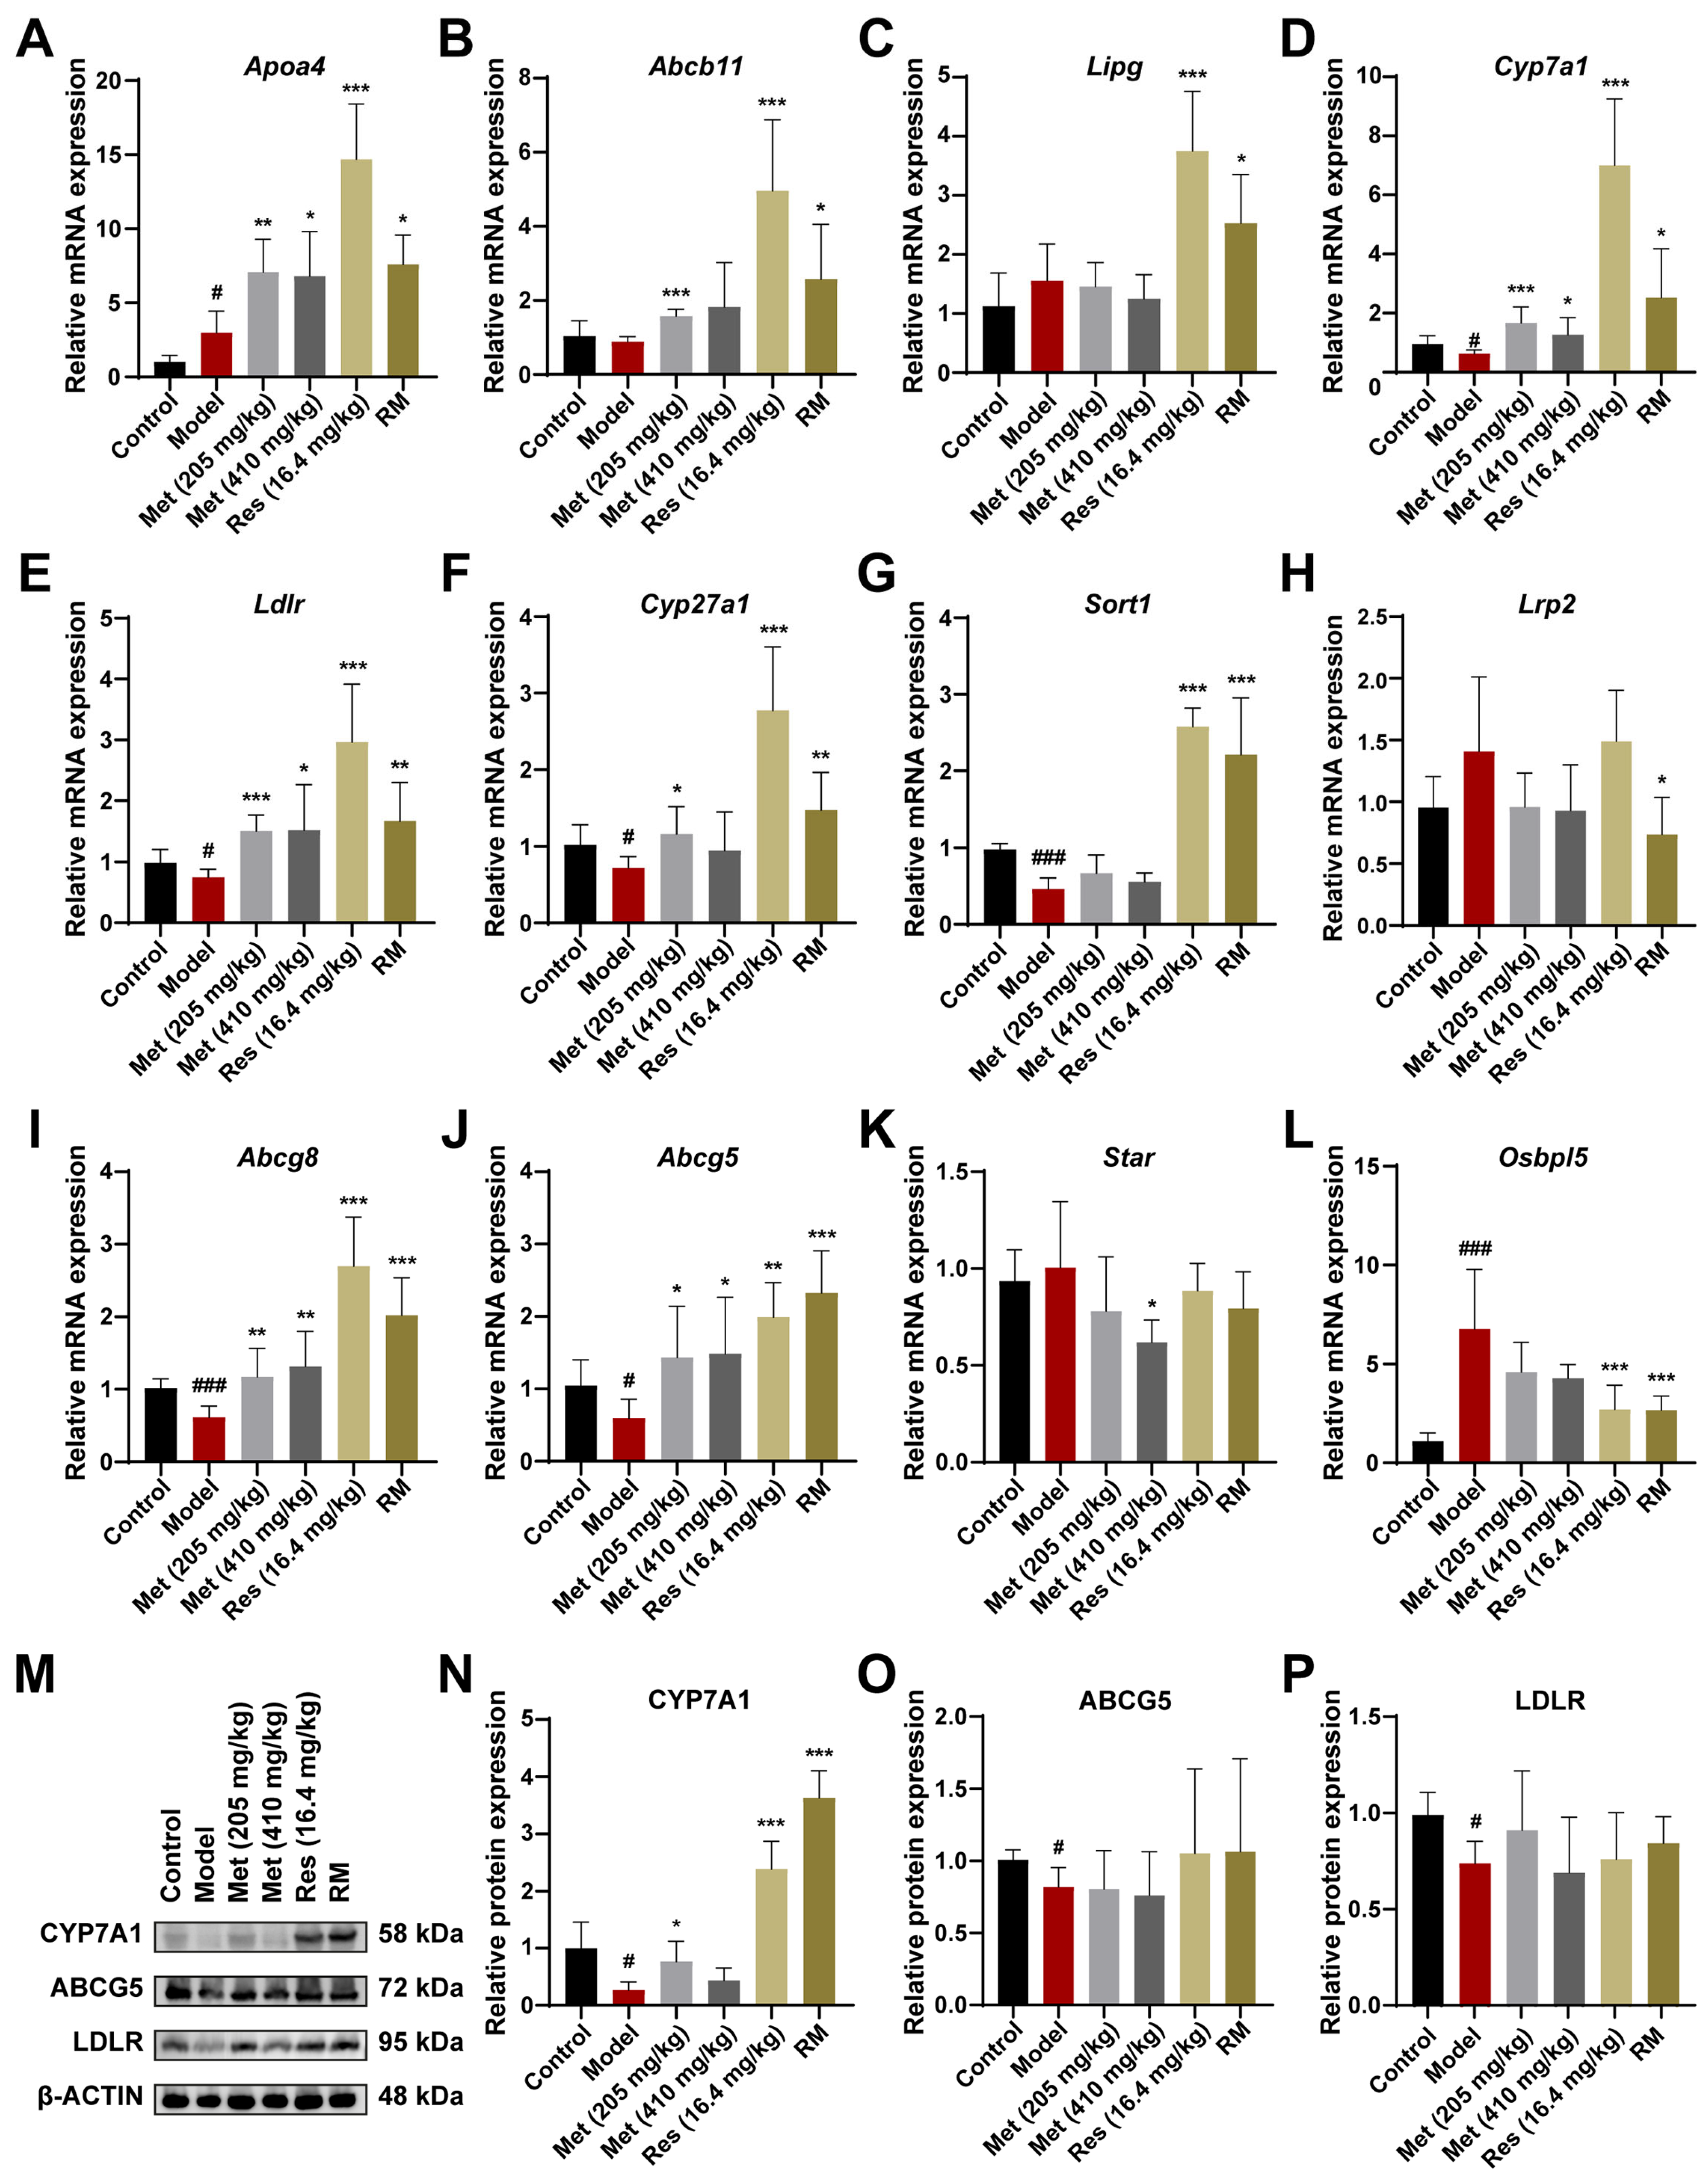
We further confirmed and compared the regulative roles of RM, Met, and Res in cholesterol metabolism at both the mRNA and protein levels. The expression patterns of the essential genes associated with cholesterol metabolism were consistent with the transcriptome data, which reinforced the reliability of our hypotheses (Figure 8A–L). Additionally, the levels of key enzymes in cholesterol metabolism were validated through Western blot experiments. The expression of CYP7A1, LDLR, and ABCG5 was significantly downregulated in the livers of model mice, suggesting that the biological processes of cholesterol clearance from plasma, cholesterol conversion to bile acids, and bile acid excretion in the liver were inhibited (Figure 8M–P). Intriguingly, CYP7A1 is a primary rate-limiting enzyme that catalyzes the transformation of cholesterol into bile acids [26]. Both Res and RM drastically promoted the expression of CYP7A1, with a stronger effect than Met, implying that CYP7A1 may be the potential target of Res (Figure 8M,N). These findings provide evidence that RM exerts its therapeutic effect on MASH through the activation of the cholesterol metabolism pathway.
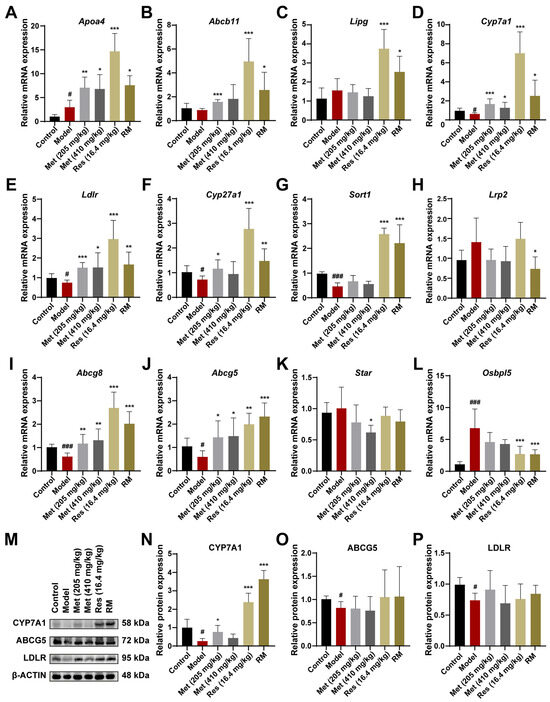
Figure 8.
RM upregulates the cholesterol metabolism pathway by synergistically promoting the expression of CYP7A1 to prevent MASH. (A–L) The mRNA levels of DEGs enriched in the cholesterol metabolism pathway in mice liver were measured by RT-qPCR (n = 6). (M–P) The expression levels of CYP7A1, ABCG5, and LDLR in mice liver tissues were detected by Western blot experiment with β-ACTIN as the internal reference (n = 4). Data represent mean ± SD; # p < 0.05, ### p < 0.001 versus the control group; * p < 0.05, ** p < 0.01, and *** p < 0.001 versus the model group.
4. Discussion
The incidence of MASLD continues to rise, and in its advanced stage, MASH is an important cause of cirrhosis and HCC, which seriously threatens human health [5]. However, currently approved treatments for MASH are limited, highlighting the urgent need to identify novel therapies. In this study, we established MASLD cell models by treating HepG2 and AML12 cells with FFA and used db/db mice as an animal model to evaluate the effects of Met, Res, and RM on MASH. Our results showed that all administration methods reduced lipid accumulation and alleviated lipid metabolism disorders in vitro. Meanwhile, lowered blood lipid levels, less liver lipid accumulation, inhibited inflammatory response, and improved liver function were observed in db/db mice after medication. Notably, through the comprehensive analysis of transcriptomics and lipidomics, we proved that the combination of half-dose Met and Res more effectively ameliorated inflammation and promoted cholesterol metabolism compared to Res alone.
Res, a selective THR-β agonist, has been approved for the treatment of non-cirrhotic MASH patients with moderate to advanced fibrosis [27]. It has been proven to effectively attenuate liver steatosis, inflammation, and fibrosis [28]. Additionally, Met has also been reported to improve liver steatosis in metabolic diseases through substantial preclinical studies [29,30,31]. However, the high cost of Res and the potential side effects of long-term high-dose medication still cannot be ignored. In the USA, Res treatment increased the cost by USD 66,764 per patient while increasing quality-adjusted life-years (QALYs) by 1.24 [32]. Therefore, combining halved doses of Res and Met may represent a novel therapeutic strategy, offering a lower economic burden for patients. Our results indicate that RM, Met (410 mg/kg), and Res exhibit comparable efficacy in MASH treatment.
HepG2 and AML12 cells, derived from human and mouse sources, respectively, are commonly used as cell models for MASLD [33,34]. In our experiments, FFA treatment significantly promoted the expression of lipid synthesis genes while inhibiting the expression of lipid catabolism genes. This led to increased levels of TG and TC, as well as enhanced lipid accumulation, findings that are consistent with previous reports [33,34,35]. These changes were significantly mitigated by treatment with RM, Met (40 μM), and Res. Other than in vitro observations, in vivo data showed that RM, Met (410 mg/kg), and Res notably alleviated balloon-like changes, lipid accumulation, inflammation, and fibrosis in the liver tissue of db/db mice. Concurrently, the levels of serum TG, TC, AST, and ALT were decreased, suggesting improvements in blood lipid profiles and liver function.
Furthermore, RNA sequencing was employed to unveil the potential mechanisms of RM, Met (410 mg/kg), and Res in MASH treatment. GO enrichment analysis revealed that multiple lipid metabolism processes were significantly altered in the treated groups, including sterol, steroid, long-chain fatty acid, and cholesterol metabolism. These findings were further corroborated by our lipidomic results. After supplementing with these three drugs, the lipid profile in the liver tissues of mice was markedly altered. Specifically, the levels of DG (19:0/18:1), SPH (t18:1), and PC (16:0/21:4CHO) were significantly increased, while the levels of PG (18:3/20:5) and CL (20:5/18:2) were notably decreased. DG (19:0/18:1) belongs to glyceride, which is involved in the last step of TG synthesis catalyzed by diacylglycerol acyltransferase 2 [36]. The medication increases DG content in liver tissues in this study, possibly caused by the inhibition of TG synthesis. PC (16:0/21:4CHO) is a phosphatidylcholine that reduces fat accumulation in the liver by promoting fat decomposition and transport, which helps to improve liver function and reduce liver damage [37]. The increase in PG (18:3/20:5) levels is typically associated with an imbalance between TG synthesis and excretion during the progression of MASLD. In line with our findings, Luukkonen et al. revealed that the mitochondrial amidoxime-reducing component 1 variant increases hepatic PCs and decreases the severity of MASLD in humans [38]. Collectively, these data demonstrate that RM, Met, and Res improve lipid metabolism during the development of MASH.
Notably, we studied the specific mechanisms by which RM modulates lipid metabolism. An integrated analysis of lipidomics and transcriptomics revealed that RM significantly affected cholesterol metabolism, fat digestion, and absorption. A plethora of evidence shows that cholesterol metabolism disorders deteriorate MASH [39,40,41]. The disorder of cholesterol metabolism in hepatocytes of MASLD mainly includes the activation of the cholesterol biosynthesis pathway and the inhibition of cholesterol export and bile acid synthesis [26]. LDLR is a crucial protein in the hepatocyte cholesterol metabolism pathway, mediating the endocytosis of LDL to maintain plasma LDL levels [42]. Cholesterol is converted into bile acids in the liver primarily through the actions of CYP7A1 and CYP27A1 [26]. Subsequently, bile acids are secreted from hepatocytes into the bile ducts, primarily via ABCG5/ABCG8, to complete the excretion process [43]. Our findings suggested that RM robustly upregulated the mRNA levels of LDLR, CYP7A1, CYP27A1, and ABCG5/8 in a manner similar to Res. Importantly, Res exhibited the most pronounced effect on CYP7A1 expression among all treatment groups. This implies that the combination of low-dose Res and Met enhances cholesterol metabolism by promoting the conversion of cholesterol to bile acids, potentially driven by the half-dose of Res.
During the progression of MASLD, excessive lipid accumulation in the liver leads to lipotoxicity in hepatocytes, triggering oxidative stress and cellular damage [44]. In response, hepatocytes secrete chemokines that recruit mononuclear-derived macrophages and activate Kupffer cells, further exacerbating liver inflammation and injury [45]. Notably, RM demonstrated superior efficacy compared to Met and Res alone in inhibiting the inflammatory response, as evidenced by ELISA and RT-qPCR results. In particular, RM significantly improved the levels of IL-10 in both circulation and liver tissues. Transcriptome analysis further provided evidence that the NOD-like receptor signaling pathway and NF-κB signaling pathway were significantly downregulated in the RM group. NOD-like receptors are a class of pattern recognition receptors that regulate the formation of inflammasomes and induce the production of IL-1β and IL-18, thereby participating in the inflammatory response [46]. In MASH, this signaling pathway is activated, driving an inflammatory cascade [47]. Our sequencing data indicated that RM treatment effectively inhibited this pathway. Additionally, recent studies have shown that auranofin reduces NF-κB and IκBα levels to inhibit the NF-κB signaling pathway in vitro [48]. Similarly, Jing et al. confirmed that RG-I pectin-like polysaccharide from Rosa chinensis repressed inflammation and fibrosis by targeting the NF-κB signaling pathway in MASH [49]. Collectively, our data highlight that RM plays a better role in lessening inflammation during MASH progression.
However, our research still has several limitations that require further investigation. While our study revealed that combined administration dramatically promoted the expression of CYP7A1, the underlying mechanisms by which this combination regulates cholesterol metabolism remain unclear. It is yet unknown if the enhanced expression of CYP7A1 is directly connected to the therapeutic effects of the combination treatment on MASH. Additionally, although the combined treatment outperformed Res and Met individually in mitigating inflammation, it remains unknown whether the promotion of cholesterol metabolism is a crucial link in its anti-inflammatory effects. Moreover, our transcriptome data indicated that RM modulates several signaling pathways beyond cholesterol metabolism, yet we have not conducted a comprehensive analysis of these pathways. Furthermore, while we have clarified that the combination of half-dose Met and Res improved MASH, the specific reasons why Met can supplement the pharmacological effects and mechanisms of Res remain to be elucidated. Our future research will focus on addressing these issues.
5. Conclusions
Collectively, our study found that a combination of half-dose resmetirom and metformin significantly ameliorated MASH, which was notably better than the effect of administration alone in improving inflammation. Especially, the underlying mechanism was unmasked by multi-omics combination analysis and subsequent validation. Combination therapy facilitated cholesterol metabolism in a similar way to resmetirom, especially promoting CYP7A1 expression to accelerate cholesterol transformation. Our findings confirm the hypothesis that combination therapy protects against MASH by promoting cholesterol metabolism and inhibiting inflammation, highlighting that combination therapy is a promising therapeutic strategy for MASH patients with lower economic burdens.
Author Contributions
Conceptualization, B.Z. and X.S.; methodology, W.L; software, W.L.; validation, W.L.; formal analysis, W.L.; investigation, F.Y., J.W., N.S., X.C. and Z.D.; data curation, W.L.; writing—original draft preparation, W.L.; writing—review and editing, B.Z.; visualization, W.L.; supervision, B.Z. and X.S.; project administration, B.Z. and X.S.; funding acquisition, B.Z. and X.S. All authors have read and agreed to the published version of the manuscript.
Funding
This research was funded by the CAMS Innovation Fund for Medical Sciences (CIFMS) (grant number 2022-I2M-1-018, 2021-I2M-1-031) and the National Key Research and Development Program of China (grant number 2022YFC3501803).
Institutional Review Board Statement
The study was conducted in accordance with the Ethical Committee on Animal Experimentation of the Chinese Academy of Medical Sciences and Peking Union Medical College (ethical code: SLXD-20240430010).
Informed Consent Statement
Not applicable.
Data Availability Statement
The data of this study are available from the corresponding author upon reasonable request.
Acknowledgments
We would like to appreciate the assistance of the Institute of Food Science and Technology, Chinese Academy of Agricultural Sciences/Electron Microscope Center of Comprehensive Key Laboratory of Agricultural Product Processing, Ministry of Agriculture and Rural Affairs (Beijing, China).
Conflicts of Interest
The authors declare no conflicts of interest.
Abbreviations
The following abbreviations are used in this manuscript:
| MASH | metabolic dysfunction-associated steatohepatitis |
| Res | resmetirom |
| Met | metformin |
| RM | half-dose Res and Met |
| MASLD | metabolic dysfunction-associated steatotic liver disease |
| T2DM | type 2 diabetes mellitus |
| FFA | free fatty acids |
| HCC | hepatocellular carcinoma |
| THR-β | thyroid hormone receptor-beta |
| HMGCR | 3-hydroxy-3-methylglutaryl coenzyme A reductase |
| LDLR | low-density lipoprotein receptor |
| CYP7A1 | cytochrome P450 family 7 subfamily A member 1 |
| CYP27A1 | cytochrome P450 family 27 subfamily A member 1 |
| ABCG5/G8 | ATP-binding cassette subfamily G member 5 or G member 8 |
| TG | triglyceride |
| ACADL | long-chain acyl-coenzyme A dehydrogenase |
| ACOX1 | acyl-coenzyme A oxidase 1 |
| PPARA | proliferator-activated receptor α |
| CPT1A | carnitine palmitoyltransferase 1α |
| SCD1 | stearoyl-CoA desaturase 1 |
| ACC | acetyl-CoA carboxylase |
| FASN | fatty acid synthase |
| CCK8 | cell counting kit-8 |
| PPARG | proliferator-activated receptor γ |
| SREBF1 | sterol regulatory element binding transcription factor 1 |
| H&E | hematoxylin and eosin |
| TEM | transmission electron microscope |
| ALT | alanine aminotransferase |
| AST | aspartate aminotransferase |
| ELISA | enzyme-linked immunosorbent assay |
| TNF-α | tumor necrosis factor-alpha |
| IL | interleukin |
| COL1A1 | collagen type I alpha 1 |
| COL1A2 | collagen type I alpha 2 |
| TIMP1 | tissue inhibitor of metal protease 1 |
| ACTA2 | alpha actin 2 |
| PCA | principal components analysis |
| DEGs | differentially expressed genes |
| GO | gene ontology |
| BP | biological processes |
| MP | metabolic processes |
| KEGG | Kyoto encyclopedia of genes and genomes |
| PLS-DA | partial least squares discrimination analysis |
| DALs | differentially altered lipids |
| DG | diradylglycerols |
| SPH | sphingoid bases |
| PC | glycerophosphocholines |
| PG | glycerophosphoglycerols |
| CL | glycerophosphoglycerophosphoglycerols |
| PE | glycerophosphoethanolamines |
| GSEA | gene set enrichment analysis |
| QALYs | quality-adjusted life-years |
| SDS-PAGE | sodium dodecyl-sulfate polyacrylamide gel |
References
- Feng, G.; Valenti, L.; Wong, V.W.; Fouad, Y.M.; Yilmaz, Y.; Kim, W.; Sebastiani, G.; Younossi, Z.M.; Hernandez-Gea, V.; Zheng, M.H. Recompensation in cirrhosis: Unravelling the evolving natural history of nonalcoholic fatty liver disease. Nat. Rev. Gastroenterol. Hepatol. 2024, 21, 46–56. [Google Scholar] [CrossRef]
- Powell, E.E.; Wong, V.W.; Rinella, M. Non-alcoholic fatty liver disease. Lancet 2021, 397, 2212–2224. [Google Scholar] [CrossRef]
- Kanwal, F.; Neuschwander-Tetri, B.A.; Loomba, R.; Rinella, M.E. Metabolic dysfunction-associated steatotic liver disease: Update and impact of new nomenclature on the American Association for the Study of Liver Diseases practice guidance on nonalcoholic fatty liver disease. Hepatology 2024, 79, 1212–1219. [Google Scholar] [CrossRef]
- Zhao, L.; Westerhoff, M.; Pai, R.K.; Choi, W.T.; Gao, Z.H.; Hart, J. Centrilobular ductular reaction correlates with fibrosis stage and fibrosis progression in non-alcoholic steatohepatitis. Mod. Pathol. 2018, 31, 150–159. [Google Scholar] [CrossRef]
- Li, X.; Ge, J.; Li, Y.; Cai, Y.; Zheng, Q.; Huang, N.; Gu, Y.; Han, Q.; Li, Y.; Sun, R.; et al. Integrative lipidomic and transcriptomic study unravels the therapeutic effects of saikosaponins A and D on non-alcoholic fatty liver disease. Acta Pharm. Sin. B 2021, 11, 3527–3541. [Google Scholar] [CrossRef]
- Younossi, Z.M. Predicting Liver-Related Outcomes in Steatotic Liver Disease. JAMA 2024, 331, 1274–1275. [Google Scholar] [CrossRef]
- Lazarus, J.V.; Ivancovsky Wajcman, D.; Mark, H.E.; Younossi, Z.M.; Kopka, C.J.; Cohen, N.; Bansal, M.B.; Betel, M.; Brennan, P.N. Opportunities and challenges following approval of resmetirom for MASH liver disease. Nat. Med. 2024, 30, 3402–3405. [Google Scholar] [CrossRef]
- Keam, S.J. Resmetirom: First Approval. Drugs 2024, 84, 729–735. [Google Scholar] [CrossRef]
- Vidal-Cevallos, P.; Chávez-Tapia, N. Resmetirom, the long-awaited first treatment for metabolic dysfunction-associated steatohepatitis and liver fibrosis? Med 2024, 5, 375–376. [Google Scholar] [CrossRef]
- Fishman, J.; Kim, Y.; Parisé, H.; Bercaw, E.; Smith, Z. Budget impact of resmetirom for the treatment of adults with non-cirrhotic non-alcoholic steatohepatitis (NASH) with moderate to advanced liver fibrosis (consistent with stages F2 to F3 fibrosis). J. Med. Econ. 2024, 27, 1108–1118. [Google Scholar] [CrossRef]
- Harrison, S.A.; Bedossa, P.; Guy, C.D.; Schattenberg, J.M.; Loomba, R.; Taub, R.; Labriola, D.; Moussa, S.E.; Neff, G.W.; Rinella, M.E.; et al. A Phase 3, Randomized, Controlled Trial of Resmetirom in NASH with Liver Fibrosis. N. Engl. J. Med. 2024, 390, 497–509. [Google Scholar] [CrossRef]
- Liu, Y.; Zhao, X.; Wang, X.; Zhou, Q. Adverse events of hepatic anti-fibrotic agents in phase 3 and above clinical trials: A descriptive analysis of the WHO-VigiAccess database. Front. Pharmacol. 2025, 16, 1534628. [Google Scholar] [CrossRef]
- Kramer, J.R.; Natarajan, Y.; Dai, J.; Yu, X.; Li, L.; El-Serag, H.B.; Kanwal, F. Effect of diabetes medications and glycemic control on risk of hepatocellular cancer in patients with nonalcoholic fatty liver disease. Hepatology 2022, 75, 1420–1428. [Google Scholar] [CrossRef]
- Blazina, I.; Selph, S. Diabetes drugs for nonalcoholic fatty liver disease: A systematic review. Syst. Rev. 2019, 8, 295. [Google Scholar] [CrossRef]
- Targher, G.; Corey, K.E.; Byrne, C.D.; Roden, M. The complex link between NAFLD and type 2 diabetes mellitus—Mechanisms and treatments. Nat. Rev. Gastroenterol. Hepatol. 2021, 18, 599–612. [Google Scholar] [CrossRef]
- Younossi, Z.M.; Golabi, P.; de Avila, L.; Paik, J.M.; Srishord, M.; Fukui, N.; Qiu, Y.; Burns, L.; Afendy, A.; Nader, F. The global epidemiology of NAFLD and NASH in patients with type 2 diabetes: A systematic review and meta-analysis. J. Hepatol. 2019, 71, 793–801. [Google Scholar] [CrossRef]
- Miao, L.; Targher, G.; Byrne, C.D.; Cao, Y.Y.; Zheng, M.H. Current status and future trends of the global burden of MASLD. Trends Endocrinol. Metab. 2024, 35, 697–707. [Google Scholar] [CrossRef]
- Huang, D.Q.; Noureddin, N.; Ajmera, V.; Amangurbanova, M.; Bettencourt, R.; Truong, E.; Gidener, T.; Siddiqi, H.; Majzoub, A.M.; Nayfeh, T.; et al. Type 2 diabetes, hepatic decompensation, and hepatocellular carcinoma in patients with non-alcoholic fatty liver disease: An individual participant-level data meta-analysis. Lancet Gastroenterol. Hepatol. 2023, 8, 829–836. [Google Scholar] [CrossRef]
- Jalali, M.; Rahimlou, M.; Mahmoodi, M.; Moosavian, S.P.; Symonds, M.E.; Jalali, R.; Zare, M.; Imanieh, M.H.; Stasi, C. The effects of metformin administration on liver enzymes and body composition in non-diabetic patients with non-alcoholic fatty liver disease and/or non-alcoholic steatohepatitis: An up-to date systematic review and meta-analysis of randomized controlled trials. Pharmacol. Res. 2020, 159, 104799. [Google Scholar] [CrossRef]
- McCreight, L.J.; Bailey, C.J.; Pearson, E.R. Metformin and the gastrointestinal tract. Diabetologia 2016, 59, 426–435. [Google Scholar] [CrossRef]
- Min, H.K.; Kapoor, A.; Fuchs, M.; Mirshahi, F.; Zhou, H.; Maher, J.; Kellum, J.; Warnick, R.; Contos, M.J.; Sanyal, A.J. Increased hepatic synthesis and dysregulation of cholesterol metabolism is associated with the severity of nonalcoholic fatty liver disease. Cell Metab. 2012, 15, 665–674. [Google Scholar] [CrossRef] [PubMed]
- Li, H.; Yu, X.H.; Ou, X.; Ouyang, X.P.; Tang, C.K. Hepatic cholesterol transport and its role in non-alcoholic fatty liver disease and atherosclerosis. Prog. Lipid Res. 2021, 83, 101109. [Google Scholar] [CrossRef] [PubMed]
- Rizzolo, D.; Kong, B.; Taylor, R.E.; Brinker, A.; Goedken, M.; Buckley, B.; Guo, G.L. Bile acid homeostasis in female mice deficient in Cyp7a1 and Cyp27a1. Acta Pharm. Sin. B 2021, 11, 3847–3856. [Google Scholar] [CrossRef] [PubMed]
- Ren, J.; Zhang, X.; Heiyan-Perhat, S.U.; Yang, P.; Han, H.; Li, Y.; Gao, J.; He, E.; Li, Y. Therapeutic Role of Polyphenol Extract from Prunus cerasifera Ehrhart on Non-Alcoholic Fatty Liver. Plants 2024, 13, 288. [Google Scholar] [CrossRef]
- Liu, W.; Xu, S.; Zhang, B.; Sun, X. Ramulus Mori (Sangzhi) Alkaloids Alleviate Diabetic Nephropathy through Improving Gut Microbiota Disorder. Nutrients 2024, 16, 2346. [Google Scholar] [CrossRef]
- Jia, W.; Wei, M.; Rajani, C.; Zheng, X. Targeting the alternative bile acid synthetic pathway for metabolic diseases. Protein Cell 2021, 12, 411–425. [Google Scholar] [CrossRef]
- Sookoian, S.; Pirola, C.J. Resmetirom for treatment of MASH. Cell 2024, 187, 2897–2897.e1. [Google Scholar] [CrossRef]
- Harrison, S.A.; Taub, R. A Phase 3 Trial of Resmetirom in NASH with Liver Fibrosis. N. Engl. J. Med. 2024, 390, 1632–1633. [Google Scholar] [CrossRef]
- Wabitsch, S.; McCallen, J.D.; Kamenyeva, O.; Ruf, B.; McVey, J.C.; Kabat, J.; Walz, J.S.; Rotman, Y.; Bauer, K.C.; Craig, A.J.; et al. Metformin treatment rescues CD8(+) T-cell response to immune checkpoint inhibitor therapy in mice with NAFLD. J. Hepatol. 2022, 77, 748–760. [Google Scholar] [CrossRef]
- Park, J.; Rah, S.Y.; An, H.S.; Lee, J.Y.; Roh, G.S.; Ryter, S.W.; Park, J.W.; Yang, C.H.; Surh, Y.J.; Kim, U.H.; et al. Metformin-induced TTP mediates communication between Kupffer cells and hepatocytes to alleviate hepatic steatosis by regulating lipophagy and necroptosis. Metabolism 2023, 141, 155516. [Google Scholar] [CrossRef]
- He, Y.; Wang, H.; Lin, S.; Chen, T.; Chang, D.; Sun, Y.; Wang, C.; Liu, Y.; Lu, Y.; Song, J.; et al. Advanced effect of curcumin and resveratrol on mitigating hepatic steatosis in metabolic associated fatty liver disease via the PI3K/AKT/mTOR and HIF-1/VEGF cascade. Biomed. Pharmacother. 2023, 165, 115279. [Google Scholar] [CrossRef] [PubMed]
- Javanbakht, M.; Fishman, J.; Moloney, E.; Rydqvist, P.; Ansaripour, A. Early Cost-Effectiveness and Price Threshold Analyses of Resmetirom: An Investigational Treatment for Management of Nonalcoholic Steatohepatitis. PharmacoEconomics-Open 2023, 7, 93–110. [Google Scholar] [CrossRef] [PubMed]
- Yan, L.S.; Zhang, S.F.; Luo, G.; Cheng, B.C.; Zhang, C.; Wang, Y.W.; Qiu, X.Y.; Zhou, X.H.; Wang, Q.G.; Song, X.L.; et al. Schisandrin B mitigates hepatic steatosis and promotes fatty acid oxidation by inducing autophagy through AMPK/mTOR signaling pathway. Metabolism 2022, 131, 155200. [Google Scholar] [CrossRef]
- Wu, Y.C.; Yan, Q.; Yue, S.Q.; Pan, L.X.; Yang, D.S.; Tao, L.S.; Wei, Z.Y.; Rong, F.; Qian, C.; Han, M.Q.; et al. NUP85 alleviates lipid metabolism and inflammation by regulating PI3K/AKT signaling pathway in nonalcoholic fatty liver disease. Int. J. Biol. Sci. 2024, 20, 2219–2235. [Google Scholar] [CrossRef]
- Wang, Y.; Chen, C.; Chen, J.; Sang, T.; Peng, H.; Lin, X.; Zhao, Q.; Chen, S.; Eling, T.; Wang, X. Overexpression of NAG-1/GDF15 prevents hepatic steatosis through inhibiting oxidative stress-mediated dsDNA release and AIM2 inflammasome activation. Redox Biol. 2022, 52, 102322. [Google Scholar] [CrossRef]
- Rong, S.; Xia, M.; Vale, G.; Wang, S.; Kim, C.W.; Li, S.; McDonald, J.G.; Radhakrishnan, A.; Horton, J.D. DGAT2 inhibition blocks SREBP-1 cleavage and improves hepatic steatosis by increasing phosphatidylethanolamine in the ER. Cell Metab. 2024, 36, 617–629.e7. [Google Scholar] [CrossRef]
- Shen, C.; Pan, Z.; Xie, W.; Zhao, J.; Miao, D.; Zhao, L.; Liu, M.; Zhong, Y.; Zhong, C.; Gonzalez, F.J.; et al. Hepatocyte-specific SLC27A4 deletion ameliorates nonalcoholic fatty liver disease in mice via suppression of phosphatidylcholine-mediated PXR activation. Metabolism 2024, 162, 156054. [Google Scholar] [CrossRef]
- Luukkonen, P.K.; Juuti, A.; Sammalkorpi, H.; Penttilä, A.K.; Orešič, M.; Hyötyläinen, T.; Arola, J.; Orho-Melander, M.; Yki-Järvinen, H. MARC1 variant rs2642438 increases hepatic phosphatidylcholines and decreases severity of non-alcoholic fatty liver disease in humans. J. Hepatol. 2020, 73, 725–726. [Google Scholar] [CrossRef]
- Wang, X.; Cai, B.; Yang, X.; Sonubi, O.O.; Zheng, Z.; Ramakrishnan, R.; Shi, H.; Valenti, L.; Pajvani, U.B.; Sandhu, J.; et al. Cholesterol Stabilizes TAZ in Hepatocytes to Promote Experimental Non-alcoholic Steatohepatitis. Cell Metab. 2020, 31, 969–986.e7. [Google Scholar] [CrossRef]
- Szántó, M.; Gupte, R.; Kraus, W.L.; Pacher, P.; Bai, P. PARPs in lipid metabolism and related diseases. Prog. Lipid Res. 2021, 84, 101117. [Google Scholar] [CrossRef]
- Handelman, S.K.; Puentes, Y.M.; Kuppa, A.; Chen, Y.; Du, X.; Feitosa, M.F.; Palmer, N.D.; Speliotes, E.K. Population-based meta-analysis and gene-set enrichment identifies FXR/RXR pathway as common to fatty liver disease and serum lipids. Hepatol. Commun. 2022, 6, 3120–3131. [Google Scholar] [CrossRef] [PubMed]
- Guan, B.; Tong, J.; Hao, H.; Yang, Z.; Chen, K.; Xu, H.; Wang, A. Bile acid coordinates microbiota homeostasis and systemic immunometabolism in cardiometabolic diseases. Acta Pharm. Sin. B 2022, 12, 2129–2149. [Google Scholar] [CrossRef] [PubMed]
- Graf, G.A.; Yu, L.; Li, W.P.; Gerard, R.; Tuma, P.L.; Cohen, J.C.; Hobbs, H.H. ABCG5 and ABCG8 are obligate heterodimers for protein trafficking and biliary cholesterol excretion. J. Biol. Chem. 2003, 278, 48275–48282. [Google Scholar] [CrossRef] [PubMed]
- Ferguson, D.; Finck, B.N. Emerging therapeutic approaches for the treatment of NAFLD and type 2 diabetes mellitus. Nat. Rev. Endocrinol. 2021, 17, 484–495. [Google Scholar] [CrossRef]
- Kazankov, K.; Jørgensen, S.M.D.; Thomsen, K.L.; Møller, H.J.; Vilstrup, H.; George, J.; Schuppan, D.; Grønbæk, H. The role of macrophages in nonalcoholic fatty liver disease and nonalcoholic steatohepatitis. Nat. Rev. Gastroenterol. Hepatol. 2019, 16, 145–159. [Google Scholar] [CrossRef]
- Zheng, C. The emerging roles of NOD-like receptors in antiviral innate immune signaling pathways. Int. J. Biol. Macromol. 2021, 169, 407–413. [Google Scholar] [CrossRef]
- Calcagno, D.M.; Chu, A.; Gaul, S.; Taghdiri, N.; Toomu, A.; Leszczynska, A.; Kaufmann, B.; Papouchado, B.; Wree, A.; Geisler, L.; et al. NOD-like receptor protein 3 activation causes spontaneous inflammation and fibrosis that mimics human NASH. Hepatology 2022, 76, 727–741. [Google Scholar] [CrossRef]
- Lee, S.M.; Koh, D.H.; Jun, D.W.; Roh, Y.J.; Kang, H.T.; Oh, J.H.; Kim, H.S. Auranofin attenuates hepatic steatosis and fibrosis in nonalcoholic fatty liver disease via NRF2 and NF- κB signaling pathways. Clin. Mol. Hepatol. 2022, 28, 827–840. [Google Scholar] [CrossRef]
- Jing, X.; Zhou, G.; Zhu, A.; Jin, C.; Li, M.; Ding, K. RG-I pectin-like polysaccharide from Rosa chinensis inhibits inflammation and fibrosis associated to HMGB1/TLR4/NF-κB signaling pathway to improve non-alcoholic steatohepatitis. Carbohydr. Polym. 2024, 337, 122139. [Google Scholar] [CrossRef]

Disclaimer/Publisher’s Note: The statements, opinions and data contained in all publications are solely those of the individual author(s) and contributor(s) and not of MDPI and/or the editor(s). MDPI and/or the editor(s) disclaim responsibility for any injury to people or property resulting from any ideas, methods, instructions or products referred to in the content. |
© 2025 by the authors. Licensee MDPI, Basel, Switzerland. This article is an open access article distributed under the terms and conditions of the Creative Commons Attribution (CC BY) license (https://creativecommons.org/licenses/by/4.0/).