
Predictive Role of Complete Blood Count-Derived Inflammation Indices and Optical Coherence Tomography Biomarkers for Early Response to Intravitreal Anti-VEGF in Diabetic Macular Edema

 ,
,  ,
,  ,
,  ,
,  , ,
, ,  ,
,
Abstract
1. Introduction
2. Materials and Methods
2.1. Study Design and Setting
2.2. Inclusion Criteria
2.3. Evaluation Protocol
2.4. Exclusion Criteria
2.5. Outcome Measures
2.6. Statistical Analysis
3. Results
3.1. Comparative Ophthalmologic and OCT Findings in Initial and Follow-Up Exam
3.2. Predictors of Early Anti-VEGF Treatment Response in Study Group
4. Discussion
5. Conclusions
Author Contributions
Funding
Institutional Review Board Statement
Informed Consent Statement
Data Availability Statement
Conflicts of Interest
References
- Vujosevic, S.; Torresin, T.; Bini, S.; Convento, E.; Midena, E. Diabetic macular edema: A multifactorial disease that demands a multimodal approach. Front. Endocrinol. 2020, 11, 602532. [Google Scholar]
- Romero-Aroca, P.; Baget-Bernaldiz, M.; Pareja-Rios, A.; Lopez-Galvez, M.; Navarro-Gil, R.; Verges, R. Diabetic macular edema pathophysiology: Vasogenic versus inflammatory. J. Diabetes Res. 2016, 2016, 2156273. [Google Scholar] [CrossRef] [PubMed]
- Photocoagulation Study Research Group. Treatment techniques and clinical results of photocoagulation of diabetic macular edema. Arch. Ophthalmol. 1985, 103, 1796–1806. [Google Scholar]
- Cho, N.H.; Shaw, J.E.; Karuranga, S.; Huang, Y.; da Rocha Fernandes, J.D.; Ohlrogge, A.W.; Malanda, B. IDF Diabetes Atlas: Global estimates of diabetes prevalence for 2017 and projections for 2045. Diabetes Res. Clin. Pract. 2018, 138, 271–281. [Google Scholar] [CrossRef]
- Wang, J.K.; Huang, T.L.; Chang, P.Y.; Ho, W.T.; Hsu, Y.R.; Chen, F.T.; Chen, Y.J. Comparison of Intravitreal Dexamethasone Implant and Ranibizumab in Vitrectomized Eyes with Diabetic Macular Edema. J. Ophthalmol. 2021, 2021, 8882539. [Google Scholar] [CrossRef]
- Mehta, H.; Nguyen, V.; Barthelmes, D.; Gillies, M.C. Outcomes of over 40,000 eyes treated for diabetic macular edema in routine clinical practice: A systematic review and meta-analysis. Adv. Ther. 2022, 39, 274–285. [Google Scholar] [CrossRef]
- Nguyen, Q.D.; Shah, S.M.; Khwaja, A.A.; Channa, R.; Hatef, E.; Do, D.V.; Boyer, D.; Heier, J.S.; Abraham, P.; Thach, A.B.; et al. Two-year outcomes of the ranibizumab for edema of the macula in diabetes (READ-2) study. Ophthalmology 2009, 116, 2182–2191. [Google Scholar] [CrossRef]
- Zhang, J.; Zhang, J.; Zhang, C.; Zhang, J.; Gu, L.; Luo, D.; Qiu, Q. Diabetic Macular Edema: Current Understanding, Molecular Mechanisms and Therapeutic Implications. Cells 2022, 11, 3362. [Google Scholar] [CrossRef]
- Figueira, J.; Henriques, J.; Carneiro, Â.; Marques-Neves, C.; Flores, R.; Castro-Sousa, J.P.; Meireles, A.; Gomes, N.; Nascimento, J.; Amaro, M.; et al. Guidelines for the Management of Center-Involving Diabetic Macular Edema: Treatment Options and Patient Monitorization. Clin. Ophthalmol. 2021, 15, 3221–3230. [Google Scholar] [CrossRef]
- Wells, J.A.; Glassman, A.R.; Ayala, A.R.; Jampol, L.M.; Aiello, L.P.; Antoszyk, A.N.; Arnold-Bush, B.; Baker, W.C.; Bressler, N.M.; Browning, D.J.; et al. Aflibercept, bevacizumab, or ranibizumab for diabetic macular edema. N. Engl. J. Med. 2015, 372, 1193–1203. [Google Scholar] [CrossRef]
- Camacho, P.; Ribeiro, E.; Pereira, B.; Varandas, T.; Nascimento, J.; Henriques, J.; Dutra-Medeiros, M.; Delgadinho, M.; Oliveira, K.; Silva, C.; et al. DNA methyltransferase expression (DNMT1, DNMT3a and DNMT3b) as a potential biomarker for anti-VEGF diabetic macular edema response. Eur. J. Ophthalmol. 2023, 33, 2267–2274. [Google Scholar] [CrossRef] [PubMed]
- Bressler, N.M.; Beaulieu, W.T.; Maguire, M.G.; Glassman, A.R.; Blinder, K.J.; Bressler, S.B.; Gonzalez, V.H.; Jampol, L.M.; Melia, M.; Sun, J.K.; et al. Early response to anti-VEGF treatment and long-term outcomes in diabetic macular edema: Protocol T study results. JAMA Ophthalmol. 2018, 136, 383–389. [Google Scholar]
- Gonzalez, V.H.; Campbell, J.; Holekamp, N.M.; Kiss, S.; Loewenstein, A.; Augustin, A.J.; Ma, J.; Ho, A.C.; Patel, V.; Whitcup, S.M.; et al. Early and Long-Term Responses to Anti-Vascular Endothelial Growth Factor Therapy in Diabetic Macular Edema: Analysis of Protocol I Data. Am. J. Ophthalmol. 2016, 172, 72–79. [Google Scholar] [CrossRef]
- Dugel, P.U.; Campbell, J.H.; Kiss, S.; Loewenstein, A.; Shih, V.; Xu, X.; Holekamp, N.M.; Augustin, A.J.; Ho, A.C.; Gonzalez, V.H.; et al. Association Between Early Anatomic Response to Anti-Vascular Endothelial Growth Factor Therapy and Long-Term Outcome in Diabetic Macular Edema: An Independent Analysis of Protocol i Study Data. Retina 2019, 39, 88–97. [Google Scholar] [CrossRef]
- Shah, A.R.; Yonekawa, Y.; Todorich, B.; Van Laere, L.; Hussain, R.; Woodward, M.A.; Abbey, A.M.; Wolfe, J.D. Prediction of Anti-VEGF Response in Diabetic Macular Edema After 1 Injection. J. Vitreoretin. Dis. 2017, 1, 169–174. [Google Scholar] [CrossRef]
- Maeda, S.; Sugimoto, M.; Tenma, Y.; Tsukitome, H.; Kato, K.; Chujo, S.; Matsui, Y.; Matsubara, H.; Kondo, M. Response to Initial Anti-Vascular Endothelial Growth Factor for Diabetic Macular Edema Is Significantly Correlated with Response to Third Consecutive Monthly Injection. J. Clin. Med. 2022, 11, 6416. [Google Scholar] [CrossRef]
- Simo, R.; Carrasco, E.; Garcia-Ramirez, M.; Hernandez, C. Angiogenic and antiangiogenic factors in proliferative diabetic retinopathy. Curr. Diabetes Rev. 2006, 2, 71–98. [Google Scholar] [CrossRef]
- Templeton, A.J.; Knox, J.J.; Lin, X.; Simantov, R.; Xie, W.; Lawrence, N.; Broom, R.; Fay, A.P.; Rini, B.; Donskov, F.; et al. Change in the neutrophil-to-lymphocyte ratio in response to targeted therapy for metastatic renal cell carcinoma as a prognosticator and biomarker of efficacy. Eur. Urol. 2016, 70, 358–364. [Google Scholar] [CrossRef]
- Eo, W.K.; Kwon, S.; Koh, S.B.; Kim, M.J.; Ji, Y.I.; Lee, J.Y.; Suh, D.S.; Kim, K.H.; Kim, H.Y. The lymphocyte-monocyte ratio predicts patient survival and aggressiveness of endometrial cancer. J. Cancer 2016, 7, 538–545. [Google Scholar] [CrossRef]
- Condado, J.F.; Junpaparp, P.; Binongo, J.N.; Lasanajak, Y.; Witzke-Sanz, C.F.; Devireddy, C.; Leshnower, B.; Mavromatis, K.; Stewart, J.; Guyton, R.; et al. Neutrophil-lymphocyte ratio and platelet-lymphocyte ratio can risk-stratify patients in transcatheter aortic-valve replacement (TAVR). Int. J. Cardiol. 2016, 223, 444–449. [Google Scholar] [CrossRef]
- Romano, A.; Parrinello, N.L.; Consoli, M.L.; Marchionni, L.; Forte, S.; Conticello, C.; Pompa, A.; Corso, A.; Milone, G.; Di Raimondo, F.; et al. Neutrophil-to-lymphocyte ratio improves the risk assessment of ISS staging in newly diagnosed multiple myeloma patients treated upfront with novel agents. Ann. Hematol. 2015, 94, 1875–1883. [Google Scholar] [CrossRef] [PubMed]
- Schreur, V.; de Breuk, A.; Venhuizen, F.G.; Sánchez, C.I.; Tack, C.J.; Klevering, B.J.; de Jong, E.K.; Hoyng, C.B. Retinal hyperreflective foci in type 1 diabetes mellitus. Retina 2020, 40, 1565–1573. [Google Scholar] [CrossRef] [PubMed]
- Sun, J.K.; Lin, M.M.; Lammer, J.; Prager, S.; Sarangi, R.; Silva, P.S.; Aiello, L.P. Disorganization of the retinal inner layers as a predictor of visual acuity in eyes with center-involved diabetic macular edema. JAMA Ophthalmol. 2014, 132, 1309–1316. [Google Scholar] [CrossRef] [PubMed]
- Bahr, T.A.; Bakri, S.J. Update on the management of diabetic retinopathy: Anti-VEGF agents for the prevention of complications and progression of nonproliferative and proliferative retinopathy. Life 2023, 13, 1098. [Google Scholar] [CrossRef]
- Cleland, C. Comparing the International Clinical Diabetic Retinopathy (ICDR) severity scale. Community Eye Health 2023, 36, 10. [Google Scholar]
- Panozzo, G.; Cicinelli, M.V.; Dalla Mura, G.; Giannarelli, D.; Vadalà, M.; Bonfiglio, V.; Bellisario, G.; Bandello, F.; ESASO Study Group. Enhancing Diabetic Macular Edema Treatment Outcomes: Exploring the ESASO Classification and Structural OCT Biomarkers. Ophthalmol. Ther. 2024, 13, 1383–1398. [Google Scholar] [CrossRef]
- Panozzo, G.; Cicinelli, M.V.; Augustin, A.J.; Battaglia Parodi, M.; Cunha-Vaz, J.; Guarnaccia, G.; Kodjikian, L.; Jampol, L.M.; Jünemann, A.; Lanzetta, P.; et al. An optical coherence tomography-based grading of diabetic maculopathy proposed by an international expert panel: The European School for Advanced Studies in Ophthalmology classification. Eur. J. Ophthalmol. 2020, 30, 8–18. [Google Scholar] [CrossRef]
- Moreno-Martínez, A.; Blanco-Marchite, C.; Andres-Pretel, F.; López-Martínez, F.; Donate-Tercero, A.; González-Aquino, E.; Cava-Valenciano, C.; Panozzo, G.; Copete, S. ESASO classification relevance in the diagnosis and evolution in diabetic macular edema patients after dexamethasone implant treatment. Graefe’s Arch. Clin. Exp. Ophthalmol. 2024, 262, 2813–2821. [Google Scholar] [CrossRef]
- Tatsumi, T. Current Treatments for Diabetic Macular Edema. Int. J. Mol. Sci. 2023, 24, 9591. [Google Scholar] [CrossRef]
- Dascalu, A.M.; Tudosie, M.S.; Smarandache, G.C.; Serban, D. Impact of COVID-19 pandemic upon ophthalmological clinical practice. Rom. J. Leg. Med. 2020, 28, 96–100. [Google Scholar] [CrossRef]
- Soleimani, M.; Mehrpour, M.; Mohammad-Rabei, H. Ophthalmic practice during COVID-19 pandemic. Int. J. Ophthalmol. 2021, 14, 639–642. [Google Scholar] [CrossRef] [PubMed]
- Serban, D.; Spataru, R.I.; Vancea, G.; Balasescu, S.A.; Socea, B.; Tudor, C.; Dascalu, A.M. Informed consent in all surgical specialties: From legal obligation to patient satisfaction. Rom. J. Leg. Med. 2020, 28, 317–321. [Google Scholar] [CrossRef]
- Șerban, D.; Brănescu, C.M.; Smarandache, G.C.; Tudor, C.; Tănăsescu, C.; Tudosie, M.S.; Stana, D.; Costea, D.O.; Dascălu, A.M.; Spătaru, R.I. Safe surgery in day care centers: Focus on preventing medical legal issues. Rom. J. Leg. Med. 2021, 29, 60–64. [Google Scholar] [CrossRef]
- Donati, S.; Yang, C.H.; Xu, X.; Mura, M.; Giocanti-Aurégan, A.; Hoerauf, H.; Allmeier, H.; Machewitz, T.; Johnson, K.T.; Santoro, E.; et al. Intravitreal Aflibercept for the Treatment of Diabetic Macular Edema in Routine Clinical Practice: Results from the 24-Month AURIGA Observational Study. Ophthalmol. Ther. 2024, 13, 161–178. [Google Scholar] [CrossRef]
- Zehden, J.A.; Mortensen, X.M.; Reddy, A.; Zhang, A.Y. Systemic and Ocular Adverse Events with Intravitreal Anti-VEGF Therapy Used in the Treatment of Diabetic Retinopathy: A Review. Curr. Diabetes Rep. 2022, 22, 525–536. [Google Scholar] [CrossRef]
- Serban, D.; Smarandache, A.M.; Cristian, D.; Tudor, C.; Duta, L.; Dascalu, A.M. Medical errors and patient safety culture—Shifting the healthcare paradigm in Romanian hospitals. Rom. J. Leg. Med. 2020, 28, 195–201. [Google Scholar] [CrossRef]
- Ma, P.; Pan, X.; Liu, R.; Qu, Y.; Xie, L.; Xie, J.; Cao, L.; Chen, Y. Ocular adverse events associated with anti-VEGF therapy: A pharmacovigilance study of the FDA adverse event reporting system (FAERS). Front. Pharmacol. 2022, 13, 1017889. [Google Scholar] [CrossRef]
- Busnatu, S.S.; Salmen, T.; Pana, M.A.; Rizzo, M.; Stallone, T.; Papanas, N.; Popovic, D.; Tanasescu, D.; Serban, D.; Stoian, A.P. The Role of Fructose as a Cardiovascular Risk Factor: An Update. Metabolites 2022, 12, 67. [Google Scholar] [CrossRef]
- Kovoor, E.; Chauhan, S.K.; Hajrasouliha, A. Role of inflammatory cells in pathophysiology and management of diabetic retinopathy. Surv. Ophthalmol. 2022, 67, 1563–1573. [Google Scholar] [CrossRef]
- Xue, C.; Chen, K.; Gao, Z.; Bao, T.; Dong, L.; Zhao, L.; Tong, X.; Li, X. Common mechanisms underlying diabetic vascular complications: Focus on the interaction of metabolic disorders, immuno-inflammation, and endothelial dysfunction. Cell Commun. Signal. 2023, 21, 298. [Google Scholar] [CrossRef]
- Dascalu, A.M.; Anghelache, A.; Stana, D.; Costea, A.C.; Nicolae, V.A.; Tanasescu, D.; Costea, D.O.; Tribus, L.C.; Zgura, A.; Serban, D.; et al. Serum levels of copper and zinc in diabetic retinopathy: Potential new therapeutic targets (Review). Exp. Ther. Med. 2022, 23, 324. [Google Scholar] [CrossRef] [PubMed]
- Vujosevic, S.; Simó, R. Local and Systemic Inflammatory Biomarkers of Diabetic Retinopathy: An Integrative Approach. Investig. Ophthalmol. Vis. Sci. 2017, 58, BIO68–BIO75. [Google Scholar] [CrossRef] [PubMed]
- Rübsam, A.; Parikh, S.; Fort, P.E. Role of Inflammation in Diabetic Retinopathy. Int. J. Mol. Sci. 2018, 19, 942. [Google Scholar] [CrossRef] [PubMed]
- Duman, T.T.; Aktas, G.; Atak, B.M.; Kocak, M.Z.; Erkus, E.; Savli, H. Neutrophil to lymphocyte ratio as an indicative of diabetic control level in type 2 diabetes mellitus. Afr. Health Sci. 2019, 19, 1602–1606. [Google Scholar] [CrossRef]
- Chen, H.L.; Wu, C.; Cao, L.; Wang, R.; Zhang, T.Y.; He, Z. The association between the neutrophil-to-lymphocyte ratio and type 2 diabetes mellitus: A cross-sectional study. BMC Endocr. Disord. 2024, 24, 107. [Google Scholar] [CrossRef]
- Mertoglu, C.; Gunay, M. Neutrophil-Lymphocyte ratio and Platelet-Lymphocyte ratio as useful predictive markers of prediabetes and diabetes mellitus. Diabetes Metab. Syndr. 2017, 11, S127–S131. [Google Scholar] [CrossRef]
- Jaaban, M.; Zetoune, A.B.; Hesenow, S.; Hessenow, R. Neutrophil-lymphocyte ratio and platelet-lymphocyte ratio as novel risk markers for diabetic nephropathy in patients with type 2 diabetes. Heliyon 2021, 7, e07564. [Google Scholar] [CrossRef]
- Deng, R.; Zhu, S.; Fan, B.; Chen, X.; Lv, H.; Dai, Y. Exploring the correlations between six serological inflammatory markers and different stages of type 2 diabetic retinopathy. Sci. Rep. 2025, 15, 1567. [Google Scholar] [CrossRef]
- Gao, Y.; Lu, R.X.; Tang, Y.; Yang, X.Y.; Meng, H.; Zhao, C.L.; Chen, Y.L.; Yan, F.; Cao, Q. Systemic immune-inflammation index, neutrophil-to-lymphocyte ratio, and platelet-to-lymphocyte ratio in patients with type 2 diabetes at different stages of diabetic retinopathy. Int. J. Ophthalmol. 2024, 17, 877–882. [Google Scholar] [CrossRef]
- Liao, W.; Liu, F.; Liu, W.; Xiao, C. Serum inflammation biomarkers level in cystoid and diffuse diabetic macular edema. Int. Ophthalmol. 2024, 44, 447. [Google Scholar] [CrossRef]
- Zhou, J.; Song, S.; Zhang, Y.; Jin, K.; Ye, J. OCT-Based Biomarkers are Associated with Systemic Inflammation in Patients with Treatment-Naïve Diabetic Macular Edema. Ophthalmol. Ther. 2022, 11, 2153–2167. [Google Scholar] [CrossRef] [PubMed]
- Hu, Y.; Cheng, Y.; Xu, X.; Yang, B.; Mei, F.; Zhou, Q.; Yan, L.; Wang, J.; Wu, X. Pretreatment neutrophil-to-lymphocyte ratio predicts prognosis in patients with diabetic macular edema treated with ranibizumab. BMC Ophthalmol. 2019, 19, 194. [Google Scholar] [CrossRef] [PubMed]
- Katić, K.; Katić, J.; Kumrić, M.; Božić, J.; Tandara, L.; Šupe Domić, D.; Bućan, K. The Predictors of Early Treatment Effectiveness of Intravitreal Bevacizumab Application in Patients with Diabetic Macular Edema. Diagnostics 2024, 14, 992. [Google Scholar] [CrossRef]
- Yalinbas Yeter, D.; Eroglu, S.; Sariakcali, B.; Bozali, E.; Vural Ozec, A.; Erdogan, H. The usefulness of monocyte-to-high density lipoprotein and neutrophil-to-lymphocyte ratio in diabetic macular edema prediction and early anti-VEGF treatment response. Ocul. Immunol. Inflamm. 2022, 30, 901–906. [Google Scholar] [CrossRef]
- Gurung, R.L.; FitzGerald, L.M.; Liu, E.; McComish, B.J.; Kaidonis, G.; Ridge, B.; Hewitt, A.W.; Vote, B.J.; Verma, N.; Craig, J.E.; et al. Predictive factors for treatment outcomes with intravitreal anti-vascular endothelial growth factor injections in diabetic macular edema in clinical practice. Int. J. Retin. Vitr. 2023, 9, 23. [Google Scholar] [CrossRef]
- Huang, C.-H.; Yang, C.-H.; Hsieh, Y.-T.; Yang, C.-M.; Ho, T.-C.; Lai, T.-T. Hyperreflective foci in predicting the treatment outcomes of diabetic macular oedema after anti-vascular endothelial growth factor therapy. Sci. Rep. 2021, 11, 5103. [Google Scholar] [CrossRef]
- Schreur, V.; Altay, L.; van Asten, F.; Groenewoud, J.M.; Fauser, S.; Klevering, B.J.; Hoyng, C.B.; de Jong, E.K. Hyperreflective foci on optical coherence tomography associate with treatment outcome for anti-VEGF in patients with diabetic macular edema. PLoS ONE 2018, 13, e0206482. [Google Scholar] [CrossRef]
- Tang, L.; Luo, D.; Qiu, Q.; Xu, G.T.; Zhang, J. Hyperreflective Foci in Diabetic Macular Edema with Subretinal Fluid: Association with Visual Outcomes after Anti-VEGF Treatment. Ophthalmic Res. 2023, 66, 39–47. [Google Scholar] [CrossRef]
- Murakami, T.; Suzuma, K.; Uji, A.; Yoshitake, S.; Dodo, Y.; Fujimoto, M.; Yoshitake, T.; Miwa, Y.; Yoshimura, N. Association between characteristics of foveal cystoid spaces and short-term responsiveness to ranibizumab for diabetic macular edema. Jpn. J. Ophthalmol. 2018, 62, 292–301. [Google Scholar] [CrossRef]
- Ehlken, C.; Ziemssen, F.; Eter, N.; Lanzl, I.; Kaymak, H.; Lommatzsch, A.; Schuster, A.K. Systematic review: Non-adherence and non-persistence in intravitreal treatment. Graefe’s archive for clinical and experimental ophthalmology. Graefe’s Arch. Clin. Exp. Ophthalmol. 2020, 258, 2077–2090. [Google Scholar] [CrossRef]
- Sim, D.A.; Keane, P.A.; Fung, S.; Karampelas, M.; Sadda, S.R.; Fruttiger, M.; Patel, P.J.; Tufail, A.; Egan, C.A. Quantitative analysis of diabetic macular ischemia using optical coherence tomography. Investig. Ophthalmol. Vis. Sci. 2014, 55, 417–423. [Google Scholar] [CrossRef] [PubMed]
- Nicholson, L.; Ramu, J.; Triantafyllopoulou, I.; Patrao, N.V.; Comyn, O.; Hykin, P.; Sivaprasad, S. Diagnostic accuracy of disorganization of the retinal inner layers in detecting macular capillary non-perfusion in diabetic retinopathy. Clin. Exp. Ophthalmol. 2015, 43, 735–741. [Google Scholar] [CrossRef] [PubMed]
- Radwan, S.H.; Soliman, A.Z.; Tokarev, J.; Zhang, L.; van Kuijk, F.J.; Koozekanani, D.D. Association of disorganization of retinal inner layers with vision after resolution of center-involved diabetic macular edema. JAMA Ophthalmol. 2015, 133, 820–825. [Google Scholar] [CrossRef] [PubMed]
- Rai, B.B.; Maddess, T.; Nolan, C.J. Functional diabetic retinopathy: A new concept to improve management of diabetic retinal diseases. Surv. Ophthalmol. 2025, 70, 232–240. [Google Scholar] [CrossRef]
- Eraslan, S.; Yıldırım, Ö.; Dursun, Ö. Relationship Between Final Visual Acuity and Optical Coherence Tomography Findings in Patients with Diabetic Macular Edema Undergoing Anti-VEGF Therapy. Turk. J. Ophthalmol. 2020, 50, 163–168. [Google Scholar] [CrossRef]
- Wykoff, C.C.; Clark, W.L.; Nielsen, J.S.; Brill, J.V.; Greene, L.S.; Heggen, C.L. Optimizing Anti-VEGF Treatment Outcomes for Patients with Neovascular Age-Related Macular Degeneration. J. Manag. Care Spec. Pharmacy 2018, 24 (2-a Suppl), S3–S15. [Google Scholar] [CrossRef]
- Brown, D.M.; Nguyen, Q.D.; Marcus, D.M.; Boyer, D.S.; Patel, S.; Feiner, L.; Schlottmann, P.G.; Rundle, A.C.; Zhang, J.; Rubio, R.G.; et al. Long-term outcomes of ranibizumab therapy for diabetic macular edema: The RISE and RIDE studies. Ophthalmology 2015, 122, 2044–2052. [Google Scholar] [CrossRef]
- Kim, B.Y.; Smith, S.D.; Kaiser, P.K. Optical coherence tomography biomarkers of treatment response to anti-VEGF therapy in diabetic macular edema: A review. Clin. Ophthalmol. 2020, 14, 1867–1878. [Google Scholar]
- Munk, M.R.; Kashani, A.H.; Tadayoni, R.; Korobelnik, J.F.; Wolf, S.; Pichi, F.; Koh, A.; Ishibazawa, A.; Gaudric, A.; Loewenstein, A.; et al. Recommendations for OCT Angiography Reporting in Retinal Vascular Disease: A Delphi Approach by International Experts. Ophthalmol. Retin. 2022, 6, 753–761. [Google Scholar] [CrossRef]
- Okudan, S.; Acar Duyan, S.; Erdem, A.; Bozkurt Oflaz, A.; Turgut Ozturk, B. Optical Coherence Tomography Biomarkers Predict the Long-Term Restorative Effect of Early Anti-VEGF Treatment on Diabetic Macular Edema. Life 2025, 15, 269. [Google Scholar] [CrossRef]


| Variable | Early Responders * N = 66 | Non-Responders ** N = 38 | p-Value |
|---|---|---|---|
| Age (years, mean ± SD) | 64.39 (±7.39) | 63.00 (±8.35) | 0.312 b |
| Gender (N, %) M F | 32(48.48%) 34 (51.52%) | 26 (68.42%) 12 (31.58%) | 0.077 a |
| Eye (N, %) OD OS | 30 (60.61%) 26 (39.39%) | 18 (21.05%) 30 (78.95%) | 0.081 a* |
| DR Grading (N, %) NPDR PDR PPRD | 54 (81.8%) 10 (15.15%) 2 (3.03%) | 34 (89.47%) 4 (10.53%) 0 (0.0%) | 0.529 c |
| Neutrophils (cells × 109/L, mean ± SD) | 4.64 (±1.26) | 5.47 (±1.44) | 0.005 b* |
| Monocytes (cells × 109/L, mean ± SD) | 0.58 (±0.17) | 0.62 (±0.16) | 0.116 b |
| Lymphocytes (cells × 109/L, mean ± SD) | 2.19 (±0.73) | 1.77 (±0.59) | 0.005 b* |
| Platelets (cells × 109/L, mean ± SD) | 246.27 (±55.09) | 264.47 (±77.0) | 0.443 b |
| NLR (mean ± SD) | 2.29 (±0.84) | 3.4 (±1.44) | <0.001 b* |
| MLR (mean ± SD) | 0.28 (±0.09) | 0.391 (±0.16) | <0.001 b* |
| PLR (mean ± SD) | 121.39 (±38.35) | 164.92 (±71.46) | <0.001 b* |
| SII (mean ± SD) | 546.86 (±183.27) | 886.44 (±407.06) | <0.001 b* |
| Blood Glucose (mg/dL, mean ± SD) | 154.36 (±55.58) | 157.84 (±61.15) | 0.668 b |
| Urea (mg/dL, mean ± SD) | 46.79 (±15.29) | 48.84 (±20.58) | 0.853 b |
| Creatinine (mg/dL, mean ± SD) | 0.98 (±0.33) | 1.06 (±0.41) | 0.385 b |
| Variable | Early Responders * N = 66 | Non-Responders ** N = 38 | p-Value |
|---|---|---|---|
| Initial BCVA (mean ± SD) | 0.33 (±0.28) | 0.50 (±0.33) | 0.012 b* |
| Post-in BCVA (mean ± SD) | 0.48 (±0.33) | 0.56 (±0.33) | 0.193 b |
| ∆BCVA (mean ± SD) | 0.15 (±0.17) | 0.06 (±0.16) | 0.003 b* |
| Functional responders (N,%) | 42 (63.6%) | 10 (26.3%) | <0.001 a* |
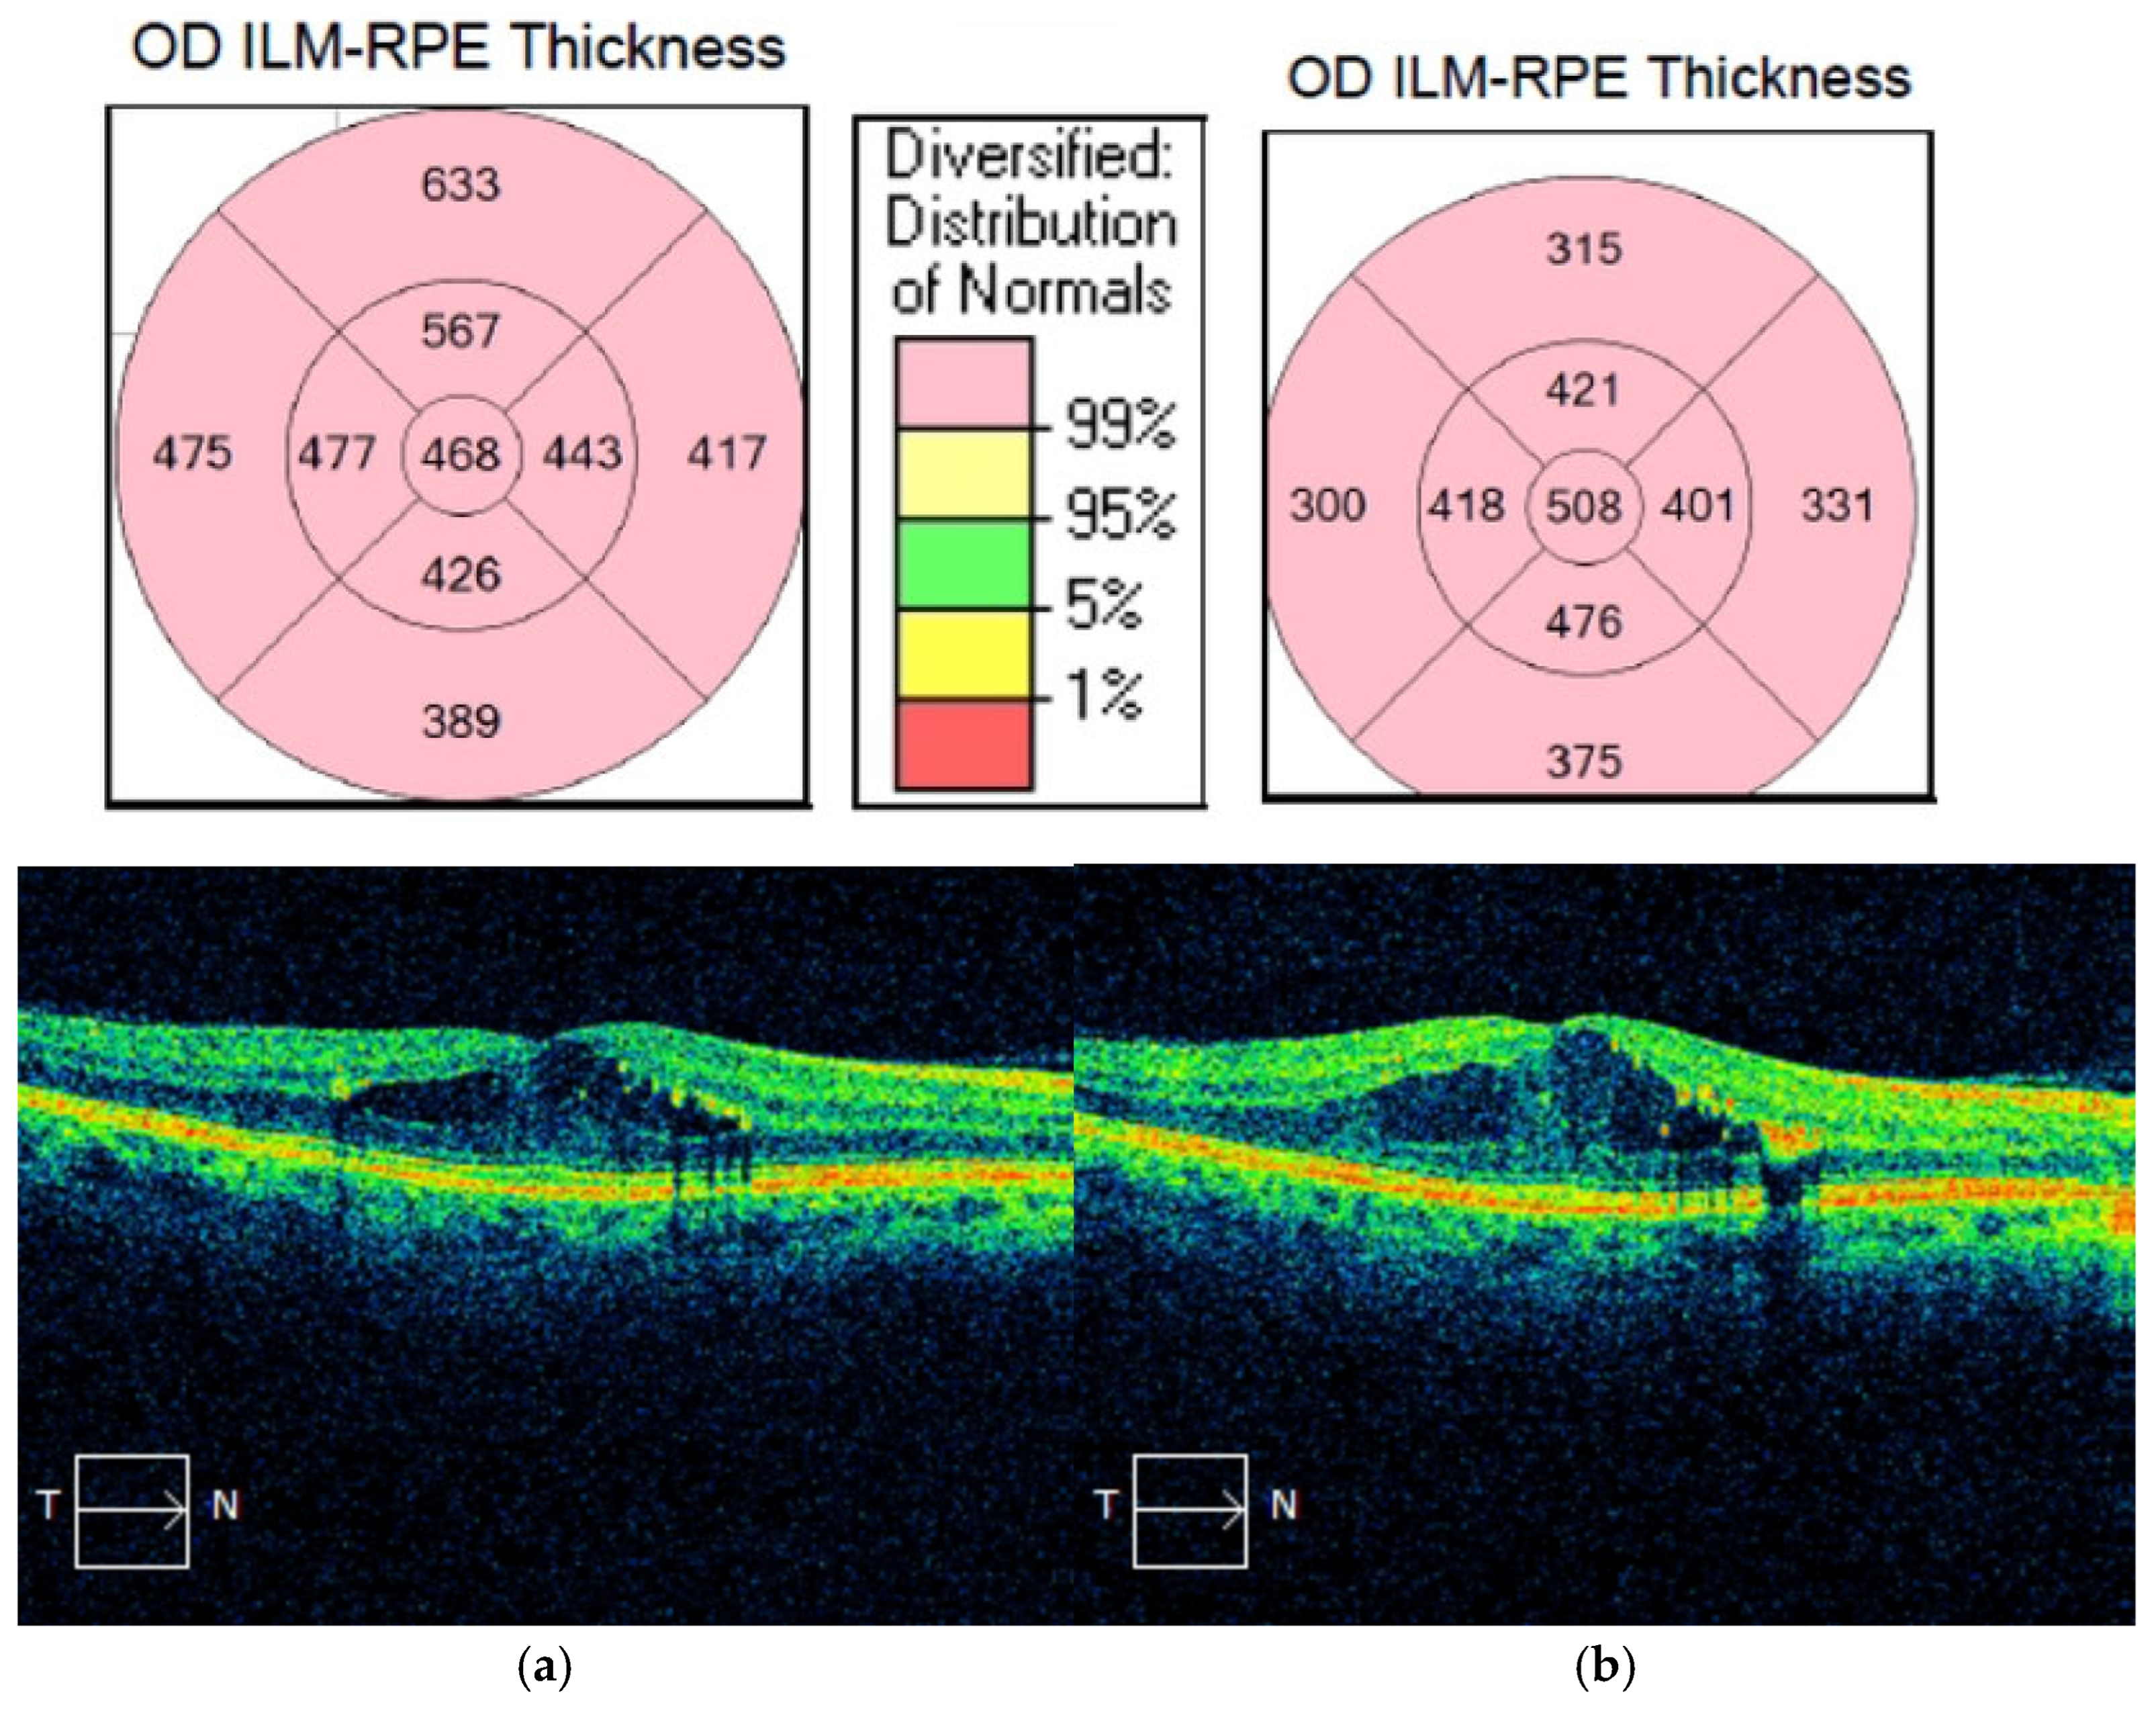
| Initial CMT (µm, mean ± SD) | 507.42 (±148.52) | 354.95 (±87.43) | <0.001 b* |
| Post-inj CMT (µm, mean ± SD) | 334.39 (±88.54) | 351.16 (±94.73) | 0.367 b |
| ∆CMT (µm, mean ± SD) | −173.03 (±127.65) | −3.79 (±15.58) | <0.001 b* |
| ∆CMT(%, mean ± SD) | −31.31 (±15.68) | −1.54 (±4.23) | <0.001 b* |
| HRS (N, %) | 32 (48.48%) | 20 (52.63%) | 0.839 a |
| SRF (N, %) | 22 (33.33%) | 2 (5.26%) | 0.001 c* |
| DRIL (N, %) | 54 (81.82%) | 24 (63.16%) | 0.06 a |
| IRC (N, %) | 26 (39.39%) | 4 (10.53%) | 0.004 a* |
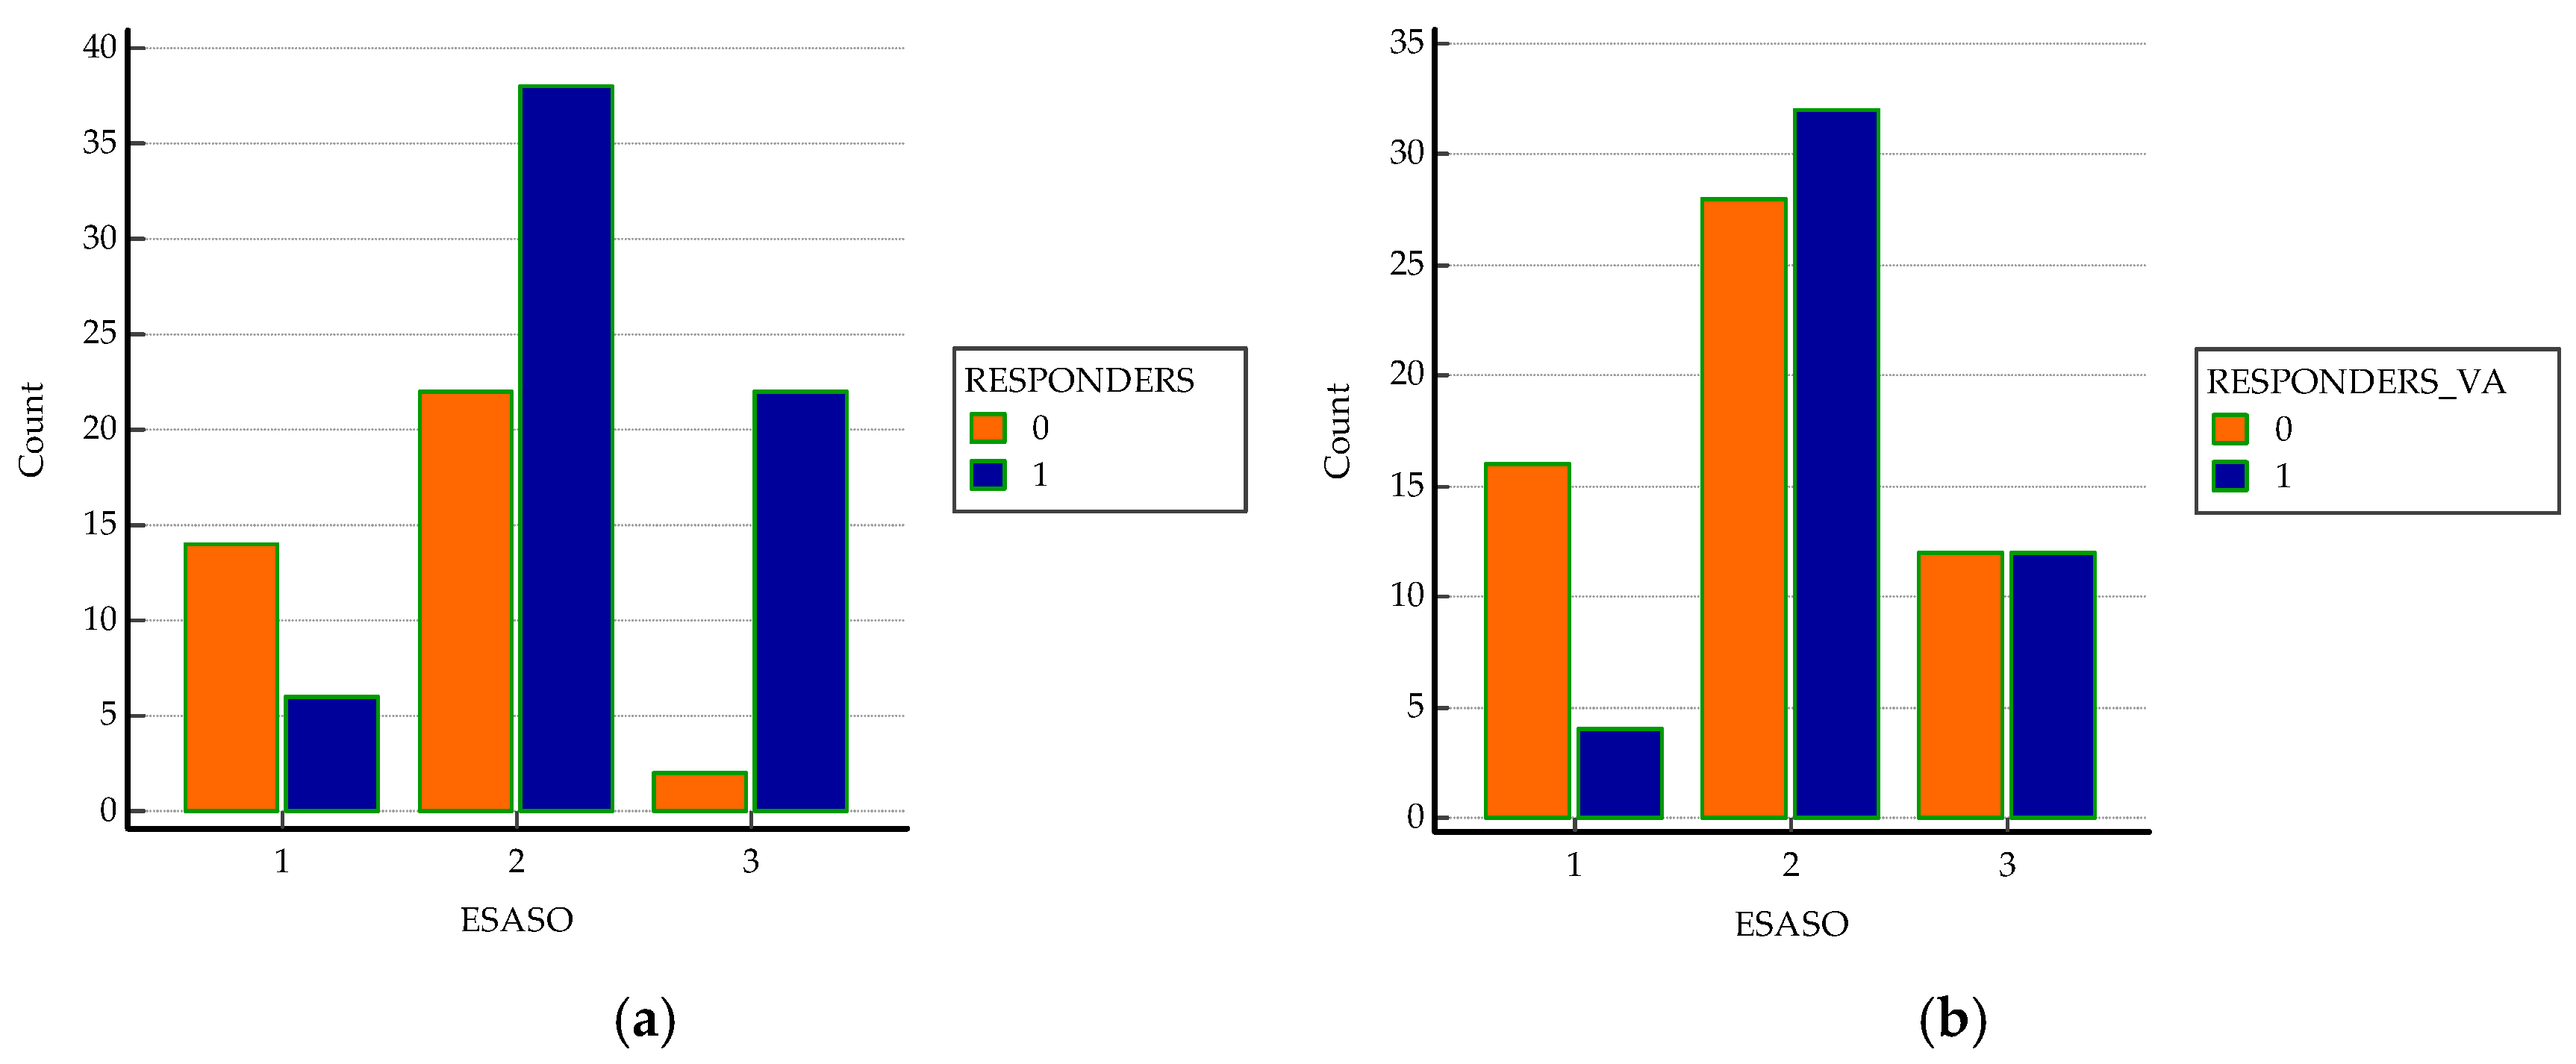
| ESASO grade (N, %) Early Advanced Severe Atrophic | 6 (9.09%) 38 (57.6%) 22 (33.3%) 0 (0%) | 14(36.8%) 22 (57.9%) 2 (5.3%) 0 (0%) | <0.0001 a* |
| Variable | AUC | SE | 95%CI | Specificity | Sensitivity | Cut-Off Value |
|---|---|---|---|---|---|---|
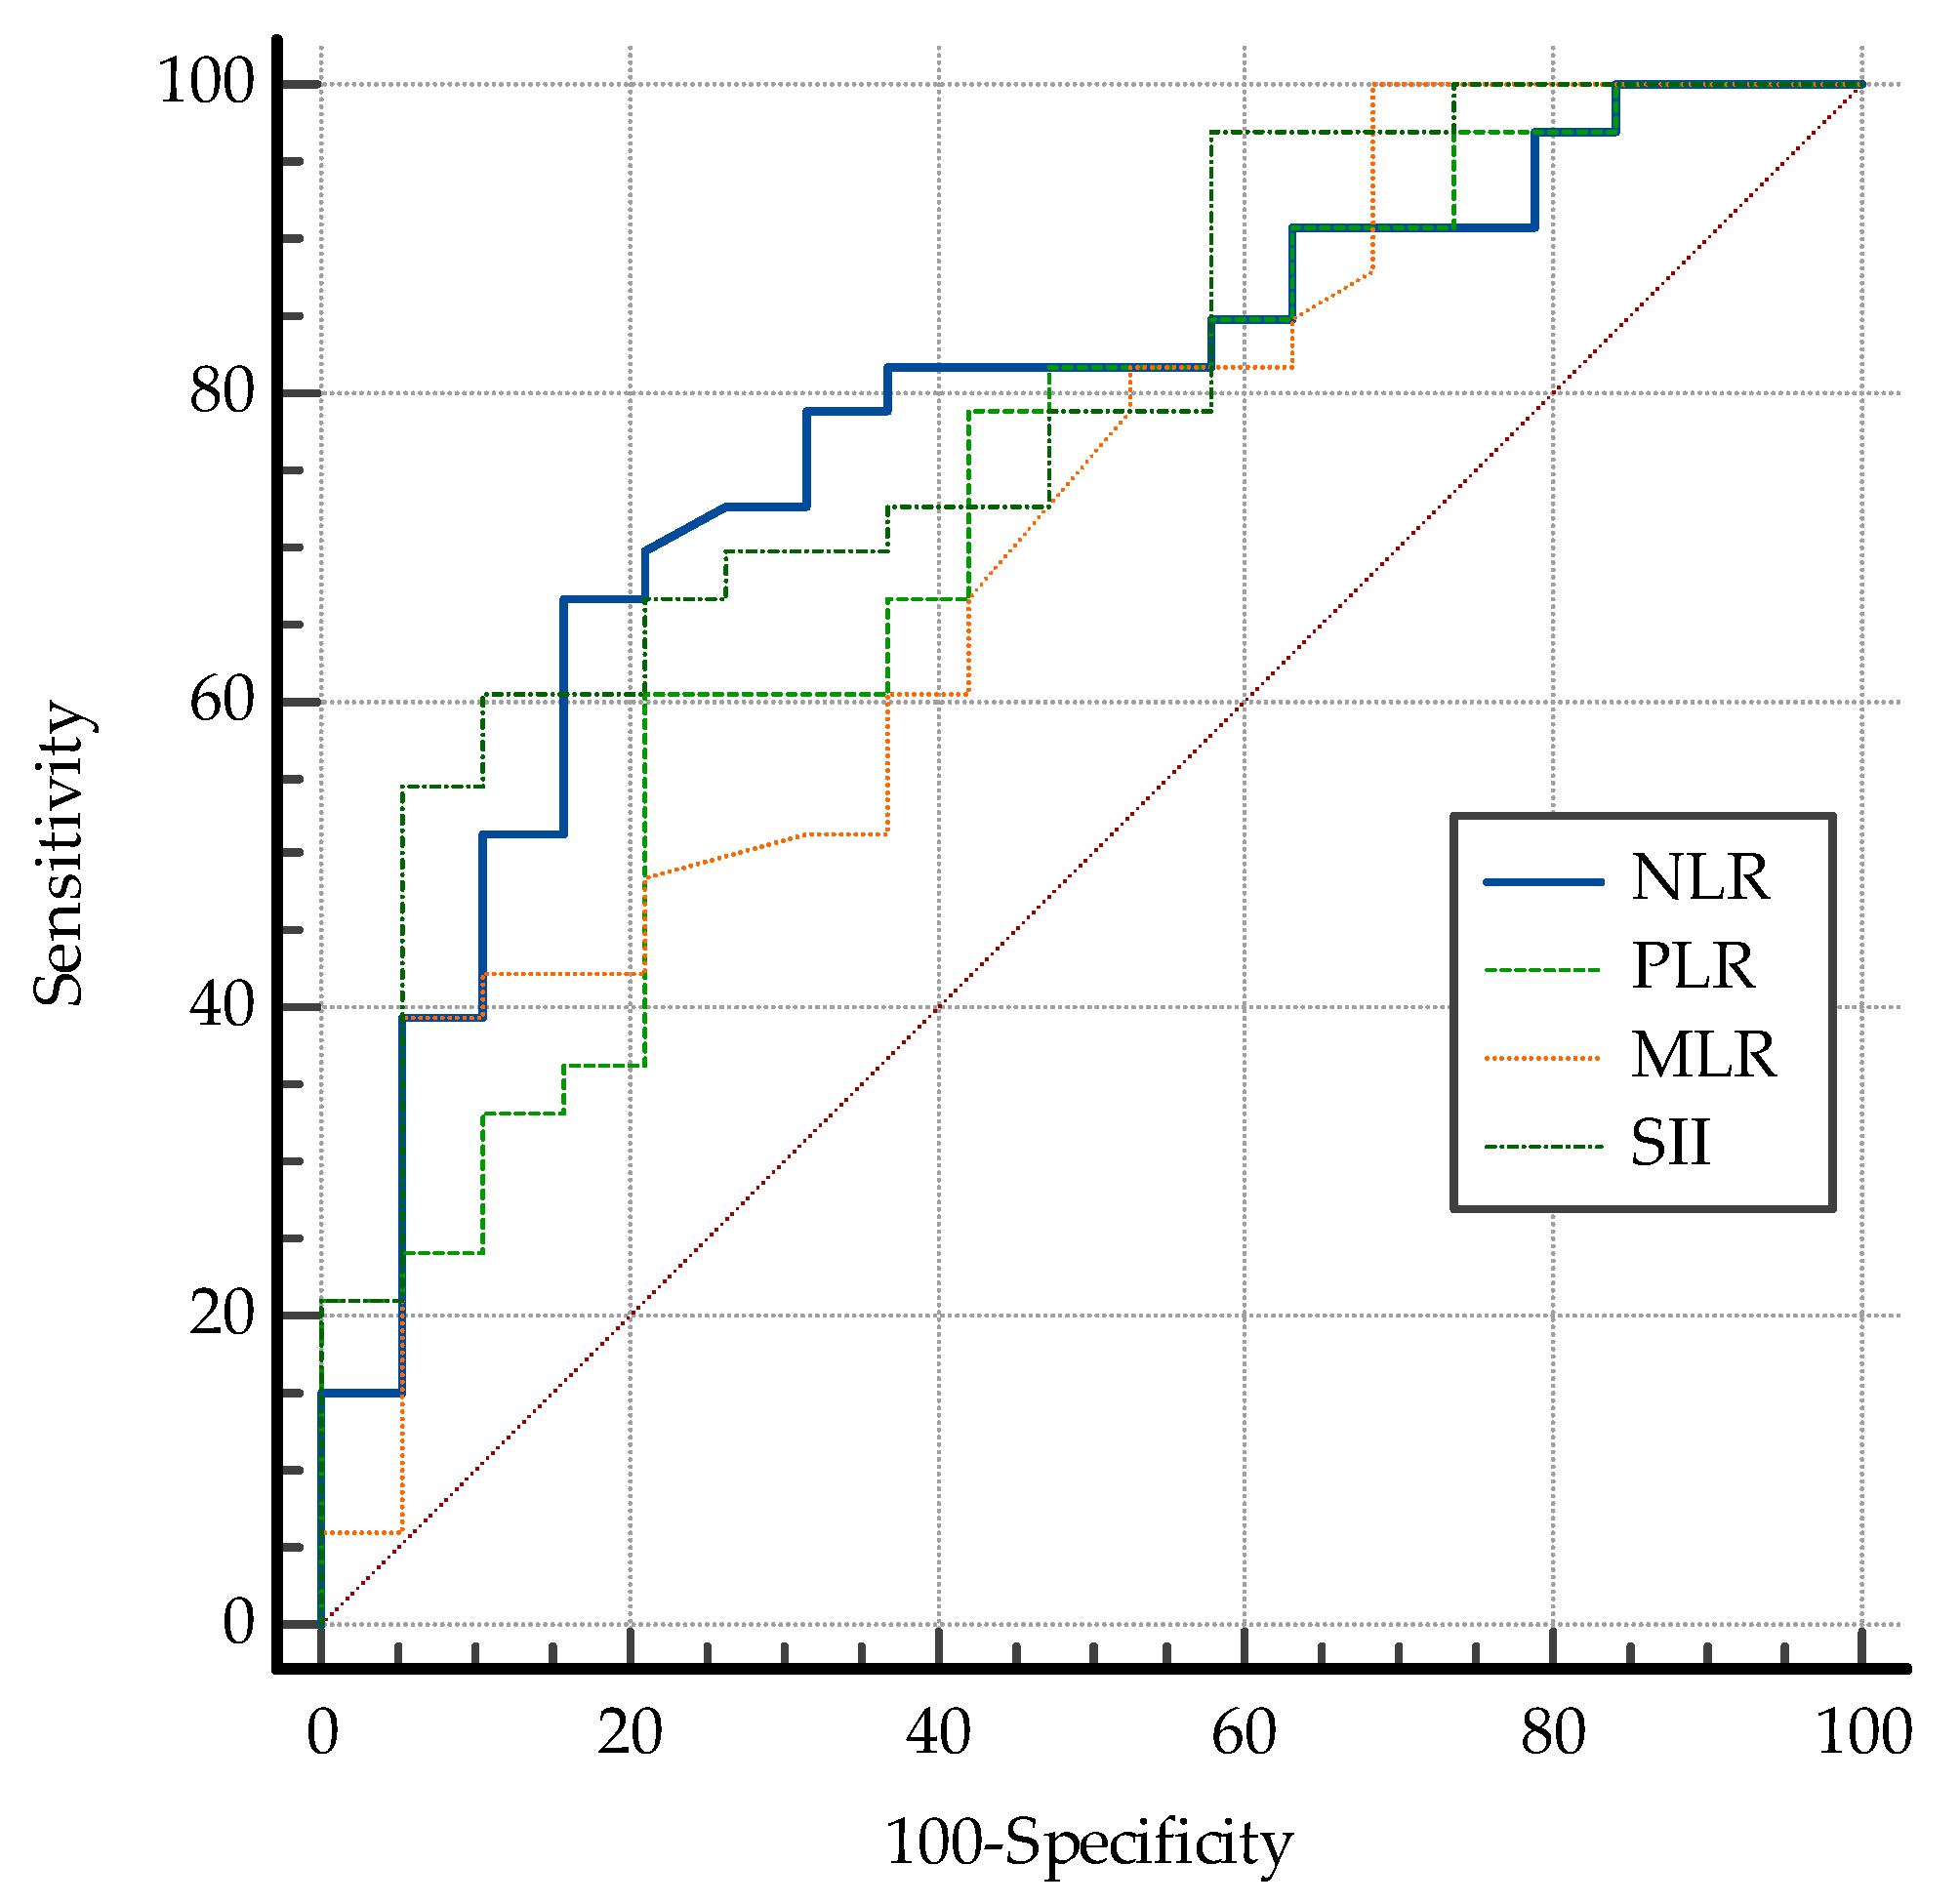
| NLR | 0.778 | 0.0471 | 0.685 to 0.853 | 84.2 | 66.67 | ≤2.32 |
| PLR | 0.719 | 0.0522 | 0.623 to 0.803 | 78.9 | 60.5 | ≤120.55 |
| MLR | 0.704 | 0.0535 | 0.607 to 0.790 | 94.7 | 39.4 | ≤0.21 |
| SII | 0.788 | 0.0451 | 0.697 to 0.862 | 89.5 | 60.6 | ≤543.53 |
| Variable | AUC | SE | 95% CI | Specificity | Sensitivity | Cut-Off Value |
|---|---|---|---|---|---|---|
| Initial CMT | 0.818 | 0.0415 | 0.730 to 0.887 | 73.70 | 78.80 | >388 |
| SRF | 0.640 | 0.0345 | 0.540 to 0.732 | 94.71 | 33.30 | >0 |
| IRC | 0.644 | 0.0394 | 0.544 to 0.736 | 89.47 | 39.39 | >0 |
| DRIL | 0.593 | 0.0463 | 0.493 to 0.689 | 36.84 | 81.82 | >0 |
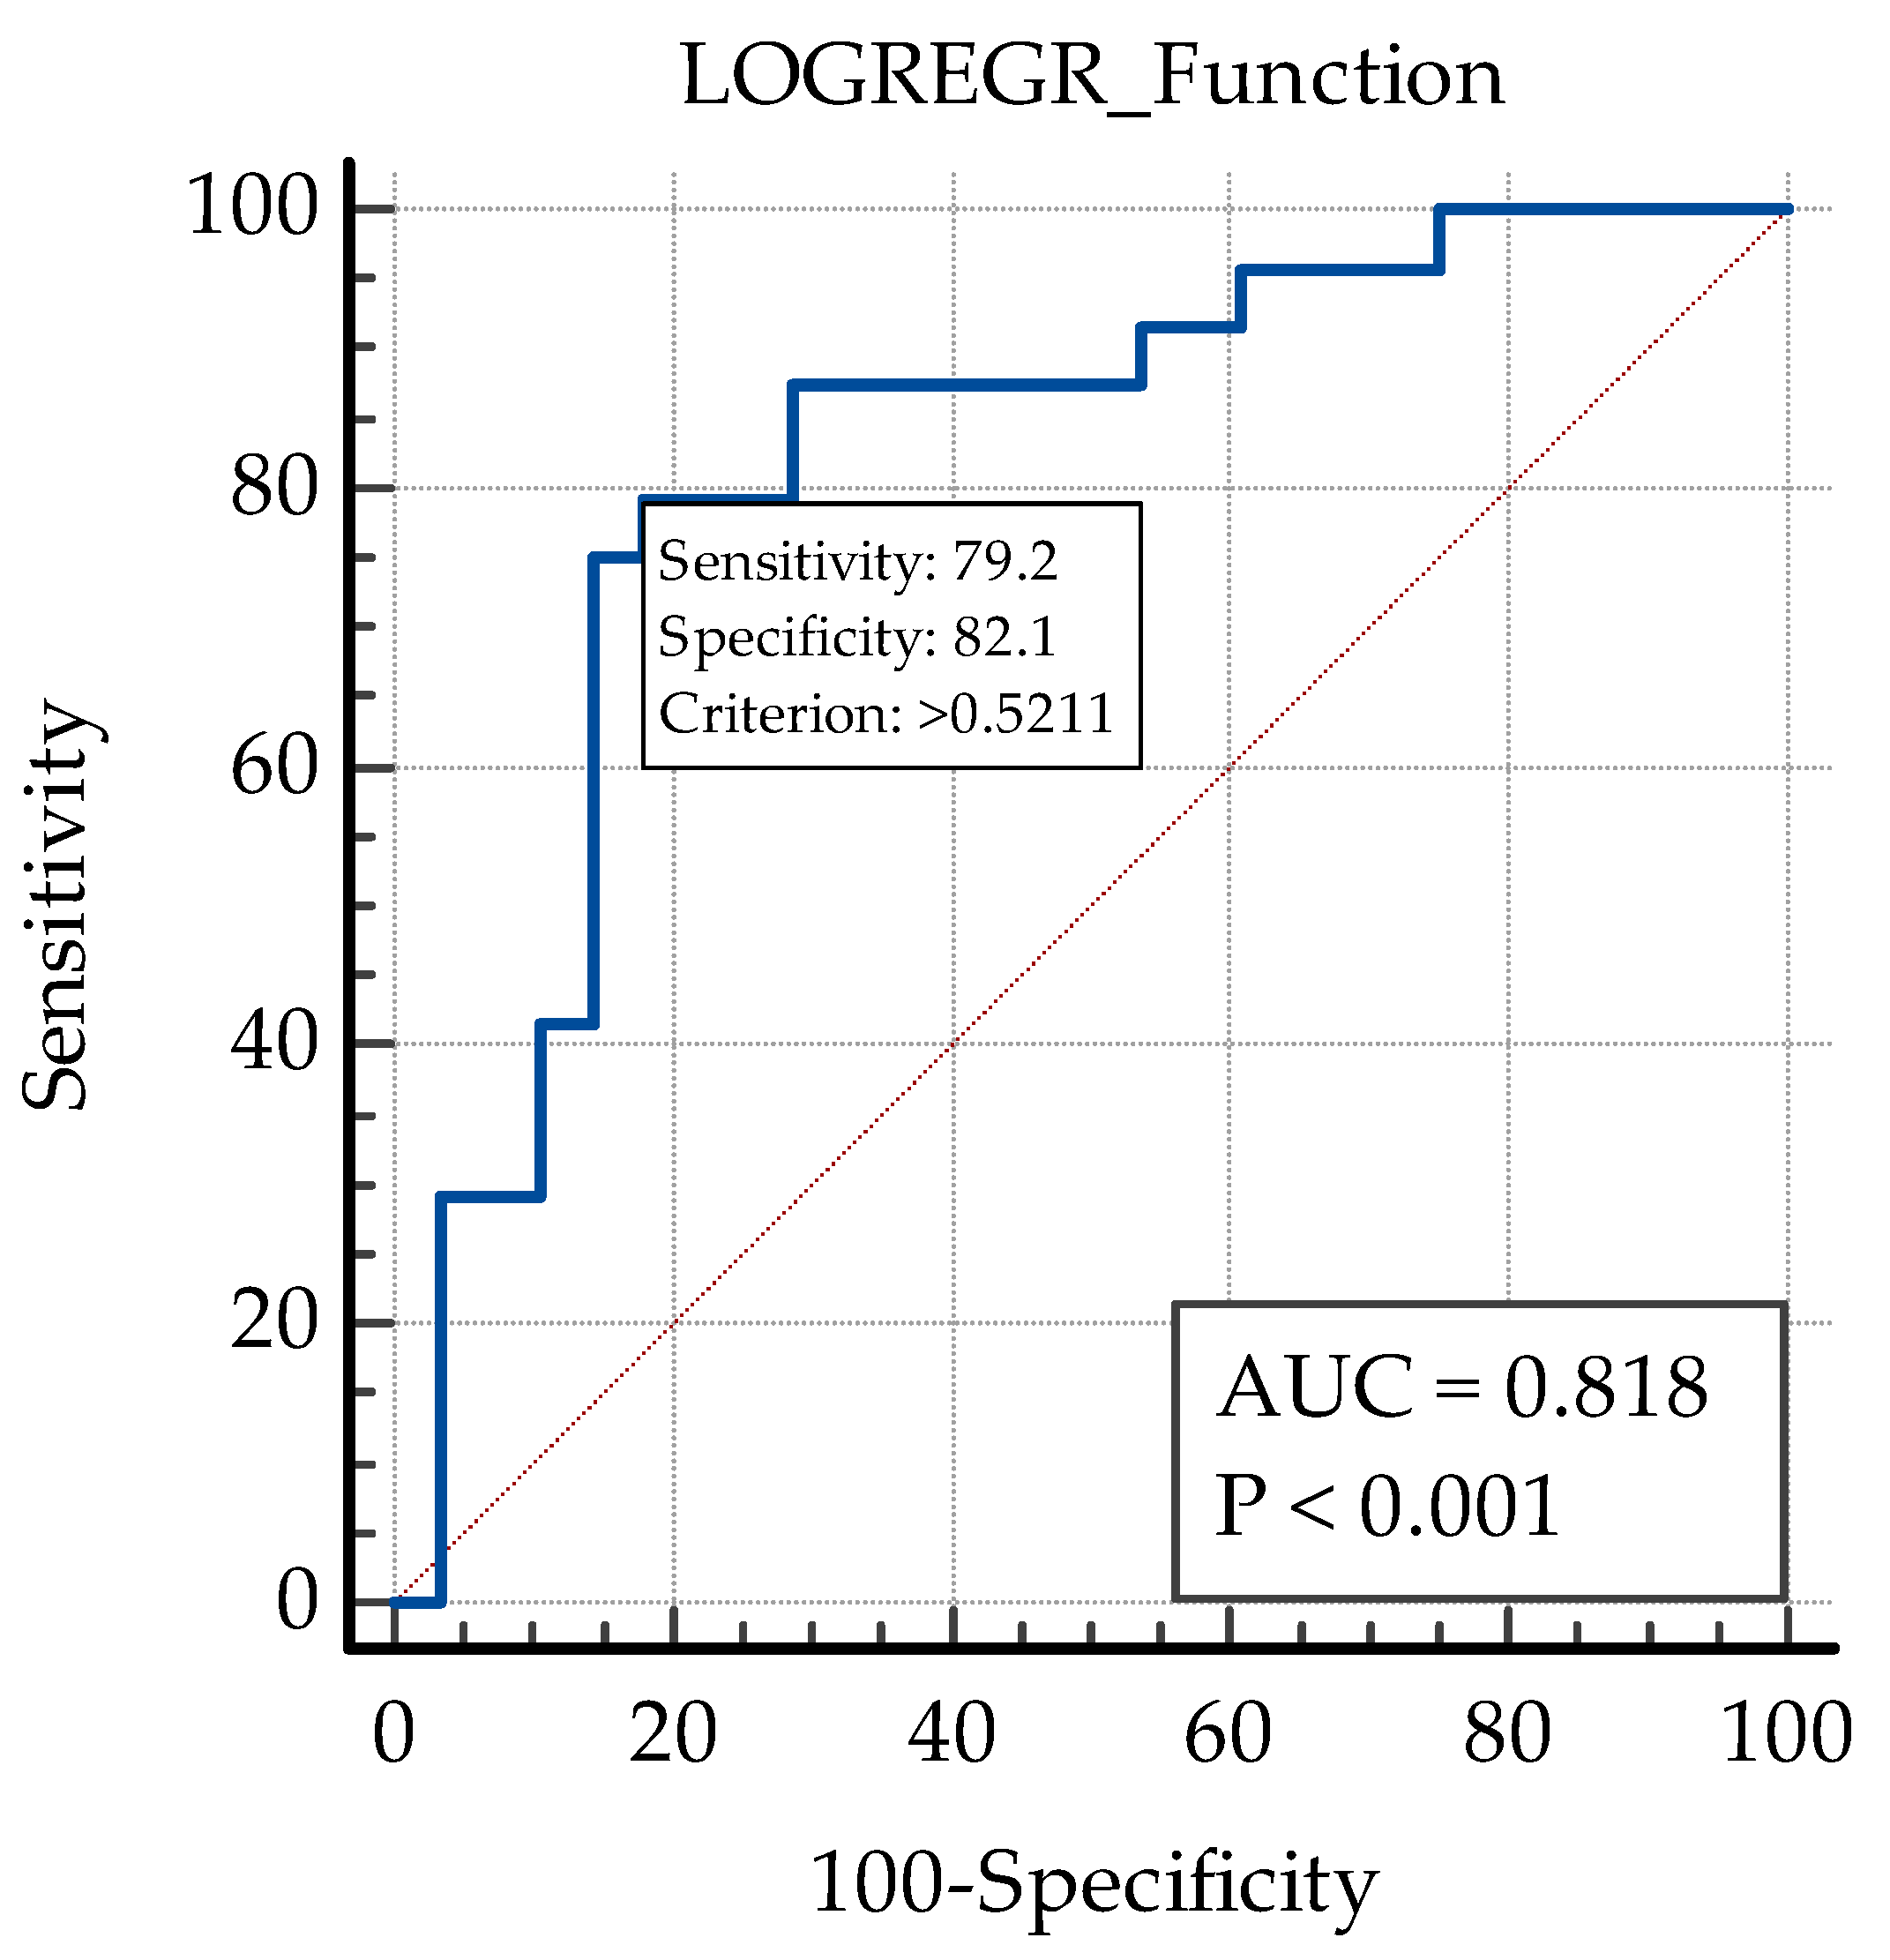
| Variable | Coefficient | Std. Error | Wald | p |
|---|---|---|---|---|
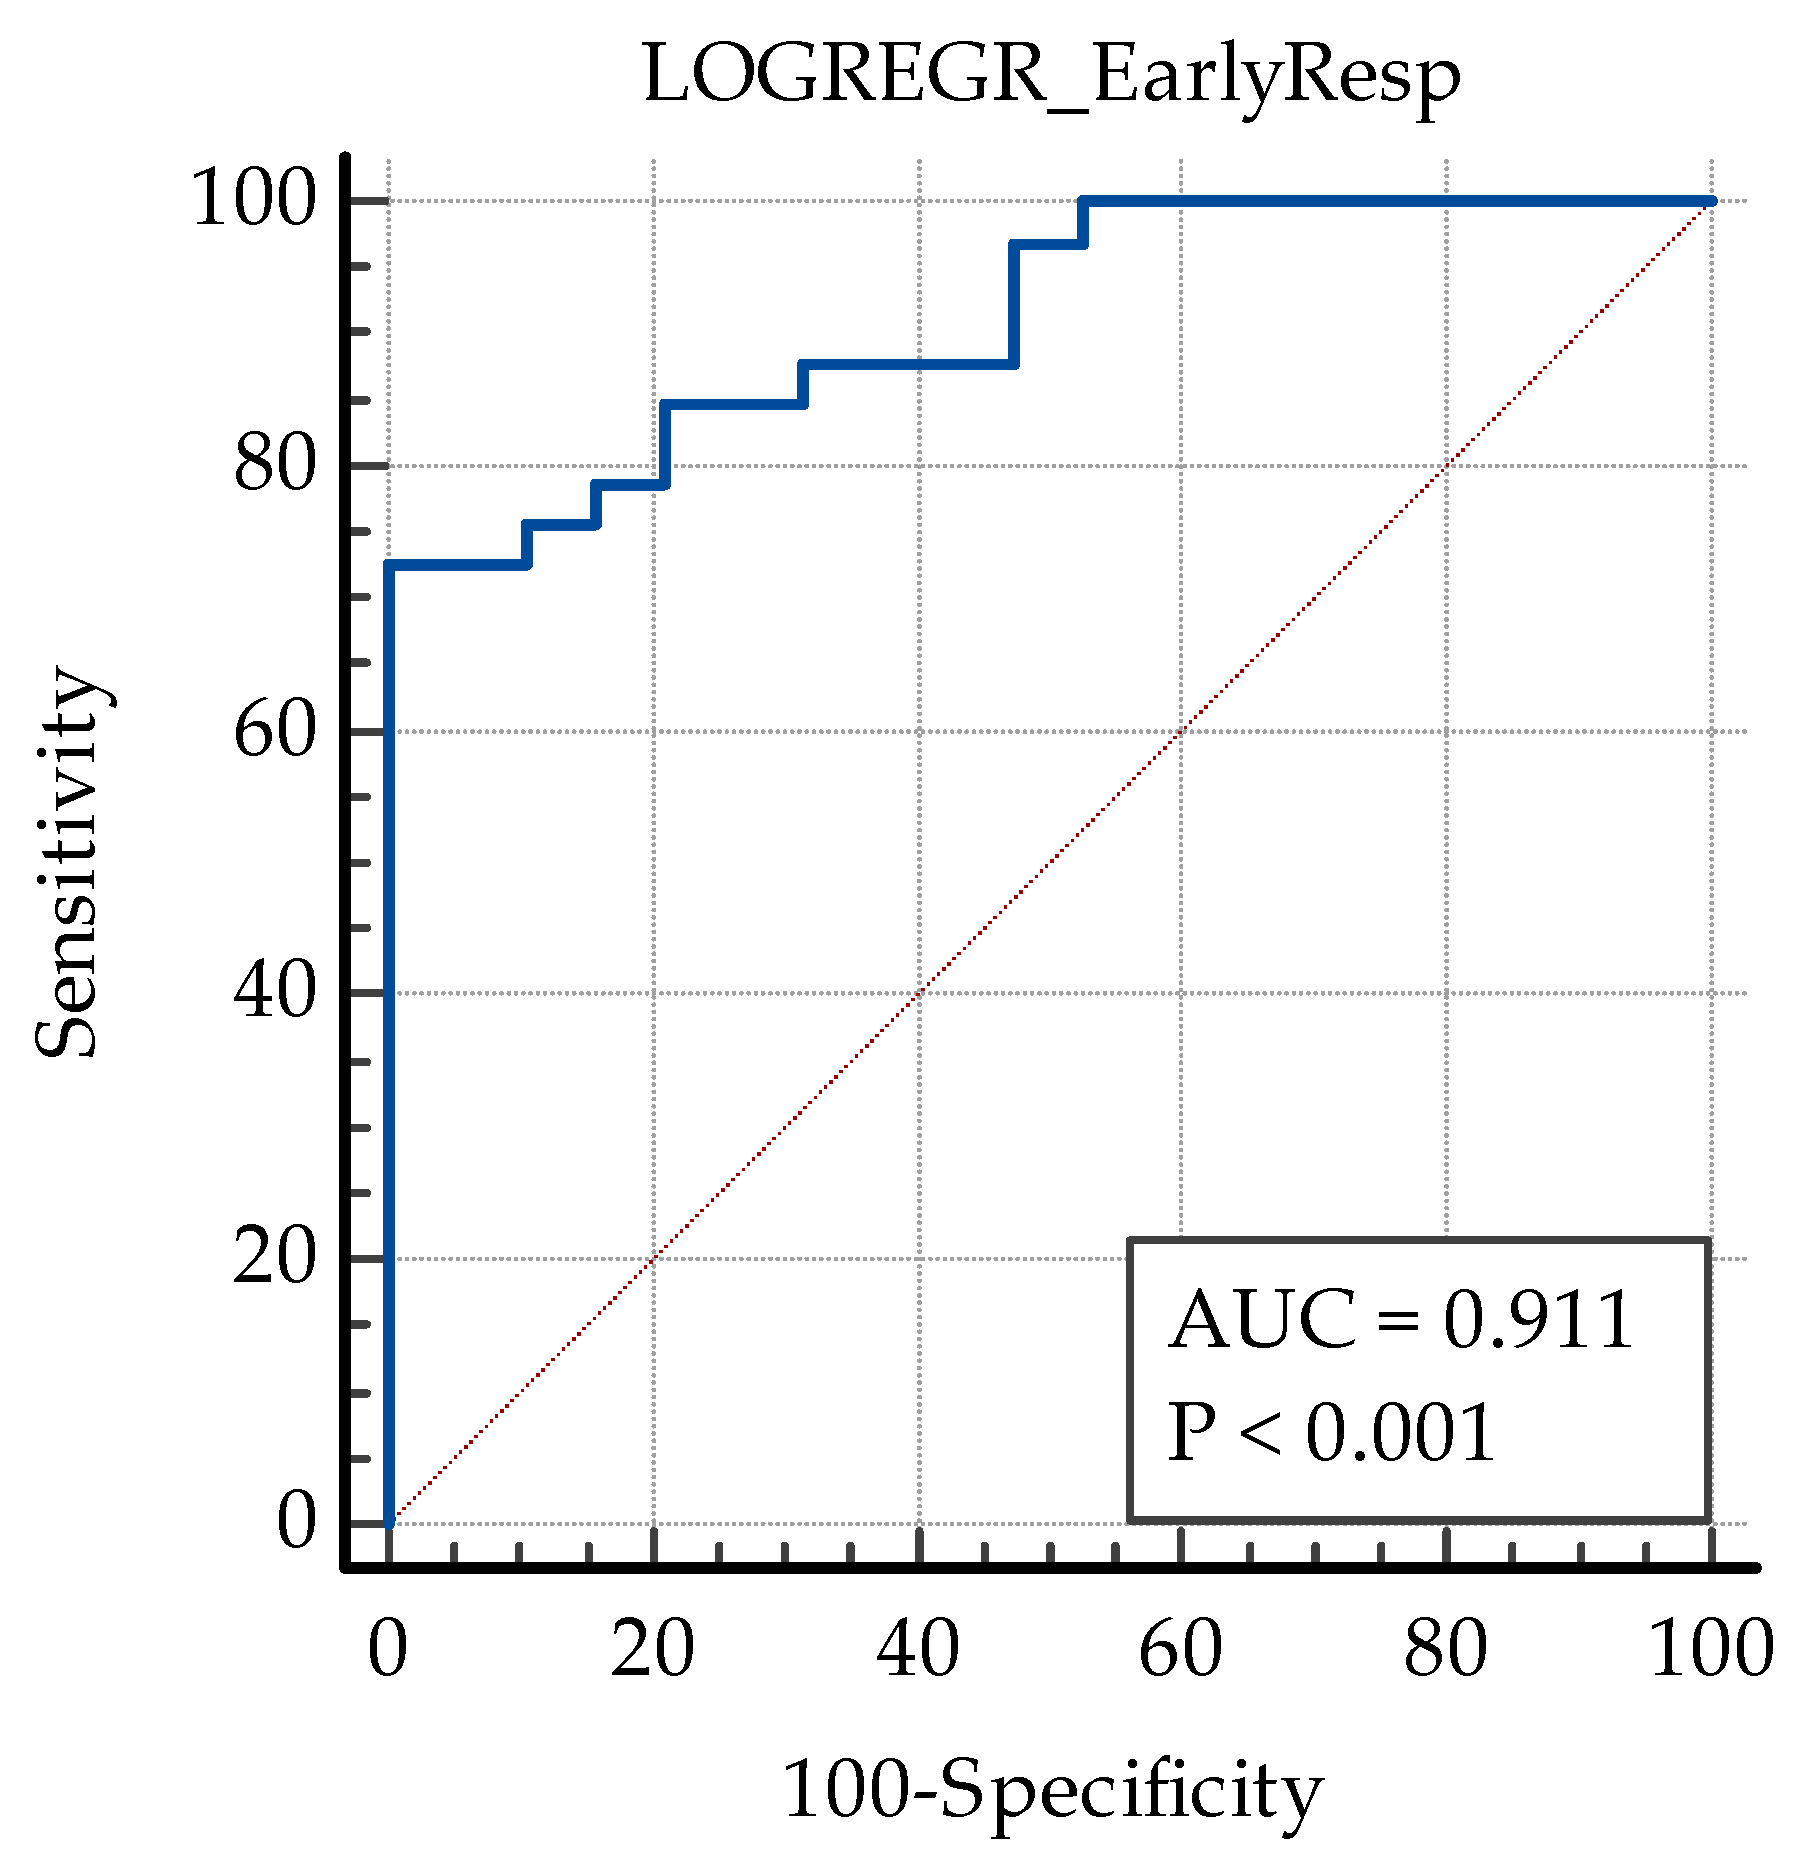
| Initial CMT | 0.011465 | 0.0033608 | 11.6368 | 0.0006 |
| SII | −0.0063546 | 0.0016831 | 14.2546 | 0.0002 |
| IRC | 2.05223 | 0.95954 | 4.5743 | 0.0325 |
| Constant | −0.32010 | 1.40766 | 0.05171 | 0.8201 |
| Variable | Coefficient | Std. Error | Wald | p |
|---|---|---|---|---|
| PLR | −0.014675 | 0.0051203 | 8.2142 | 0.0042 |
| HRS | −1.77681 | 0.49220 | 13.0318 | 0.0003 |
| DRIL | 1.16247 | 0.55797 | 4.3405 | 0.0372 |
| SRF | 1.16709 | 0.55406 | 4.4370 | 0.0352 |
| Constant | 1.58203 | 0.92866 | 2.9021 | 0.0885 |
Disclaimer/Publisher’s Note: The statements, opinions and data contained in all publications are solely those of the individual author(s) and contributor(s) and not of MDPI and/or the editor(s). MDPI and/or the editor(s) disclaim responsibility for any injury to people or property resulting from any ideas, methods, instructions or products referred to in the content. |
© 2025 by the authors. Licensee MDPI, Basel, Switzerland. This article is an open access article distributed under the terms and conditions of the Creative Commons Attribution (CC BY) license (https://creativecommons.org/licenses/by/4.0/).
Share and Cite
Ergin, E.; Dascalu, A.M.; Stana, D.; Tribus, L.C.; Arsene, A.L.; Nedea, M.I.; Serban, D.; Nistor, C.E.; Tudor, C.; Dumitrescu, D.; et al. Predictive Role of Complete Blood Count-Derived Inflammation Indices and Optical Coherence Tomography Biomarkers for Early Response to Intravitreal Anti-VEGF in Diabetic Macular Edema. Biomedicines 2025, 13, 1308. https://doi.org/10.3390/biomedicines13061308
Ergin E, Dascalu AM, Stana D, Tribus LC, Arsene AL, Nedea MI, Serban D, Nistor CE, Tudor C, Dumitrescu D, et al. Predictive Role of Complete Blood Count-Derived Inflammation Indices and Optical Coherence Tomography Biomarkers for Early Response to Intravitreal Anti-VEGF in Diabetic Macular Edema. Biomedicines. 2025; 13(6):1308. https://doi.org/10.3390/biomedicines13061308
Chicago/Turabian StyleErgin, Ece, Ana Maria Dascalu, Daniela Stana, Laura Carina Tribus, Andreea Letitia Arsene, Marina Ionela Nedea, Dragos Serban, Claudiu Eduard Nistor, Corneliu Tudor, Dan Dumitrescu, and et al. 2025. "Predictive Role of Complete Blood Count-Derived Inflammation Indices and Optical Coherence Tomography Biomarkers for Early Response to Intravitreal Anti-VEGF in Diabetic Macular Edema" Biomedicines 13, no. 6: 1308. https://doi.org/10.3390/biomedicines13061308
APA StyleErgin, E., Dascalu, A. M., Stana, D., Tribus, L. C., Arsene, A. L., Nedea, M. I., Serban, D., Nistor, C. E., Tudor, C., Dumitrescu, D., Stoica, P. L., & Cristea, B. M. (2025). Predictive Role of Complete Blood Count-Derived Inflammation Indices and Optical Coherence Tomography Biomarkers for Early Response to Intravitreal Anti-VEGF in Diabetic Macular Edema. Biomedicines, 13(6), 1308. https://doi.org/10.3390/biomedicines13061308