
Texture Analysis of 68Ga-DOTATOC PET/CT Images for the Prediction of Outcome in Patients with Neuroendocrine Tumors

 , ,
, ,  and
and
Abstract
1. Introduction
2. Materials and Methods
2.1. Patients
2.2. 68Ga-DOTATOC Labeling
2.3. 68Ga-DOTATOC Study
2.4. 68Ga-DOTATOC Image Analysis
2.5. Statistical Analysis
3. Results
4. Discussion
5. Conclusions
Author Contributions
Funding
Institutional Review Board Statement
Informed Consent Statement
Data Availability Statement
Conflicts of Interest
Abbreviations
| 68Ga-DOTATOC PET/CT | 68Gallium-DOTATOC Positron Emission Tomography/Computed Tomography |
| NET | Neuroendocrine Tumors |
| SUVmax | Maximum Standardized Uptake Value |
| SUVmean | Mean Standardized Uptake Value |
| RETV | Receptor-expressing Tumor Volume |
| TLRE | Total Lesion Receptor Expression |
| wbRETV | Whole-body Receptor-expressing Tumor Volume |
| wbTLRE | Whole-body Total Lesion Receptor Expression |
| CoV | Coefficient of Variation |
| HISTO Skewness | Histogram Skewness |
| HISTO Kurtosis | Histogram Kurtosis |
| HISTO Entropy-log10 | Histogram Entropy-log10 |
| GLCM Entropy-log10 | Gray Level Co-Occurrence Matrix Entropy-log10 |
| GLCM Dissimilarity | Gray Level Co-Occurrence Matrix Dissimilarity |
| NGLDM Coarseness | Neighborhood Gray-Level Difference Matrix Coarseness |
| OS | Overall Survival |
| SSTRs | Somatostatin Receptors |
| VOI | Volume of Interest |
| SD | Standard Deviation |
| ROC | Receiver-Operating Characteristic |
| SZE | Short Zone Emphasis |
References
- Das, S.; Dasari, A. Epidemiology, Incidence, and Prevalence of Neuroendocrine Neoplasms: Are There Global Differences? Curr. Oncol. Rep. 2021, 23, 43. [Google Scholar] [CrossRef] [PubMed]
- Hallet, J.; Law, C.H.; Cukier, M.; Saskin, R.; Liu, N.; Singh, S. Exploring the rising incidence of neuroendocrine tumors: A population-based analysis of epidemiology, metastatic presentation, and outcomes. Cancer 2015, 121, 589–597. [Google Scholar] [CrossRef]
- Capdevila, J.; Grande, E.; García-Carbonero, R.; Simó, M.; Del Olmo-García, M.I.; Jiménez-Fonseca, P.; Carmona-Bayonas, A.; Poul, V. Position Statement on the Diagnosis, Treatment, and Response Evaluation to Systemic Therapies of Advanced Neuroendocrine Tumors, With a Special Focus on Radioligand Therapy. Oncologist 2022, 27, e328–e339. [Google Scholar] [CrossRef]
- Ambrosini, V.; Kunikowska, J.; Baudin, E.; Bodei, L.; Bouvier, C.; Capdevila, J.; Cremonesi, M.; de Herder, W.W.; Dromain, C.; Falconi, M.; et al. Consensus on molecular imaging and theranostics in neuroendocrine neoplasms. Eur. J. Cancer 2021, 146, 56–73. [Google Scholar] [CrossRef]
- Iravani, A.; Parihar, A.S.; Akhurst, T.; Hicks, R.J. Molecular imaging phenotyping for selecting and monitoring radioligand therapy of neuroendocrine neoplasms. Cancer Imaging 2022, 22, 25. [Google Scholar] [CrossRef]
- Sundin, A.; Arnold, R.; Baudin, E.; Cwikla, J.B.; Eriksson, B.; Fanti, S.; Fazio, N.; Giammarile, F.; Hicks, R.J.; Kjaer, A.; et al. ENETS Consensus Guidelines for the Standards of Care in Neuroendocrine Tumors: Radiological, Nuclear Medicine & Hybrid Imaging. Neuroendocrinology 2017, 105, 212–244. [Google Scholar]
- Klomp, M.J.; Dalm, S.U.; de Jong, M.; Feelders, R.A.; Hofland, J.; Hofland, L.J. Epigenetic regulation of somatostatin and somatostatin receptors in neuroendocrine tumors and other types of cancer. Rev. Endocr. Metab. Disord. 2021, 22, 495–510. [Google Scholar] [CrossRef] [PubMed]
- Taelman, V.F.; Radojewski, P.; Marincek, N.; Ben-Shlomo, A.; Grotzky, A.; Olariu, C.I.; Perren, A.; Stettler, C.; Krause, T.; Meier, L.P.; et al. Upregulation of Key Molecules for Targeted Imaging and Therapy. J. Nucl. Med. 2016, 57, 1805–1810. [Google Scholar] [CrossRef]
- Barnett, P. Somatostatin and somatostatin receptor physiology. Endocrine 2003, 20, 255–264. [Google Scholar] [CrossRef]
- Reubi, J.C.; Waser, B. Concomitant expression of several peptide receptors in neuroendocrine tumours: Molecular basis for in vivo multireceptor tumour targeting. Eur. J. Nucl. Med. Mol. Imaging 2003, 30, 781–793. [Google Scholar] [CrossRef]
- Hope, T.A.; Allen-Auerbach, M.; Bodei, L.; Calais, J.; Dahlbom, M.; Dunnwald, L.K.; Graham, M.M.; Jacene, H.A.; Heath, C.L.; Mittra, E.S.; et al. SNMMI Procedure Standard/EANM Practice Guideline for SSTR PET: Imaging Neuroendocrine Tumors. J. Nucl. Med. 2023, 64, 204–210. [Google Scholar] [CrossRef]
- Park, S.; Parihar, A.S.; Bodei, L.; Hope, T.A.; Mallak, N.; Millo, C.; Prasad, K.; Wilson, D.; Zukotynski, K.; Mittra, E. Somatostatin Receptor Imaging and Theranostics: Current Practice and Future Prospects. J. Nucl. Med. 2021, 62, 1323–1329. [Google Scholar] [CrossRef] [PubMed]
- Sharma, R.; Wang, W.M.; Yusuf, S.; Evans, J.; Ramaswami, R.; Wernig, F.; Frilling, A.; Mauri, F.; Al-Nahhas, A.; Aboagye, E.O.; et al. 68Ga-DOTATATE PET/CT parameters predict response to peptide receptor radionuclide therapy in neuroendocrine tumours. Radiother. Oncol. 2019, 141, 108–115. [Google Scholar] [CrossRef] [PubMed]
- Chan, D.L.; Hayes, A.R.; Karfis, I.; Conner, A.; Furtado O’Mahony, L.; Mileva, M.; Bernard, E.; Roach, P.; Marin, G.; Pavlakis, N.; et al. Dual [68Ga]DOTATATE and [18F]FDG PET/CT in patients with metastatic gastroenteropancreatic neuroendocrine neoplasms: A multicentre validation of the NETPET score. Br. J. Cancer 2023, 128, 549–555. [Google Scholar] [CrossRef]
- Strosberg, J.; El-Haddad, G.; Wolin, E.; Hendifar, A.; Yao, J.; Chasen, B.; Mittra, E.; Kunz, P.L.; Kulke, M.H.; Jacene, H.; et al. Phase 3 Trial of 177Lu-Dotatate for Midgut Neuroendocrine Tumors. N. Engl. J. Med. 2017, 376, 125–135. [Google Scholar] [CrossRef]
- Singh, S.; Halperin, D.; Myrehaug, S.; Herrmann, K.; Pavel, M.; Kunz, P.L.; Chasen, B.; Tafuto, S.; Lastoria, S.; Capdevila, J.; et al. [177Lu]Lu-DOTA-TATE plus long-acting octreotide versus high-dose long-acting octreotide for the treatment of newly diagnosed, advanced grade 2-3, well-differentiated, gastroenteropancreatic neuroendocrine tumours (NETTER-2): An open-label, randomised, phase 3 study. Lancet 2024, 403, 2807–2817. [Google Scholar]
- Fonti, R.; Panico, M.; Pellegrino, S.; Pulcrano, A.; Vastarella, L.A.; Torbati, A.H.M.; Giuliano, M.; Palmieri, G.; De Placido, S.; Del Vecchio, S. Heterogeneity of SSTR2 Expression Assessed by 68Ga-DOTATOC PET/CT Using Coefficient of Variation in Patients with Neuroendocrine Tumors. J. Nucl. Med. 2022, 63, 1509–1514. [Google Scholar] [CrossRef]
- Durmo, R.; Filice, A.; Fioroni, F.; Cervati, V.; Finocchiaro, D.; Coruzzi, C.; Besutti, G.; Fanello, S.; Frasoldati, A.; Versari, A. Predictive and Prognostic Role of Pre-Therapy and Interim 68Ga-DOTATOC PET/CT Parameters in Metastatic Advanced Neuroendocrine Tumor Patients Treated with PRRT. Cancers 2022, 14, 592. [Google Scholar] [CrossRef]
- Tirosh, A.; Papadakis, G.Z.; Millo, C.; Hammoud, D.; Sadowski, S.M.; Herscovitch, P.; Pacak, K.; Marx, S.J.; Yang, L.; Nockel, P.; et al. Prognostic Utility of Total 68Ga-DOTATATE-Avid Tumor Volume in Patients With Neuroendocrine Tumors. Gastroenterology 2018, 154, 998–1008. [Google Scholar] [CrossRef]
- Toriihara, A.; Baratto, L.; Nobashi, T.; Park, S.; Hatami, N.; Davidzon, G.; Kunz, P.L.; Iagaru, A. Prognostic value of somatostatin receptor expressing tumor volume calculated from 68Ga-DOTATATE PET/CT in patients with well-differentiated neuroendocrine tumors. Eur. J. Nucl. Med. Mol. Imaging 2019, 46, 2244–2251. [Google Scholar] [CrossRef]
- Weber, M.; Telli, T.; Kersting, D.; Seifert, R. Prognostic Implications of PET-Derived Tumor Volume and Uptake in Patients with Neuroendocrine Tumors. Cancers 2023, 15, 3581. [Google Scholar] [CrossRef] [PubMed]
- Gillies, R.J.; Kinahan, P.E.; Hricak, H. Radiomics: Images Are More than Pictures, They Are Data. Radiology 2016, 278, 563–577. [Google Scholar] [CrossRef]
- Staal, F.C.R.; Aalbersberg, E.A.; van der Velden, D.; Wilthagen, E.A.; Tesselaar, M.E.T.; Beets-Tan, R.G.H.; Maas, M. GEP-NET radiomics: A systematic review and radiomics quality score assessment. Eur. Radiol. 2022, 32, 7278–7294. [Google Scholar] [CrossRef]
- Balma, M.; Laudicella, R.; Gallio, E.; Gusella, S.; Lorenzon, L.; Peano, S.; Costa, R.P.; Rampado, O.; Farsad, M.; Evangelista, L.; et al. Applications of Artificial Intelligence and Radiomics in Molecular Hybrid Imaging and Theragnostics for Neuro-Endocrine Neoplasms (NENs). Life 2023, 13, 1647. [Google Scholar] [CrossRef]
- Wei, C.; Jiang, T.; Wang, K.; Gao, X.; Zhang, H.; Wang, X. GEP-NETs radiomics in action: A systematical review of applications and quality assessment. Clin. Transl. Imaging 2024, 12, 287–326. [Google Scholar] [CrossRef]
- Nioche, C.; Orlhac, F.; Boughdad, S.; Reuzé, S.; Goya-Outi, J.; Robert, C.; Pellot-Barakat, C.; Soussan, M.; Frouin, F.; Buvat, I. LIFEx: A Freeware for Radiomic Feature Calculation in Multimodality Imaging to Accelerate Advances in the Characterization of Tumor Heterogeneity. Cancer Res. 2018, 78, 4786–4789. [Google Scholar] [CrossRef]
- Mayerhoefer, M.E.; Materka, A.; Langs, G.; Häggström, I.; Szczypiński, P.; Gibbs, P.; Cook, G. Introduction to Radiomics. J. Nucl. Med. 2020, 61, 488–495. [Google Scholar] [CrossRef]
- Liberini, V.; De Santi, B.; Rampado, O.; Gallio, E.; Dionisi, B.; Ceci, F.; Polverari, G.; Thuillier, P.; Molinari, F.; Deandreis, D. Impact of segmentation and discretization on radiomic features in 68Ga-DOTA-TOC PET/CT images of neuroendocrine tumor. EJNMMI Phys. 2021, 8, 21. [Google Scholar] [CrossRef]
- Bailly, C.; Bodet-Milin, C.; Couespel, S.; Necib, H.; Kraeber-Bodéré, F.; Ansquer, C.; Carlier, T. Revisiting the Robustness of PET-Based Textural Features in the Context of Multi-Centric Trials. PLoS ONE 2016, 11, e0159984. [Google Scholar] [CrossRef]
- Mapelli, P.; Bezzi, C.; Muffatti, F.; Ghezzo, S.; Canevari, C.; Magnani, P.; Schiavo Lena, M.; Battistella, A.; Scifo, P.; Andreasi, V.; et al. Preoperative assessment of lymph nodal metastases with [68Ga]Ga-DOTATOC PET radiomics for improved surgical planning in well-differentiated pancreatic neuroendocrine tumours. Eur. J. Nucl. Med. Mol. Imaging 2024, 51, 2774–2783. [Google Scholar] [CrossRef]
- Gadens Zamboni, C.; Dundar, A.; Jain, S.; Kruzer, M.; Loeffler, B.T.; Graves, S.A.; Pollard, J.H.; Mott, S.L.; Dillon, J.S.; Graham, M.M.; et al. Inter- and intra-tumoral heterogeneity on [68Ga]Ga-DOTA-TATE/[68Ga]Ga-DOTA-TOC PET/CT predicts response to [177Lu]Lu-DOTA-TATE PRRT in neuroendocrine tumor patients. EJNMMI Rep. 2024, 8, 39. [Google Scholar] [CrossRef]
- Pellegrino, S.; Fonti, R.; Pulcrano, A.; Del Vecchio, S. PET-Based Volumetric Biomarkers for Risk Stratification of Non-Small Cell Lung Cancer Patients. Diagnostics 2021, 11, 210. [Google Scholar] [CrossRef]
- Chicklore, S.; Goh, V.; Siddique, M.; Roy, A.; Marsden, P.K.; Cook, G.J. Quantifying tumour heterogeneity in 18F-FDG PET/CT imaging by texture analysis. Eur. J. Nucl. Med. Mol. Imaging 2013, 40, 133–140. [Google Scholar] [CrossRef]
- Lovinfosse, P.; Hatt, M.; Visvikis, D.; Hustinx, R. Heterogeneity analysis of 18F-FDG PET imaging in oncology: Clinical indications and perspectives. Clin. Transl. Imaging 2018, 6, 393–410. [Google Scholar] [CrossRef]
- Pellegrino, S.; Origlia, D.; Di Donna, E.; Lamagna, M.; Della Pepa, R.; Pane, F.; Del Vecchio, S.; Fonti, R. Coefficient of variation and texture analysis of 18F-FDG PET/CT images for the prediction of outcome in patients with multiple myeloma. Ann. Hematol. 2024, 103, 3713–3721. [Google Scholar] [CrossRef]
- Pellegrino, S.; Fonti, R.; Vallone, C.; Morra, R.; Matano, E.; De Placido, S.; Del Vecchio, S. Coefficient of Variation in Metastatic Lymph Nodes Determined by 18F-FDG PET/CT in Patients with Advanced NSCLC: Combination with Coefficient of Variation in Primary Tumors. Cancers 2024, 16, 279. [Google Scholar] [CrossRef]
- Pellegrino, S.; Fonti, R.; Hakkak Moghadam Torbati, A.; Bologna, R.; Morra, R.; Damiano, V.; Matano, E.; De Placido, S.; Del Vecchio, S. Heterogeneity of Glycolytic Phenotype Determined by 18F-FDG PET/CT Using Coefficient of Variation in Patients with Advanced Non-Small Cell Lung Cancer. Diagnostics 2023, 13, 2448. [Google Scholar] [CrossRef]
- Piñeiro-Fiel, M.; Moscoso, A.; Pubul, V.; Ruibal, Á.; Silva-Rodríguez, J.; Aguiar, P. A Systematic Review of PET Textural Analysis and Radiomics in Cancer. Diagnostics 2021, 11, 380. [Google Scholar] [CrossRef]
- Werner, R.A.; Lapa, C.; Ilhan, H.; Higuchi, T.; Buck, A.K.; Lehner, S.; Bartenstein, P.; Bengel, F.; Schatka, I.; Muegge, D.O.; et al. Survival prediction in patients undergoing radionuclide therapy based on intratumoral somatostatin-receptor heterogeneity. Oncotarget 2017, 8, 7039–7049. [Google Scholar] [CrossRef]
- Atkinson, C.; Ganeshan, B.; Endozo, R.; Wan, S.; Aldridge, M.D.; Groves, A.M.; Bomanji, J.B.; Gaze, M.N. Radiomics-Based Texture Analysis of 68Ga-DOTATATE Positron Emission Tomography and Computed Tomography Images as a Prognostic Biomarker in Adults With Neuroendocrine Cancers Treated With 177Lu-DOTATATE. Front. Oncol. 2021, 11, 686235. [Google Scholar] [CrossRef]
- Bezzi, C.; Mapelli, P.; Presotto, L.; Neri, I.; Scifo, P.; Savi, A.; Bettinardi, V.; Partelli, S.; Gianolli, L.; Falconi, M.; et al. Radiomics in pancreatic neuroendocrine tumors: Methodological issues and clinical significance. Eur. J. Nucl. Med. Mol. Imaging 2021, 48, 4002–4015. [Google Scholar] [CrossRef] [PubMed]
- Saleh, M.; Bhosale, P.R.; Yano, M.; Itani, M.; Elsayes, A.K.; Halperin, D.; Bergsland, E.K.; Morani, A.C. New frontiers in imaging including radiomics updates for pancreatic neuroendocrine neoplasms. Abdom. Radiol. 2022, 47, 3078–3100. [Google Scholar] [CrossRef]
- Werner, R.A.; Ilhan, H.; Lehner, S.; Papp, L.; Zsótér, N.; Schatka, I.; Muegge, D.O.; Javadi, M.S.; Higuchi, T.; Buck, A.K.; et al. Pre-therapy Somatostatin Receptor-Based Heterogeneity Predicts Overall Survival in Pancreatic Neuroendocrine Tumor Patients Undergoing Peptide Receptor Radionuclide Therapy. Mol. Imaging Biol. 2019, 21, 582–590. [Google Scholar] [CrossRef]


| Characteristic | N° (%) |
|---|---|
| Patients | 47 |
| Age | |
| Mean ± SD | 62 ± 14 years |
| Range | 29–84 years |
| Gender | |
| Female | 16 (34%) |
| Male | 31 (66%) |
| Type of NET | |
| Gastroenteropancreatic | 35 (74%) |
| Broncopulmonary | 8 (17%) |
| Other | 4 (9%) |
| Grading | |
| G1 | 13 (27%) |
| G2 | 21 (45%) |
| G3 | 6 (13%) |
| Not determined | 7 (15%) |
| Ki67 (%) | |
| <3 | 13 (27%) |
| 3–20 | 21 (45%) |
| >20 | 6 (13%) |
| Not Determined | 7 (15%) |
| Staging | Patients |
| Primary tumor only | 19 (41%) |
| Primary tumor and metastatic lymph nodes | 11 (23%) |
| Primary tumor and distant metastatic lesions (with or without lymph node involvement) | 17 (36%) |
| Parameters | Mean ± SD | Range |
|---|---|---|
| SUVmax | 30.14 ± 20.65 | 4.78–157.23 |
| SUVmean | 9.29 ± 7.30 | 3.29–42.72 |
| RETV (ml) | 39.53 ± 66.32 | 1.5–387.84 |
| TLRE (g) | 425.30 ± 801.07 | 7.3–4776.19 |
| wbRETV (ml) | 106.04 ± 178.53 | 1.5–893.44 |
| wbTLRE (g) | 1588.19 ± 3954.70 | 7.3–21,534.20 |
| CoV | 0.55 ± 0.24 | 0.17–1.00 |
| HISTO Skewness | 1.17 ± 0.47 | 0.44–2.15 |
| HISTO Kurtosis | 4.07 ± 1.48 | 2.15–7.97 |
| HISTO Entropy-log10 | 0.95 ± 0.35 | 0.31–1.60 |
| GLCM Entropy-log10 | 1.76 ± 0.61 | 0.55–2.95 |
| GLCM Dissimilarity | 3.12 ± 2.66 | 0.36–10.91 |
| NGLDM Coarseness | 0.02 ± 0.01 | 0.001–0.069 |
| Variables | Overall Survival | |
|---|---|---|
| χ2 | p | |
| Age | 7.0610 | 0.0079 |
| Gender | 0.0329 | 0.8562 |
| Grading | 6.1230 | 0.0130 |
| SUVmax | 9.8830 | 0.0017 |
| SUVmean | 10.7180 | 0.0011 |
| RETV | 0.8030 | 0.3703 |
| TLRE | 3.2820 | 0.0700 |
| wbRETV | 0.0000123 | 0.9972 |
| wbTLRE | 0.7200 | 0.3962 |
| CoV | 8.4210 | 0.0037 |
| HISTO Skewness | 2.2160 | 0.1366 |
| HISTO Kurtosis | 1.5430 | 0.2142 |
| HISTO Entropy-log10 | 8.3500 | 0.0039 |
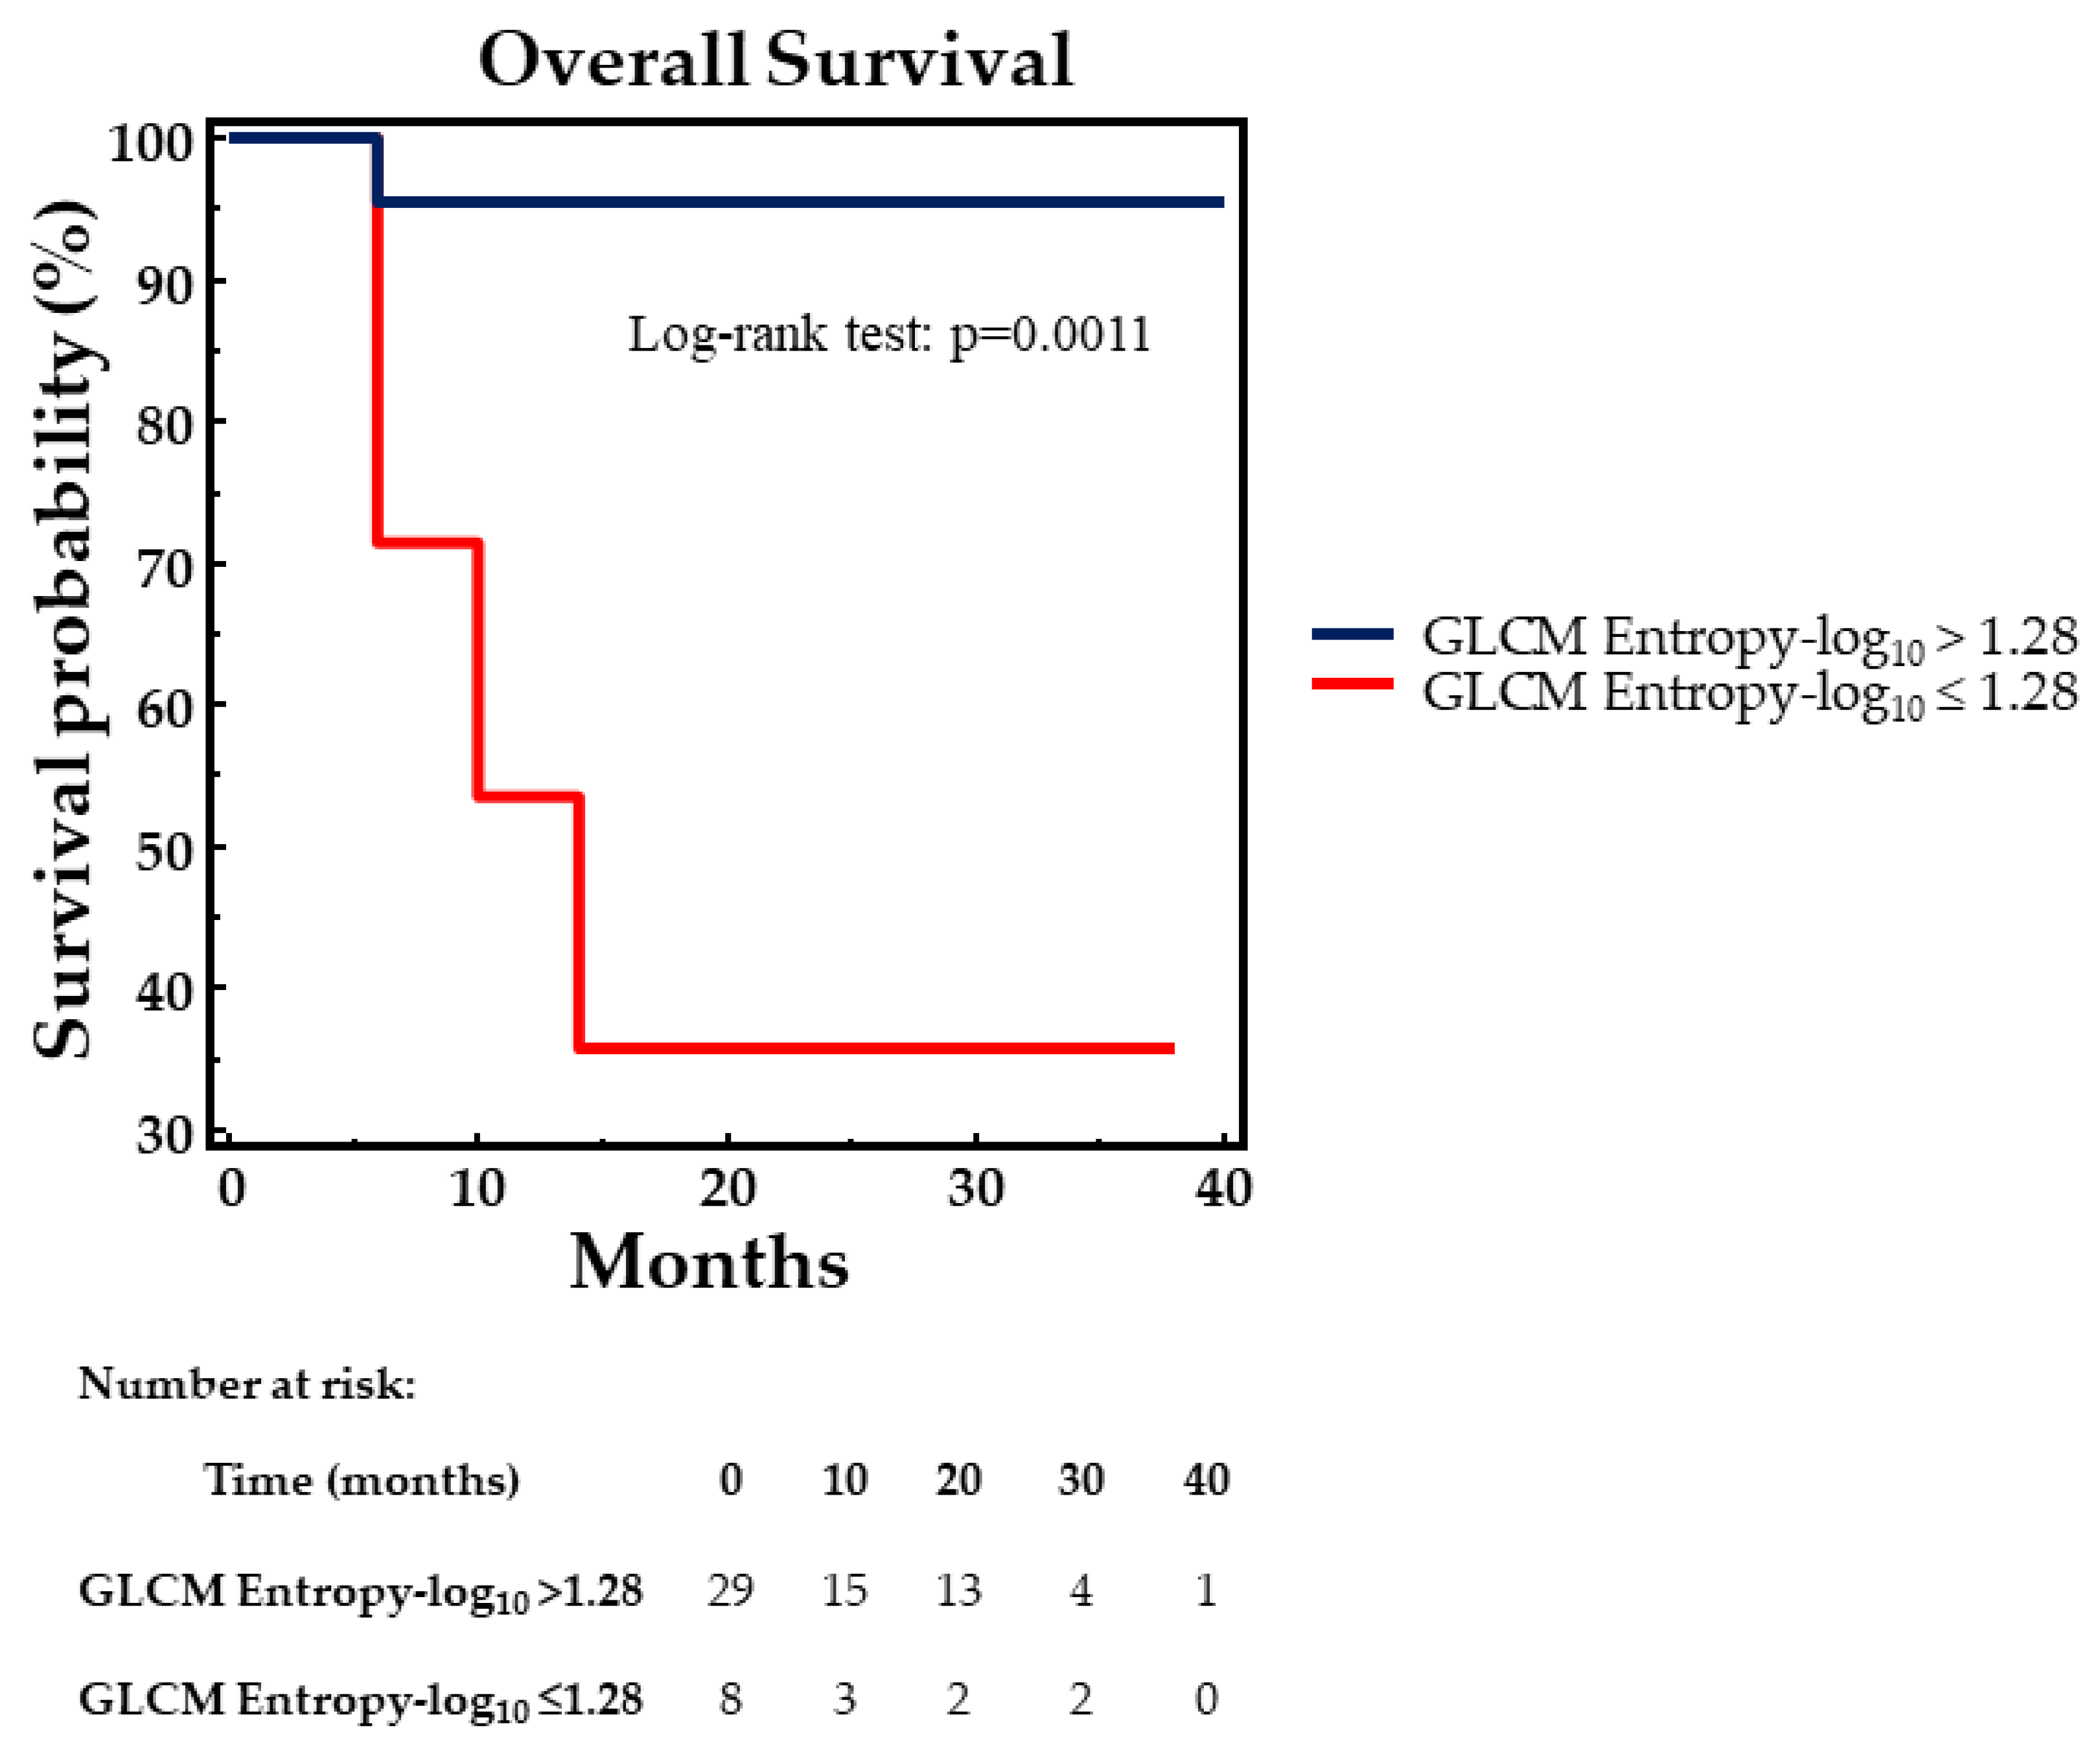
| GLCM Entropy-log10 | 8.1250 | 0.0044 |
| GLCM Dissimilarity | 7.4750 | 0.0063 |
| NGLDM Coarseness | 0.2210 | 0.6381 |
Disclaimer/Publisher’s Note: The statements, opinions and data contained in all publications are solely those of the individual author(s) and contributor(s) and not of MDPI and/or the editor(s). MDPI and/or the editor(s) disclaim responsibility for any injury to people or property resulting from any ideas, methods, instructions or products referred to in the content. |
© 2025 by the authors. Licensee MDPI, Basel, Switzerland. This article is an open access article distributed under the terms and conditions of the Creative Commons Attribution (CC BY) license (https://creativecommons.org/licenses/by/4.0/).
Share and Cite
Pellegrino, S.; Panico, M.; Bologna, R.; Morra, R.; Servetto, A.; Bianco, R.; Del Vecchio, S.; Fonti, R. Texture Analysis of 68Ga-DOTATOC PET/CT Images for the Prediction of Outcome in Patients with Neuroendocrine Tumors. Biomedicines 2025, 13, 1286. https://doi.org/10.3390/biomedicines13061286
Pellegrino S, Panico M, Bologna R, Morra R, Servetto A, Bianco R, Del Vecchio S, Fonti R. Texture Analysis of 68Ga-DOTATOC PET/CT Images for the Prediction of Outcome in Patients with Neuroendocrine Tumors. Biomedicines. 2025; 13(6):1286. https://doi.org/10.3390/biomedicines13061286
Chicago/Turabian StylePellegrino, Sara, Mariarosaria Panico, Roberto Bologna, Rocco Morra, Alberto Servetto, Roberto Bianco, Silvana Del Vecchio, and Rosa Fonti. 2025. "Texture Analysis of 68Ga-DOTATOC PET/CT Images for the Prediction of Outcome in Patients with Neuroendocrine Tumors" Biomedicines 13, no. 6: 1286. https://doi.org/10.3390/biomedicines13061286
APA StylePellegrino, S., Panico, M., Bologna, R., Morra, R., Servetto, A., Bianco, R., Del Vecchio, S., & Fonti, R. (2025). Texture Analysis of 68Ga-DOTATOC PET/CT Images for the Prediction of Outcome in Patients with Neuroendocrine Tumors. Biomedicines, 13(6), 1286. https://doi.org/10.3390/biomedicines13061286