
Experimental Models of Type 2 Diabetes Mellitus Induced by Combining Hyperlipidemic Diet (HFD) and Streptozotocin Administration in Rats: An Integrative Review

 , , , ,
  ,
,  , and
, and 
Abstract
1. Introduction
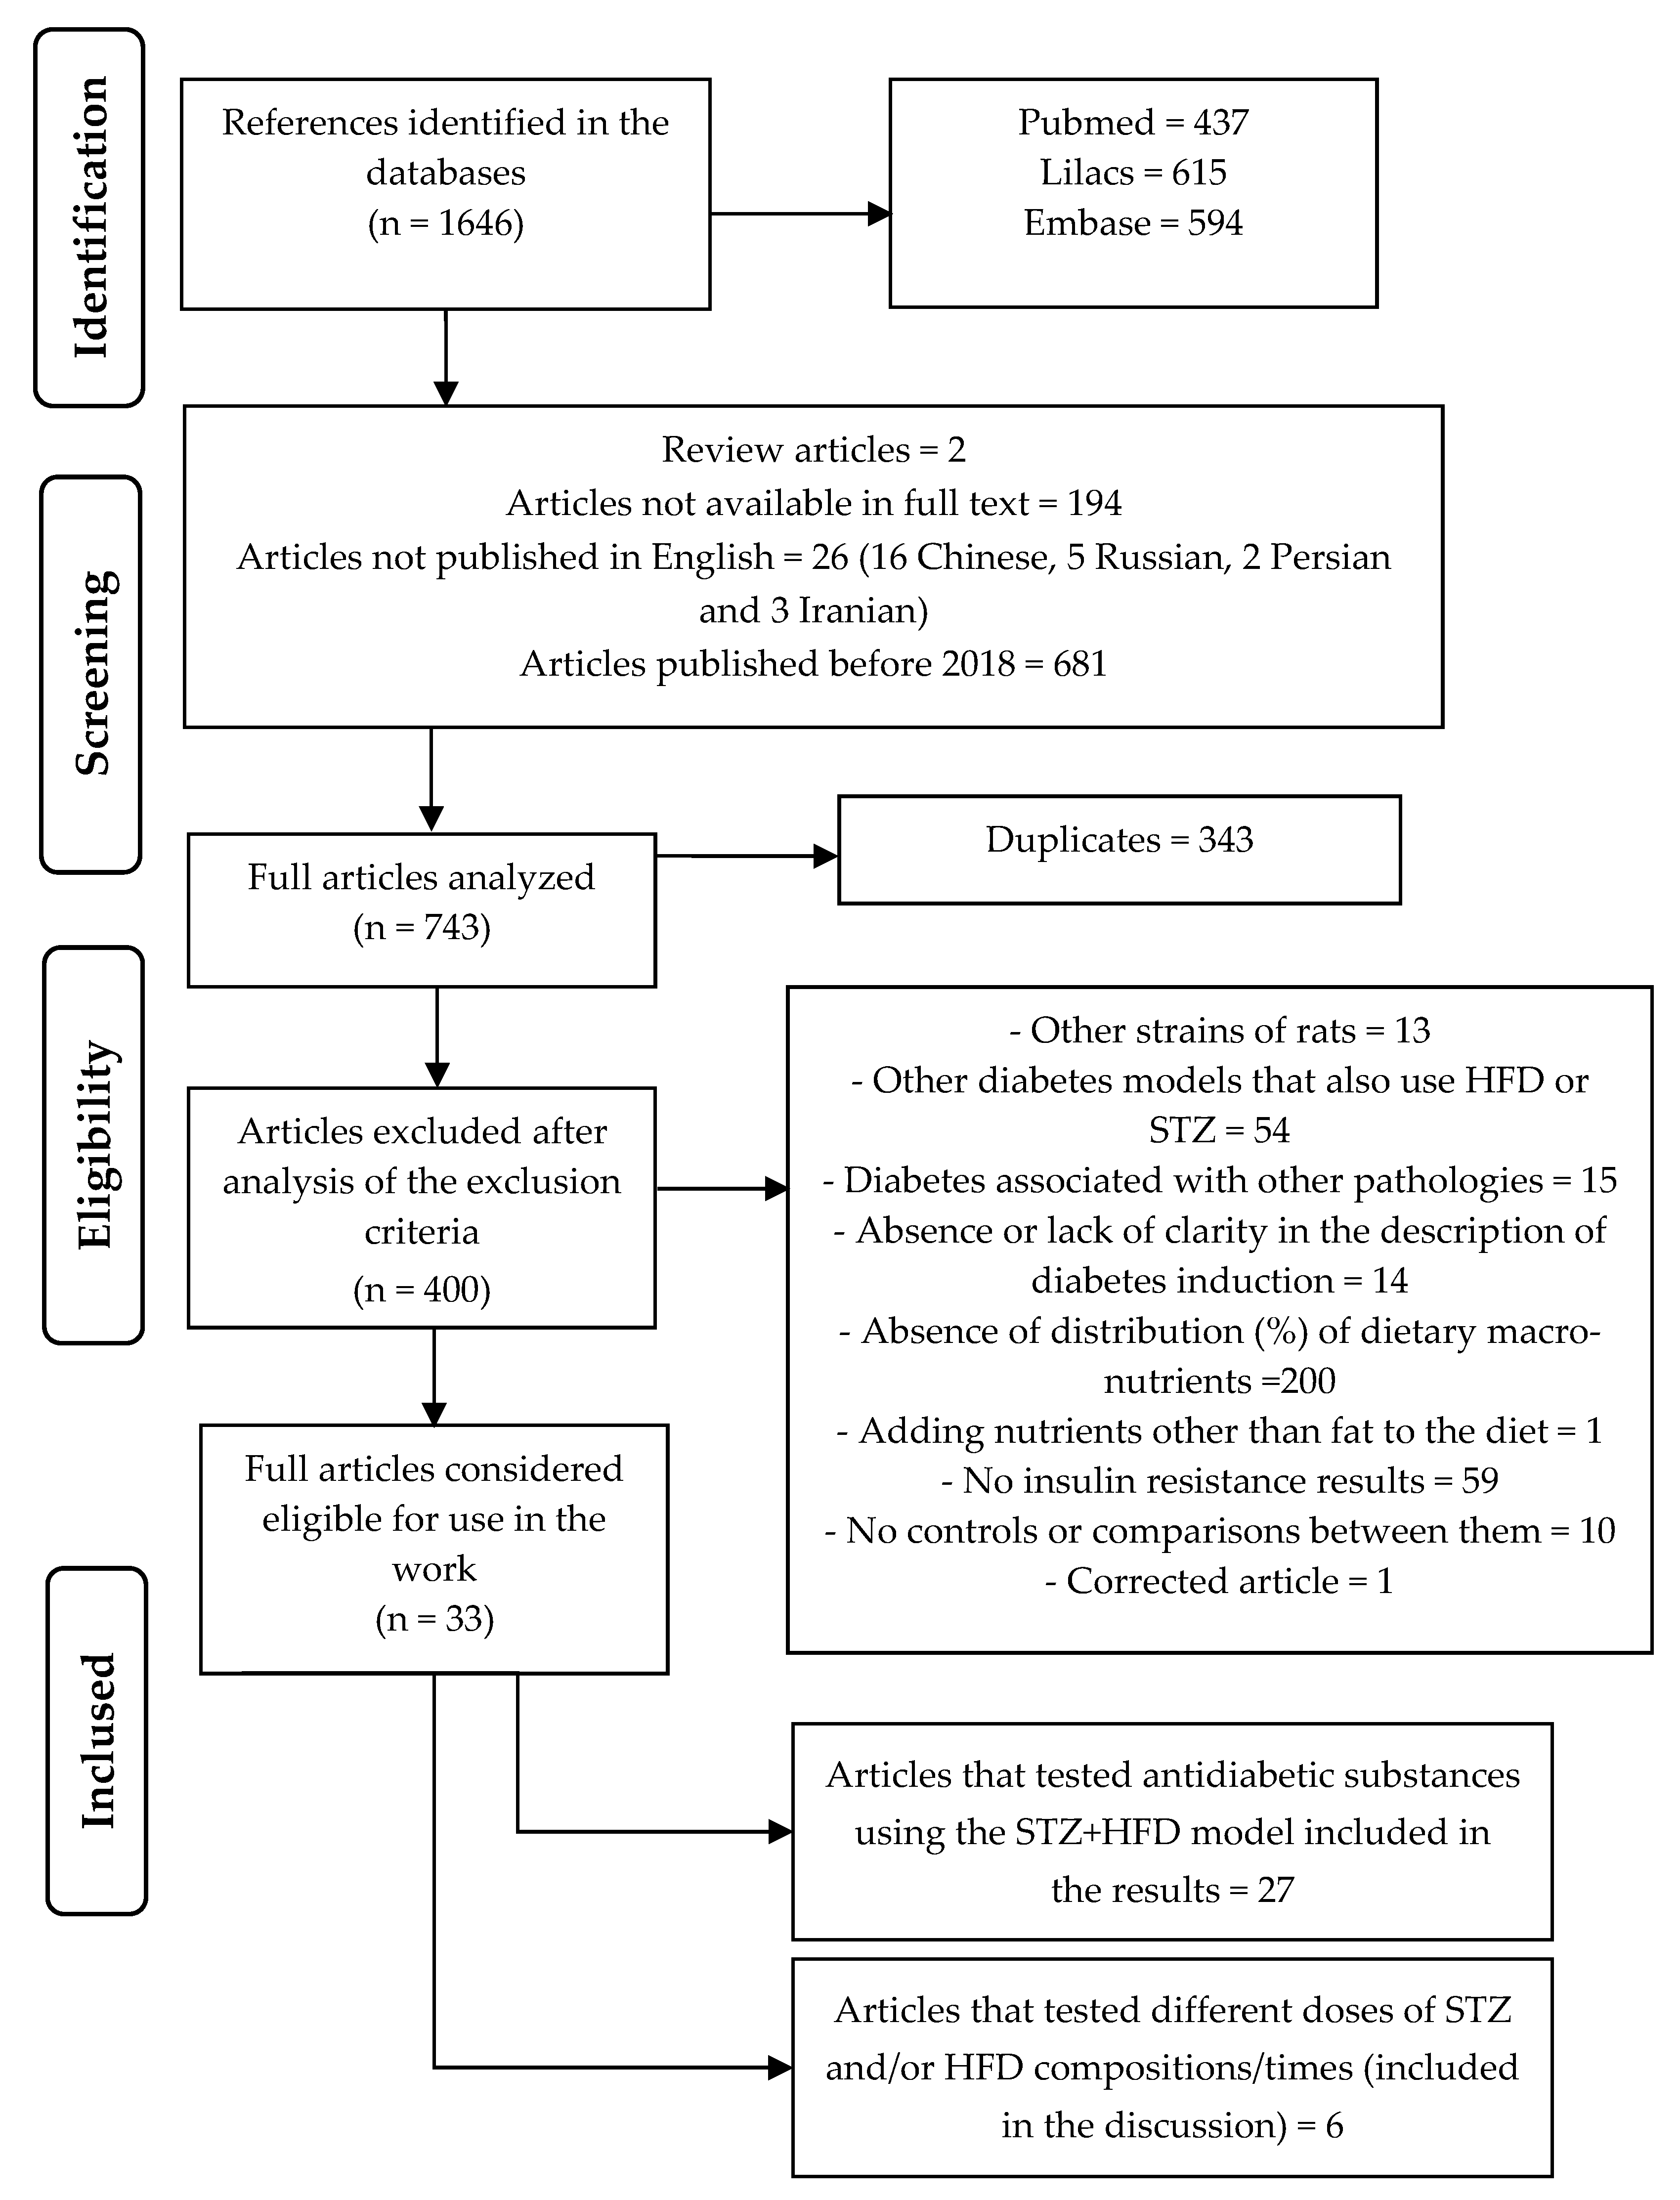
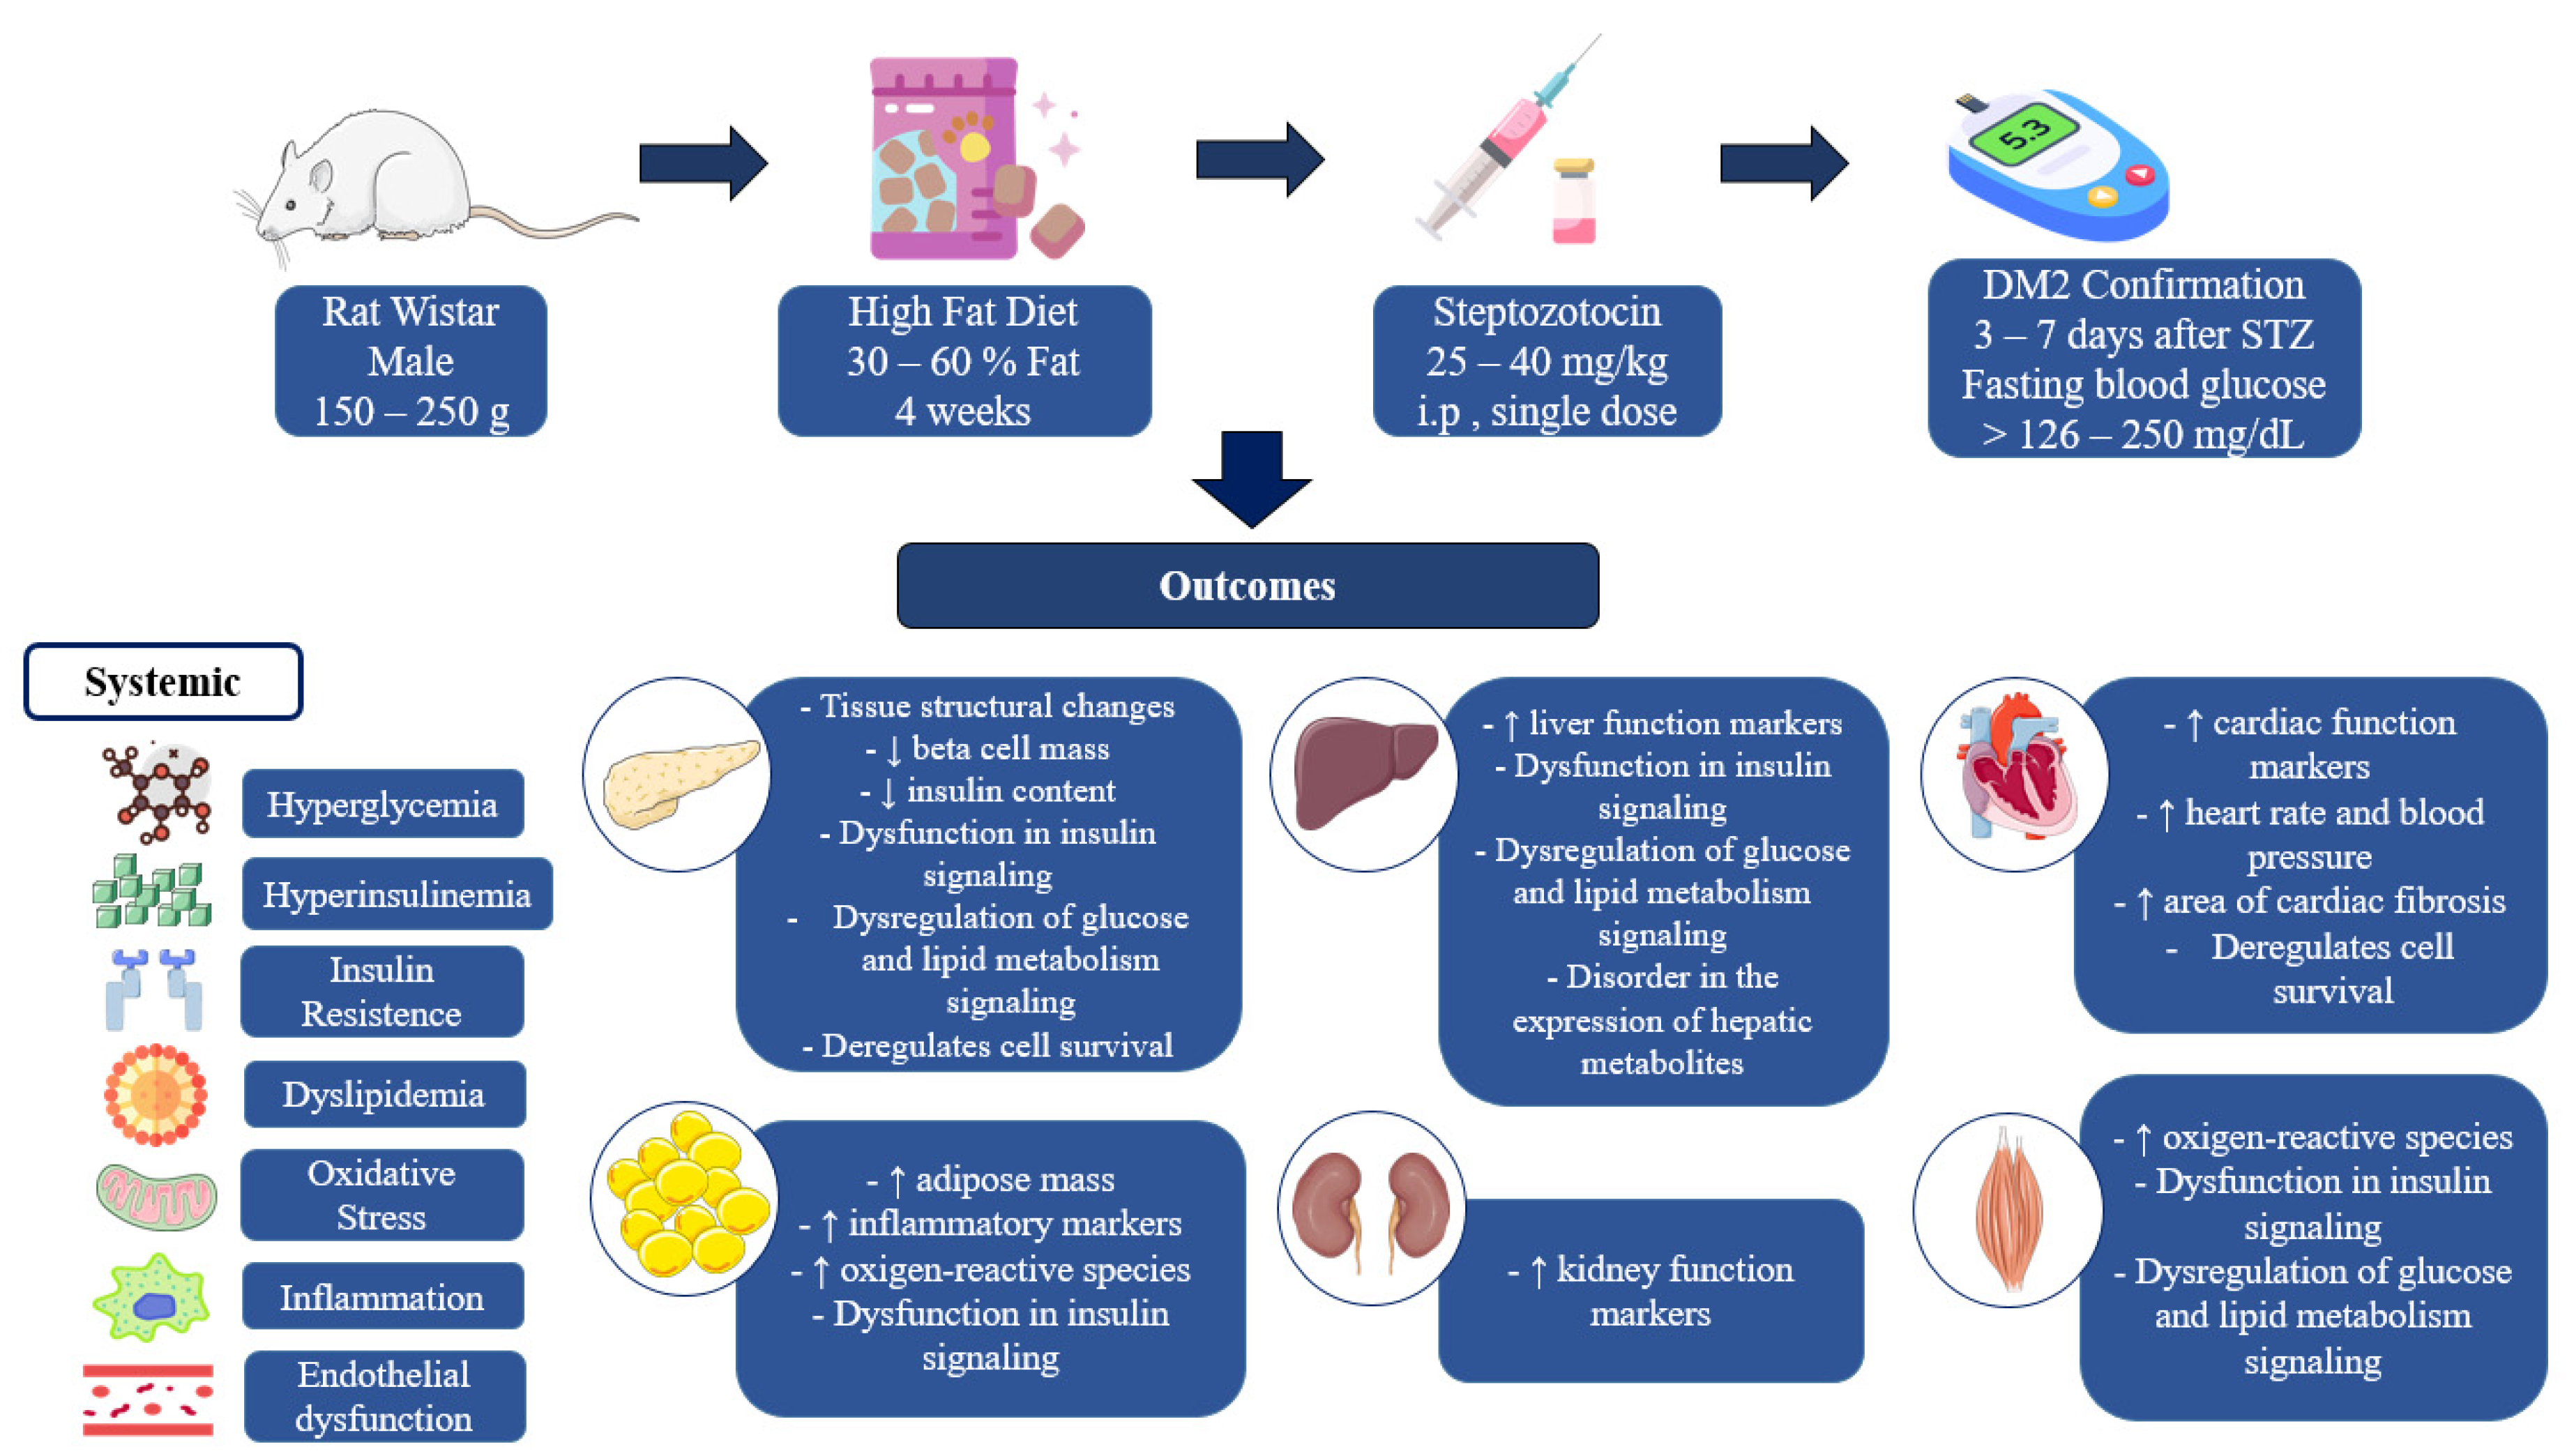
2. Materials and Methods
3. Results

| Reference | Methodology Induction Protocol | Outcomes * |
|---|---|---|
| Bem et al. [14] |
| METABOLIC CONTROL: ↔ body weight after confirmation of DM and at the end of the intervention. GLYCEMIC CONTROL: ↑ blood glucose after confirmation and at the end of the intervention; ↑ HbA1c; ↑ insulin; ↑ HOMA-IR, ↓ HOMA-β. LIPID PROFILE: ↑ TG, ↑ TC, ↑ VLDL, ↔ LDL-c, ↓ HDL-c. INFLAMMATORY MARKERS: ↑ IL-6, ↑ TNF-α HORMONAL FUNCTION: ↑ Leptin, no change in GLP1 PROTEIN EXPRESSION:
VASCULAR REACTIVITY: ↓ Acetylcholine-induced vasodilation, ↔ nitroglycerin-induced vasodilation, ↑ norepinephrine-induced vasoconstriction in the mesenteric artery. |
| Gheibi et al. [18] |
| METABOLIC CONTROL: ↑ body weight, ↑ calorie intake, ↑ water intake, ↓ food consumption. GLYCEMIC CONTROL: ↑ Serum glucose, ↑ serum insulin, ↑ HbA1c; ↑ area under the curve of serum glucose and serum insulin in the intraperitoneal (i.p.) glucose tolerance test; ↑ area under the curve of serum glucose in the i.p. pyruvate tolerance test; ↑ area under the curve of serum glucose in the i.p. insulin tolerance test. LIPID PROFILE: ↑ TG, ↑ TC, ↑ LDL-c, ↑ HDL-c. INFLAMMATORY MARKERS: ↑ serum IL-1β OXIDATIVE AND ANTIOXIDANT MARKERS: ↑ serum MDA; ↓ CAT; ↔ nitrite, nitrate and serum NOx. HISTOPATHOLOGICAL: ↓ content and ↓ secretion of insulin in the pancreatic islets. GENE AND PROTEIN EXPRESSION:
|
| Sathiyabama et al. [25] |
| METABOLIC CONTROL: ↑ weight over the 30 days of intervention; ↑ food consumption, ↑ water intake. GLYCEMIC CONTROL: ↑ glycemia over the 30 days of intervention; ↑ serum insulin, ↑ HOMA-IR, ↑ glycemia after 120 min in the oral glucose tolerance test, ↑ glycemia after 60 min in the i.p. insulin tolerance test. LIPID PROFILE: ↑ TG, ↑ TC, ↑ LDL-c, ↓ HDL-c. HEPATIC FUNCTION: ↑ ALT, ↑ AST, ↑ Alkaline phosphatase. RENAL FUNCTION: ↑ urea, ↑ creatinine. HISTOPATHOLOGICAL: Pancreatic β-cells with generalized degranulation and vacuolization, and disordered islet architecture; ↓ insulin content in the pancreatic islet; enalarged epididymal adipose tissue cells. GENE AND PROTEIN EXPRESSION:
|
| Sohrabipour et al. [26] |
| METABOLIC CONTROL: ↓ body weight at the end of the intervention; ↓ abdominal fat; ↓ food consumption, ↑ water intake, and ↑ urinary excretion at 30, 60, and 90 days of intervention. GLYCEMIC CONTROL: ↑ random blood glucose over 90 days of intervention; ↑ area under the serum glucose curve in the i.p. glucose tolerance test after 30 and 90 days of intervention; ↑ area under the serum glucose curve in the i.p. insulin tolerance test after 30 and 90 days of intervention; ↓ glucose infusion rate necessary to maintain normoglycemia during insulin infusion in the euglycemic–hypersulinemic clamp; ↓ plasma insulin, ↑ plasma glucagon. GENE EXPRESSION:
|
| Abel-Hamid et al. [21] |
| METABOLIC CONTROL: ↑ body weight, ↑ food consumption, ↑ water intake, ↑ visceral fat weight. GLYCEMIC CONTROL: ↑ fasting glucose, ↓ serum insulin, ↑ HOMA-IR. MARKERS OF INFLAMMATION: ↑ serum IL-6. HISTOPATHOLOGICAL: ↓ hepatic glycogen content. GENE EXPRESSION:
|
| Ghiasi et al. [27] |
| METABOLIC CONTROL: ↓ body weight. GLICEMIC CONTROL: ↑ fasting glucose, ↑ serum insulin, ↓ QUICKI. LIPID PROFILE: ↑ TG, ↑ TC, ↓ HDL-c. HEPATIC FUNCTION: ↓ serum albumin. OXIDATIVE AND ANTIOXIDANT MARKERS: ↑ MDA, ↓ SOD, ↓ Gpx, ↓ pancreatic CAT. HISTOPATHOLOGICAL: ↓ pancreatic beta-cell density. GENE AND PROTEIN EXPRESSION mRNA expression in the pancreas: ↓ SIRT1. Protein expression in the pancreas: ↓ SIRT1. |
| Omidi et al. [28] |
| GLYCEMIC CONTROL: ↑ fasting glucose, ↑ serum insulin, ↑ HOMA-IR. LIPID PROFILE: ↔ TG, TC, LDL-c, and HDL-c. |
| Xiang et al. [22] |
| METABOLIC CONTROL: ↓ body weight, ↓ weight gain; ↔ food consumption, ↓ food utilization rate and ↑ water intake at the end of the intervention; ↑ liver weight, ↔ epididymal fat weight. GLYCEMIC CONTROL: ↑ serum glucose, ↑ HbA1c, ↑ serum insulin, ↑ HOMA-IR, ↓ QUICKI; ↑ area under the serum glucose curve in the i.p. glucose tolerance test, ↑ area under the serum glucose curve in the i.p. insulin tolerance test. LIPID PROFILE: ↑ TG, ↔ TC, LDL-c and non-esterified fatty acids (NEFA), ↓ HDL-c. LIVER FUNCTION: ↑ ALT. METABOLOMIC ANALYSIS: metabolic disorder evidenced by clear separation of hepatic metabolites found in normal and diabetic controls. GENE AND PROTEIN EXPRESSION
|
| Zhang et al. [29] |
| METABOLIC CONTROL: ↓ body weight over the 35 days of intervention. GLYCEMIC CONTROL: ↑ fasting blood glucose, ↑ fasting serum insulin, ↑ HOMA-IR, ↓ HOMA-IS; ↑ area under the serum glucose curve in the oral glucose tolerance test. LIPID PROFILE: ↑ TG, ↑ CT. HORMONAL FUNCTION: ↑ Leptin. MARKERS OF INFLAMMATION: ↓ Adiponectin. HISTOPATHOLOGICAL: Steatotic liver with vacuolization accompanied by lobular inflammation and balloon-like changes in the hepatocytes; ↑ hepatic TG. GENE AND PROTEIN EXPRESSION:
|
| Lv et al. [30] |
| METABOLIC CONTROL: ↓ weight after STZ application, ↑ food consumption, ↑ water intake. GLYCEMIC CONTROL: ↑ serum glucose, ↑ HbA1c, ↑ serum insulin, ↑ HOMA-IR; ↑ the area under the serum glucose curve in the i.p. glucose tolerance test, ↑ the area under the serum glucose curve in the i.p. insulin tolerance test. LIPID PROFILE: ↑ TG, ↑ TC, ↔ HDL-c, LDL-c, and non-esterified fatty acids (NEFAs). MARKERS OF INFLAMMATION: ↑ IL-1β, ↑ IL-6, ↑ IL-8, ↑ TNF-α. HISTOPATHOLOGICAL: Altered architecture of the hepatic lobules; hepatocytes increased their sizes and exhibited blurred borders. Cytoplasm filled with fat vacuoles of different sizes, pushing the nucleus to the periphery. TRANSCRIPTOMA ANALYSIS: Trend of spatial separation in the analysis of RNA sequences in the livers of normal controls and diabetics, suggesting a significant difference in gene expression. |
| Mangali et al. [31] |
| METABOLIC CONTROL: ↔ body weight. GLYCEMIC CONTROL: ↑ blood glucose; ↑ serum glucose after 120 min in the i.p. glucose tolerance test; ↑ serum glucose after 120 min in the i.p. insulin tolerance test. CARDIOVASCULAR FUNCTION: ↑ Creatine kinase-MB (CK-MB); ↑ lactate dehydrogenase (LDH); ↑ heart rate; ↑ systolic pressure; ↑ diastolic pressure; ↑ heart weight; ↑ relative heart weight; ↑ cardiac fibrosis area. LIPID PROFILE: ↑ TG, ↑ TC, ↑ LDL-c, ↓ HDL-c. MARKERS OF INFLAMMATION: ↑ TNF-α, ↑ NF-kB, ↑ c-Jun-N-terminal kinase (JNK) in cardiac muscle OXIDATIVE AND ANTIOXIDANT MARKERS: ↑ generation of reactive oxygen species (DCFDA test); ↑ advanced glycation end products (AGEs) in cardiac muscle. PROTEIN EXPRESSION: Protein expression in cardiac muscle: ↑ PKR, ↑ α-SMA; ↑ TGF-β; ↑ Casp-3; ↑ ERK1/2 and ↑ p-ERK1/2. |
| Xu et al. [32] |
| METABOLIC CONTROL: ↓ body weight over the 56 days of intervention; ↑ food consumption, ↑ water intake. GLYCEMIC CONTROL: ↑ fasting glucose; ↑ insulin; ↑ HOMA-IR; ↓ insulin sensitivity index (ISI); ↑ HbA1c; ↓ hepatic glycogen; ↑ area under the serum glucose curve in the oral glucose tolerance test; ↑ % of serum glucose in the i.p. insulin tolerance test after 30, 60, and 90 min. LIPID PROFILE: ↑ TG, ↑ TC, ↑ LDL-c, ↓ HDL-c, ↑ free fatty acids (FFAs). HEPATIC FUNCTION: ↑ ALT, ↑ AST, ↑ AST/ALT ratio. GENE AND PROTEIN EXPRESSION
|
| Kolefer; Miaffo; Ponka, [33] |
| METABOLIC CONTROL: ↑ body weight; ↑ BMI; ↑ abdominal fat. GLYCEMIC CONTROL: ↑ glycemia over 28 days of intervention; ↑ insulin, ↑ HOMA-IR, ↓ HOMA-B. LIPID PROFILE: ↑ TG, ↑ TC, ↑ VLDL, ↑ LDL-c, ↓ HDL-c; ↑ atherogenic index (Log[TG/HDL-c]); ↑ coronary heart risk index (CT/HDL-c); ↓ cardioprotective index (LDL-c/HDL-c). LIVER FUNCTION: ↑ ALT, ↑ AST. RENAL FUNCTION: ↑ urea, ↑ creatinine. OXIDATIVE AND ANTIOXIDANT MARKERS: ↑ MDA, ↓ SOD, ↓ GSH, ↓ CAT in liver, heart, and kidney tissues. |
| Rezazadeh et al. [24] |
| METABOLIC CONTROL: ↓ body weight at the end of the intervention; ↑ water intake and ↑ diuresis at 28 days, 56 days, and 84 days after the intervention. GLYCEMIC CONTROL: ↑ glycemia after confirmation of diabetes and over 140 days of intervention.
GENE EXPRESSION:
|
| Zelinskaya et al. [34] |
| GLYCEMIC CONTROL: ↑ area under the serum glucose curve in the oral glucose tolerance test. VASCULAR REACTIVITY
|
| Khoramipour et al. [15] |
| METABOLIC CONTROL: ↑ body weight after the high-fat diet and STZ injection, ↔ body weight after the 56 days of intervention, ↓ food consumption in grams and calories over the 56 days of intervention, ↑ water intake over the 56 days of intervention. GLYCEMIC CONTROL: ↑ fasting glucose after the high-fat diet and STZ injection, ↑ fasting glucose after the 56 days of intervention, ↓ insulin; ↑ HOMA-IR. HORMONAL FUNCTION: ↓ Leptin. PROTEIN EXPRESSION: Protein expression in the hypothalamus: ↓ LEP-R, ↑ JAK-2, ↓ p-JAK-2, ↑ STAT3, ↓ p-STAT3, ↓ POMC, ↓ CART, ↑ NPY, ↑ AGRP, ↑ FOXO1, ↑ SOCS3. |
| Vijay; Vellapandian [16] |
| METABOLIC CONTROL: ↑ body weight over the 21 days of intervention. GLYCEMIC CONTROL: ↑ glycemia over the 21 days of intervention, ↓ insulin; ↑ HOMA-IR; ↑ area under the serum glucose curve in the oral glucose tolerance test. LIPID PROFILE: ↑ TG, ↑ TC, ↑ LDL-c, ↓ HDL-c. LIVER FUNCTION: ↑ ALT, ↑ AST, ↑ ALP. RENAL FUNCTION: ↑ urea, ↑ creatinine. OXIDATIVE AND ANTIOXIDANT MARKERS: ↑ MDA, ↓ SOD, ↓ GSH, ↓ CAT in gastrocnemius muscle. HISTOPATHOLOGICAL:
|
| Salem et al. [17] |
| GLYCEMIC CONTROL: ↑ fasting glucose; ↑ insulin; ↑ HbA1c, ↑ HOMA-IR, ↓ QUICKI. MARKERS OF INFLAMMATION: ↑ Amyloid A, ↑ NF-kB, ↑ IL-18. OXIDATIVE AND ANTIOXIDANT MARKERS: ↑ MDA, ↓ TAC. NEUROBEHAVIORAL TESTS: ↓ motor coordination by footprint assay; ↓ spatial working memory by Y-maze test; ↑ anxiety-like and exploratory behavior by open field test; ↓ spatial learning and retention memory by Morris water maze. HISTOPATHOLOGICAL: Frontal cerebral cortex tissue—disorganization of the layers, deformed neurons, the depletion of the cellular elements, inflammatory cell infiltration, and dilated congested blood vessels. |
| Bagheripour et al. [19] |
| METABOLIC CONTROL: ↑ body weight; ↑ BMI; ↑ Lee index; ↑ abdominal circumference; ↑ thoracic circumference immediately and after 28 days, 56 days the intervention. WAT: ↑ Inguinal, ↑ Epididymal, ↑ Mesenteric, ↑ Retroperitoneal; BAT: ↓ Interscapular, ↓ Axillary; ↔ adiposity index. GLYCEMIC CONTROL: ↑ fasting glucose; ↑ area under the curve of serum glucose in the intraperitoneal (i.p.) glucose tolerance test; ↑ area under the curve of serum glucose in the i.p. pyruvate tolerance test immediately and after 28 days or 56 days of the intervention. LIPID PROFILE: ↑ TG, ↑ TC, ↑ LDL-c, ↑ HDL-c immediately and after 28 days or 56 days of the intervention. OXIDATIVE AND ANTIOXIDANT MARKERS: ↔ area under the curve of serum NOx and ↓ area under the curve of serum citrulline immediately and after 28 days or 56 days of the intervention. |
| Ghasemi et al. [20] |
| METABOLIC CONTROL: ↑ body weight; ↓ food consumption, ↑ water intake. GLYCEMIC CONTROL: ↑ fasting glucose; ↑ insulin; ↓ Islets GIIS; ↑ HOMA 1-IR, ↑ HOMA2-IR, ↓ QUICKI. GENE EXPRESSION: mRNA expression in the pancreatic islets: NADPH oxidase (Nox) isoforms: ↑ Nox1, ↑ Nox2, ↔ Nox3, and ↑ Nox4; SOD isoforms: ↓ SOD1, ↓ SOD2, and ↔ SOD3; ↑ CAT; Gpx isoforms: ↓ GPX1 and ↓ GPX7; ↓ GR; TXN isoforms: ↓ TXN1 and ↔ TXN2; ↔ TXNRD1. |
| Tarighat-Esfanjani et al. [23] |
| METABOLIC CONTROL: ↓ body weight over the 49 days of the intervention. GLYCEMIC CONTROL: ↑ fasting glucose; ↔ insulin; ↑ HOMA-IR. LIPID PROFILE: ↔ TG; ↔ TC; ↔ VLDL; ↔ LDL-c. MINERAL’S LEVELS IN SERUM: No difference in Mg, Ca, Cu, P, and Zn. |
| Cai et al. [35] |
| METABOLIC CONTROL: body weight lower over the 56 days of the intervention; ↑ food consumption, ↑ water intake. GLYCEMIC CONTROL: ↑ fasting glucose; ↑ insulin; ↑ HOMA-IR, ↓ HOMA-β, ↑ area under the serum glucose curve in the oral glucose tolerance test. LIPID PROFILE: ↑ TG, ↑ TC, ↑ LDL-c, ↓ HDL-c. CARDIOVASCULAR FUNCTION: ↔ LV end-diastolic dimension, ↑ ratio of E-wave and A-wave, ↔ isovolumic relaxation time, ↔ E-wave decline time, ↓ ejection fraction, ↓ fractional shortening, ↓ heart rate, ↔ cardiac output, ↑ BNP. HISTOPATHOLOGICAL: disordered cardiac tissues and ↑ lipid levels within the hearts, ↑ heart FFA and DAG contents. GENE AND PROTEIN EXPRESSION:
|
| A-Elgadir et al. [36] |
| METABOLIC CONTROL: ↓ body weight. GLYCEMIC CONTROL: ↑ fasting glucose; ↑ insulin; ↑ HOMA-IR. LIPID PROFILE: ↑ TG, ↑ TC, ↑ LDL-c, ↓ HDL-c. CARDIOVASCULAR FUNCTION: ↓ heart rate, ↓ LV-developed pressure, ↓ contractility index, ↑ systolic blood pressure, ↑ CK-MB, ↑ Troponin C. HISTOPATHOLOGICAL: disarrayed muscle fibers with cytoplasmic vacuoles and noticeable apoptotic alterations. PROTEIN EXPRESSION: Protein expression in the rigth atrial tissue: ↑ JAK-2, ↑ STAT3, ↑ iNOS, ↑ Casp3. |
| Gharaat; Choobdari; Sheykhlouvand [37] |
| METABOLIC CONTROL: ↑ body weight pre-intervention, ↔ at the end of 42-day intervention and after physical exercise, ↔ VOmax test pre-intervention, at the end of 42-day intervention, and after physical exercise. GLYCEMIC CONTROL: ↑ fasting glucose; ↔ insulin; ↑ HOMA-IR in pre-intervention, at the end of 42-day intervention, and after physical exercise. CARDIOVASCULAR FUNCTION: ↑ LV end-diastolic volume, ↑ LV end-systolic volume, ↓ ejection fraction. PROTEIN CONCENTRATION: ↑ Casp9, ↓ CAT in serum PROTEIN EXPRESSION: Protein expression in the left ventricle myocardium: ↑ p53. |
| Mahmoud et al. [38] |
| GLYCEMIC CONTROL: ↑ fasting glucose; ↑ insulin; ↑ HOMA-IR. CARDIOVASCULAR FUNCTION: ↑ LV end-diastolic dimension, ↑ LV end-systolic dimension, ↓ ejection fraction, ↓ fractional shortening, ↔ E-wave (peak early diastolic filling velocity) end study, ↑ A-wave (late diastolic filling velocity) end study, ↓ E-wave/A-wave end study, ↑ DT end study. MARKERS OF INFLAMMATION: ↑ TNF-α, ↑ IL-1β, ↑ NRF2. HISTOPATHOLOGICAL: fiber degeneration, size variation, thinning, corrugation, tears, heterogeneous staining, preserved intercalated disks, dark nuclei, vacuolations, and small blood vessels, ↑ in % connective tissue area both interstitial and perivascular. PROTEIN EXPRESSION: Protein expression in cardiac tissue: ↑ Casp-1, ↑ iNOS. |
| Swain et al. [39] |
| GLYCEMIC CONTROL: ↑ fasting glucose; ↓ insulin; ↑ HbA1c, ↑ HOMA-IR, ↓ HOMA-β, ↓ QUICKI. MARKERS OF INFLAMMATION: ↑ TNFα, ↑ NF-kB, ↑ hs-CRP in serum, liver, and pancreas. PROTEIN EXPRESSION:
|
| Khosravi et al. [40] |
| METABOLIC CONTROL: ↔ body weight before induction, ↑ body weight after induction and after intervention. GLYCEMIC CONTROL: ↔ fasting glucose before induction, ↑ fasting glucose after induction and after intervention; ↔ insulin before induction, ↑ insulin after induction and after intervention; ↔ HOMA-IR before induction, ↑ HOMA-IR after induction and after intervention. OXIDATIVE AND ANTIOXIDANT MARKERS: ↓ GPX-4, ↑ MDA. PROTEIN CONCENTRATION: ↑ lactate in serum. PROTEIN EXPRESSION: Protein expression in the hippocampus: ↓ BDNF, ↓ SIRT1, ↓ MCT2, ↓ NRF2, ↓ p62, ↑ Keap1, ↓ PINK1, ↓ Parkin, ↓ Amyloid Beta, ↓ hyperphosphorylated Tau protein. |
| Author/Year | Selection Bias | Performance Bias | Detection Bias | Friction Bias | Reporting Bias | Other Sources of Bias | ||||||
|---|---|---|---|---|---|---|---|---|---|---|---|---|
| Random Allocation of Groups | Similar Groups in the Baselines | Blind Group Allocation | Random Housing | Blind Interventions | Random Outcome Assessment | Blinded Outcome Assessment | Report of Withdrawals | Selective Outcome Reporting | DM2 Cut-Off Point | Blood Glucose Results to Confirm DM2 | Blood Glucose Results During/After Intervention | |
| Bem et al. [14] |  | | | | | | |  | | |  | |
| Gheibi et al. [18] | | | | | | | | | | | | |
| Sathiyabama et al. [25] | | | | | | | | | | | | |
| Sohrabipour et al. [26] | | | | | | | | | | | | |
| Abel-Hamid et al. [21] | | | | | | | | | | | | |
| Ghiasi et al. [27] | | | | | | | | | | | | |
| Omidi et al. [28] | | | | | | | | | | | | |
| Xiang et al. [22] | | | | | | | | | | | | |
| Zhang et al. [29] | | | | | | | | | | | | |
| Lv et al. [30] | | | | | | | | | | | | |
| Mangali et al. [31] | | | | | | | | | | | | |
| Xu et al. [32] | | | | | | | | | | | | |
| Kolefer; Miaffo; Ponka [33] | | | | | | | | | | | | |
| Rezazadeh et al. [24] | | | | | | | | | | | | |
| Zelinskaya et al., [34] | | | | | | | | | | | | |
| Khoramipour et al. [15] | | | | | | | | | | | | |
| Vijay; Vellapandian [16] | | | | | | | | | | | | |
| Salem et al. [17] | | | | | | | | | | | | |
| Bagheripour et al. [19] | | | | | | | | | | | | |
| Ghasemi et al. [20] | | | | | | | | | | | | |
| Tarighat-Esfanjani et al. [23] | | | | | | | | | | | | |
| Cai et al. [35] | | | | | | | | | | | | |
| A-Elgadir et al. [36] | | | | | | | | | | | | |
| Gharaat; Choobdari; Sheykhlouvand [37] | | | | | | | | | | | | |
| Mahmoud et al. [38] | | | | | | | | | | | | |
| Swain et al. [39] | | | | | | | | | | | | |
| Khosravi et al. [40] | | | | | | | | | | | | |
4. Discussion
5. Conclusions
Author Contributions
Funding
Institutional Review Board Statement
Informed Consent Statement
Data Availability Statement
Acknowledgments
Conflicts of Interest
References
- Brazilian Diabetes Society. Brazilian Diabetes Society Guidelines. 2022. Available online: https://doi.org/10.29327/557753 (accessed on 26 May 2023).
- International Diabetes Federation. IDF Diabetes Atlas, 10th ed.; International Diabetes Federation: Brussels, Belgium, 2021; Available online: www.diabetesatlas.org (accessed on 26 May 2023).
- Cefalu, W.T. Animal models of type 2 diabetes: Clinical Presentation and pathophysiological relevance to the human condition. ILAR J. 2006, 47, 186–198. [Google Scholar] [CrossRef] [PubMed]
- Pandey, S.; Dvorakova, M.C. Future Perspective of Diabetic Animal Models. Endocr. Metab. Immune Disord.-Drug Targets 2020, 20, 25–38. [Google Scholar] [CrossRef] [PubMed]
- Skovsø, S. Modeling type 2 diabetes in rats using high fat diet and streptozotocin. J. Diabetes Investig. 2014, 5, 349–358. [Google Scholar] [CrossRef]
- Al-Mrabeh, A. Pathogenesis and remission of type 2 diabetes: What has the twin cycle hypothesis taught us? Cardiovasc. Endocrinol. Metab. 2020, 9, 132–142. [Google Scholar] [CrossRef] [PubMed]
- Chao, P.-C.; Li, Y.; Chang, C.-H.; Shieh, J.P.; Cheng, J.-T.; Cheng, K.-C. Investigation of insulin resistance in the popularly used four rat models of type-2 diabetes. Biomed. Pharmacother. 2018, 101, 155–161. [Google Scholar] [CrossRef]
- Magalhães, D.A.; Kume, W.T.; Correia, F.S.; Queiroz, T.S.; Allebrandt Neto, E.W.; Santos, M.P.D.; Kawashita, N.H.; França, S.A. High-fat diet and streptozotocin in the induction of type 2 diabetes mellitus: A new proposal. An. Acad. Bras. Cienc. 2019, 91, e20180314. [Google Scholar] [CrossRef]
- Salehi, R.; Vatandoust, N.; Rami, F.; Salehi, A.R.; Khosravi, S.; Dashti, G.; Eslami, G.; Momenzadeh, S. Novel High-Fat Diet Formulation and Streptozotocin Treatment for Induction of Prediabetes and Type 2 Diabetes in Rats. Adv. Biomed. Res. 2018, 7, 107. [Google Scholar] [CrossRef]
- Gromova, L.V.; Polozov, A.S.; Savochkina, E.V.; Alekseeva, A.S.; Dmitrieva, Y.V.; Kornyushin, O.V.; Gruzdkov, A.A. Effect of Type 2 Diabetes and Impaired Glucose Tolerance on Digestive Enzymes and Glucose Absorption in the Small Intestine of Young Rats. Nutrients 2022, 14, 385. [Google Scholar] [CrossRef]
- Wickramasinghe, A.S.D.; Attanayake, A.P.; Kalansuriya, P. Biochemical characterization of high fat diet fed and low dose streptozotocin induced diabetic Wistar rat model. J. Pharmacol. Toxicol. Methods 2022, 113, 107144. [Google Scholar] [CrossRef]
- Oermann, M.H.; Knafl, K.A. Strategies for completing a successful integrative review. Nurse Author Ed. 2021, 31, 65–68. [Google Scholar] [CrossRef]
- Hooijmans, C.R.; Rovers, M.M.; de Vries, R.B.M.; Leenaars, M.; Ritskes-Hoitinga, M.; Langendam, M.W. SYRCLE’s risk of bias tool for animal studies. BMC Med. Res. Methodol. 2014, 14, 43. [Google Scholar] [CrossRef] [PubMed]
- de Bem, G.F.; Costa, C.A.; Santos, I.B.; Cordeiro, V.d.S.C.; de Carvalho, L.C.R.M.; de Souza, M.A.V.; Soares, R.d.A.; Sousa, P.J.d.C.; Ognibene, D.T.; Resende, A.C.; et al. Antidiabetic effect of Euterpe oleracea Mart. (açaí) extract and exercise training on high-fat diet and streptozotocin-induced diabetic rats: A positive interaction. PLoS ONE 2018, 13, e0199207. [Google Scholar] [CrossRef] [PubMed]
- Khoramipour, K.; Rezaei, M.H.; Madadizadeh, E.; Hosseini, M.S.; Soltani, Z.; Schierbauer, J.; Moser, O. High Intensity Interval Training can Ameliorate Hypothalamic Appetite Regulation in Male Rats with Type 2 Diabetes: The Role of Leptin. Cell. Mol. Neurobiol. 2023, 43, 4295–4307. [Google Scholar] [CrossRef] [PubMed]
- Vijay, N.K.G.; Vellapandian, C. Ameliorative effects of phlorotannin-rich fraction of Sargassum tenerrimum in high-fat diet and low dose streptozotocin-induced metabolic changes and oxidative stress in diabetic rats. J. Herbmed Pharmacol. 2023, 12, 367–379. [Google Scholar] [CrossRef]
- Salem, H.R.; Hanna, G.S.; Hassan, M.H.; El-Kotb, S.; Rashad, S.; Yassien, R.I.; Selim, M.; Amer, G.S. Combined metformin and insulin therapy improves neurocognitive dysfunction in type 2 diabetic rat model via anti-inflammatory and antioxidant mechanisms. Physiol. Pharmacol. 2024, 28, 141–156. [Google Scholar] [CrossRef]
- Gheibi, S.; Kashfi, K.; Ghasemi, A. A practical guide for induction of type-2 diabetes in rat: Incorporating a high-fat diet and streptozotocin. Biomed. Pharmacother. 2017, 95, 605–613. [Google Scholar] [CrossRef] [PubMed]
- Bagheripour, F.; Jeddi, S.; Kashfi, K.; Ghasemi, A. Anti-obesity and anti-diabetic effects of L-citrulline are sex-dependent. Life Sci. 2024, 339, 122432. [Google Scholar] [CrossRef]
- Ghasemi, A.; Gheibi, S.; Kashfi, K.; Jeddi, S. Anti-oxidant effect of nitrite in the pancreatic islets of type 2 diabetic male rats. Iran. J. Basic Med. Sci. 2023, 26, 420. [Google Scholar] [CrossRef]
- Abdel-Hamid, H.A.; Abdalla, M.M.I.; Zenhom, N.M.; Ahmed, R.F. The effect of peptide tyrosine tyrosine (PYY3–36), a selective Y2 receptor agonist on streptozotocin-induced diabetes in albino rats. Endocr. Regul. 2019, 53, 26–33. [Google Scholar] [CrossRef]
- Xiang, J.; Lv, Q.; Yi, F.; Song, Y.; Le, L.; Jiang, B.; Xu, L.; Xiao, P. Dietary supplementation of vine tea ameliorates glucose and lipid metabolic disorder via Akt signaling pathway in diabetic rats. Molecules 2019, 24, 1866. [Google Scholar] [CrossRef]
- Tarighat-Esfanjani, A.; Fallahnejad, H.; Omidi, H.; Jafarabadi, M.A.; Abbasi, M.M.; Khorram, S. The Effects of Natural Nano-Sized Clinoptilolite and Metformin on the Levels of Serum Glucose, Lipid Profile, and Minerals in Rats with Type 2 Diabetes Mellitus. Iran. Red. Crescent Med. J. 2018, 20, e74365. [Google Scholar] [CrossRef]
- Rezazadeh, H.; Sharifi, M.R.; Soltani, N. Gamma-aminobutyric acid attenuates insulin resistance in type 2 diabetic patients and reduces the risk of insulin resistance in their offspring. Biomed. Pharmacother. 2021, 138, 111440. [Google Scholar] [CrossRef] [PubMed]
- Sathiyabama, R.G.; Gandhi, G.R.; Denadai, M.; Sridharan, G.; Jothi, G.; Sasikumar, P.; Quintans, J.d.S.S.; Narain, N.; Cuevas, L.E.; Coutinho, H.D.M.; et al. Evidence of insulin-dependent signalling mechanisms produced by Citrus sinensis (L.) Osbeck fruit peel in an insulin resistant diabetic animal model. Food Chem. Toxicol. 2018, 116, 86–99. [Google Scholar] [CrossRef]
- Sohrabipour, S.; Sharifi, M.R.; Talebi, A.; Soltani, N. GABA dramatically improves glucose tolerance in streptozotocin-induced diabetic rats fed with high-fat diet. Eur. J. Pharmacol. 2018, 826, 75–84. [Google Scholar] [CrossRef]
- Ghiasi, R.; Naderi, R.; Sheervalilou, R.; Alipour, M.R. Swimming training by affecting the pancreatic Sirtuin1 (SIRT1) and oxidative stress, improves insulin sensitivity in diabetic male rats. Horm. Mol. Biol. Clin. Investig. 2019, 40, 20190011. [Google Scholar] [CrossRef]
- Omidi, H.; Khorram, S.; Mesgari, M.; Asghari-Jafarabadi, M.; Tarighat-Esfanjani, A. The effects of natural nano-sized clinoptilolite and Nigella sativa supplementation on blood glucose and lipid profile in rats with type 2 diabetes mellitus. Prog. Nutr. 2019, 21, 147–153. [Google Scholar] [CrossRef]
- Zhang, Q.; Huang, Y.; Li, X.; Liu, H.; He, B.; Wang, B.; Ma, Y.; Zhou, X.; Liu, Y.; Wu, S. Tangduqing Granules Attenuate Insulin Resistance and Abnormal Lipid Metabolism through the Coordinated Regulation of PPARγ and DGAT2 in Type 2 Diabetic Rats. J. Diabetes Res. 2019, 2019, 7403978. [Google Scholar] [CrossRef]
- Lv, Q.; Le, L.; Xiang, J.; Jiang, B.; Chen, S.; Xiao, P. Liver transcriptomic reveals novel pathways of empagliflozin associated with type 2 diabetic rats. Front. Endocrinol. 2020, 11, 111. [Google Scholar] [CrossRef]
- Mangali, S.; Bhat, A.; Jadhav, K.; Kalra, J.; Sriram, D.; Venuganti, V.V.K.; Dhar, A. Upregulation of PKR pathway mediates glucolipotoxicity induced diabetic cardiomyopathy in vivo in wistar rats and in vitro in cultured cardiomyocytes. Biochem. Pharmacol. 2020, 177, 113948. [Google Scholar] [CrossRef]
- Xu, L.-N.; Yin, L.-H.; Jin, Y.; Qi, Y.; Han, X.; Xu, Y.-W.; Liu, K.-X.; Zhao, Y.-Y.; Peng, J.-Y. Effect and possible mechanisms of dioscin on ameliorating metabolic glycolipid metabolic disorder in type-2-diabetes. Phytomedicine 2020, 67, 153139. [Google Scholar] [CrossRef]
- Kolefer, K.; Miaffo, D.; Ponka, R. Evaluation of Antidiabetic Properties of the Leaves Extract of Ficus vallis-choudae Delile in a Model of Type 2 Diabetes Induced by High-Fat Diet and Streptozotocin. Sci. World J. 2021, 2021, 1502230. [Google Scholar] [CrossRef] [PubMed]
- Zelinskaya, I.; Kornushin, O.; Savochkina, E.; Dyachuk, V.; Vasyutina, M.; Galagudza, M.; Toropova, Y. Vascular region-specific changes in arterial tone in rats with type 2 diabetes mellitus: Opposite responses of mesenteric and femoral arteries to acetylcholine and 5-hydroxytryptamine. Life Sci. 2021, 286, 120011. [Google Scholar] [CrossRef] [PubMed]
- Cai, H.; Chen, S.; Liu, J.; He, Y. An attempt to reverse cardiac lipotoxicity by aerobic interval training in a high-fat diet- and streptozotocin-induced type 2 diabetes rat model. Diabetol. Metab. Syndr. 2019, 11, 43. [Google Scholar] [CrossRef] [PubMed]
- A-Elgadir, T.M.E.; Shati, A.A.; Alqahtani, S.A.; Ebrahim, H.A.; Almohaimeed, H.M.; ShamsEldeeen, A.M.; Haidara, M.A.; Kamar, S.S.; Dawood, A.F.; El-Bidawy, M.H. Mesenchymal stem cells improve cardiac function in diabetic rats by reducing cardiac injury biomarkers and downregulating JAK/STAT/iNOS and iNOS/Apoptosis signaling pathways. Mol. Cell. Endocrinol. 2024, 591, 112280. [Google Scholar] [CrossRef]
- Gharaat, M.A.; Choobdari, H.R.; Sheykhlouvand, M. Cardioprotective effects of aerobic training in diabetic rats Reducing cardiac apoptotic indices and oxidative stress for a healthier heart. ARYA Atheroscler. J. 2024, 20, 50–60. [Google Scholar] [CrossRef]
- Mahmoud, L.M.; Mageed, A.A.A.A.; Saadallah, J.M.; Youssef, M.F.; Rashed, L.A.; Ammar, H.I. Interleukin 1β receptor blocker (Anakinra) and regenerative stem cell therapy: Two novel approaches effectively ameliorating diabetic cardiomyopathy. Naunyn-Schmiedeberg’s Arch. Pharmacol. 2024, 397, 8023–8041. [Google Scholar] [CrossRef]
- Swain, S.K.; Dash, U.C.; Kanhar, S.; Sahoo, A.K. Network pharmacology-based elucidation of bioactive compounds and experimental exploration of antidiabetic mechanisms of Hydrolea zeylanica. Cell. Signal. 2023, 114, 110999. [Google Scholar] [CrossRef]
- Khosravi, P.; Shahidi, F.; Eskandari, A.; Khoramipour, K. High-intensity interval training reduces Tau and beta-amyloid accumulation by improving lactate-dependent mitophagy in rats with type 2 diabetes. Iran. J. Basic Med. Sci. 2024, 27, 1430–1439. [Google Scholar] [CrossRef]
- Goyal, S.N.; Reddy, N.M.; Patil, K.R.; Nakhate, K.T.; Ojha, S.; Patil, C.R.; Agrawal, Y.O. Challenges and issues with streptozotocin-induced diabetes—A clinically relevant animal model to understand the diabetes pathogenesis and evaluate therapeutics. Chem. Biol. Interact. 2016, 244, 49–63. [Google Scholar] [CrossRef]
- Kang, H.; Yang, H.; Ahn, C.; Kang, H.; Hong, E.; Jaung, E. Effects of xenoestrogens on streptozotocin-induced diabetic mice. J. Physiol. Pharmacol. 2014, 65, 273–282. [Google Scholar]
- Masiello, P.; DE Paoli, A.; Bergamini, E. Age-dependent changes in the sensitivity of the rat to a diabetogenic agent (streptozotocin). Endocrinology 1975, 96, 787–789. [Google Scholar] [CrossRef] [PubMed]
- Cheng, H.S.; Ton, S.H.; Phang, S.C.W.; Tan, J.B.L.; Kadir, K.A. Increased susceptibility of post-weaning rats on high-fat diet to metabolic syndrome. J. Adv. Res. 2017, 8, 743–752. [Google Scholar] [CrossRef] [PubMed]
- Stott, N.L.; Marino, J.S. High Fat Rodent Models of Type 2 Diabetes: From Rodent to Human. Nutrients 2020, 12, 3650. [Google Scholar] [CrossRef] [PubMed]
- Rodríguez-Correa, E.; González-Pérez, I.; Clavel-Pérez, P.I.; Contreras-Vargas, Y.; Carvajal, K. Biochemical and nutritional overview of diet-induced metabolic syndrome models in rats: What is the best choice? Nutr. Diabetes 2020, 10, 24. [Google Scholar] [CrossRef]
- Gajda, A.M.; Pellizzon, M.A.; Ricci, M.R.; Ulman, E.A. Diet-induced metabolic syndrome in rodent models. Anim. Lab. News 2007, 74, 775–793. Available online: https://labanimal.co.kr/wp-content/uploads/2024/07/Diet-Induced-Metabolic-Syndrome.pdf (accessed on 6 May 2025).
- Hariri, N.; Thibault, L. High-fat diet-induced obesity in animal models. Nutr. Res. Rev. 2010, 23, 270–299. [Google Scholar] [CrossRef]
- Gupta, C.; Bubber, P.; Fahim, M.; Saidullah, B.; Omanwar, S. Adiponectin in onset and progression of T2DM with cardiac dysfunction in rats. Hum. Exp. Toxicol. 2020, 39, 1463–1474. [Google Scholar] [CrossRef]
- Eleazu, C.O.; Eleazu, K.C.; Chukwuma, S.; Essien, U.N. Review of the mechanism of cell death resulting from streptozotocin challenge in experimental animals, its practical use and potential risk to humans. J. Diabetes Metab. Disord. 2013, 12, 60. [Google Scholar] [CrossRef]
- Ghasemi, A.; Khalifi, S.; Jedi, S. Streptozotocin-nicotinamide-induced rat model of type 2 diabetes (review). Acta Physiol. Hung. 2014, 101, 408–420. [Google Scholar] [CrossRef]
- Ghasemi, A.; Jeddi, S. Streptozotocin as a tool for induction of rat models of diabetes: A practical guide. EXCLI J. 2023, 22, 274–294. [Google Scholar] [CrossRef]
- Omolaoye, T.S.; Skosana, B.T.; du Plessis, S.S. Diabetes mellitus- induction: Effect of different streptozotocin doses on male reproductive parameters. Acta Histochem. 2018, 120, 103–109. [Google Scholar] [CrossRef] [PubMed]
- Rossi, G.; Heldstab, A. Morphometric studies of pancreatic islets and retinal vessels of rats with streptozotocin-induced latent diabetes. Diabetes Metab. 1981, 7, 77–86. [Google Scholar]
- Srinivasan, K.; Patole, P.; Kaul, C.; Ramarao, P. Reversal of glucose intolerance by pioglitazone in high fat diet-fed rats. Methods Find. Exp. Clin. Pharmacol. 2004, 26, 327–333. [Google Scholar] [CrossRef] [PubMed]
- Akinlade, O.M.; Owoyele, B.V.; Soladoye, A.O. Streptozotocin-induced type 1 and 2 diabetes in rodents: A model for studying diabetic cardiac autonomic neuropathy. Afr. Health Sci. 2021, 21, 719–727. [Google Scholar] [CrossRef]
- Tabák, A.G.; Jokela, M.; Akbaraly, T.N.; Brunner, E.J.; Kivimäki, M.; Witte, D.R. Trajectories of glycaemia, insulin sensitivity, and insulin secretion before diagnosis of type 2 diabetes: An analysis from the Whitehall II study. Lancet 2009, 373, 2215–2221. [Google Scholar] [CrossRef]
- Newsholme, P.; Keane, K.N.; Carlessi, R.; Cruzat, V. Oxidative stress pathways in pancreatic β-cells and insulin-sensitive cells and tissues: Importance to cell metabolism, function, and dysfunction. Am. J. Physiol. Cell Physiol. 2019, 317, C420–C433. [Google Scholar] [CrossRef]
- Horii, T.; Kozawa, J.; Fujita, Y.; Kawata, S.; Ozawa, H.; Ishibashi, C.; Yoneda, S.; Nammo, T.; Miyagawa, J.-I.; Eguchi, H.; et al. Lipid droplet accumulation in β cells in patients with type 2 diabetes is associated with insulin resistance, hyperglycemia and β cell dysfunction involving decreased insulin granules. Front. Endocrinol. 2022, 13, 996716. [Google Scholar] [CrossRef]
- Wysham, C.; Shubrook, J. Beta-cell failure in type 2 diabetes: Mechanisms, markers, and clinical implications. Postgrad. Med. 2020, 132, 676–686. [Google Scholar] [CrossRef]
- Furman, B.L. Streptozotocin-induced diabetic models in mice and rats. Curr. Protoc. Pharmacol. 2015, 70, 5.47.1–5.47.20. [Google Scholar] [CrossRef]
- Guo, X.-X.; Wang, Y.; Wang, K.; Ji, B.-P.; Zhou, F. Stability of a type 2 diabetes rat model induced by high-fat diet feeding with low-dose streptozotocin injection. J. Zhejiang Univ. B 2018, 19, 559–569. [Google Scholar] [CrossRef]
Disclaimer/Publisher’s Note: The statements, opinions and data contained in all publications are solely those of the individual author(s) and contributor(s) and not of MDPI and/or the editor(s). MDPI and/or the editor(s) disclaim responsibility for any injury to people or property resulting from any ideas, methods, instructions or products referred to in the content. |
© 2025 by the authors. Licensee MDPI, Basel, Switzerland. This article is an open access article distributed under the terms and conditions of the Creative Commons Attribution (CC BY) license (https://creativecommons.org/licenses/by/4.0/).
Share and Cite
Brito, A.K.d.S.; Mendes, A.V.d.S.; Timah Acha, B.; Santos Oliveira, A.S.d.S.; Lopes Macedo, J.; Suzuki Cruzio, A.; Prianti, M.d.G.; Abreu, R.R.d.; Lucarini, M.; Durazzo, A.; et al. Experimental Models of Type 2 Diabetes Mellitus Induced by Combining Hyperlipidemic Diet (HFD) and Streptozotocin Administration in Rats: An Integrative Review. Biomedicines 2025, 13, 1158. https://doi.org/10.3390/biomedicines13051158
Brito AKdS, Mendes AVdS, Timah Acha B, Santos Oliveira ASdS, Lopes Macedo J, Suzuki Cruzio A, Prianti MdG, Abreu RRd, Lucarini M, Durazzo A, et al. Experimental Models of Type 2 Diabetes Mellitus Induced by Combining Hyperlipidemic Diet (HFD) and Streptozotocin Administration in Rats: An Integrative Review. Biomedicines. 2025; 13(5):1158. https://doi.org/10.3390/biomedicines13051158
Chicago/Turabian StyleBrito, Ana Karolinne da Silva, Ana Victória da Silva Mendes, Boris Timah Acha, Amanda Suellenn da Silva Santos Oliveira, Joyce Lopes Macedo, Akemi Suzuki Cruzio, Maria das Graças Prianti, Raquel Rodrigues de Abreu, Massimo Lucarini, Alessandra Durazzo, and et al. 2025. "Experimental Models of Type 2 Diabetes Mellitus Induced by Combining Hyperlipidemic Diet (HFD) and Streptozotocin Administration in Rats: An Integrative Review" Biomedicines 13, no. 5: 1158. https://doi.org/10.3390/biomedicines13051158
APA StyleBrito, A. K. d. S., Mendes, A. V. d. S., Timah Acha, B., Santos Oliveira, A. S. d. S., Lopes Macedo, J., Suzuki Cruzio, A., Prianti, M. d. G., Abreu, R. R. d., Lucarini, M., Durazzo, A., do Carmo de Carvalho e Martins, M., & Arcanjo, D. D. R. (2025). Experimental Models of Type 2 Diabetes Mellitus Induced by Combining Hyperlipidemic Diet (HFD) and Streptozotocin Administration in Rats: An Integrative Review. Biomedicines, 13(5), 1158. https://doi.org/10.3390/biomedicines13051158