
AI-Driven Detection of Obstructive Sleep Apnea Using Dual-Branch CNN and Machine Learning Models


Abstract
1. Introduction
2. Literature Review
3. Methods and Material
3.1. Dataset
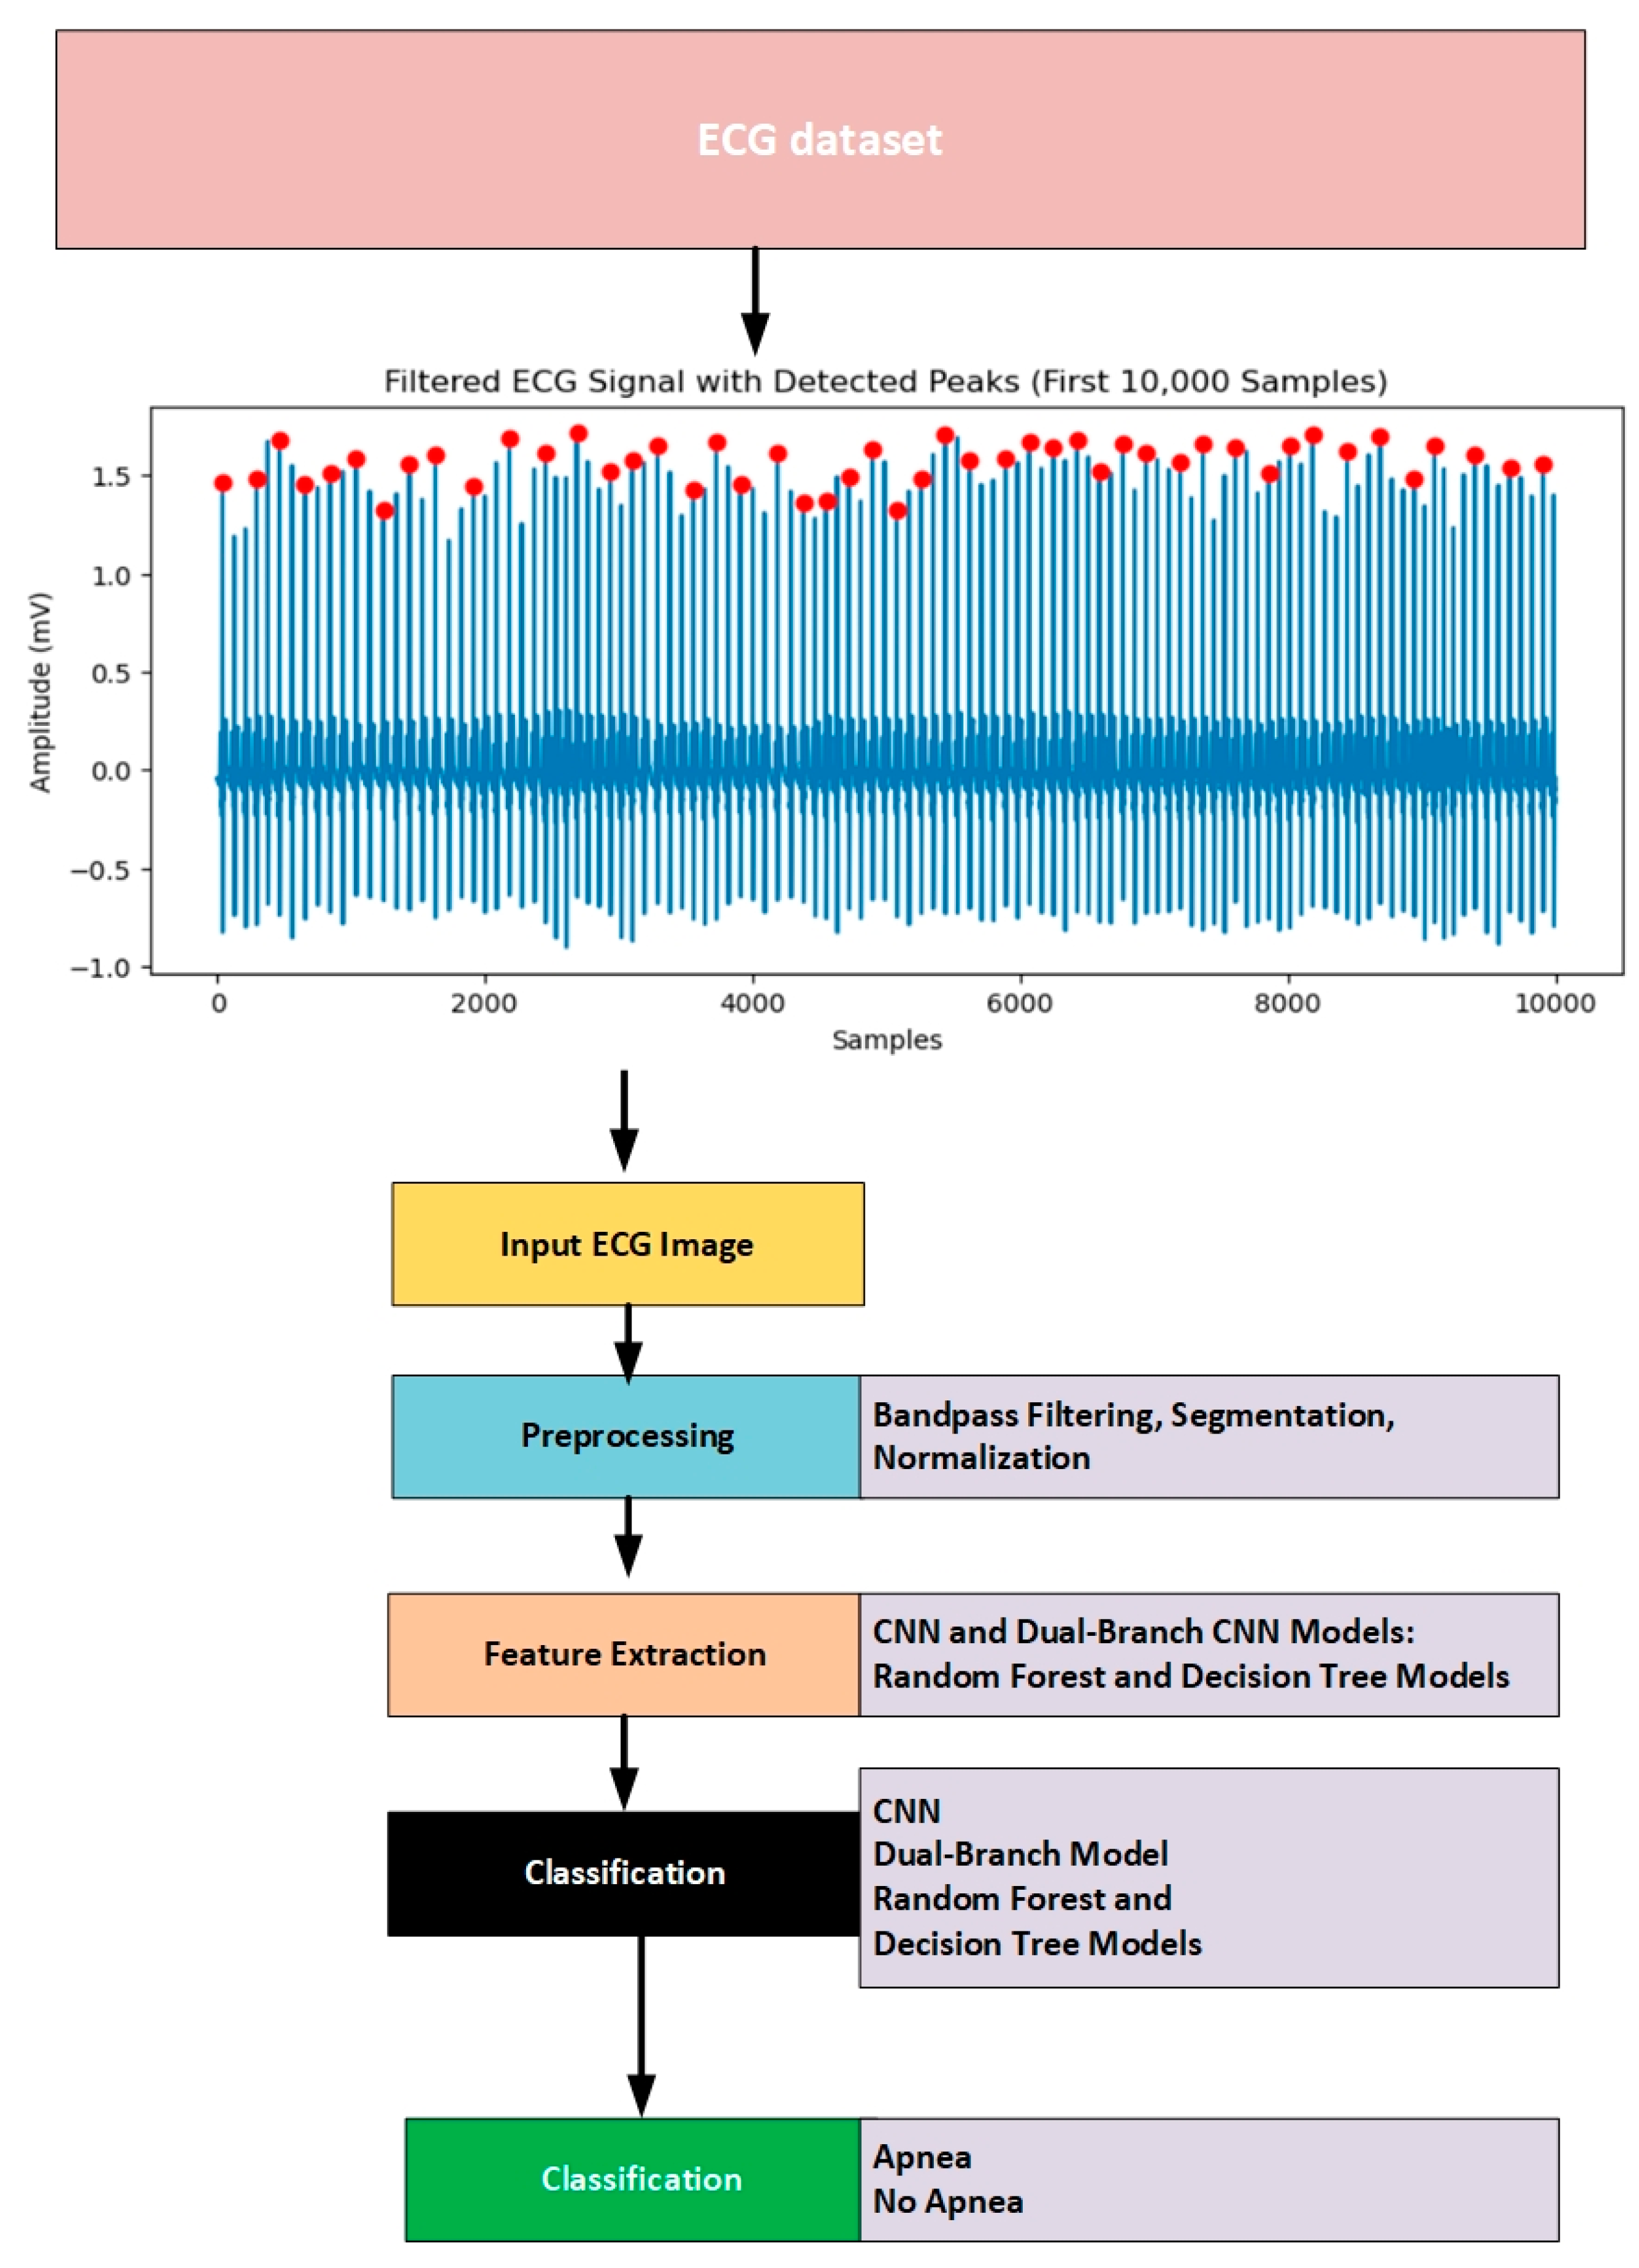
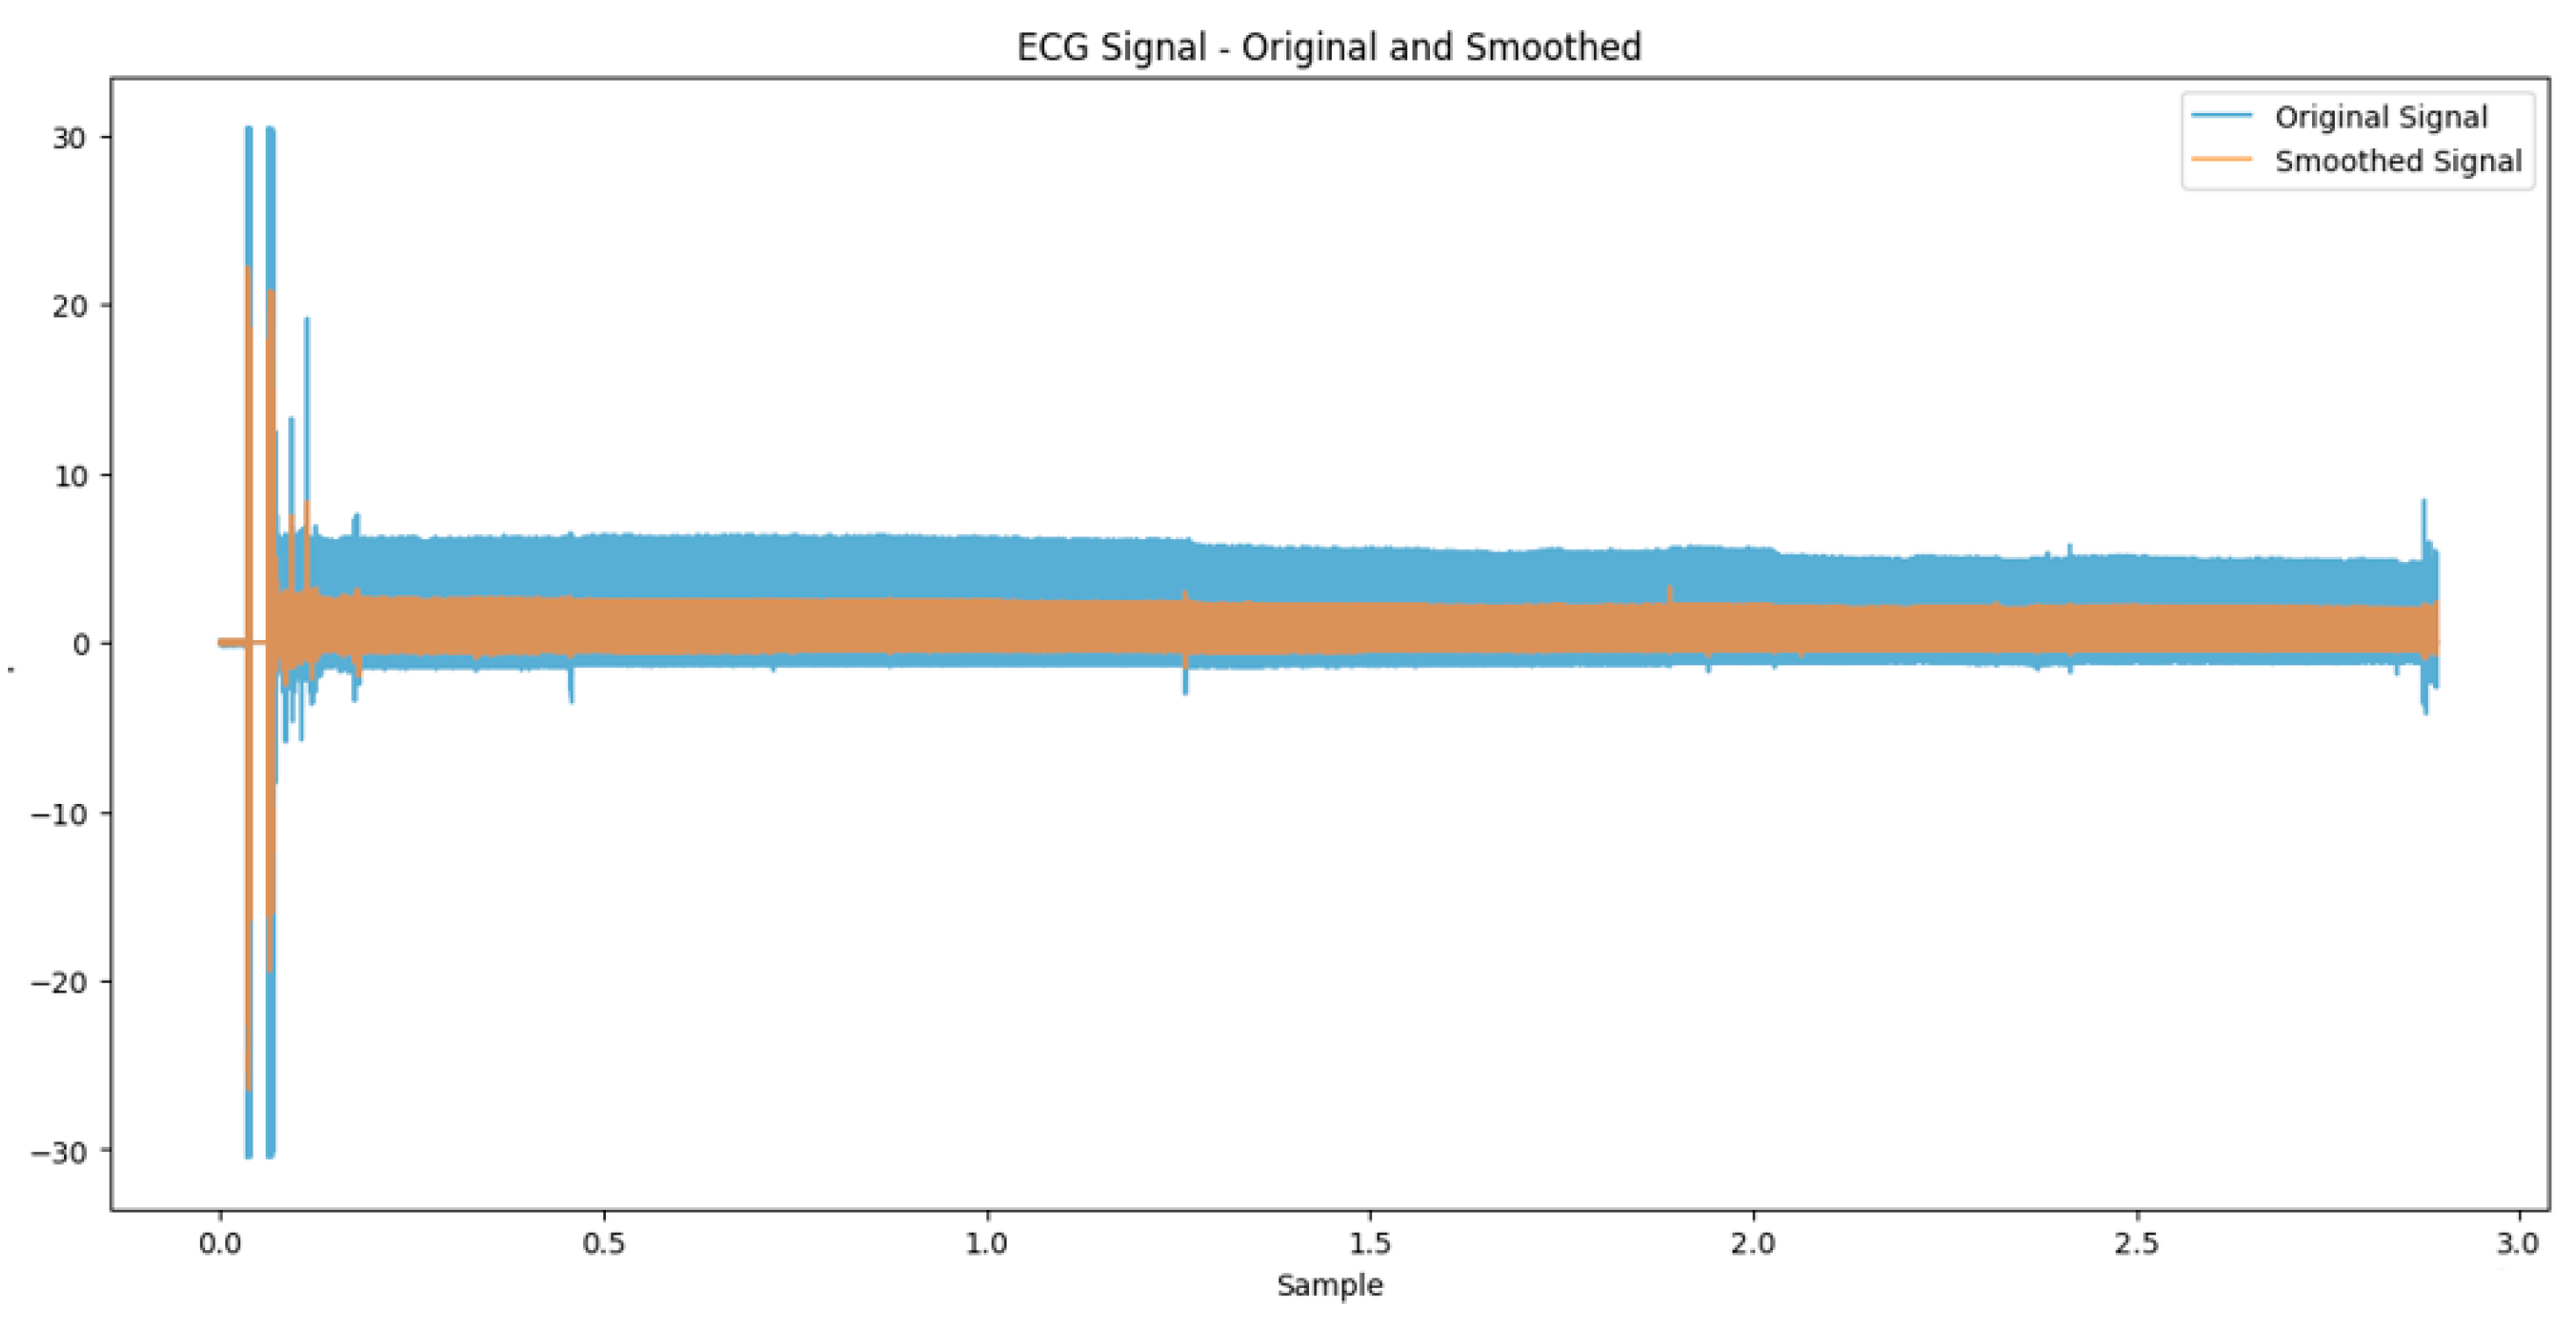
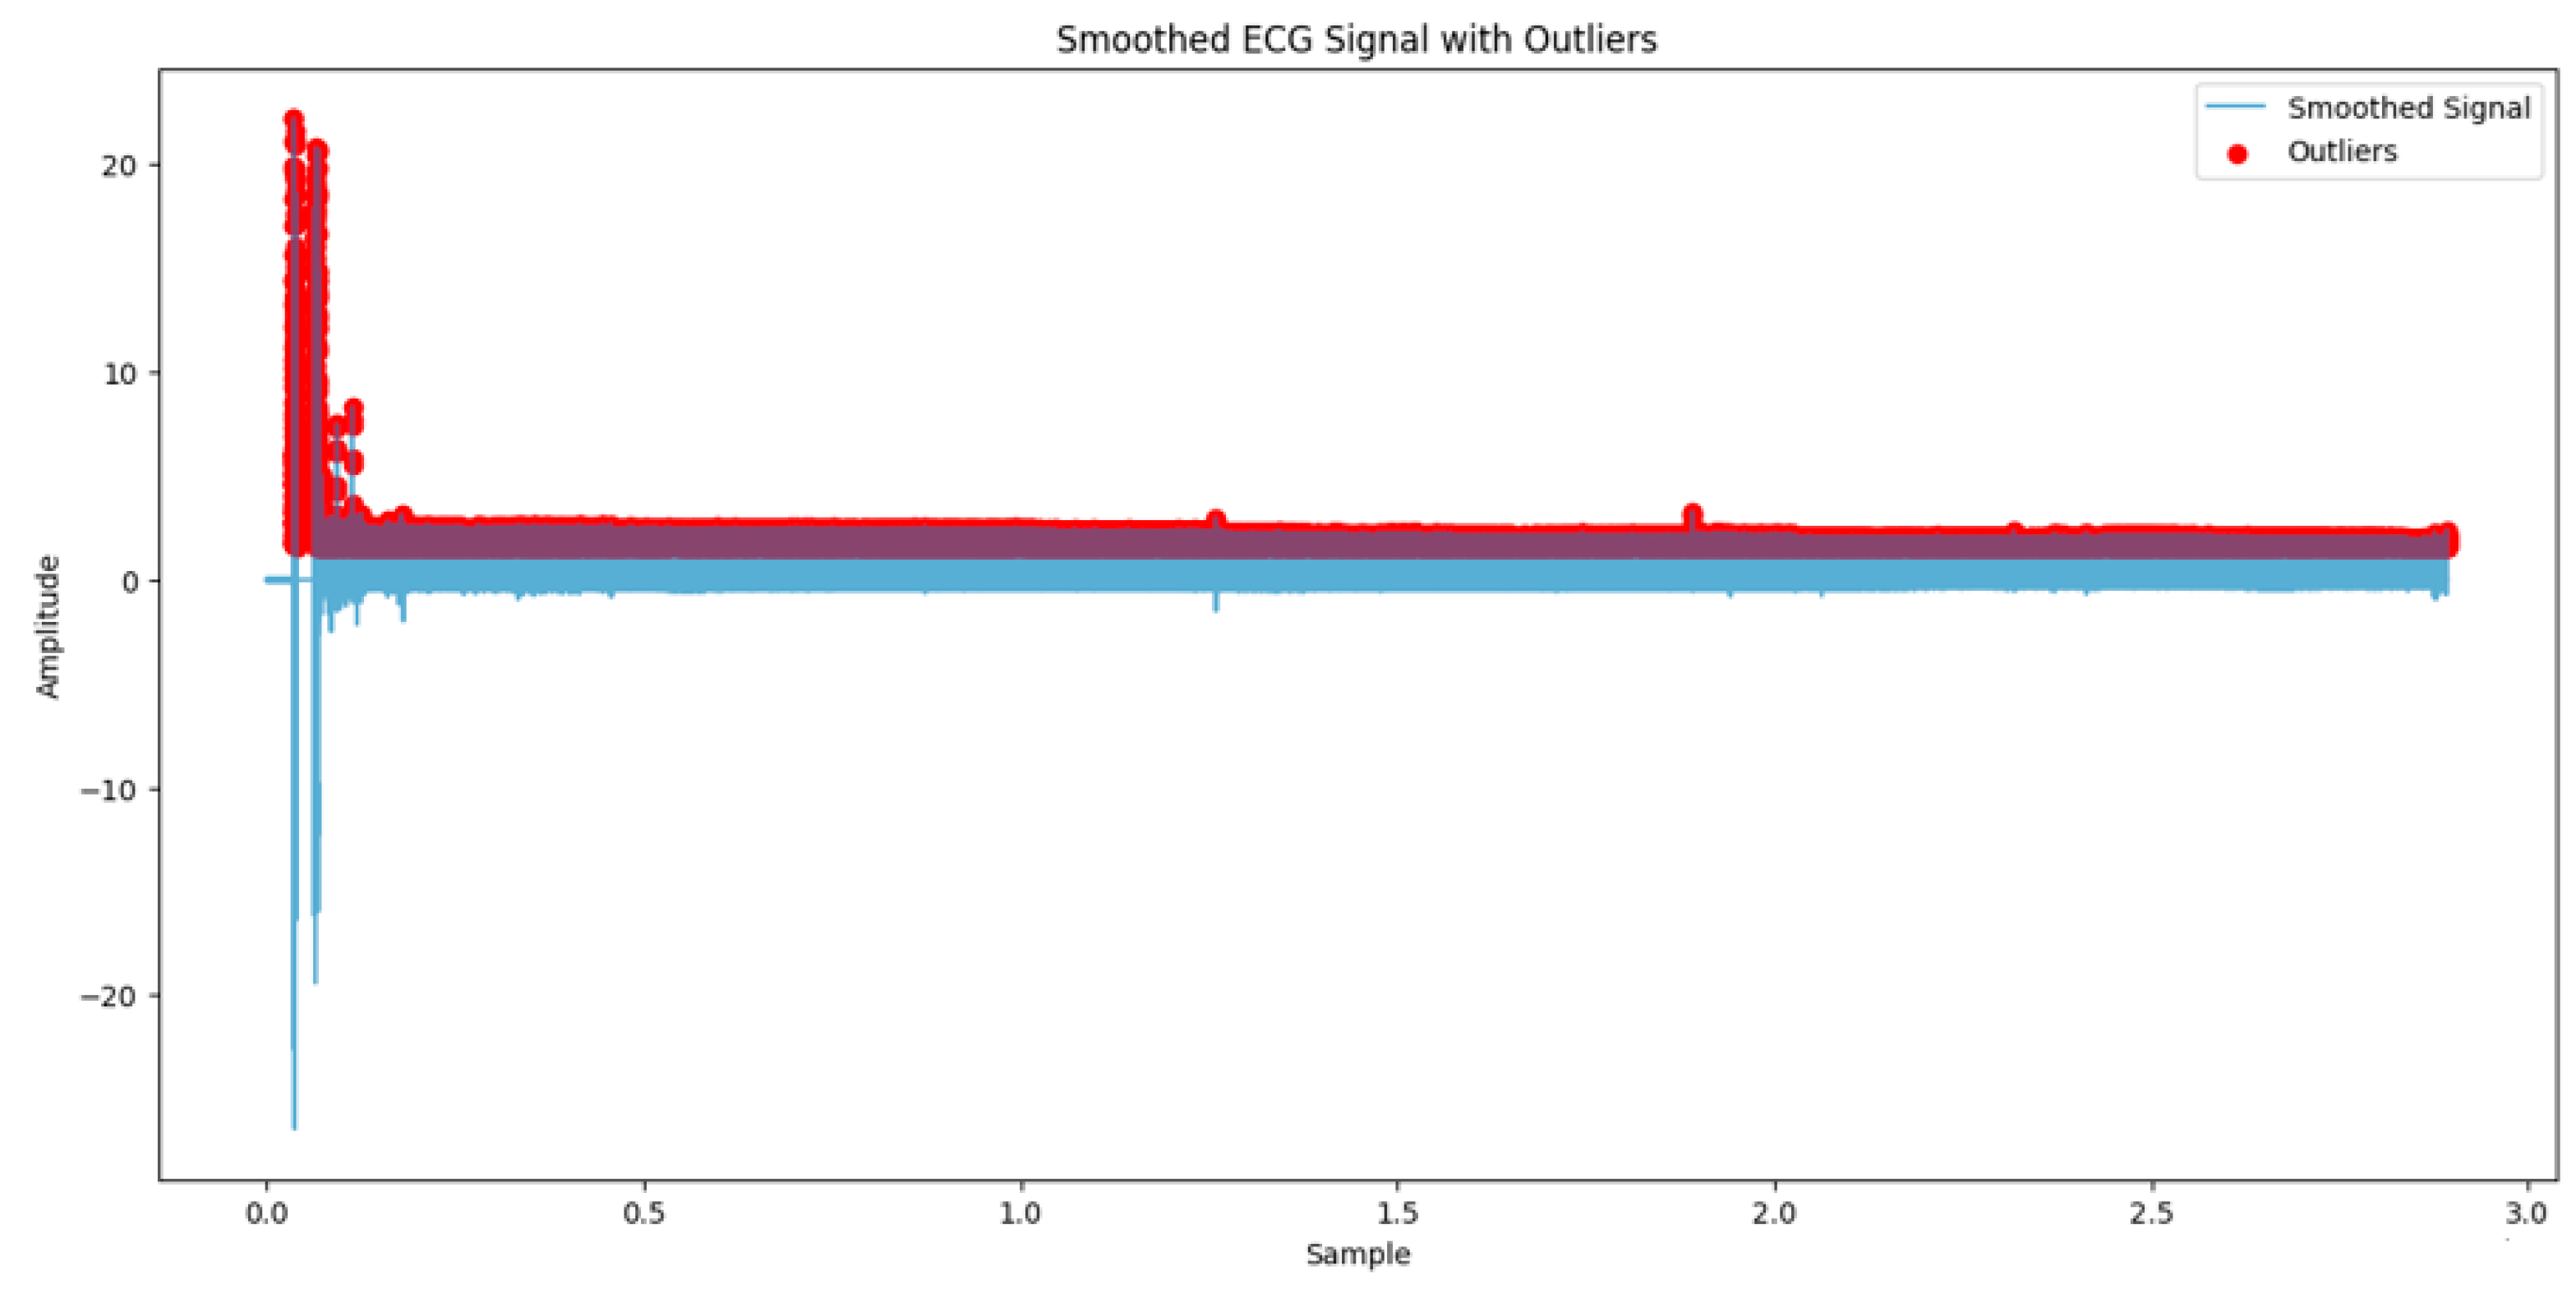
3.2. Preprocessing
3.3. Data Augmentation
3.4. Annotation
| Algorithm 1. Annotating sleep apnea events based on QRS complex counts in ECG signals |
| Input qrs_annotations (sample indices) sampling_rate (samples per second) time_window (duration of each window in seconds) QRS_threshold (minimum QRSD count threshold to avoid labels) Output: apnea_annotations (list of labels: Apnea and normal lables) Step: 1. window_size = time_window * sampling_rate 2. Determine num_windows = len(qrs_annotations)//window_size 3. Initialize an empty labels list called apnea_annotations = [] 4. For each window i from 0 to num_window −1, do as follows: 4.1 Set time start_sample = i * window_size 4.2 Set end_sample = start_sample + window_size 4.3 Count QRS in the current time window within start_sample, end_sample 4.4 if QRS_count < QRS_threshold , then 4.4.1 append apnea_annotations.append((‘A’, start_sample)) Else 4.4.2 apnea_annotations.append((‘N’, start_sample)) |
3.5. Proposed Solutions
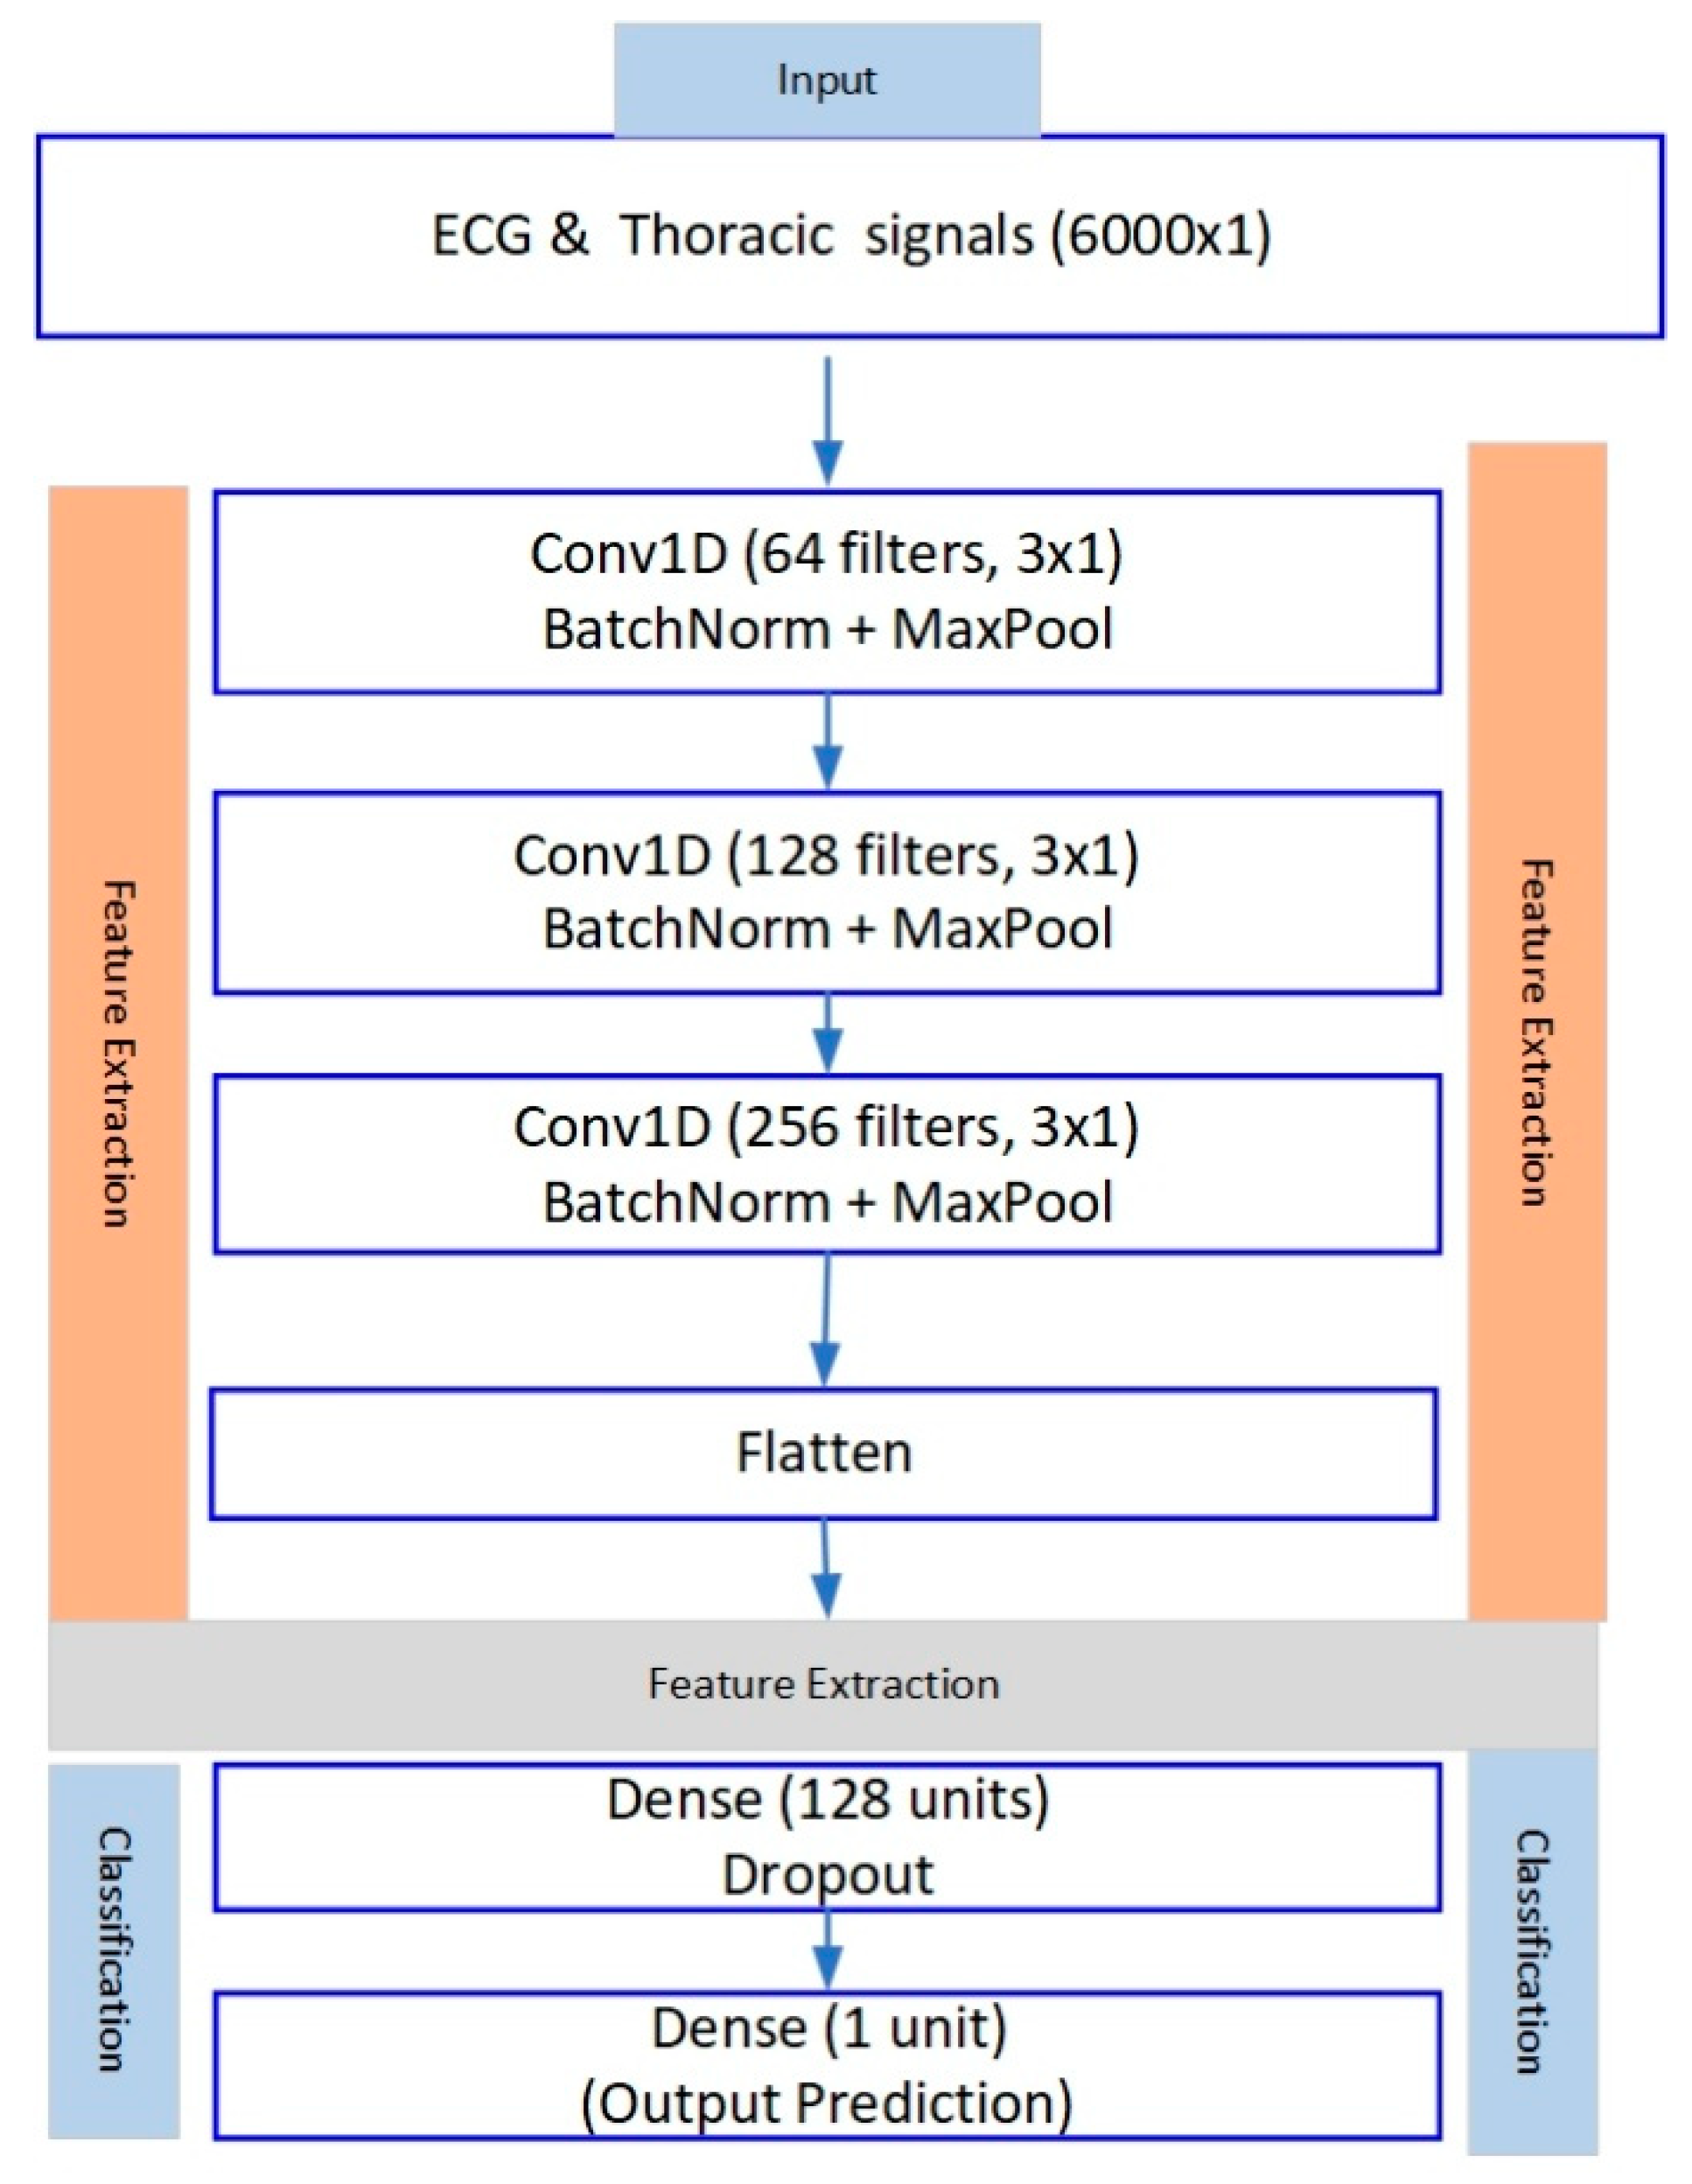
3.5.1. CNN Model
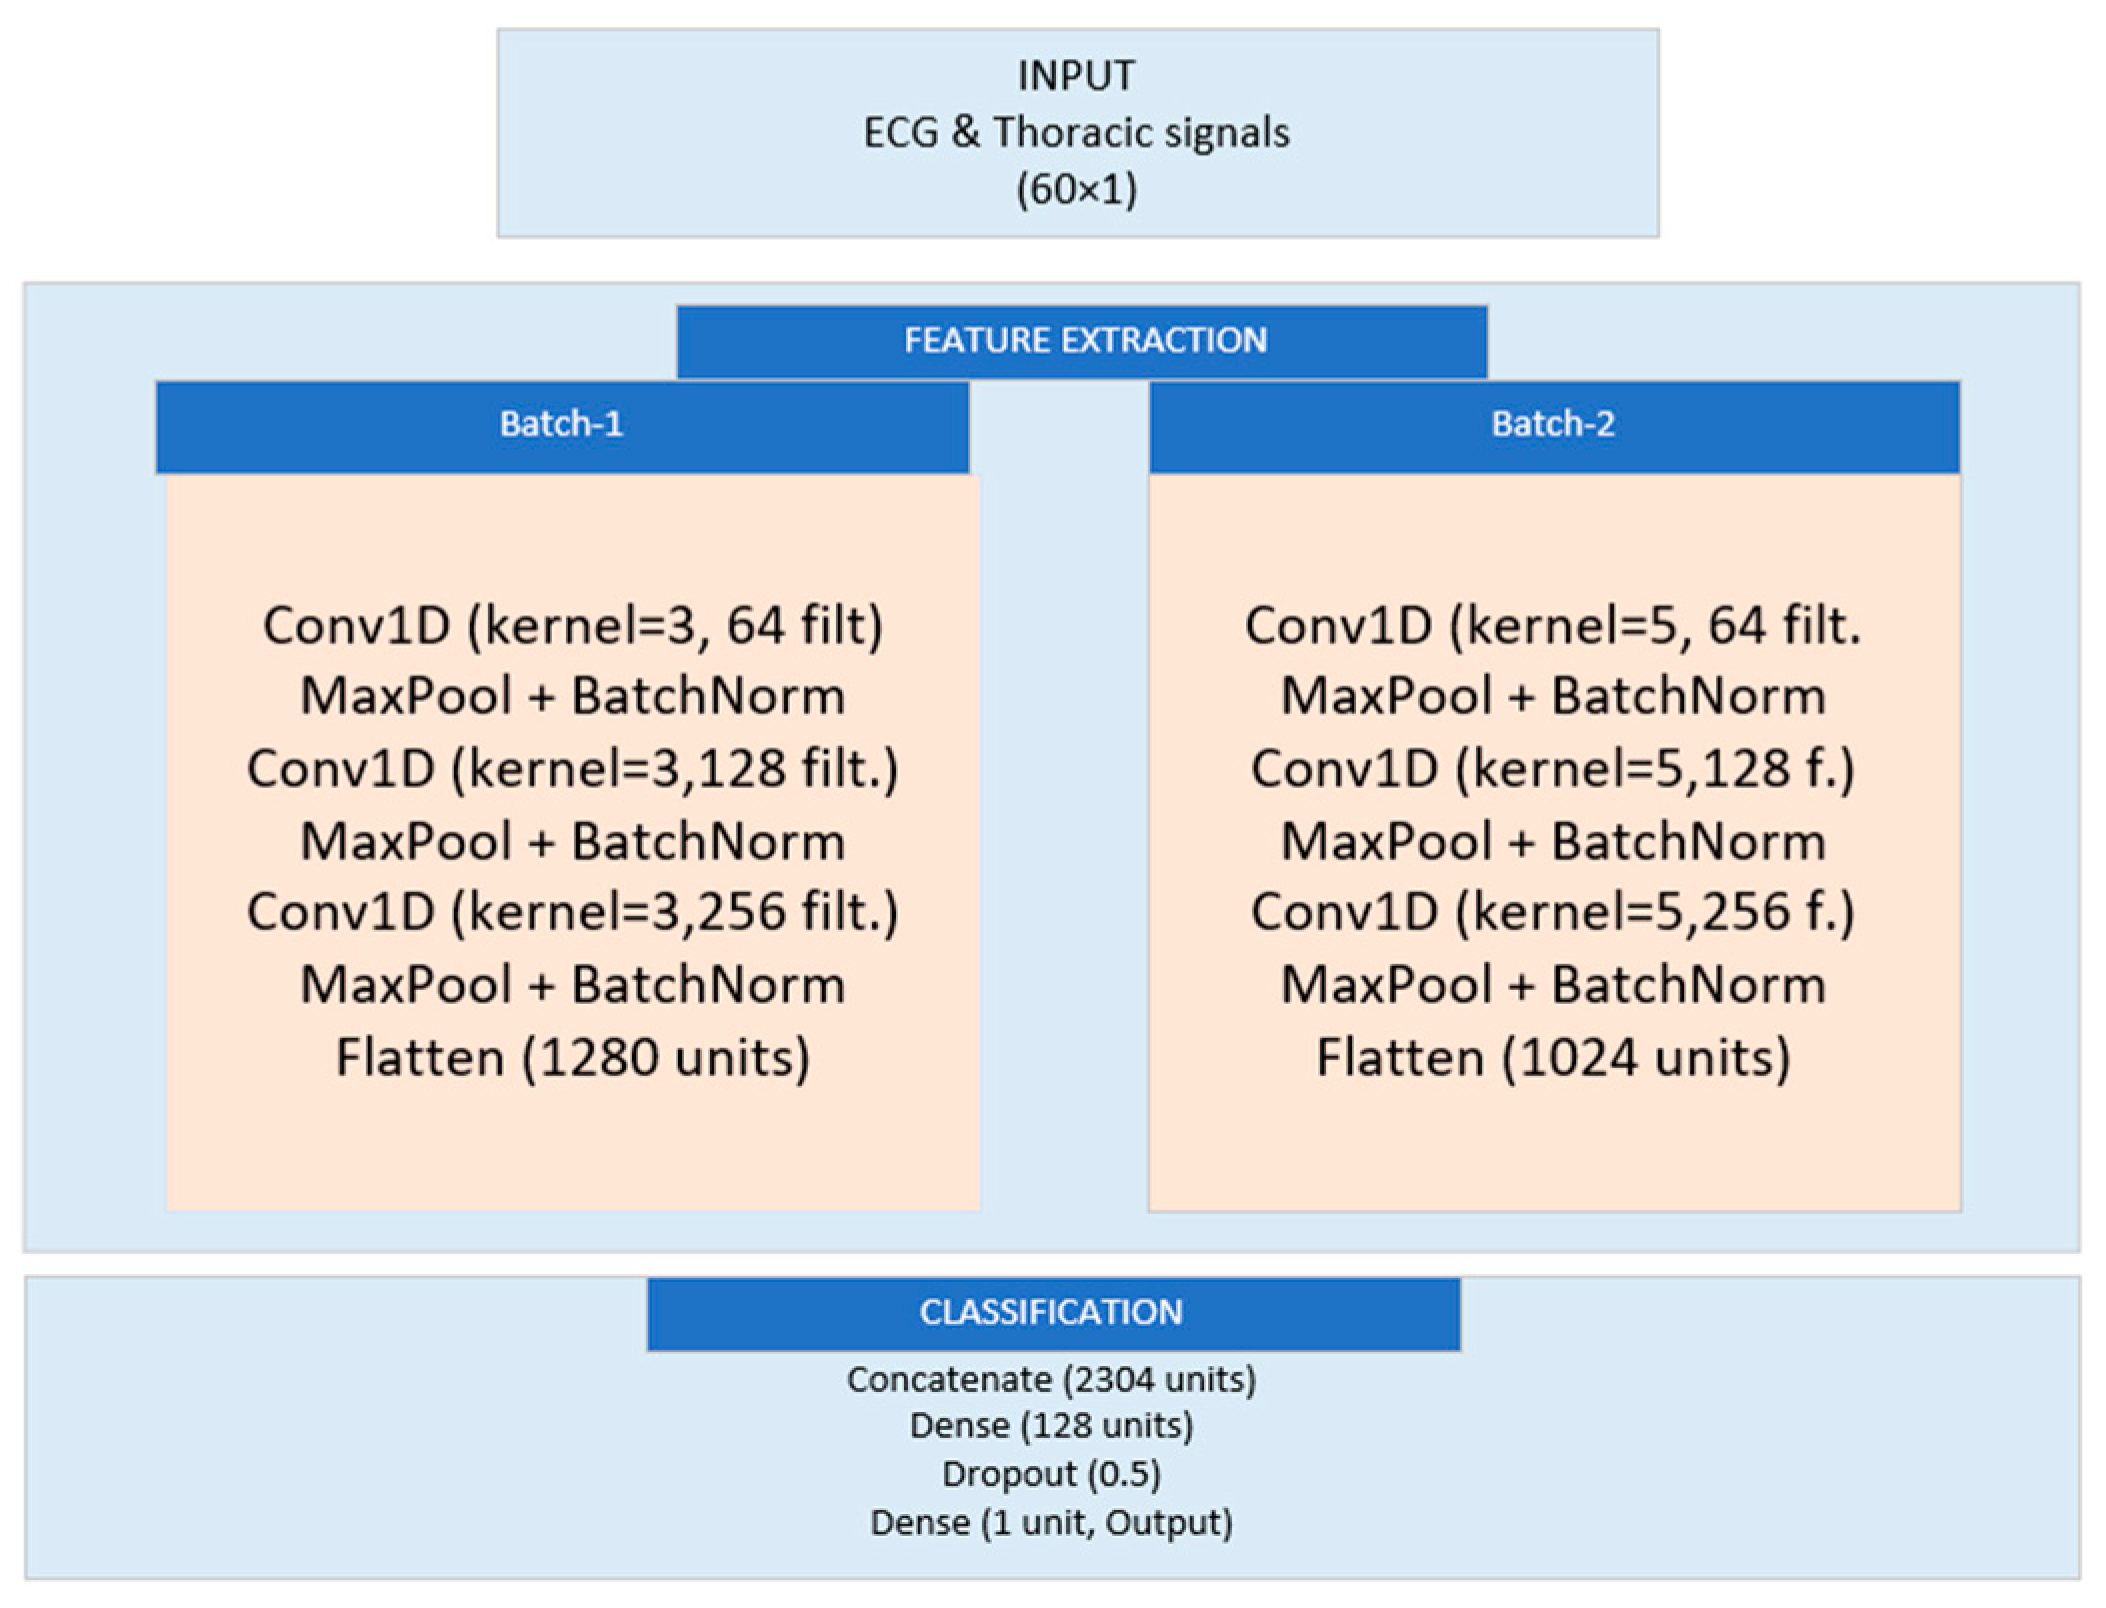
3.5.2. Dual-Branch Model
3.5.3. Decision Tree Model
3.6. Random Forest Classifier
3.7. Performance Evaluation Metrics
4. Experimental Results
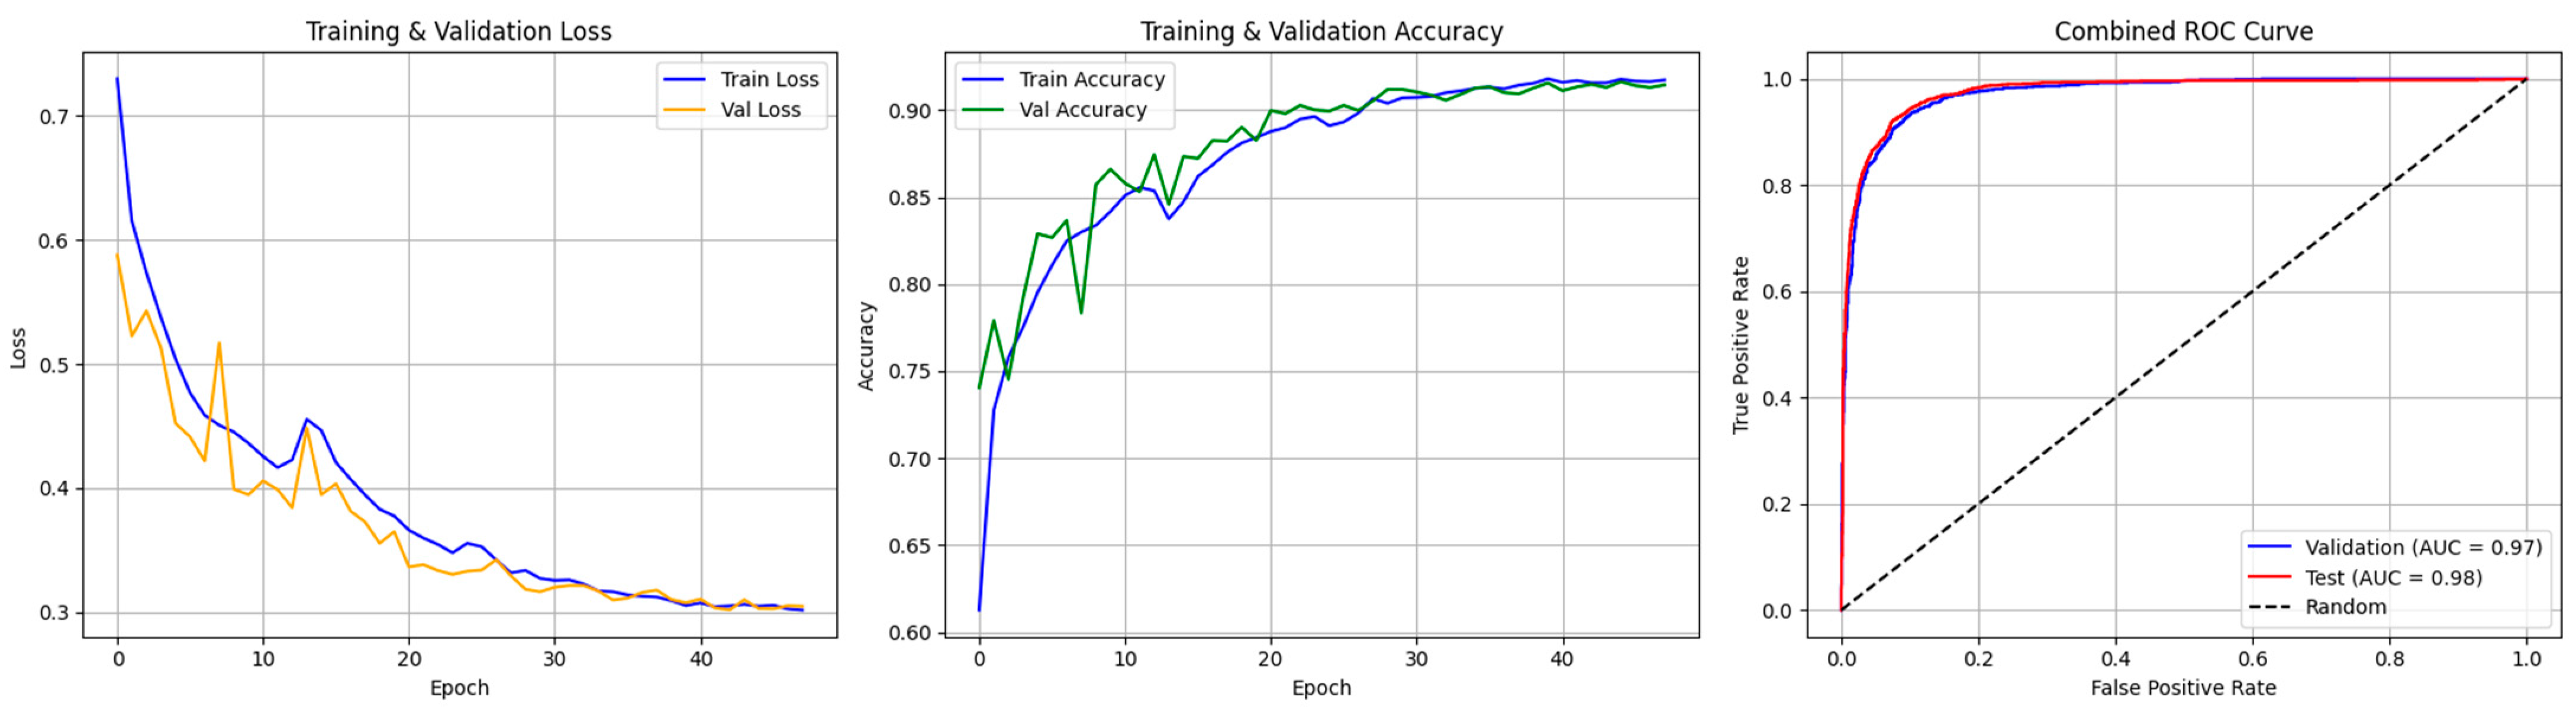
4.1. CNN Model
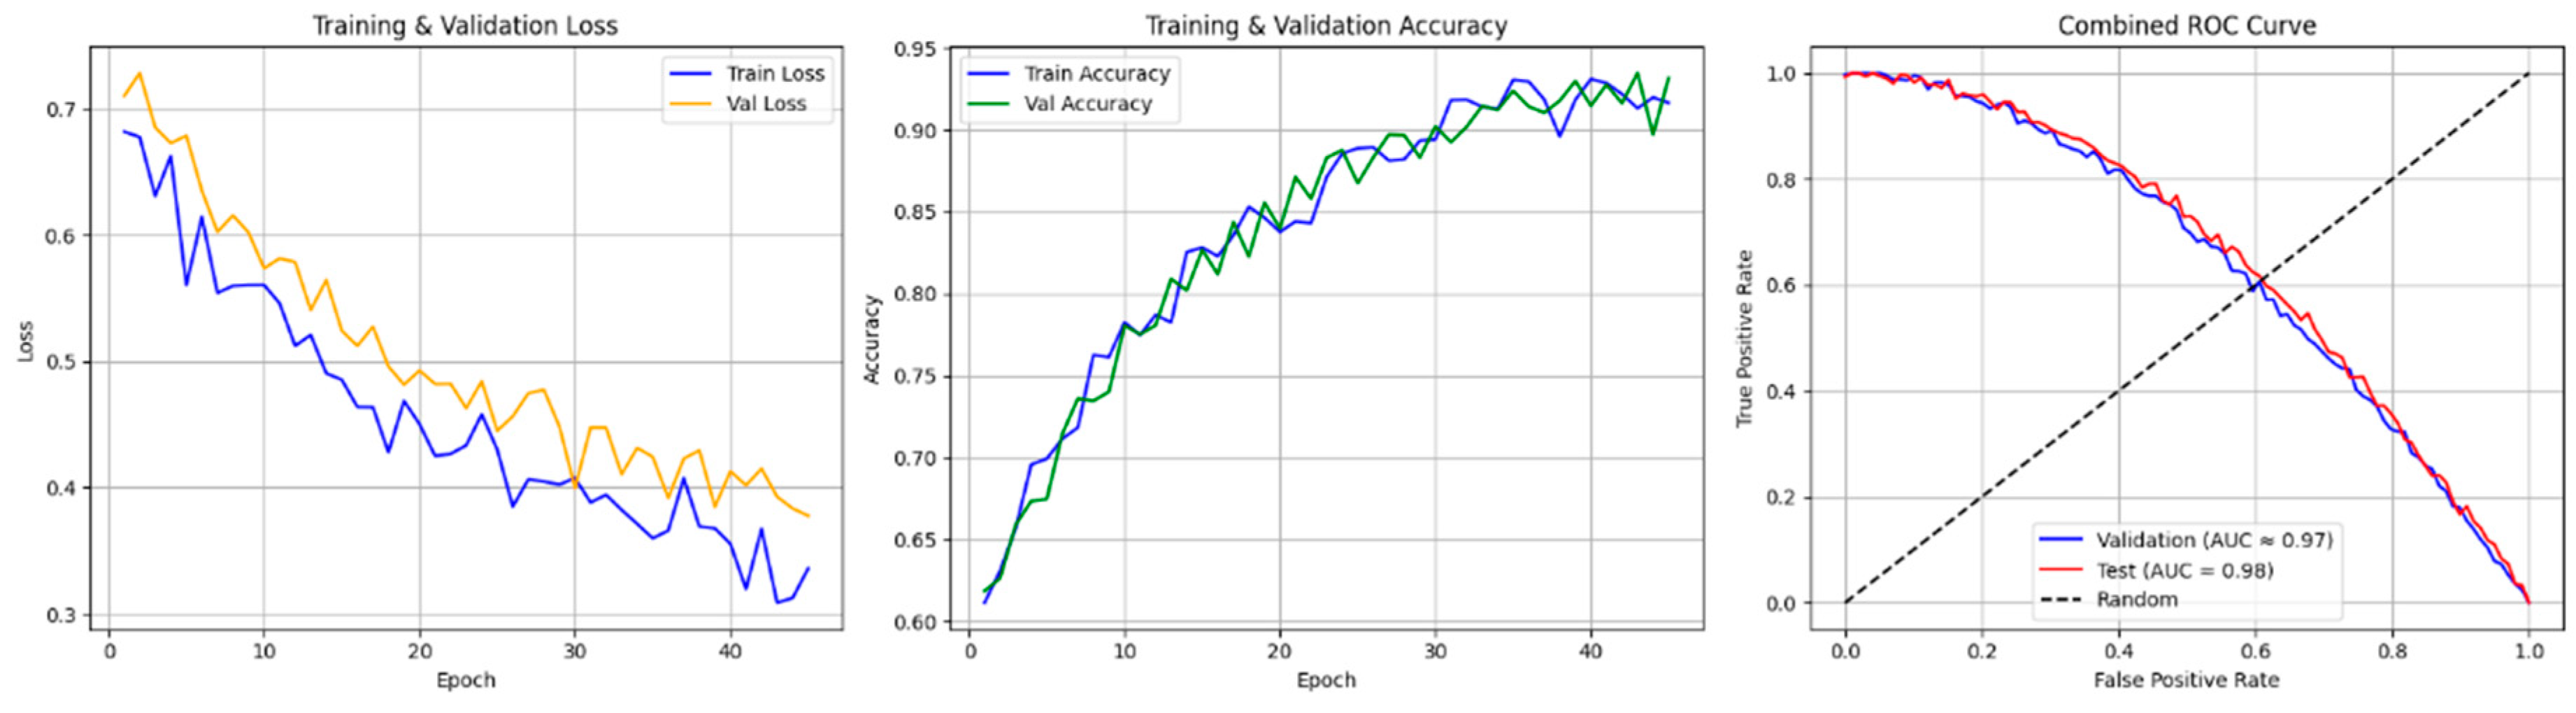
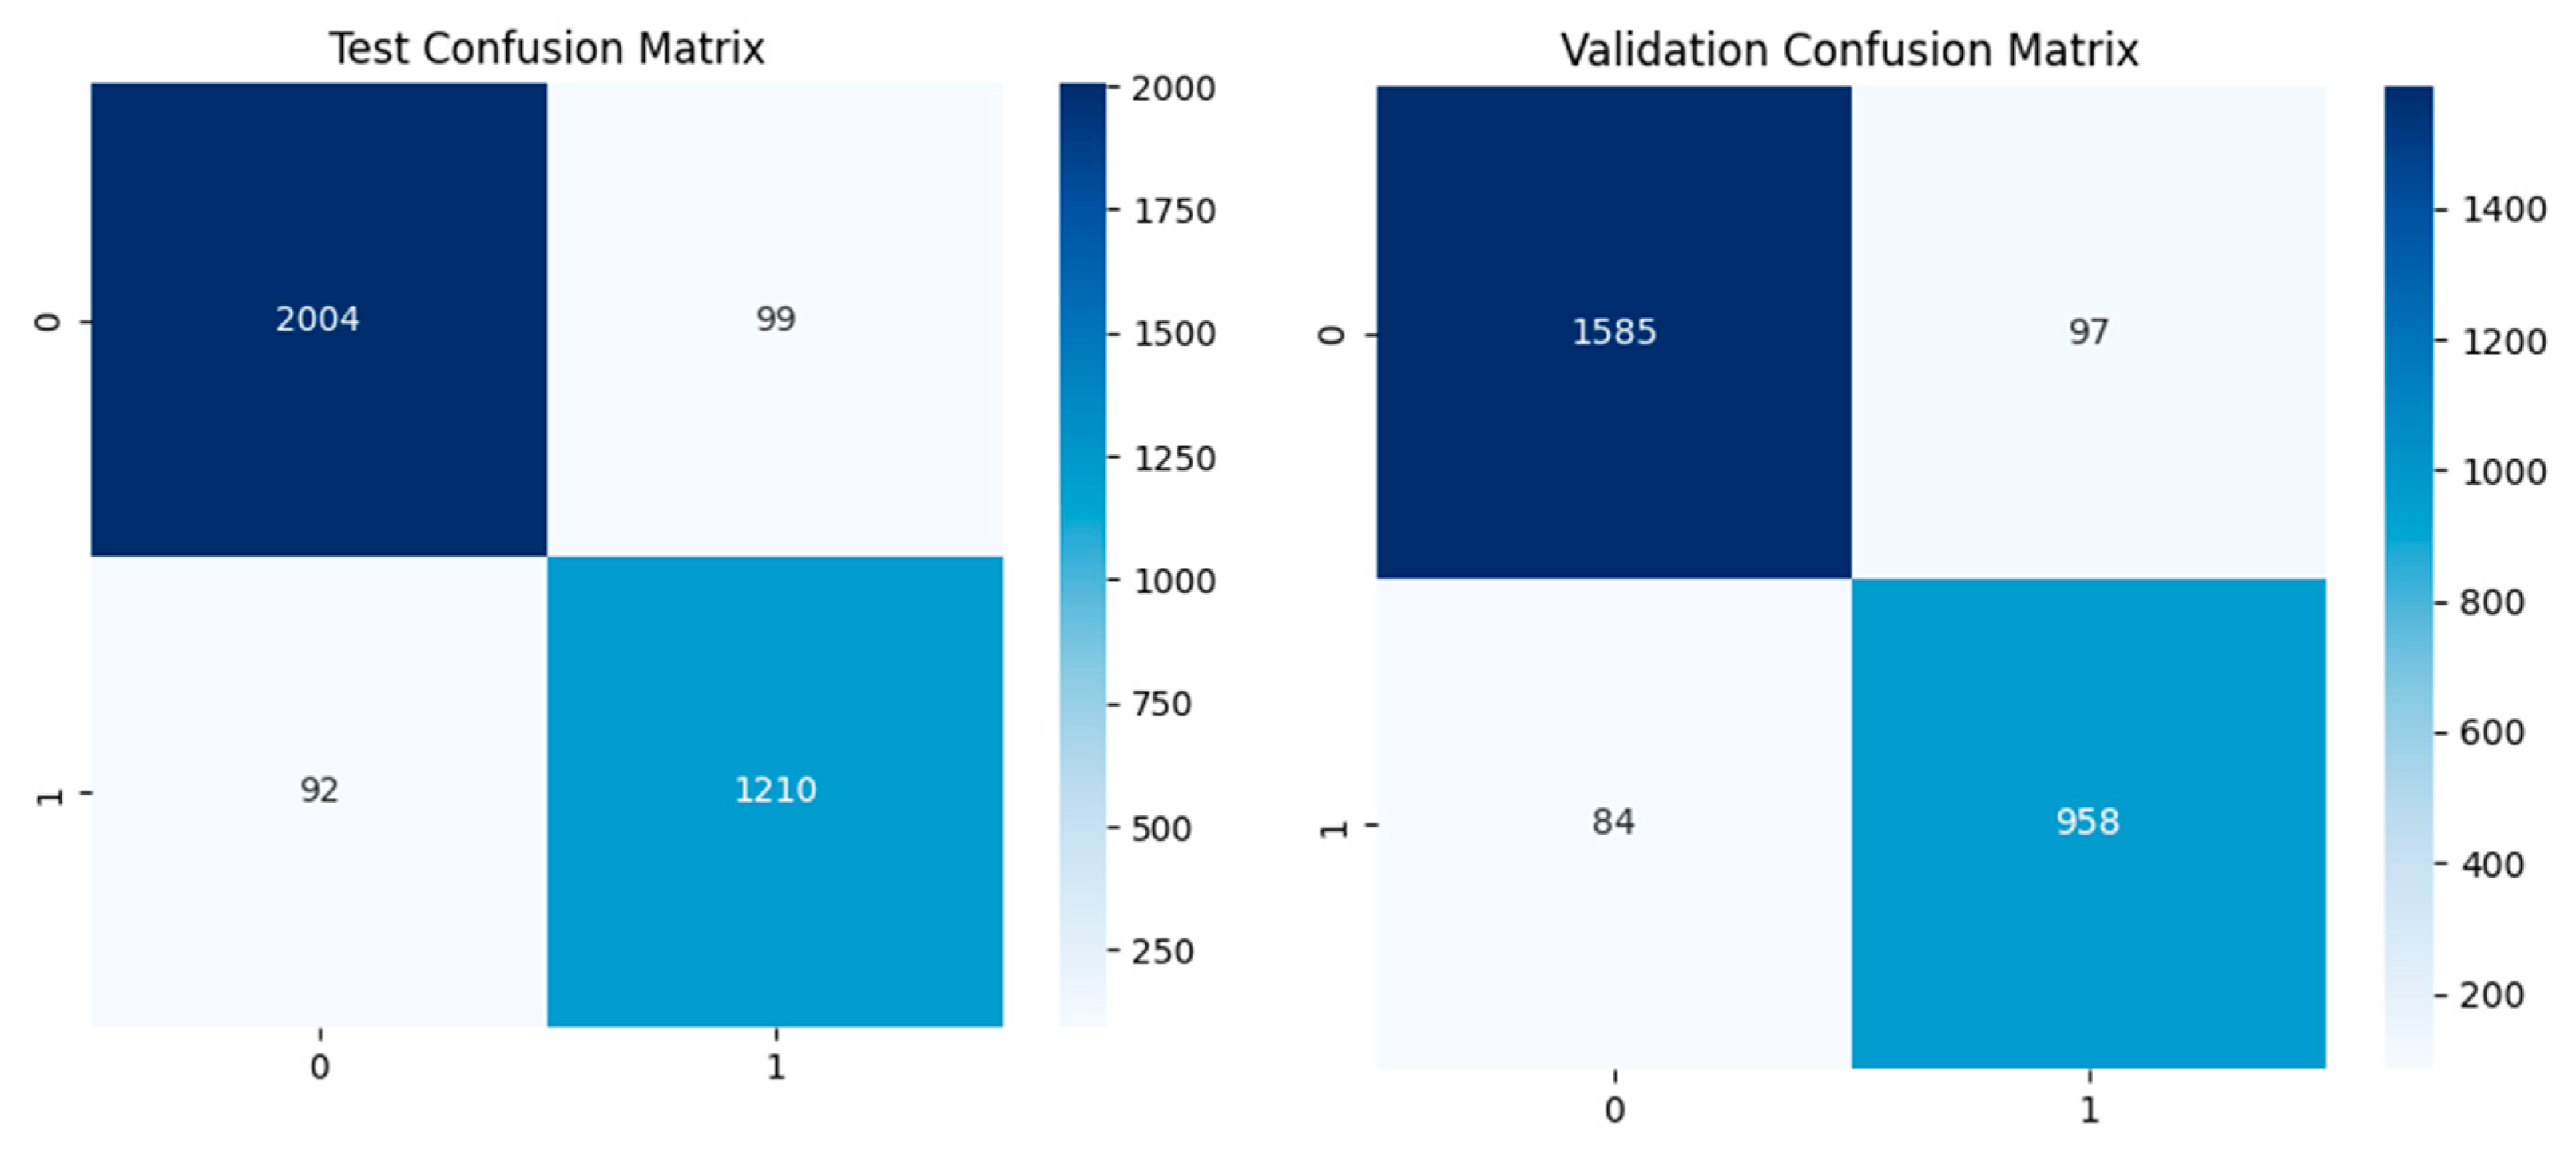
4.2. Dual-Branch Model
4.3. Random Forest
4.4. Decision Tree
5. Conclusions
Author Contributions
Funding
Institutional Review Board Statement
Informed Consent Statement
Data Availability Statement
Acknowledgments
Conflicts of Interest
References
- Bonekat, H.W.; Kimberly, A.H. Severe upper airway obstruction during sleep. Clin. Rev. Allergy Immunol. 2003, 25, 191–210. [Google Scholar] [CrossRef] [PubMed]
- Gerstenblith, G. Coronary Heart Disease 2007: Johns Hopkins White Papers; Johns Hopkins Health: Baltimore, MD, USA, 2007. [Google Scholar]
- Culebras, A.; Stephen, D.; John, S.F.; Carl, E.H.; Lyle, J.O.; Thomas, G.P.; Richard, R.; Mary, W.; Terry, Y. Sleep apnea and cardiovascular disease. J. Am. Coll. Cardiol. 2008, 52, 686–717. [Google Scholar]
- Pires, G.N.; Arnardóttir, E.S.; Islind, A.S.; Leppänen, T.; McNicholas, W.T. Consumer sleep technology for the screening of obstructive sleep apnea and snoring: Current status and a protocol for a systematic review and meta-analysis of diagnostic test accuracy. J. Sleep Res. 2023, 32, e13819. [Google Scholar] [CrossRef] [PubMed]
- Sharma, M.; Bapodara, S.; Tiwari, J.; Acharya, U.R. Automated sleep apnea detection in pregnant women using wavelet-based features. Inform. Med. Unlocked 2022, 32, 101026. [Google Scholar] [CrossRef]
- Ahmadzadeh, S.; Luo, J.; Wiffen, R. Review on biomedical sensors, technologies and algorithms for diagnosis of sleep disordered breathing: Comprehensive survey. IEEE Rev. Biomed. Eng. 2020, 15, 4–22. [Google Scholar] [CrossRef]
- Jobert, M.; Wilson, F.J.; Roth, T.; Ruigt, G.S.; Anderer, P.; Drinkenburg, W.H. IPEG Pharmaco-EEG Guidelines Committee Guidelines for the recording and evaluation of pharmaco-sleep studies in man: The International Pharmaco-EEG Society (IPEG). Neuropsychobiology 2013, 67, 127–167. [Google Scholar] [CrossRef]
- Randazzo, V.; Ferretti, J.; Pasero, E. Anytime ECG monitoring through the use of a low-cost, user-friendly, wearable device. Sensors 2021, 21, 6036. [Google Scholar] [CrossRef]
- Kwon, S.; Kim, H.; Yeo, W.-H. Recent advances in wearable sensors and portable electronics for sleep monitoring. iScience 2021, 24, 102461. [Google Scholar] [CrossRef]
- Lazaros, K.; Adam, S.; Krokidis, M.G.; Exarchos, T.; Vlamos, P.; Vrahatis, A.G. Non-Invasive Biomarkers in the Era of Big Data and Machine Learning. Sensors 2025, 25, 1396. [Google Scholar] [CrossRef]
- Baig, M.M.; Gholamhosseini, H.; Connolly, M.J. A comprehensive survey of wearable and wireless ECG monitoring systems for older adults. Med Biol. Eng. Comput. 2013, 51, 485–495. [Google Scholar] [CrossRef]
- Bahrami, M.; Forouzanfar, M. Sleep apnea detection from single-lead ECG: A comprehensive analysis of machine learning and deep learning algorithms. IEEE Trans. Instrum. Meas. 2022, 71, 1–11. [Google Scholar] [CrossRef]
- Farraj, A.K.; Mehdi, S.H.; Najwa, H.-C.; Christina, L.; Darrell, W.W.; Yue, G.; Allen, D.L.; Carll, A.P.; Bruno, M.; Ghio, A.; et al. ST depression, arrhythmia, vagal dominance, and reduced cardiac micro-RNA in particulate-exposed rats. Am. J. Respir. Cell Mol. Biol. 2011, 44, 185–196. [Google Scholar] [CrossRef] [PubMed]
- Kim, J.; Andre, E. Emotion recognition based on physiological changes in music listening. IEEE Trans. Pattern Anal. Mach. Intell. 2008, 30, 2067–2083. [Google Scholar] [CrossRef] [PubMed]
- Ringeval, F.; Eyben, F.; Kroupi, E.; Yuce, A.; Thiran, J.-P.; Ebrahimi, T.; Lalanne, D.; Schuller, B. Prediction of asynchronous dimensional emotion ratings from audiovisual and physiological data. Pattern Recognit. Lett. 2015, 66, 22–30. [Google Scholar] [CrossRef]
- Nguyen, T.H.; Grishman, R. Combining neural networks and log-linear models to improve relation extraction. arXiv 2015, arXiv:1511.05926. [Google Scholar]
- Masci, J.; Meier, U.; Cireşan, D.; Schmidhuber, J. Stacked convolutional auto-encoders for hierarchical feature extraction. In Artificial Neural Networks and Machine Learning–ICANN 2011: 21st International Conference on Artificial Neural Networks, Espoo, Finland, 14–17 June 2011, Proceedings, Part I 21; Springer: Berlin/Heidelberg, Germany, 2011; pp. 52–59. [Google Scholar]
- Sheta, A.; Turabieh, H.; Thaher, T.; Too, J.; Mafarja, M.; Hossain, M.S.; Surani, S.R. Diagnosis of obstructive sleep apnea from ECG signals using machine learning and deep learning classifiers. Appl. Sci. 2021, 11, 6622. [Google Scholar] [CrossRef]
- Bernardini, A.; Brunello, A.; Gigli, G.L.; Montanari, A.; Saccomanno, N. AIOSA: An approach to the automatic identification of obstructive sleep apnea events based on deep learning. Artif. Intell. Med. 2021, 118, 102133. [Google Scholar] [CrossRef]
- Kim, S.W.; Kim, H.H.; Lee, H.; Kim, I.K.; Lee, S.H.; Kang, H.H. KL-6 in obstructive sleep apnea: A potential biomarker of subclinical lung injury. Chronobiol. Med. 2021, 3, 64–69. [Google Scholar] [CrossRef]
- Huang, J.; Zhuang, J.; Zheng, H.; Yao, L.; Chen, Q.; Wang, J.; Fan, C. A Machine Learning Prediction Model of Adult Obstructive Sleep Apnea Based on Systematically Evaluated Common Clinical Biochemical Indicators. Nat. Sci. Sleep 2024, 16, 413–428. [Google Scholar] [CrossRef]
- Li, Z.; Jia, Y.; Li, Y.; Han, D. Automatic prediction of obstructive sleep apnea event using deep learning algorithm based on ECG and thoracic movement signals. Acta Oto-Laryngol. 2024, 144, 52–57. [Google Scholar] [CrossRef]
- Yue, H.; Lin, Y.; Wu, Y.; Wang, Y.; Li, Y.; Guo, X.; Huang, Y.; Wen, W.; Zhao, G.; Pang, X.; et al. Deep learning for diagnosis and classification of obstructive sleep apnea: A nasal airflow-based multi-resolution residual network. Nat. Sci. Sleep 2021, 13, 361–373. [Google Scholar] [CrossRef] [PubMed]
- Monna, F.; Ben Messaoud, R.; Navarro, N.; Baillieul, S.; Sanchez, L.; Loiodice, C.; Tamisier, R.; Joyeux-Faure, M.; Pépin, J.-L. Machine learning and geometric morphometrics to predict obstructive sleep apnea from 3D craniofacial scans. Sleep Med. 2022, 95, 76–83. [Google Scholar] [CrossRef] [PubMed]
- Cen, L.; Yu, Z.L.; Kluge, T.; Ser, W. Automatic system for obstructive sleep apnea events detection using convolutional neural network. In Proceedings of the 2018 40th Annual International Conference of the IEEE Engineering in Medicine and Biology Society (EMBC), Honolulu, HI, USA, 17–21 July 2018; pp. 3975–3978. [Google Scholar]
- Nassehi, F.; Eken, A.; Atalay, N.B.; Firat, H.; Eroğul, O. Machine learning based severity classification of obstructive sleep apnea patients using awake EEG. Biomed. Signal Process. Control. 2024, 96, 106566. [Google Scholar] [CrossRef]
- Liu, M.-H.; Chien, S.-Y.; Wu, Y.-L.; Sun, T.-H.; Huang, C.-S.; Hsu, K.-C.; Hang, L.-W. EfficientNet-based machine learning architecture for sleep apnea identification in clinical single-lead ECG signal data sets. Biomed. Eng. Online 2024, 23, 57. [Google Scholar] [CrossRef]
- Jiménez-García, J.; García, M.; Gutiérrez-Tobal, G.C.; Kheirandish-Gozal, L.; Vaquerizo-Villar, F.; Álvarez, D.; del Campo, F.; Gozal, D.; Hornero, R. An explainable deep-learning architecture for pediatric sleep apnea identification from overnight airflow and oximetry signals. Biomed. Signal Process. Control. 2024, 87, 105490. [Google Scholar] [CrossRef]
- Goldberger, A.; Amaral, L.; Glass, L.; Hausdorff, J.; Ivanov, P.C.; Mark, R.; Stanley, H.E. PhysioBank, PhysioToolkit, and PhysioNet: Components of a new research resource for complex physiologic signals. Circulation 2000, 101, e215–e220. [Google Scholar] [CrossRef]
- Tyagi, P.K.; Agrawal, D. Automatic detection of sleep apnea from single-lead ECG signal using enhanced-deep belief network model. Biomed. Signal Process. Control. 2023, 80, 104401. [Google Scholar] [CrossRef]
- Anbalagan, T.; Nath, M.K.; Keerthi, D.S.; Pranathi, K.; Satyanarayana, K. A novel deep learning approach for detection of sleep apnea from ECG signal. In Proceedings of the IEEE 2023 4th International Conference on Signal Processing and Communication (ICSPC), Coimbatore, India, 23–24 March 2023; pp. 6–10. [Google Scholar]
- Hu, S.; Wang, Y.; Liu, J.; Yang, C. Personalized transfer learning for single-lead ecg-based sleep apnea detection: Exploring the label mapping length and transfer strategy using hybrid transformer model. IEEE Trans. Instrum. Meas. 2023, 72, 1–15. [Google Scholar] [CrossRef]
- Barhanpurkar, K.; Rajawat, A.S.; Bedi, P.; Mohammed, O. Detection of sleep apnea & cancer mutual symptoms using deep learning techniques. In Proceedings of the IEEE 2020 Fourth International Conference on I-SMAC (IoT in Social, Mobile, Analytics and Cloud) (I-SMAC), Palladam, India, 7–9 October 2020; pp. 821–828. [Google Scholar]
- Lakhan, P.; Ditthapron, A.; Banluesombatkul, N.; Wilaiprasitporn, T. Deep neural networks with weighted averaged overnight airflow features for sleep apnea-hypopnea severity classification. In Proceedings of the IEEE TENCON 2018—2018 IEEE Region 10 Conference, Jeju Island, Republic of Korea, 28–31 October 2018; pp. 0441–0445. [Google Scholar]
- Thompson, S.; Reilly, D.; Fergus, P.; Chalmers, C. Detection of Obstructive Sleep Apnoea Using Features Extracted From Segmented Time-Series ECG Signals with a One Dimensional Convolutional Neural Network. IEEE Access 2023, 12, 1076–1091. [Google Scholar] [CrossRef]
- Kristiansen, S.; Nikolaidis, K.; Plagemann, T.; Goebel, V.; Traaen, G.M.; Øverland, B.; Aakerøy, L.; Hunt, T.-E.; Loennechen, J.P.; Steinshamn, S.L.; et al. Machine learning for sleep apnea detection with unattended sleep monitoring at home. ACM Trans. Comput. Heal. 2021, 2, 1–25. [Google Scholar] [CrossRef]
- Arslan, R.S. Sleep disorder and apnea events detection framework with high performance using two-tier learning model design. PeerJ Comput. Sci. 2023, 9, e1554. [Google Scholar] [CrossRef]


| Reference | Technique Used | Achievements | Problems Identified |
|---|---|---|---|
| [18] Sheta et al. (2021) | Dual-branch CNN on ECG signals | Higher accuracy | No significant drawbacks mentioned |
| [19] Bernardini et al. (2021) | AIOSA deep learning model (heart and breathing signals) | Higher accuracy | Computationally expensive; sensitive to signal noise; poor explainability |
| [20] Kim et al. (2021) | KL-6 biomarker blood test | Identified OSA severity | Invasive method |
| [21] Huang et al. (2024) | Logistic regression with BMI and TyG index | Low AUC | Limited validation |
| [22] Li et al. (2024) | ResNeSt34 deep learning (ECG + thoracic signals) | High Accuracy | Works well with time series text data but reduced performance when used with ECG |
| [23] Yue et al. (2021) | Multi-resolution residual network (Mr-ResNet) with nasal airflow | Excellent accuracy and sensitivity | Invasive method |
| [24] Monna et al. (2022) | 3D maxillofacial shape analysis and machine learning | High accuracy | 3D Scanning is needed, meaning extra load on the CPU |
| [25] Cen et al. (2018) | CNN | Real-time OSA event detection accuracy ~79.61% | Complex; has low performance when signals are mixed |
| [26] Nassehi et al. (2024) | KNN classifier on resting-state EEG | High accuracy (93.33%), excellent AUC (0.98) | Dataset is very small |
| [27] Liu et al. (2024) | EfficientNet + XGBoost on single-lead ECG | Excellent AUC (0.917–0.975), high accuracy (85.5–92.8%) | Model interpretation focuses only on specific apnea events, meaning that the model has difficulty identifying hypopneas with arousals |
| [28] Jiménez-García et al. (2024) | CNN + RNN on airflow and oximetry signals (pediatric) | High diagnostic accuracy (≥84%), good interpretability using Grad-CAM | Only for pediatrics |
| Dataset | Class | Precision | Recall | F1-Score |
|---|---|---|---|---|
| Validation | 0 | 0.94 | 0.94 | 0.94 |
| 1 | 0.91 | 0.91 | 0.91 | |
| Test | 0 | 0.96 | 0.95 | 0.95 |
| 1 | 0.93 | 0.92 | 0.92 |
| Fold | Accuracy | ROC AUC |
|---|---|---|
| Fold 1 | 0.8821 | 0.9542 |
| Fold 2 | 0.8614 | 0.9426 |
| Fold 3 | 0.9137 | 0.9761 |
| Fold 4 | 0.8513 | 0.9274 |
| Fold 5 | 0.8829 | 0.9432 |
| Mean ± SD | 0.8783 ± 0.0378 | 0.9487 ± 0.0274 |
| Dataset | Class | Precision | Recall | F1-Score |
|---|---|---|---|---|
| Validation | Non-apnea (0) | 0.95 | 0.94 | 0.95 |
| Apnea (1) | 0.91 | 0.92 | 0.91 | |
| Test | Non-apnea (0) | 0.96 | 0.95 | 0.95 |
| Apnea (1) | 0.92 | 0.93 | 0.93 |
| Fold | Accuracy | ROC AUC |
|---|---|---|
| Fold 1 | 0.882 | 0.9291 |
| Fold 2 | 0.857 | 0.8967 |
| Fold 3 | 0.945 | 0.9175 |
| Fold 4 | 0.721 | 0.8710 |
| Fold 5 | 0.875 | 0.8951 |
| Mean ± SD | 0.896 ± 0.138 | 0.9019 ± 0.0271 |
| Random Forest Model Validation | |||
|---|---|---|---|
| Apnea | 1 | 1 | 1 |
| Non-apnea | 1 | 1 | 1 |
| Random Forest Model Test | |||
| Apnea | 0.87 | 0.64 | 0.74 |
| Non-apnea | 1 | 1 | 1 |
| DT Model Validation | |||
|---|---|---|---|
| Apnea | 1 | 1 | 1 |
| Non-apnea | 1 | 1 | 1 |
| DT Model Test | |||
| Apnea | 0.53 | 0.58 | 0.56 |
| Non-apnea | 1 | 1 | 1 |
Disclaimer/Publisher’s Note: The statements, opinions and data contained in all publications are solely those of the individual author(s) and contributor(s) and not of MDPI and/or the editor(s). MDPI and/or the editor(s) disclaim responsibility for any injury to people or property resulting from any ideas, methods, instructions or products referred to in the content. |
© 2025 by the authors. Licensee MDPI, Basel, Switzerland. This article is an open access article distributed under the terms and conditions of the Creative Commons Attribution (CC BY) license (https://creativecommons.org/licenses/by/4.0/).
Share and Cite
Kolhar, M.; Alfridan, M.M.; Siraj, R.A. AI-Driven Detection of Obstructive Sleep Apnea Using Dual-Branch CNN and Machine Learning Models. Biomedicines 2025, 13, 1090. https://doi.org/10.3390/biomedicines13051090
Kolhar M, Alfridan MM, Siraj RA. AI-Driven Detection of Obstructive Sleep Apnea Using Dual-Branch CNN and Machine Learning Models. Biomedicines. 2025; 13(5):1090. https://doi.org/10.3390/biomedicines13051090
Chicago/Turabian StyleKolhar, Manjur, Manahil Muhammad Alfridan, and Rayan A. Siraj. 2025. "AI-Driven Detection of Obstructive Sleep Apnea Using Dual-Branch CNN and Machine Learning Models" Biomedicines 13, no. 5: 1090. https://doi.org/10.3390/biomedicines13051090
APA StyleKolhar, M., Alfridan, M. M., & Siraj, R. A. (2025). AI-Driven Detection of Obstructive Sleep Apnea Using Dual-Branch CNN and Machine Learning Models. Biomedicines, 13(5), 1090. https://doi.org/10.3390/biomedicines13051090