

Developing CGMap: Characterizing Continuous Glucose Monitoring Data in Patients with Type 2 Diabetes
 ,
,
Abstract
1. Introduction
2. Materials and Methods
2.1. Participants
2.2. CGM-Derived Indicators
- (1)
- GRI was calculated as (3.0 × VLow) + (2.4 × Low) + (1.6 × VHigh) + (0.8 × High), where VLow represents very-low-glucose hypoglycemia (<3.0 mmol/L), Low represents low-glucose hypoglycemia (≥3.0 and <3.9 mmol/L), High represents high-glucose hyperglycemia (>10.0 and ≤13.9 mmol/L), and VHigh represents very-high-glucose hyperglycemia (>13.9 mmol/L) [14].
- (2)
- SD was calculated as the square root of the average squared difference between each glucose datum and the mean. , where X = each glucose datum; = mean glucose; n = number of values in the sample.
- (3)
- CV was calculated as SD divided by the mean glucose value multiplied by 100.
- (4)
- MAGE was calculated as the average of all blood glucose (BG) increases or decreases that are >1 standard deviation of all BG measures [15].
- (1)
- Time in range (TIR) was calculated as the number of mean glucose values at 3.9–10.0 mmol/L divided by the number of total values multiplied by 100.
- (2)
- Time below range (TBR) (below target level < 3.9 mmol/L) was calculated as the number of mean glucose values below 3.9 mmol/L divided by the number of total values multiplied by 100.
- (3)
- TBR (below target level < 3.0 mmol/L) was calculated as the number of mean glucose values below 3.0 mmol/L divided by the number of total values multiplied by 100.
- (4)
- Time above range (TAR) (above target level > 10.0 mmol/L) was calculated as the number of mean glucose values above 10.0 mmol/L divided by the number of total values multiplied by 100.
- (5)
- TAR (above target level > 13.9 mmol/L) was calculated as the number of mean glucose values below 3.9 mmol/L divided by the number of total values multiplied by 100.
- (6)
- Estimate hemoglobin A1c (eA1c) was calculated as (46.7 + mean glucose) divided by the 28.7.
2.3. Clinical Parameters
- (1)
- Demographic parameters: age, sex, and the duration of diabetes.
- (2)
- Baseline blood glucose parameters: HbA1c and fasting plasma glucose (FPG).
- (3)
- Islet function parameters: fasting insulin, fasting C-peptide, and homeostasis model assessment β-cell function (HOMA2-β). HOMA2-β was calculated by the HOMA2 calculator [16].
- (4)
- Insulin resistance parameters: homeostasis model assessment insulin resistance (HOMA IR), which was calculated as (FPG × fasting insulin)/22.5.
- (5)
- Physical examination parameters: BMI, systemic blood pressure (SBP), and diastolic blood pressure (DBP).
- (6)
- Renal-related parameters: serum creatinine (SCr) and estimated glomerular filtration rate (eGFR).
- (7)
- Liver-related parameters: alanine aminotransferase (ALT), aspartate aminotransferase (AST), and ALT/AST.
- (8)
- Blood routine parameters: hemoglobin (HB) and hematocrit (HCT).
2.4. Statistical Analyses
3. Results
3.1. Patient Characteristics
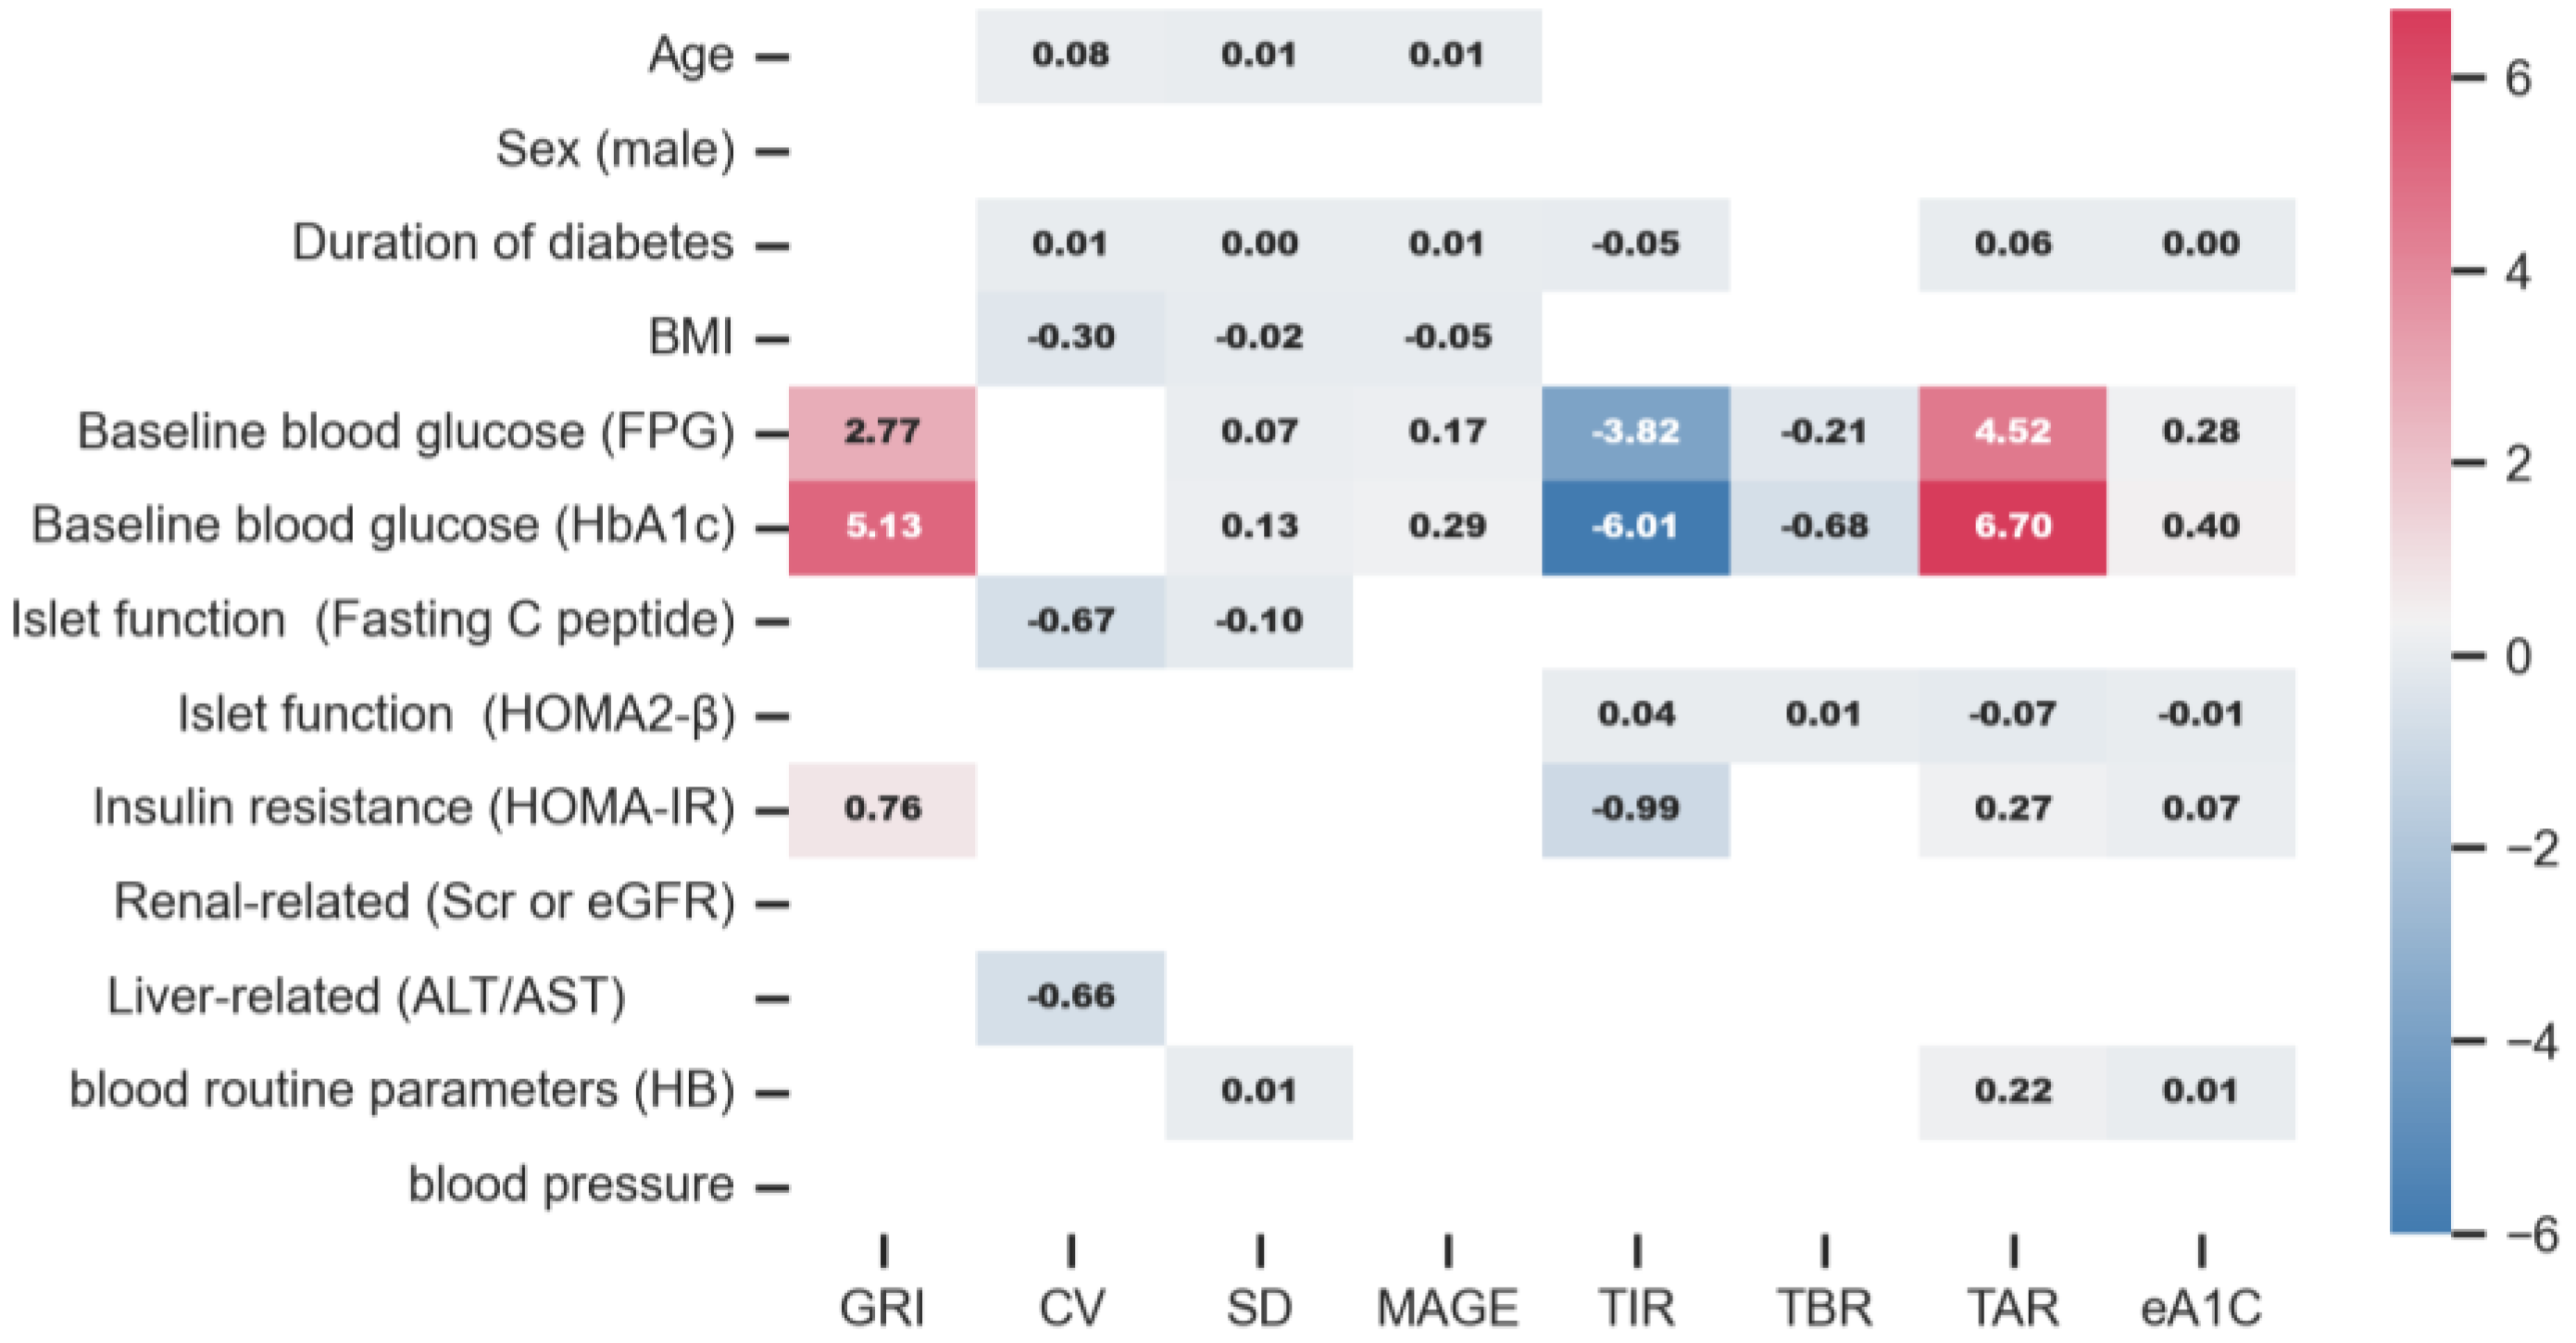
3.2. CGMap Characterized by Age
3.3. CGMap Characterized by the Sex
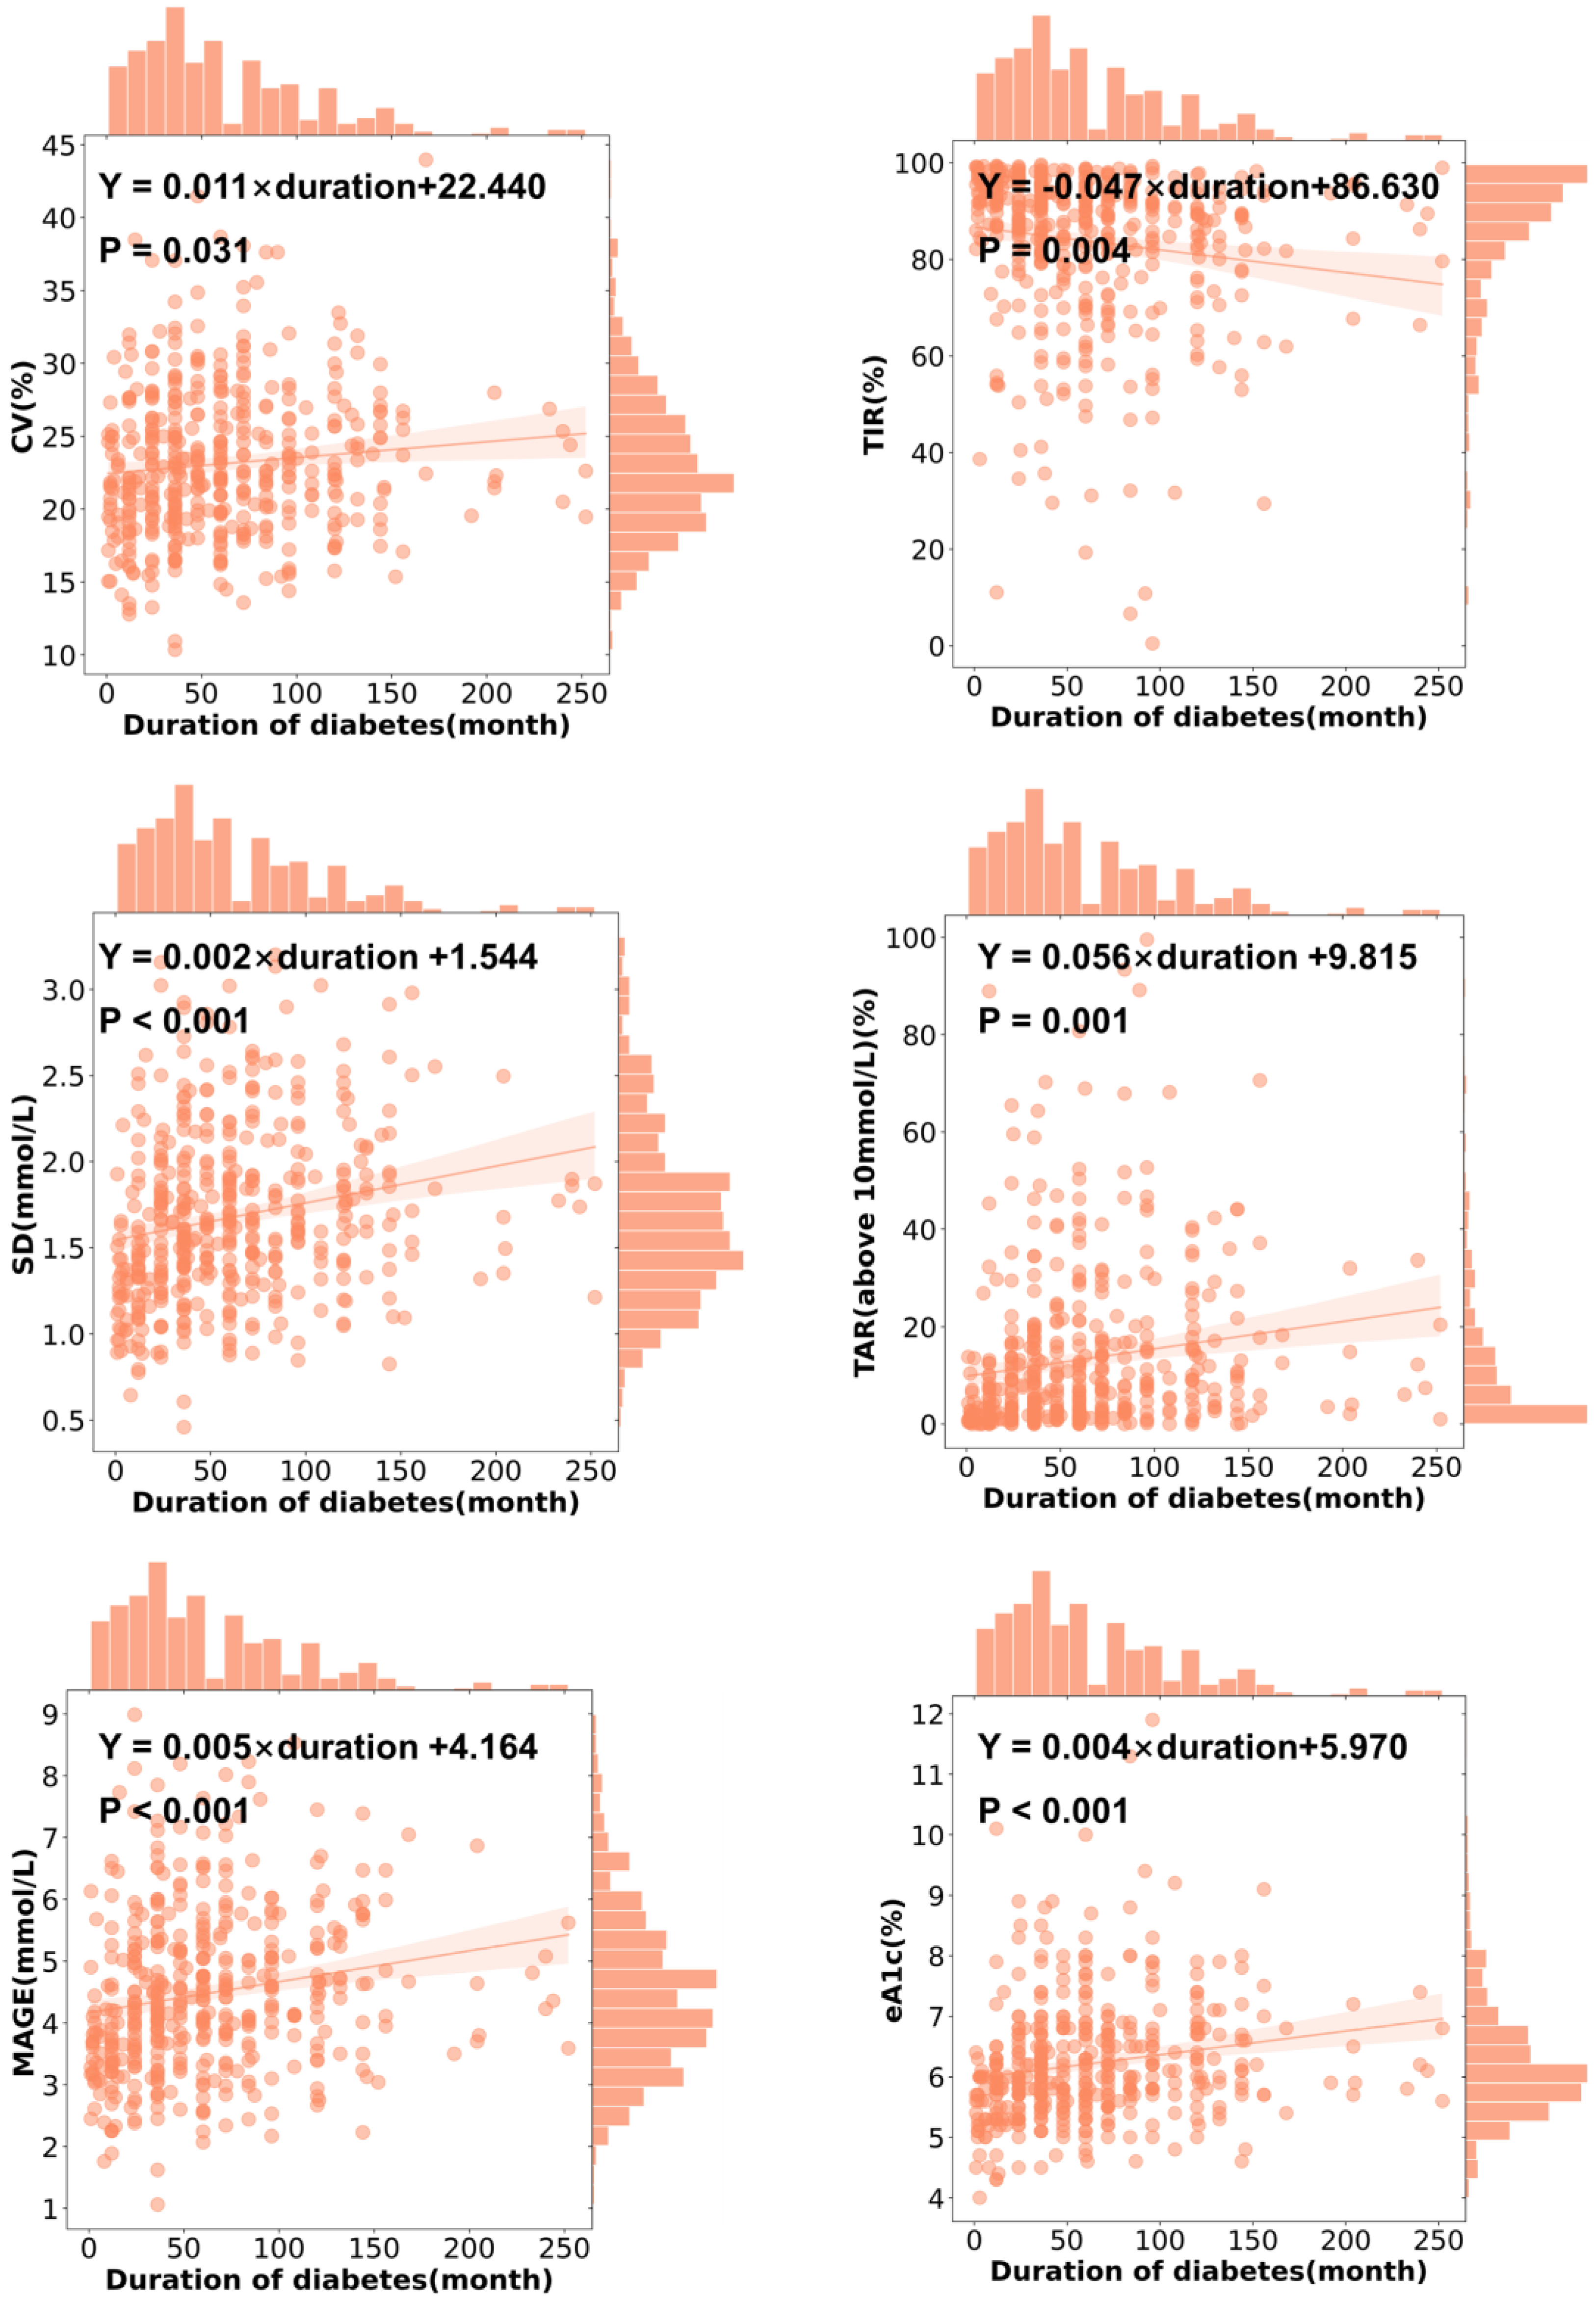
3.4. CGMap Characterized by Duration of Diabetes
3.5. CGMap Characterized by BMI
3.6. CGMap Characterized by Blood Glucose Level
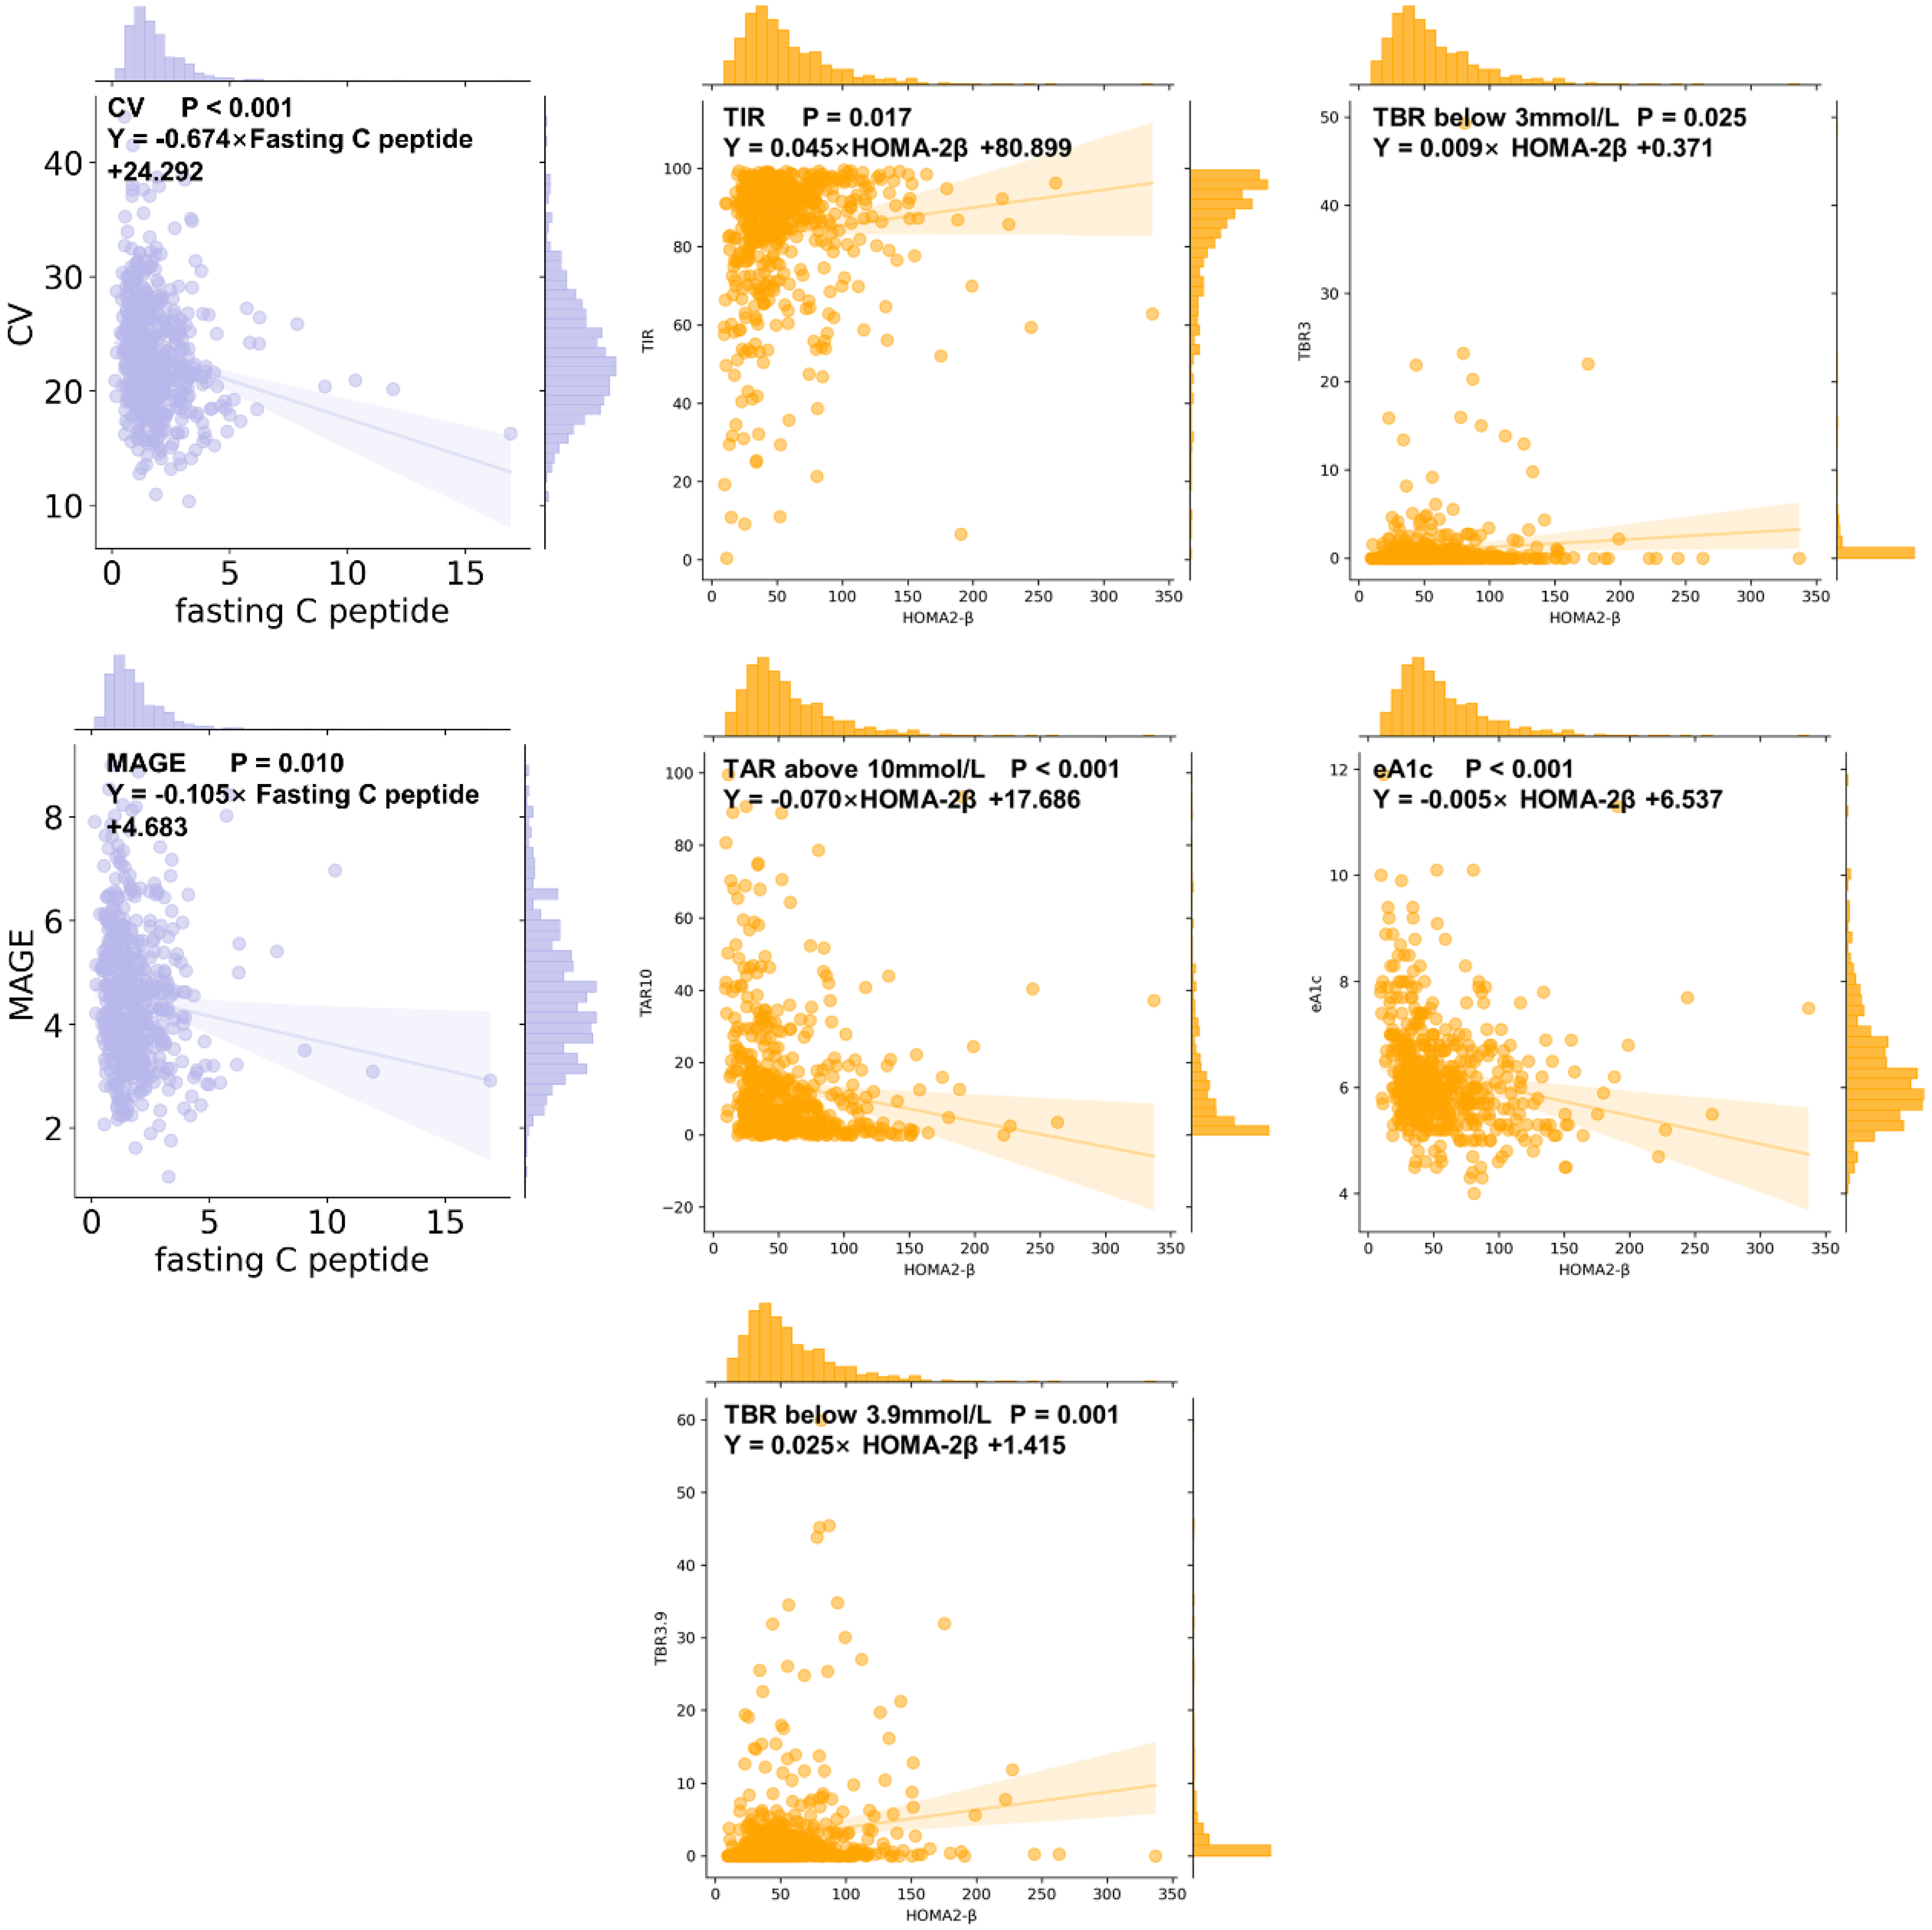
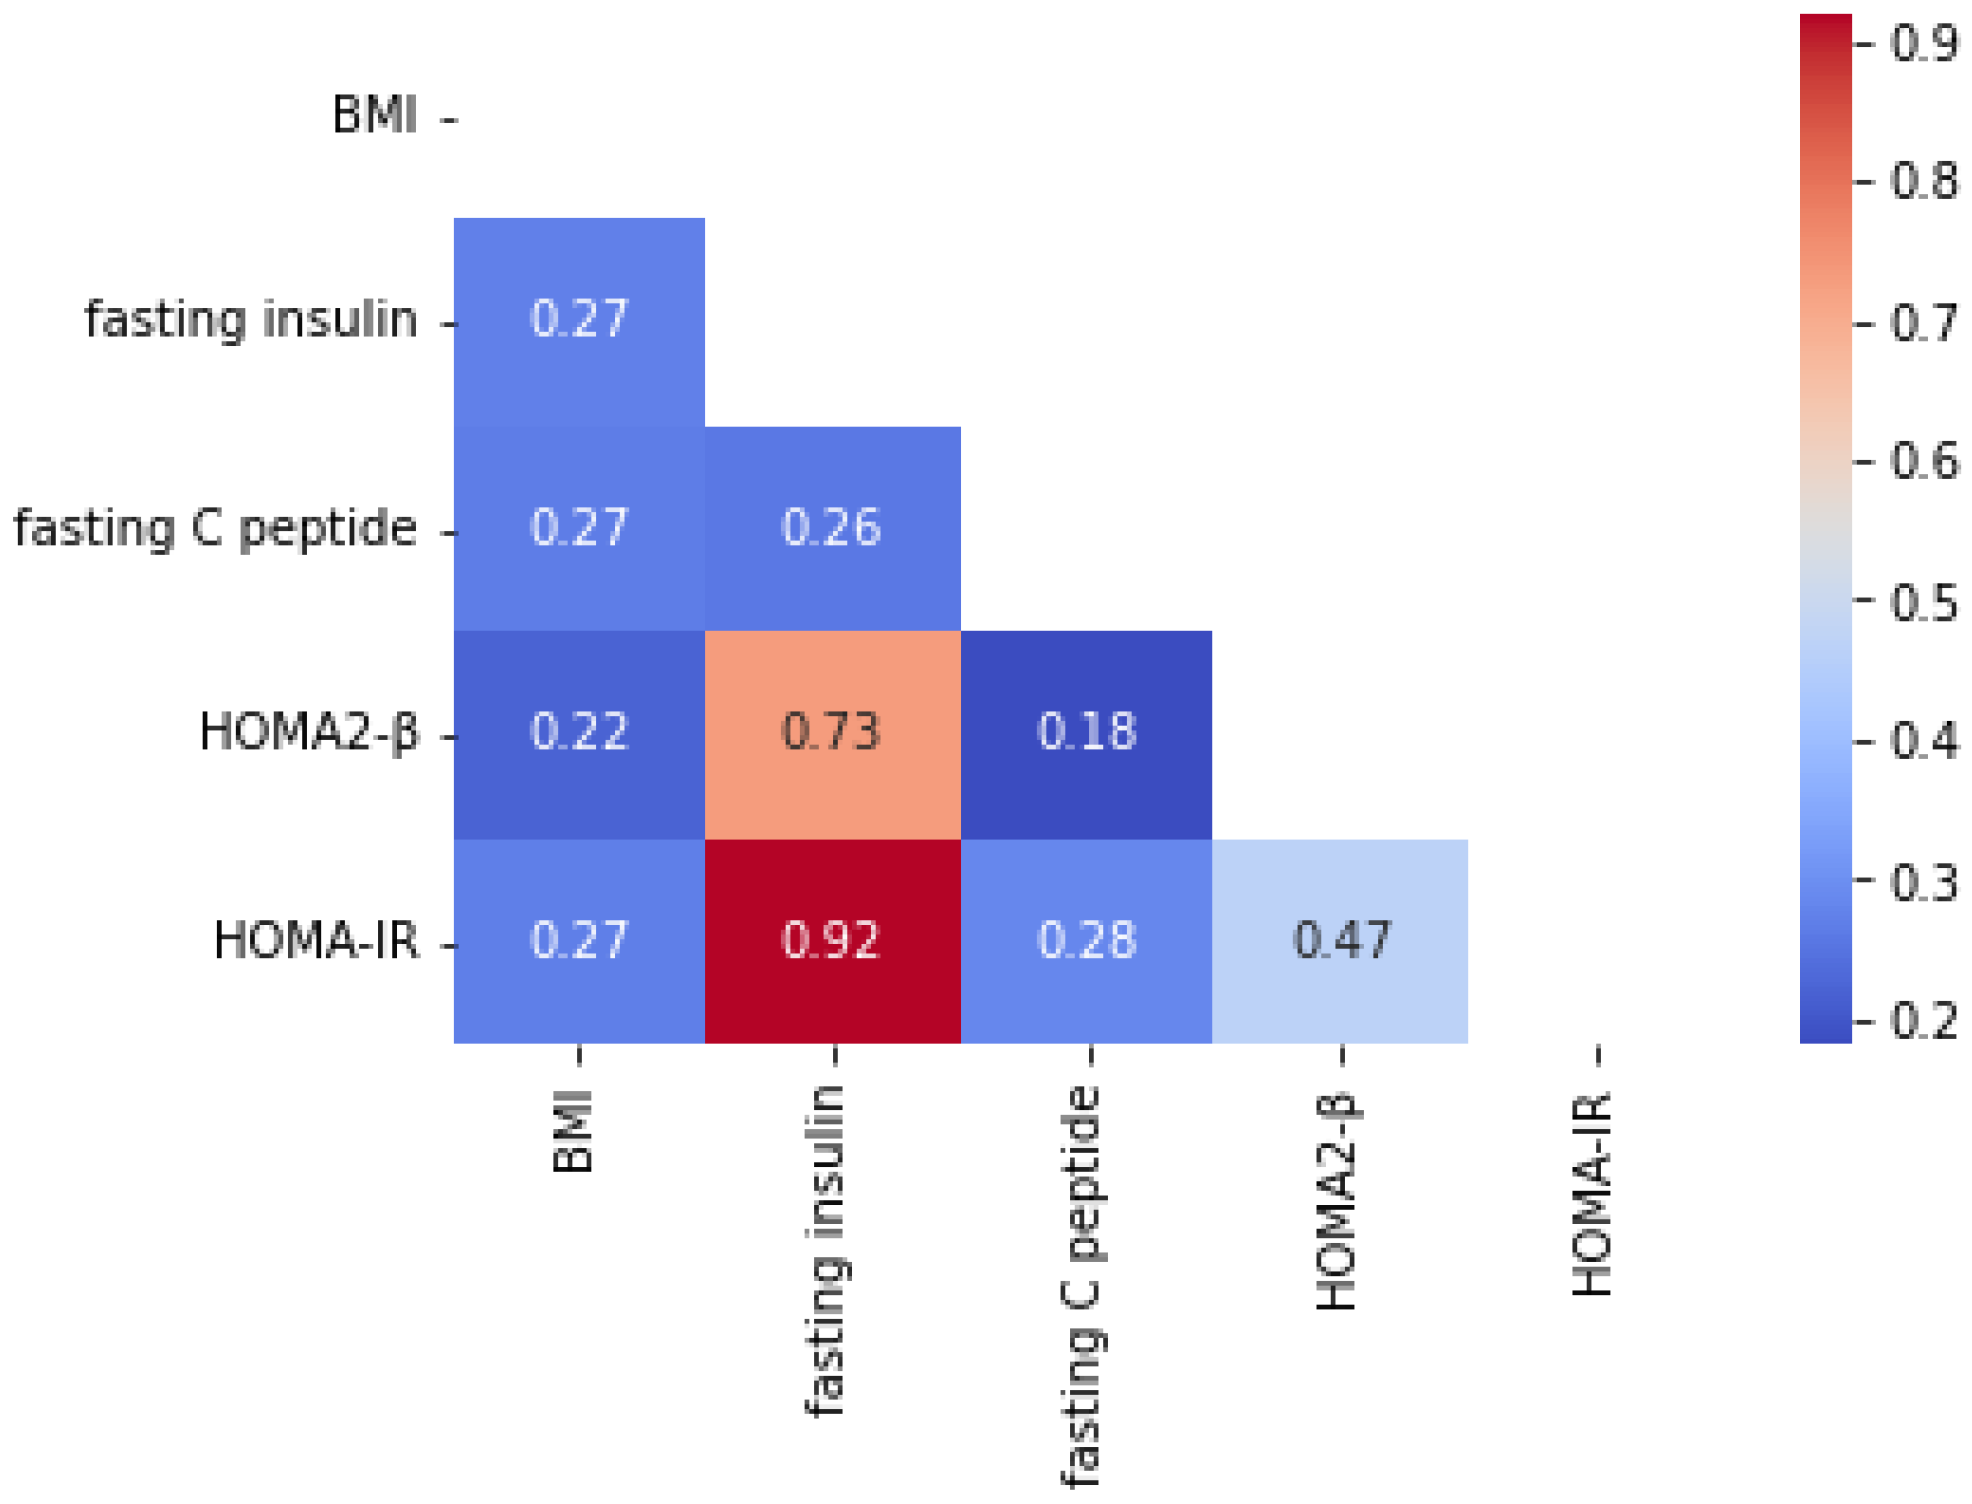
3.7. CGMap Characterized by Islet Function and Insulin Resistance
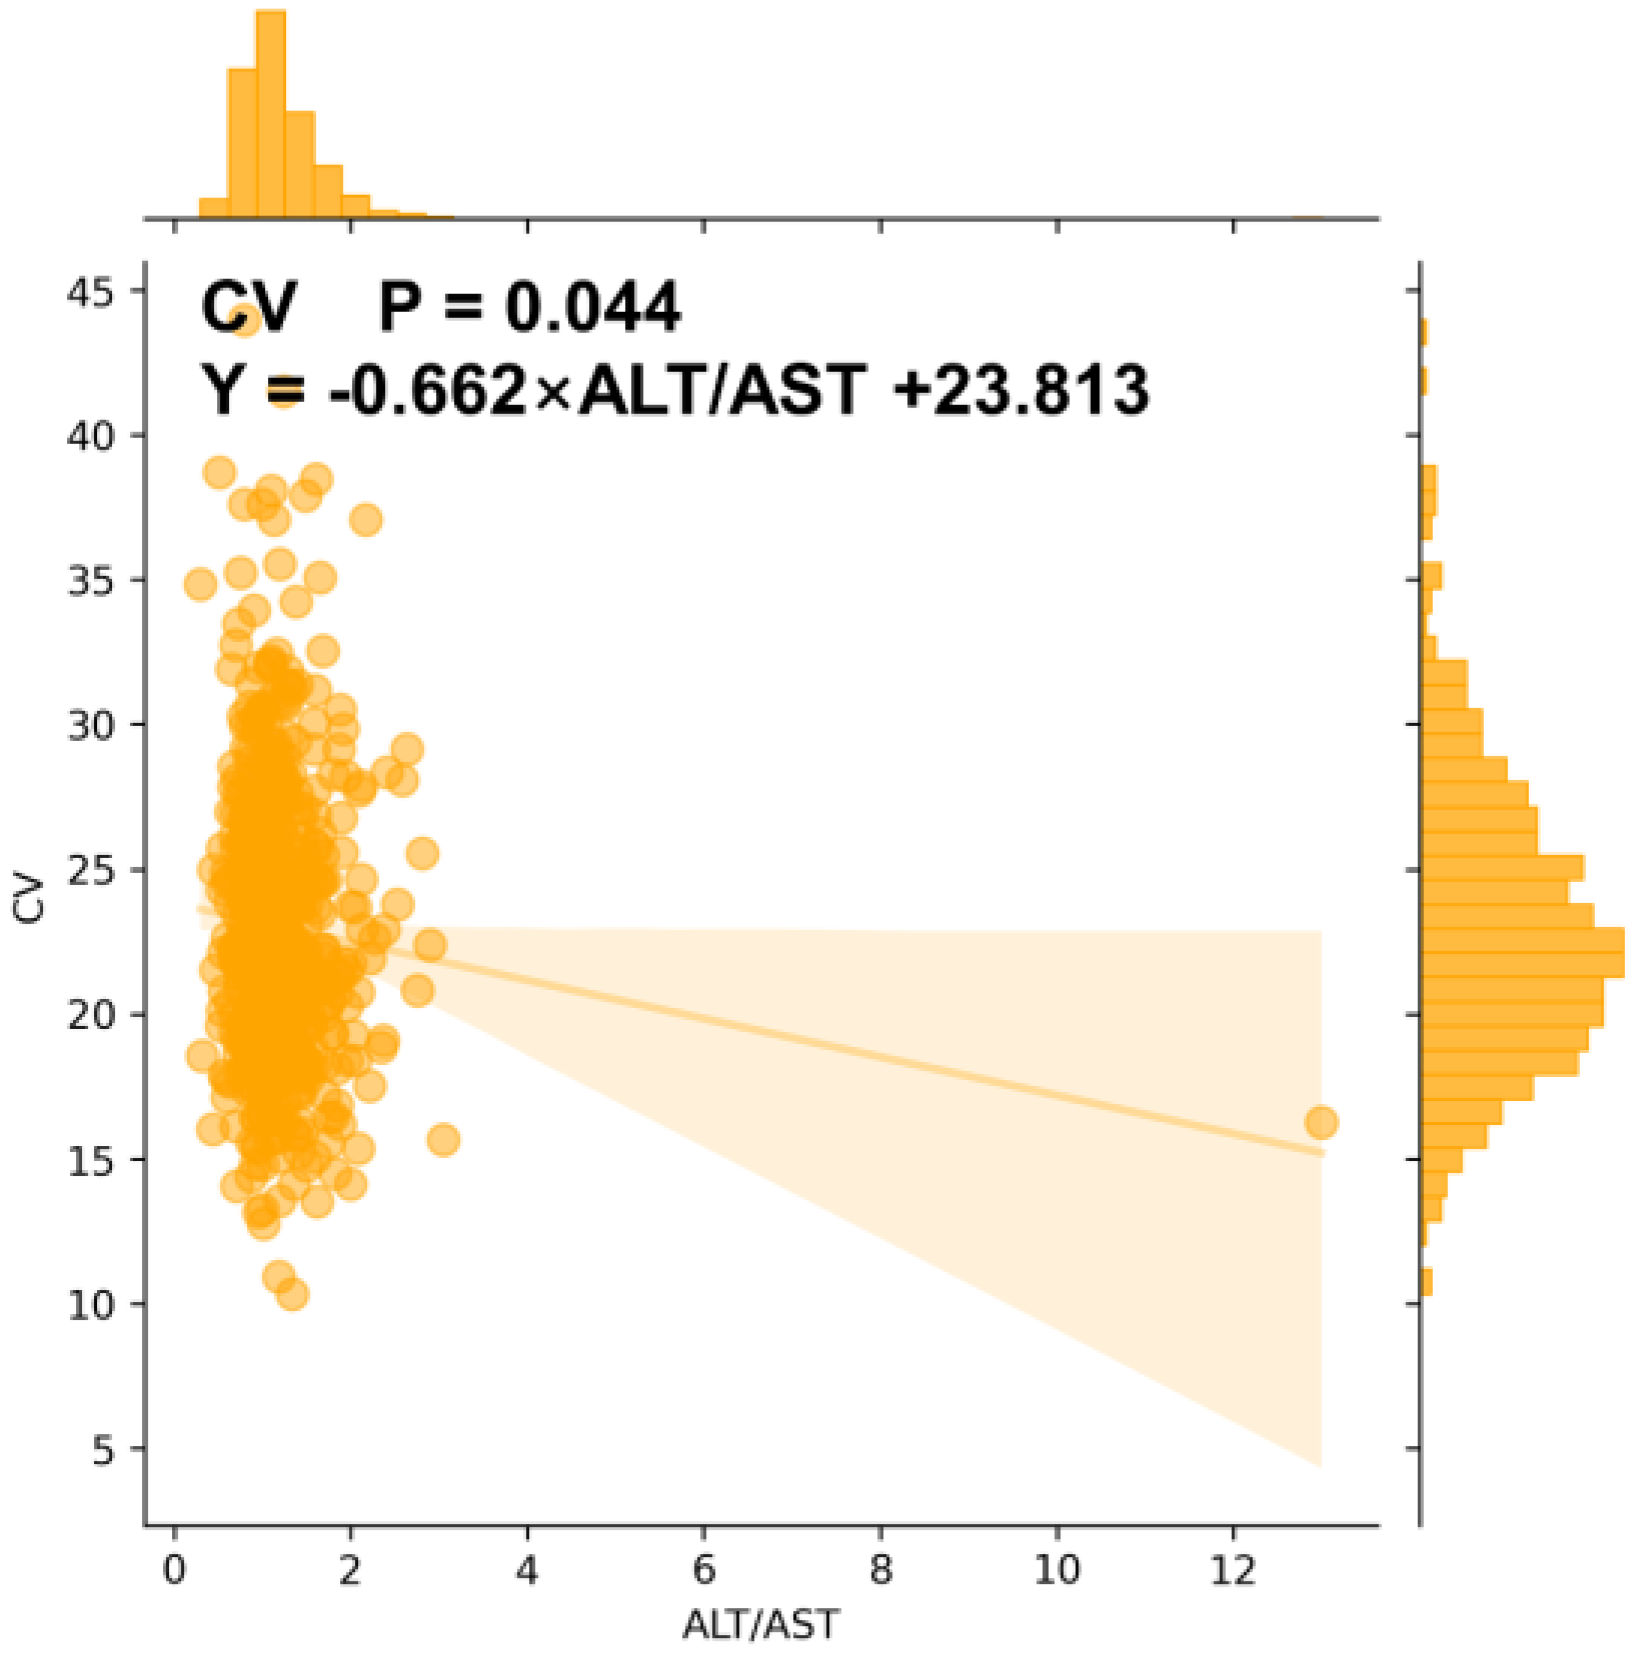
3.8. CGMap Characterized by Renal and Liver Function
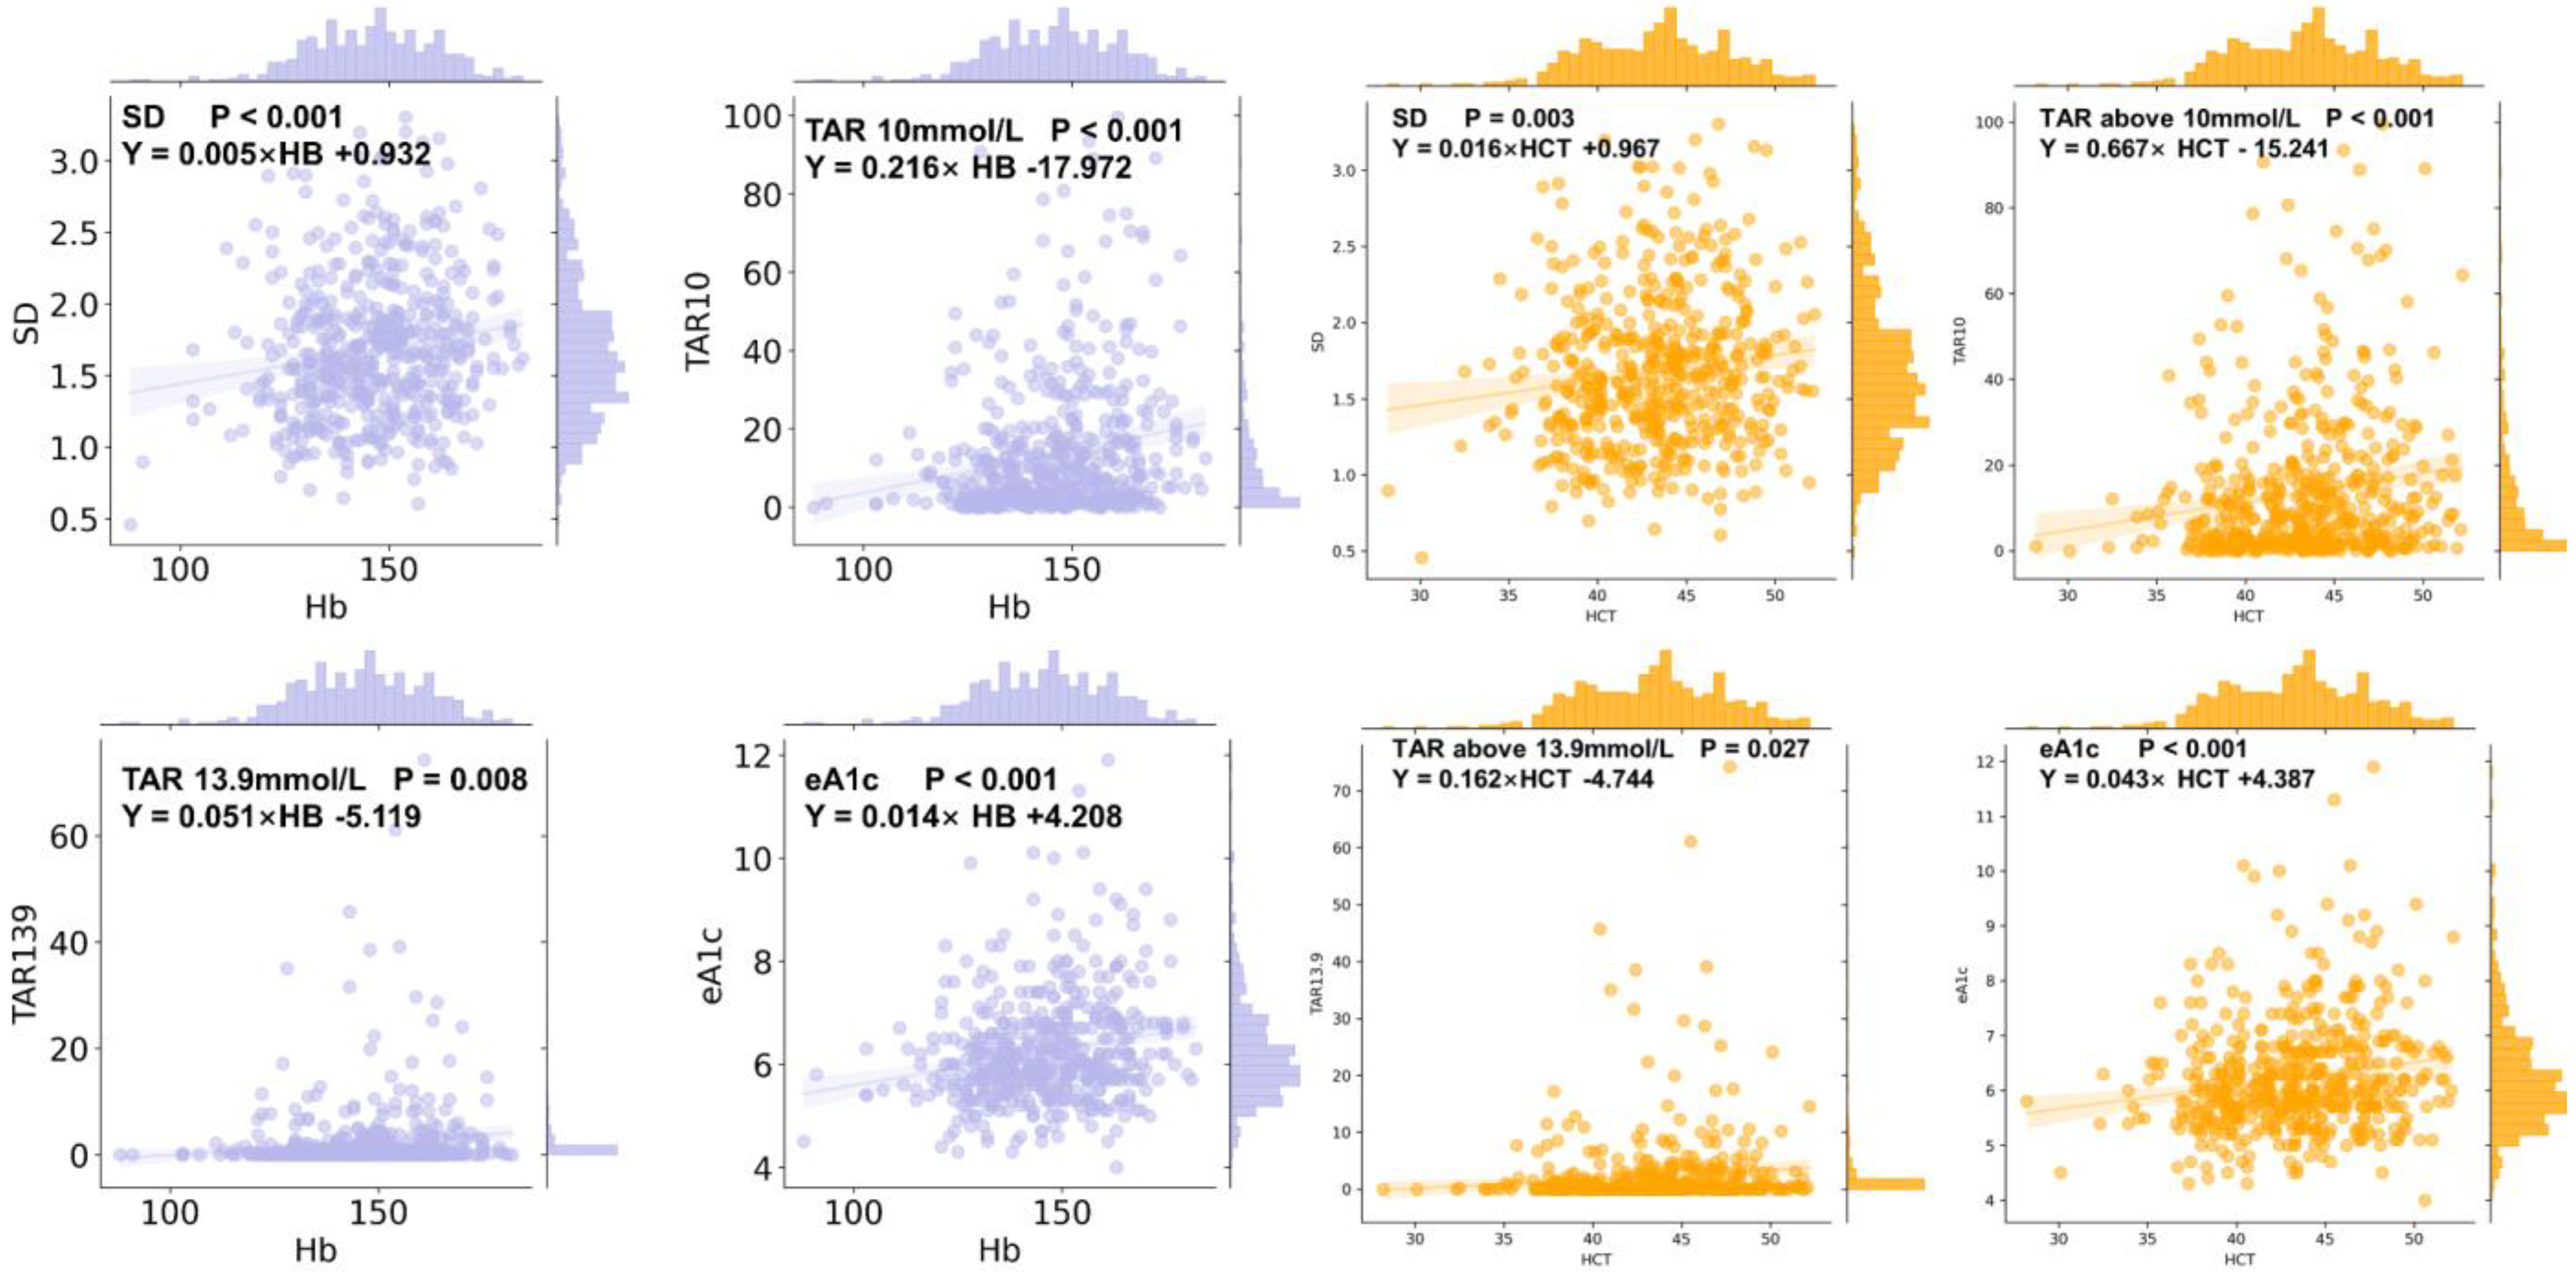
3.9. CGMap Characterized by Blood Routine Parameters
3.10. CGMap and Blood Pressure
4. Discussion
5. Conclusions
Author Contributions
Funding
Institutional Review Board Statement
Informed Consent Statement
Data Availability Statement
Conflicts of Interest
Abbreviations
| CGM | Continuous Glucose Monitoring |
| SMBG | Self-Monitoring Blood Glucose |
| HbA1c | Hemoglobin A1c |
| QALYs | Quality-Adjusted Life Years |
| ADA | American Diabetes Association |
| T2D | Type 2 Diabetes |
| MAGE | Mean Amplitude of Glycemic Excursions |
| SD | Standard Deviation |
| BMI | Body Mass Index |
| CV | Coefficient of Variation |
| GRI | Glycemia Risk Index |
| RCT | Randomized Clinical Trial |
| TIR | Time In Range |
| TBR | Time Below Range |
| TAR | Time Above Range |
| eA1c | Estimate Glycated Hemoglobin |
| FPG | Fasting Plasma Glucose |
| HOMA2-β | Homeostasis Model Assessment Β-Cell Function |
| HOMA-IR | Homeostasis Model Assessment Insulin Resistance |
| SBP | Systemic Blood Pressure |
| DBP | Diastolic Blood Pressure |
| SCr | Serum Creatinine |
| eGFR | Estimated Glomerular Filtration Rate |
| ALT | Alanine Aminotransferase |
| AST | Aspartate Aminotransferase |
| HB | Hemoglobin |
| HCT | Hematocrit |
| OLS | Ordinary Least Square |
Appendix A


| Group | Sum | GRI | CV | SD | MAGE | TIR | TBR 3.9 | TBR 3 | TAR 10 | TAR 13.9 | eA1c |
|---|---|---|---|---|---|---|---|---|---|---|---|
| Male | 291 | 14.668 ± 21.632 | 22.521 ± 6.661 | 1.660 ± 0.619 | 4.440 ± 1.800 | 87.229 ± 18.221 | 0.456 ± 2.821 | 0.000 ± 0.373 | 8.296 ± 17.672 | 0.246 ± 2.246 | 6.100 ± 1.175 |
| Female | 291 | 10.298 ± 13.515 | 22.208 ± 6.443 | 1.558 ± 0.574 | 4.190 ± 1.690 | 90.923 ± 13.048 | 0.597 ± 2.408 | 0.000 ± 0.283 | 6.360 ± 12.055 | 0.076 ± 0.896 | 6.000 ± 0.900 |
| Z | −3.341 | −0.668 | −1.724 | −1.694 | −1.543 | 0.471 | 0.051 | −2.086 | −2.408 | −1.543 | |
| P | 0.001 | 0.504 | 0.085 | 0.09 | 0.123 | 0.638 | 0.959 | 0.037 | 0.016 | 0.123 |
References
- Lewis, D.M.; Oser, T.K.; Wheeler, B.J. Continuous glucose monitoring. BMJ 2023, 380, e072420. [Google Scholar] [CrossRef] [PubMed]
- Karter, A.J.; Parker, M.M.; Moffet, H.H.; Gilliam, L.K.; Dlott, R. Association of Real-time Continuous Glucose Monitoring With Glycemic Control and Acute Metabolic Events Among Patients With Insulin-Treated Diabetes. JAMA 2021, 325, 2273–2284. [Google Scholar] [CrossRef] [PubMed]
- Martens, T.; Beck, R.W.; Bailey, R.; Ruedy, K.J.; Calhoun, P.; Peters, A.L.; Pop-Busui, R.; Philis-Tsimikas, A.; Bao, S.; Umpierrez, G.; et al. Effect of Continuous Glucose Monitoring on Glycemic Control in Patients With Type 2 Diabetes Treated with Basal Insulin: A Randomized Clinical Trial. JAMA 2021, 325, 2262–2272. [Google Scholar] [CrossRef] [PubMed]
- Yoo, H.J.; An, H.G.; Park, S.Y.; Ryu, O.H.; Kim, H.Y.; Seo, J.A.; Hong, E.G.; Shin, D.H.; Kim, Y.H.; Kim, S.G.; et al. Use of a real time continuous glucose monitoring system as a motivational device for poorly controlled type 2 diabetes. Diabetes Res. Clin. Pract. 2008, 82, 73–79. [Google Scholar] [CrossRef]
- Kim, J.Y.; Ilham, S.; Alshannaq, H.; Pollock, R.F.; Ahmed, W.; Norman, G.J.; Jin, S.-M.; Kim, J.H. Real-time continuous glucose monitoring vs. self-monitoring of blood glucose: Cost-utility in South Korean type 2 diabetes patients on intensive insulin. J. Med. Econ. 2024, 27, 1245–1252. [Google Scholar] [CrossRef]
- American Diabetes Association Professional Practice Committee; ElSayed, N.A.; Aleppo, G.; Bannuru, R.R.; Bruemmer, D.; Collins, B.S.; Ekhlaspour, L.; Hilliard, M.E.; Johnson, E.L.; Khunti, K.; et al. 7. Diabetes Technology: Standards of Care in Diabetes—2023. Diabetes Care 2022, 46 (Suppl. S1), S111–S127. [Google Scholar] [CrossRef]
- Keshet, A.; Shilo, S.; Godneva, A.; Talmor-Barkan, Y.; Aviv, Y.; Segal, E.; Rossman, H. CGMap: Characterizing continuous glucose monitor data in thousands of non-diabetic individuals. Cell Metab. 2023, 35, 758–769.e3. [Google Scholar] [CrossRef]
- Umpierrez, G.E.; O’Neal, D.; DiGenio, A.; Goldenberg, R.; Hernandez-Triana, E.; Lin, J.; Park, C.; Renard, E.; Kovatchev, B. Lixisenatide reduces glycaemic variability in insulin-treated patients with type 2 diabetes. Diabetes Obes. Metab. 2017, 19, 1317–1321. [Google Scholar] [CrossRef]
- Jin, S.-M.; Kim, T.-H.; Bae, J.C.; Hur, K.Y.; Lee, M.-S.; Lee, M.-K.; Kim, J.H. Clinical factors associated with absolute and relative measures of glycemic variability determined by continuous glucose monitoring: An analysis of 480 subjects. Diabetes Res. Clin. Pract. 2014, 104, 266–272. [Google Scholar] [CrossRef]
- Manski-Nankervis, J.; Yates, C.J.; Blackberry, I.; Furler, J.; Ginnivan, L.; Cohen, N.; Jenkins, A.; Vasanthakumar, S.; Gorelik, A.; Young, D.; et al. Impact of insulin initiation on glycaemic variability and glucose profiles in a primary healthcare Type 2 diabetes cohort: Analysis of continuous glucose monitoring data from the INITIATION study. Diabet. Med. A J. Br. Diabet. Assoc. 2016, 33, 803–811. [Google Scholar] [CrossRef]
- Bao, Y.Q.; Zhou, J.; Zhou, M.; Cheng, Y.J.; Lu, W.; Pan, X.P.; Tang, J.; Lu, H.; Jia, W. Glipizide controlled-release tablets, with or without acarbose, improve glycaemic variability in newly diagnosed Type 2 diabetes. Clin. Exp. Pharmacol. Physiol. 2010, 37, 564–568. [Google Scholar] [CrossRef] [PubMed]
- Ohara, M.; Hiromura, M.; Nagaike, H.; Kohata, Y.; Fujikawa, T.; Goto, S.; Sato, N.; Kushima, H.; Terasaki, M.; Yamamoto, T.; et al. Relationship between glucose variability evaluated by continuous glucose monitoring and clinical factors, including glucagon-stimulated insulin secretion in patients with type 2 diabetes. Diabetes Res. Clin. Pract. 2019, 158, 107904. [Google Scholar] [CrossRef] [PubMed]
- Cai, X.; Hu, S.; Lin, C.; Wu, J.; Wang, J.; Wang, Z.; Zhang, X.; Wang, X.; Xu, F.; Chen, L.; et al. Comparison of glucose fluctuation between metformin combined with acarbose or sitagliptin in Chinese patients with type 2 diabetes: A multicenter, randomized, active-controlled, open-label, parallel design clinical trial. Chin. Med. J. 2025. [Google Scholar] [CrossRef]
- Klonoff, D.C.; Wang, J.; Rodbard, D.; Kohn, M.A.; Li, C.; Liepmann, D.; Kerr, D.; Ahn, D.; Peters, A.L.; Umpierrez, G.E.; et al. A Glycemia Risk Index (GRI) of Hypoglycemia and Hyperglycemia for Continuous Glucose Monitoring Validated by Clinician Ratings. J. Diabetes Sci. Technol. 2023, 17, 1226–1242. [Google Scholar] [CrossRef]
- Service, F.J.; Molnar, G.D.; Rosevear, J.W.; Ackerman, E.; Gatewood, L.C.; Taylor, W.F. Mean amplitude of glycemic excursions, a measure of diabetic instability. Diabetes 1970, 19, 644–655. [Google Scholar] [CrossRef]
- Levy, J.C.; Matthews, D.R.; Hermans, M.P. Correct homeostasis model assessment (HOMA) evaluation uses the computer program. Diabetes Care 1998, 21, 2191–2192. [Google Scholar] [CrossRef]
- Kuroda, N.; Kusunoki, Y.; Osugi, K.; Ohigashi, M.; Azuma, D.; Ikeda, H.; Makino, S.; Otsuka, A.; Tamada, D.; Watanabe, N.; et al. Relationships between time in range, glycemic variability including hypoglycemia and types of diabetes therapy in Japanese patients with type 2 diabetes mellitus: Hyogo Diabetes Hypoglycemia Cognition Complications study. J. Diabetes Investig. 2021, 12, 244–253. [Google Scholar] [CrossRef]
- Sui, J.; Shi, B.; Hu, Y.; Deng, M.; Wang, Y.; He, M.; Zhao, X.; Ji, Q.; Ming, J.; Yao, X. Islet Function Changes Among the Elderly Population. Arch. Med. Res. 2019, 50, 468–475. [Google Scholar] [CrossRef]
- Lartey, A.H.; Li, X.; Li, Z.; Zhang, Q.; Wang, J. Age- and sex-specific profiles of temporal fasting plasma glucose variability in a population undergoing routine health screening. BMC Public Health 2021, 21, 320. [Google Scholar] [CrossRef] [PubMed]
- Hamden, K.; Carreau, S.; Boujbiha, M.A.; Lajmi, S.; Aloulou, D.; Kchaou, D.; Elfeki, A. Hyperglycaemia, stress oxidant, liver dysfunction and histological changes in diabetic male rat pancreas and liver: Protective effect of 17 β-estradiol. Steroids 2008, 73, 495–501. [Google Scholar] [CrossRef]
- Santos, R.S.; Batista, T.M.; Camargo, R.L.; Morato, P.N.; Borck, P.C.; Leite, N.C.; Kurauti, M.A.; Wanschel, A.C.; Nadal, Á.; Clegg, D.J.; et al. Lacking of estradiol reduces insulin exocytosis from pancreatic β-cells and increases hepatic insulin degradation. Steroids 2016, 114, 16–24. [Google Scholar] [CrossRef] [PubMed]
- Wang, J.; Yan, R.; Wen, J.; Kong, X.; Li, H.; Zhou, P.; Zhu, H.; Su, X.; Ma, J. Association of lower body mass index with increased glycemic variability in patients with newly diagnosed type 2 diabetes: A cross-sectional study in China. Oncotarget 2017, 8, 73133–73143. [Google Scholar] [CrossRef] [PubMed]
- Saisho, Y.; Butler, A.E.; Manesso, E.; Elashoff, D.; Rizza, R.A.; Butler, P.C. β-cell mass and turnover in humans: Effects of obesity and aging. Diabetes Care 2013, 36, 111–117. [Google Scholar] [CrossRef] [PubMed]
- van Vliet, S.; Koh, H.-C.E.; Patterson, B.W.; Yoshino, M.; LaForest, R.; Gropler, R.J.; Klein, S.; Mittendorfer, B. Obesity Is Associated With Increased Basal and Postprandial β-Cell Insulin Secretion Even in the Absence of Insulin Resistance. Diabetes 2020, 69, 2112–2119. [Google Scholar] [CrossRef]
- Chan, W.B.; Tong, P.C.Y.; Chow, C.C.; So, W.Y.; Ng, M.C.Y.; Ma, R.C.W.; Osaki, R.; Cockram, C.S.; Chan, J.C.N. The associations of body mass index, C-peptide and metabolic status in Chinese Type 2 diabetic patients. Diabet. Med. 2004, 21, 349–353. [Google Scholar] [CrossRef]
- García-Estévez, D.A.; Araújo-Vilar, D.; Saavedra-González, Á.; Fiestras-Janeiro, G.; Cabezas-Cerrato, J. Analysis of the relationship between body mass index, insulin resistance, and beta-cell function: A cross-sectional study using the minimal model. Metabolism 2004, 53, 1462–1466. [Google Scholar] [CrossRef]
- Miya, A.; Nakamura, A.; Handa, T.; Nomoto, H.; Kameda, H.; Cho, K.Y.; Nagai, S.; Ito, Y.M.; Miyoshi, H.; Atsumi, T. Log-linear relationship between endogenous insulin secretion and glycemic variability in patients with type 2 diabetes on continuous glucose monitoring. Sci. Rep. 2021, 11, 9057. [Google Scholar] [CrossRef]
- Zhang, Y.; Dai, J.; Han, X.; Zhao, Y.; Zhang, H.; Liu, X.; Li, W.; Ling, H.; Zhou, X.; Ying, C. Glycemic variability indices determined by self-monitoring of blood glucose are associated with β-cell function in Chinese patients with type 2 diabetes. Diabetes Res. Clin. Pract. 2020, 164, 108152. [Google Scholar] [CrossRef]
- Zhang, L.; Guo, K.; Tian, Q.; Ye, J.; Ding, Z.; Zhou, Q.; Wu, J.; Fan, L.; Pan, N.; Niu, X.; et al. The continuous spectrum of glycaemic variability changes with pancreatic islet function: A multicentre cross-sectional study in China. Diabetes/Metab. Res. Rev. 2022, 38, e3579. [Google Scholar] [CrossRef]
- Kawamoto, R.; Kohara, K.; Kusunoki, T.; Tabara, Y.; Abe, M.; Miki, T. Alanine aminotransferase/aspartate aminotransferase ratio is the best surrogate marker for insulin resistance in non-obese Japanese adults. Cardiovasc. Diabetol. 2012, 11, 117. [Google Scholar] [CrossRef]
- Gallagher, E.J.; Roith, D.L.; Bloomgarden, Z. Review of hemoglobin A(1c) in the management of diabetes. J. Diabetes 2009, 1, 9–17. [Google Scholar] [CrossRef] [PubMed]


Disclaimer/Publisher’s Note: The statements, opinions and data contained in all publications are solely those of the individual author(s) and contributor(s) and not of MDPI and/or the editor(s). MDPI and/or the editor(s) disclaim responsibility for any injury to people or property resulting from any ideas, methods, instructions or products referred to in the content. |
© 2025 by the authors. Licensee MDPI, Basel, Switzerland. This article is an open access article distributed under the terms and conditions of the Creative Commons Attribution (CC BY) license (https://creativecommons.org/licenses/by/4.0/).
Share and Cite
Bai, S.; Lin, C.; Cai, X.; Hu, S.; Wu, J.; Chen, L.; Yang, W.; Ji, L. Developing CGMap: Characterizing Continuous Glucose Monitoring Data in Patients with Type 2 Diabetes. Biomedicines 2025, 13, 1080. https://doi.org/10.3390/biomedicines13051080
Bai S, Lin C, Cai X, Hu S, Wu J, Chen L, Yang W, Ji L. Developing CGMap: Characterizing Continuous Glucose Monitoring Data in Patients with Type 2 Diabetes. Biomedicines. 2025; 13(5):1080. https://doi.org/10.3390/biomedicines13051080
Chicago/Turabian StyleBai, Shuzhen, Chu Lin, Xiaoling Cai, Suiyuan Hu, Jing Wu, Ling Chen, Wenjia Yang, and Linong Ji. 2025. "Developing CGMap: Characterizing Continuous Glucose Monitoring Data in Patients with Type 2 Diabetes" Biomedicines 13, no. 5: 1080. https://doi.org/10.3390/biomedicines13051080
APA StyleBai, S., Lin, C., Cai, X., Hu, S., Wu, J., Chen, L., Yang, W., & Ji, L. (2025). Developing CGMap: Characterizing Continuous Glucose Monitoring Data in Patients with Type 2 Diabetes. Biomedicines, 13(5), 1080. https://doi.org/10.3390/biomedicines13051080