Article

Modular-Based Synergetic Mechanisms of Jasminoidin and Ursodeoxycholic Acid in Cerebral Ischemia Therapy

1
Institute of Chinese Materia Medica, China Academy of Chinese Medical Sciences, Beijing 100700, China
2
Institute of Basic Research in Clinical Medicine, China Academy of Chinese Medical Sciences, Beijing 100700, China
*
Authors to whom correspondence should be addressed.
These authors contributed equally to this work.
Biomedicines 2025, 13(4), 938; https://doi.org/10.3390/biomedicines13040938
Submission received: 17 March 2025 / Revised: 3 April 2025 / Accepted: 7 April 2025 / Published: 11 April 2025
(This article belongs to the Section Neurobiology and Clinical Neuroscience)

Abstract

:
Objectives: Jasminoidin (JA) and ursodeoxycholic acid (UA) have been shown to exert synergistic effects on cerebral ischemia (CI) therapy, but the underlying mechanisms remain to be elucidated. Objective: To elucidate the synergistic mechanisms involved in the combined use of JA and UA (JU) for CI therapy using a driver-induced modular screening (DiMS) strategy. Methods: Network proximity and topology-based approaches were used to identify synergistic modules and driver genes from an anti-ischemic microarray dataset (ArrayExpress, E-TABM-662). A middle cerebral artery occlusion/reperfusion (MCAO/R) model was established in 30 Sprague Dawley rats, divided into sham, vehicle, JA (25 mg/mL), UA (7 mg/mL), and JU (JA:UA = 1:1) groups. After 90 minutes of ischemia, infarct volume and neurological deficit scores were evaluated. Western blotting was performed 24 h after administration to validate key protein changes. Results: Six, eleven, and four drug-responsive On_modules were identified for JA, UA, and JU, respectively. Three synergistic modules (Sy-modules, JU-Mod-7, 8, and 10) and 12 driver genes (e.g., NRF1, FN1, CUL3) were identified, mainly involving the PI3K-Akt and MAPK pathways and regulation of the actin cytoskeleton. JA and UA synergistically reduced infarct volume and neurological deficit score (2.5, p < 0.05) in MCAO/R rats. In vivo studies demonstrated that JU suppressed the expression of CUL3, FN1, and ITGA4, while it increased that of NRF1. Conclusions: JU acts synergistically on CI–reperfusion injury by regulating FN1, CUL3, ITGA4, and NRF1 and inducing the PI3K-Akt, MAPK, and actin cytoskeleton pathways. DiMS provides a new approach to uncover mechanisms of combination therapies.

1. Introduction

Cerebral ischemic stroke is a common cause of death and disability. It has high incidence, disability, and mortality rates [1]. It is a major problem that threatens human health and quality of life. Current treatments primarily include thrombolytic therapy, such as recombinant tissue plasminogen activator (rt-PA) [2], endovascular thrombectomy [3,4], anticoagulant/antiplatelet therapy [5], and neuroprotective agents [6,7,8]. Increasing evidence shows that combination therapy is more advantageous for ischemic stroke since it improves the therapeutic effect without increasing side effects [9,10]. An in-depth study of ischemic stroke showed that herbal combination therapy is an effective treatment for cerebral ischemia (CI) [11,12]; however, the mechanisms driving the synergistic effects of combination therapy remain unclear. It is crucial to understand the synergistic mechanisms of combination therapy, which could provide valuable insights and improve the treatment of cerebral ischemia. In recent years, several computational approaches were developed to identify combination therapy targets. This includes co-expression networks based on modular analysis that are based on association genes or proteins and allow a deeper understanding of the underlying mechanisms of drug use in complex diseases [13,14,15].
Ischemic stroke triggers complex pathological processes, including excitotoxicity [16], oxidative stress [17], and inflammation [18], leading to neuronal damage and functional deficits [19]. Single-target therapies often struggle to effectively control the multiple mechanisms of injury associated with stroke [20]. Therefore, multi-target synergistic treatment strategies have gained increasing attention. Qingkailing injection, a widely used herbal compound in stroke treatment, contains two main bioactive components: jasminoidin (JA) and ursodeoxycholic acid (UA). JA, derived from the traditional Chinese medicine Fructus Gardeniae, has shown potential in addressing oxidative stress, inflammation, and neuronal apoptosis [21]. UA, derived from calculus bovis factitius, exhibits a range of pharmacological effects, including immunosuppression, inhibition of calcium influx, prevention of neurodegeneration, strong anti-inflammatory activity, and neuroprotection through mitochondrial stabilization and apoptosis inhibition [22,23]. Unlike arbitrary combinations of antioxidants and anti-inflammatory agents, Fructus Gardeniae and artificial bezoars have been historically co-administered in traditional formulations, with their active ingredients, JA and UA, suggesting the possibility of synergistic effects. However, studies investigating the synergistic effects of JA and UA remain limited, with a lack of in-depth mechanistic analysis. Given the multi-faceted nature of stroke pathology, it is crucial to explore the combined effects of JA and UA. While single-target therapies often fail to fully address the complex biological processes of stroke, JA and UA may offer broader neuroprotection by targeting multiple signaling pathways simultaneously. Although their individual efficacy has been demonstrated, the mechanisms underlying their combined therapy are still under-explored. This research aims to fill this gap by using a modular-pharmacology-based approach to explore the combined effects of JA and UA, providing insights into their synergistic mechanisms.
Despite the promise of combination therapies, existing studies often lack a deep mechanistic understanding of the synergies involved. This study seeks to address this gap by using a network topology approach to identify key synergistic modules and driver genes. Network topology has become an essential tool in pharmacology for decoding disease mechanisms, accelerating drug discovery, and repositioning existing drugs. For example, the BrainMI framework integrates brain functional connectivity with molecular genetic networks to identify genes involved in neurological disorders [24]. Network topology methods have been successfully applied in antiviral drug repositioning [25], drug-target prediction [26], and traditional Chinese medicine [27]. By employing this network-driven approach (network proximity, S A B ), network pharmacology reveals complex molecular interactions that drive therapeutic synergies [28].
This study used module-based separation measure of S A B (network proximity of drugs A and B) and network topology methods to identify JU synergistic modules and driver genes based on the anti-ischemic genome network. The driver-induced modular screening (DiMS) strategy was used to elucidate the synergistic mechanism of JU in CI treatment through further functional analysis and literature verification.

2. Materials and Methods

2.1. Gene Expression Dataset

The microarray gene expression dataset containing 16,463 mouse cDNAs (Inocyte Genomics, Inc., Santa Clara, CA, USA) was constructed in our previous study and was uploaded to the Array Express database: http://www.ebi.ac.uk/arrayexpress,E-TABM-662 (accessed on 19 August 2022) [29]. Sham, JA (25 mg /mL), UA (7 mg/mL), and JU (a combination of jasminoidin and ursodeoxycholic acid at a ratio of 1:1) were selected for analysis.
Experimental Design: Healthy adult male Kunming mice (12 weeks, 38–48 g) were used in this study. These mice were free of specific pathogens and were housed at 25 °C under a 12 h light/dark cycle. A model of middle cerebral artery occlusion (MCAO) was surgically established as described in our previous studies [29,30]. Specifically, the left middle cerebral artery was blocked using intracavitary filaments for 1.5 h, followed by 24 h of reperfusion to induce ischemia–reperfusion. Histological analysis and cerebral infarction area measurements were then performed, as detailed in the cited references.

2.2. Establishing and Identifying of Co-Expression Modules

Weighted gene co-expression network analysis (WGCNA) was performed for gene co-expression network construction and module detection based on data from the single drug group (JA and UA) and combined drug group (JU) in the above database using R software (version 4.3.2) [31]. The topological overlap matrix (TOM) is defined as the similarity of each matrix between all probe pairs in the measurement sample. Hierarchical clustering and a dynamic hybrid tree-cutting algorithm were applied to detect the tree branch. The tree branch was divided into modules, and the appropriate soft threshold (the ordinal) was selected. The gray color represents genes that were not classified into any module [32]. The scale-free topology fit index (SFT.R.sq) reaches or approaches 0.8, indicating that the network exhibits scale-free network characteristics and can effectively reflect gene–gene interactions and regulatory relationships. Therefore, we selected soft threshold values (β) that resulted in an SFT.R.sq value of 0.8 or close to 0.8. In this study, the β values were as follows: β = 10 (for JA), β = 16 (for UA), and β = 20 (for JU). Based on these β values, we constructed the pairwise correlation matrix of all probes within the samples, with a minimum module size of three for all three groups.

2.3. Identification of Drug Response On_Module and Sy-Module

The Z s u m m a r y statistic was implemented in the module conservation function of WGCNA to quantitatively determine whether the co-expression pattern of modules in the drug set was vector-independent. This assesses whether the density and connectivity patterns of modules defined in the reference dataset were present in the test dataset [33]. The Z s u m m a r y statistic, implemented in the module preservation function of WGCNA, is used to quantitatively assess whether the co-expression pattern of gene modules in a drug treatment dataset is consistent with that of a reference dataset [33]. Z s u m m a r y evaluates module preservation by considering both module density and gene connectivity patterns. It is composed of four statistics related to module density and three related to gene connectivity. A high Z s u m m a r y value (≥2) indicates good module preservation, meaning that gene co-expression relationships remain stable across datasets. Conversely, a low Z s u m m a r y value (<0) suggests poor module preservation, with Z s u m m a r y < 0 typically indicating structural instability influenced by experimental conditions, such as drug treatment, which may alter gene co-expression patterns. These unstable modules often contain key regulatory genes, making them valuable for investigating drug mechanisms or regulatory pathways involved in biological responses to external interventions.
In this study, we classified modules into two categories based on their Z s u m m a r y values:
On_module ( Z s u m m a r y < 0 ): Gene modules that exhibit significant changes under drug treatment, likely activated or substantially regulated by the drug. These modules represent biological processes influenced by the drug and reflect its biological effects through the activation of specific gene modules. On_modules are considered to be potential targets or pathways that could be modulated by the drug treatment, making them crucial for understanding the pharmacological mechanisms involved.
Off_module ( Z s u m m a r y 2 ): Gene modules that are not significantly affected by drug treatment and may represent biological processes or pathways not regulated by the drug. Their low response to the drug suggests they may maintain homeostasis within the body. Off_modules help distinguish the biological processes that remain stable in response to treatment, offering a clearer understanding of the drug’s specific action [15].
The formula to calculate Z s u m m a r y is as follows [33]:
Z s u m m a r y = m e d i a n ( Z m e a n   C o r ,   Z m e a n A D ,   Z p r o p v a r E x p l ,   Z m e a m K M E ) + m e d i a n ( Z c o r . K I M ,   Z c o r ,   K M E ,   Z c o r . c o r ) 2
Similarly, JA and UA were used as control groups for comparison with JU, respectively, and the modules obtained by JU were regarded as synergetic modules (Sy_modules).

2.4. Analysis of Differentially Expressed Genes (DEGs)

Drug-induced DEGs were screened using limma in R based on data from the sham, JA, UA, and JU groups [34]. The DEGs in the administration and sham operation groups were screened using a fold change (FC) > 1.2 and p < 0.05 as the threshold, and Bonferroni correction was performed to screen the list of DEGs in different administration groups for further analysis.

2.5. Synergistic Prediction Analysis

We need to clarify whether the topological relationship between the target modules of the two drug sets reflects the link between biology and pharmacology and verify the effectiveness of the network-based drug combination approach using the relevant modules obtained above. S A B is a metric that measures the distribution of a drug target set within a human protein–protein interaction (PPI) network and is used to assess whether a drug combination exhibits potential synergistic effects. We similarly applied this metric to determine the relationship between modules. The following method calculates S A B by measuring the ’separation’ between drug groups A and B to validate the rationale for combining JA and UA [25].
S A B = d A B d A A + d B B 2
where d is calculated according to the ‘closest’ method, d A A represents the shortest path between nodes in drug network A, d B B represents the shortest path between nodes in drug network B, and d A B represents the shortest path between nodes in drug networks A and B. When S A B < 0 , the targets of the two drugs are located in distinct but complementary regions within the PPI network. This indicates that, while both drugs are relevant to the same disease or biological process, they act on separate signaling pathways or molecular mechanisms. Biologically, such complementary targeting broadens therapeutic coverage by modulating different disease components. This often results in synergistic effects, where the combined impact of the two drugs exceeds their individual effects. Such synergy typically occurs when drugs act on different stages of disease progression or influence parallel pathways, ultimately enhancing therapeutic efficacy and reducing the likelihood of drug resistance.
We believe that a drug combination has a therapeutic effect only when it has a specific relationship with the disease module as captured by the complementary exposure pattern in the target module of the two drugs [35]. S A B 0 usually means that two drug target modules in the network are isolated from each other, while S A B < 0 indicates that the two drug target modules overlap with each other.

2.6. Driver Gene Identification Based on Network Proximity Indices

The shortest distance is the sum of the distances between all nodes in A and B, and then normalized by the product of their sizes [36]:
d I ( A ) I ( B ) s h o r t e s t = 1 I ( A ) × I ( B ) a I A , b I ( B ) d i ( a , b )
where I (A) = (a1, a2, a3, …) is the set of components in module a and di(a, b) is the distance between two component nodes in modules a and b. The shortest distance measures the relationship between two functional modules in a biological network. It represents the average shortest path length between two gene modules, reflecting their proximity and directness of interaction. If the shortest path between two modules is shorter, they will likely interact through fewer intermediary genes, indicating that they will likely be functionally closer together.
Flow centrality (FC value) measures the ability of a gene to facilitate the transfer of information between different functional modules. In biological networks, certain genes or proteins serve as critical ’bridges’ connecting multiple signaling pathways or regulatory modules, enabling the coordination of diverse biological processes. Genes with high flow centrality are often at the crossroads of multiple pathways and play a central role in network regulation. Targeting these genes can influence multiple biological pathways simultaneously, potentially enhancing therapeutic efficacy. The flow centrality of node v is defined as [37]:
F C A , B v = 1 A B a A , b B σ a b ( v ) σ a b
For A and B, σ a b ( v ) is the number of shortest paths from a to b passing through node v, σ a b is the total number of shortest paths from a to b, | A | is the size of A, | B | is the size of B. Modules A and B exchange roles in undirected networks.
By integrating network proximity indices, including d I ( A ) I ( B ) s h o r t e s t and F C , we can systematically evaluate and identify driver genes in biological networks. The shortest path distance quantifies the network proximity between gene modules, capturing their functional relevance, while F C highlights genes that serve as critical mediators of information transfer between modules. By prioritizing genes with smaller d I ( A ) I ( B ) s h o r t e s t and higher F C , we can identify those that are both functionally interconnected and topologically influential, thereby effectively uncovering driver genes.

2.7. Functional Annotation Gene Analysis

The Database for Annotation, Visualization and Integrated Discovery (DAVID) (https://david.ncifcrf.gov/, accessed on 7 April 2023) was used for Gene Ontology (GO) analysis and Kyoto Encyclopedia of Genes and Genomes (KEGG) pathway enrichment analyses to characterize the function of the Sy_module. A p-value < 0.05 was considered statistically significant using Homo sapiens as a GO item and for KEGG pathway analysis. Weishengxin (https://www.bioinformatics.com.cn/, accessed on 7 April 2023) was used to draw a genetic enrichment diagram and a pathway mechanism map was created using the KEGG Mapper platform (https://www.genome.jp/kegg/mapper/, accessed on 7 April 2023).

2.8. Animal Model and Drug Administration

To validate the effectiveness of the DiMS strategy and the JU Sy_modules, in vivo animal experiments were conducted to investigate the expression patterns of driver-gene-encoded proteins and pathway proteins across each experimental group. The animal experiments were approved by the Ethics Committee of the Animal Laboratory of the Institute of Chinese Materia Medica (license number: 2023B047) and adhered to the ethical guidelines of the National Institutes of Health Guide for the Care and Use of Laboratory Animals.
Forty male Sprague Dawley rats, aged 6 weeks and weighing approximately 200 g, were provided by Beijing Vital River Laboratory Animal Technology Co., Ltd. (Beijing, China). The selection of SD rats was due to our previous study [38], which aimed to validate the driver proteins across species and enhance the validity of the analysis results. After one week of adaptive feeding, the animals were divided into five groups (six rats per group): sham, vehicle, JA, UA, and JU groups. Rats were anesthetized with 2% pentobarbital (4 mg/kg, intraperitoneally) before undergoing surgical procedures to induce MCAO. An intraluminal filament was inserted through the internal carotid artery to occlude the left middle cerebral artery (MCA) at its origin for 90 min. After this period, the filament was carefully removed to restore blood flow, initiating a 24 h reperfusion period to induce ischemia–reperfusion injury. Animals in the sham-operated group underwent the same surgical maneuver, but no wire plug was inserted. Immediately after the filament was removed, drugs were administered via tail vein injection at a dose of 2 mL/kg. After 24 h, the animals were anesthetized via intraperitoneal injection of 2% pentobarbital (4 mg/kg), followed by blood collection to induce euthanasia. Subsequently, brain tissue was harvested for further analysis. The total duration of the experimental protocol is approximately 9 days. In this study, we used three rats per group to observe the previously confirmed effect of JU in reducing cerebral infarct volume. For Western blot analysis, three rats per group were allocated (total of fifteen rats for WB analysis). During the experiment, a heating pad maintained rectal temperature at 37.0–37.5 °C, and an infrared lamp kept the body temperature at 37 °C during surgery. According to the infarct volume of these rats, we can determine whether the operation is successful. The post-operative mortality rate was approximately 10%, and two additional rats were kept as backups. Blinding procedures were implemented throughout the study. The experimenter was unaware of the animal’s group allocation during drug administration, behavioral testing, and data collection.
Previous studies revealed the LD50 of JA and UA were 3 g/kg and 10 g/kg [39,40]. The doses for subsequent experiments were selected based on their demonstrated neuroprotective effects in ischemic stroke models [29,38]. The selected doses were JA (25 mg/mL), UA (7 mg/mL), and JU (a 1:1 combination of JA and UA), along with sham (0.9% NaCl) and vehicle (post-MCAO/R + 0.9% NaCl). Drugs were administered via tail vein injection at a dose of 2 mL/kg, resulting in the following drug dosages per kilogram: JA (50 mg/kg), UA (14 mg/kg), and the JU combination (25 mg/kg of JA and 7 mg/kg of UA). The administration was performed immediately after releasing the ligation. JA at 25 mg/mL significantly improved neurological function and reduced infarct volume, while UA at 7 mg/mL also exhibited protective effects. The JU combination was used to investigate potential synergistic neuroprotection following ischemic injury [41].

2.9. Evaluation of the Neurological Deficit Score and Infarct Volume

After 90 min of ischemia, the neurological deficits were assessed using Longa’s scoring method in each group (n = 4) [42]. The Longa score uses the following criteria: 0 points, no neurological deficit (similar to sham group); 1 point, failure to extend the left forepaw, indicating slight neurological deficit; 2 points, circling to the left, suggesting neurological deficit; 3 points, difficulty walking and hemiplegic behavior, showing severe neurological deficit; 4 points, inability to walk freely and significantly decreased level of consciousness.
At 24 h post-ischemia, rats were randomly selected from each group for calculating the cerebral infarction volumes via 2,3,5-triphenyltetrazolium chloride (TTC) staining, and the infarct size was measured by ImageJ software (version 1.53).

2.10. Western Blotting

After cell lysis and protein extraction, a standard Western blot (WB) experiment was conducted: 40 mg of total tissue protein was separated by 10% sodium dodecyl sulfate–polyacrylamide gel electrophoresis (SDS-PAGE) gel and transferred to a nitrocellulose membrane. Subsequently, the PVDF membrane was immersed in a blocking solution (TBST) containing 5% skimmed milk powder and blocked at room temperature for 2 h. The PVDF membrane was then immersed in the primary antibody incubation solution and kept overnight at 4 °C. After removing the excess primary antibody through washing, the PVDF membrane was further incubated in the secondary antibody solution at room temperature for 2 h. The secondary antibodies used were: anti-NRF1 (diluted 1:10,000, Proteintech, 12482-1-AP, RRID:AB_2282876), anti-CUL3 (diluted 1:10,000, Affinity, DF6223, RRID:AB_2838189), anti-ITGA4 (diluted 1:10,000, Proteintech, 19676-1-AP, RRID:AB_10640907), and anti-FN1 (diluted 1:10,000, Proteintech, 66042-1-IG, RRID:AB_11182385). β-actin (diluted 1:20,000, Affinity, T0022, RRID:AB_2839417) was employed as an internal control for comparison. The membrane was air-dried and scanned, and the grayscale intensity of the bands was analyzed using Image-Pro Plus 6.0 software to quantify the protein band densities.

2.11. Literature Validation

All relevant literature on Web of Science, Google Scholar, PubMed, and China National Knowledge Infrastructure were searched to verify the gene function pathways of the selected driver genes. The keyword ’cerebral ischemia’ and the selected driver genes were entered into the search bar, and the literature was read and judged to find a supporting verification text.

2.12. Statistical Analysis

Data are expressed as dot plots overlaid with bar group means ± S.D. Statistical analyses were performed using GraphPad Prism version 8.0.2 (GraphPad Software). For comparisons between two groups, the Mann–Whitney U test was used, while the Kruskal–Wallis test followed by Dunn’s post hoc test was applied for multiple group comparisons. Results were considered statistically significant at p < 0.05. The statistical analyst was blinded to the group allocation during data analysis, and group information was revealed only after the statistical analysis was completed.

3. Results

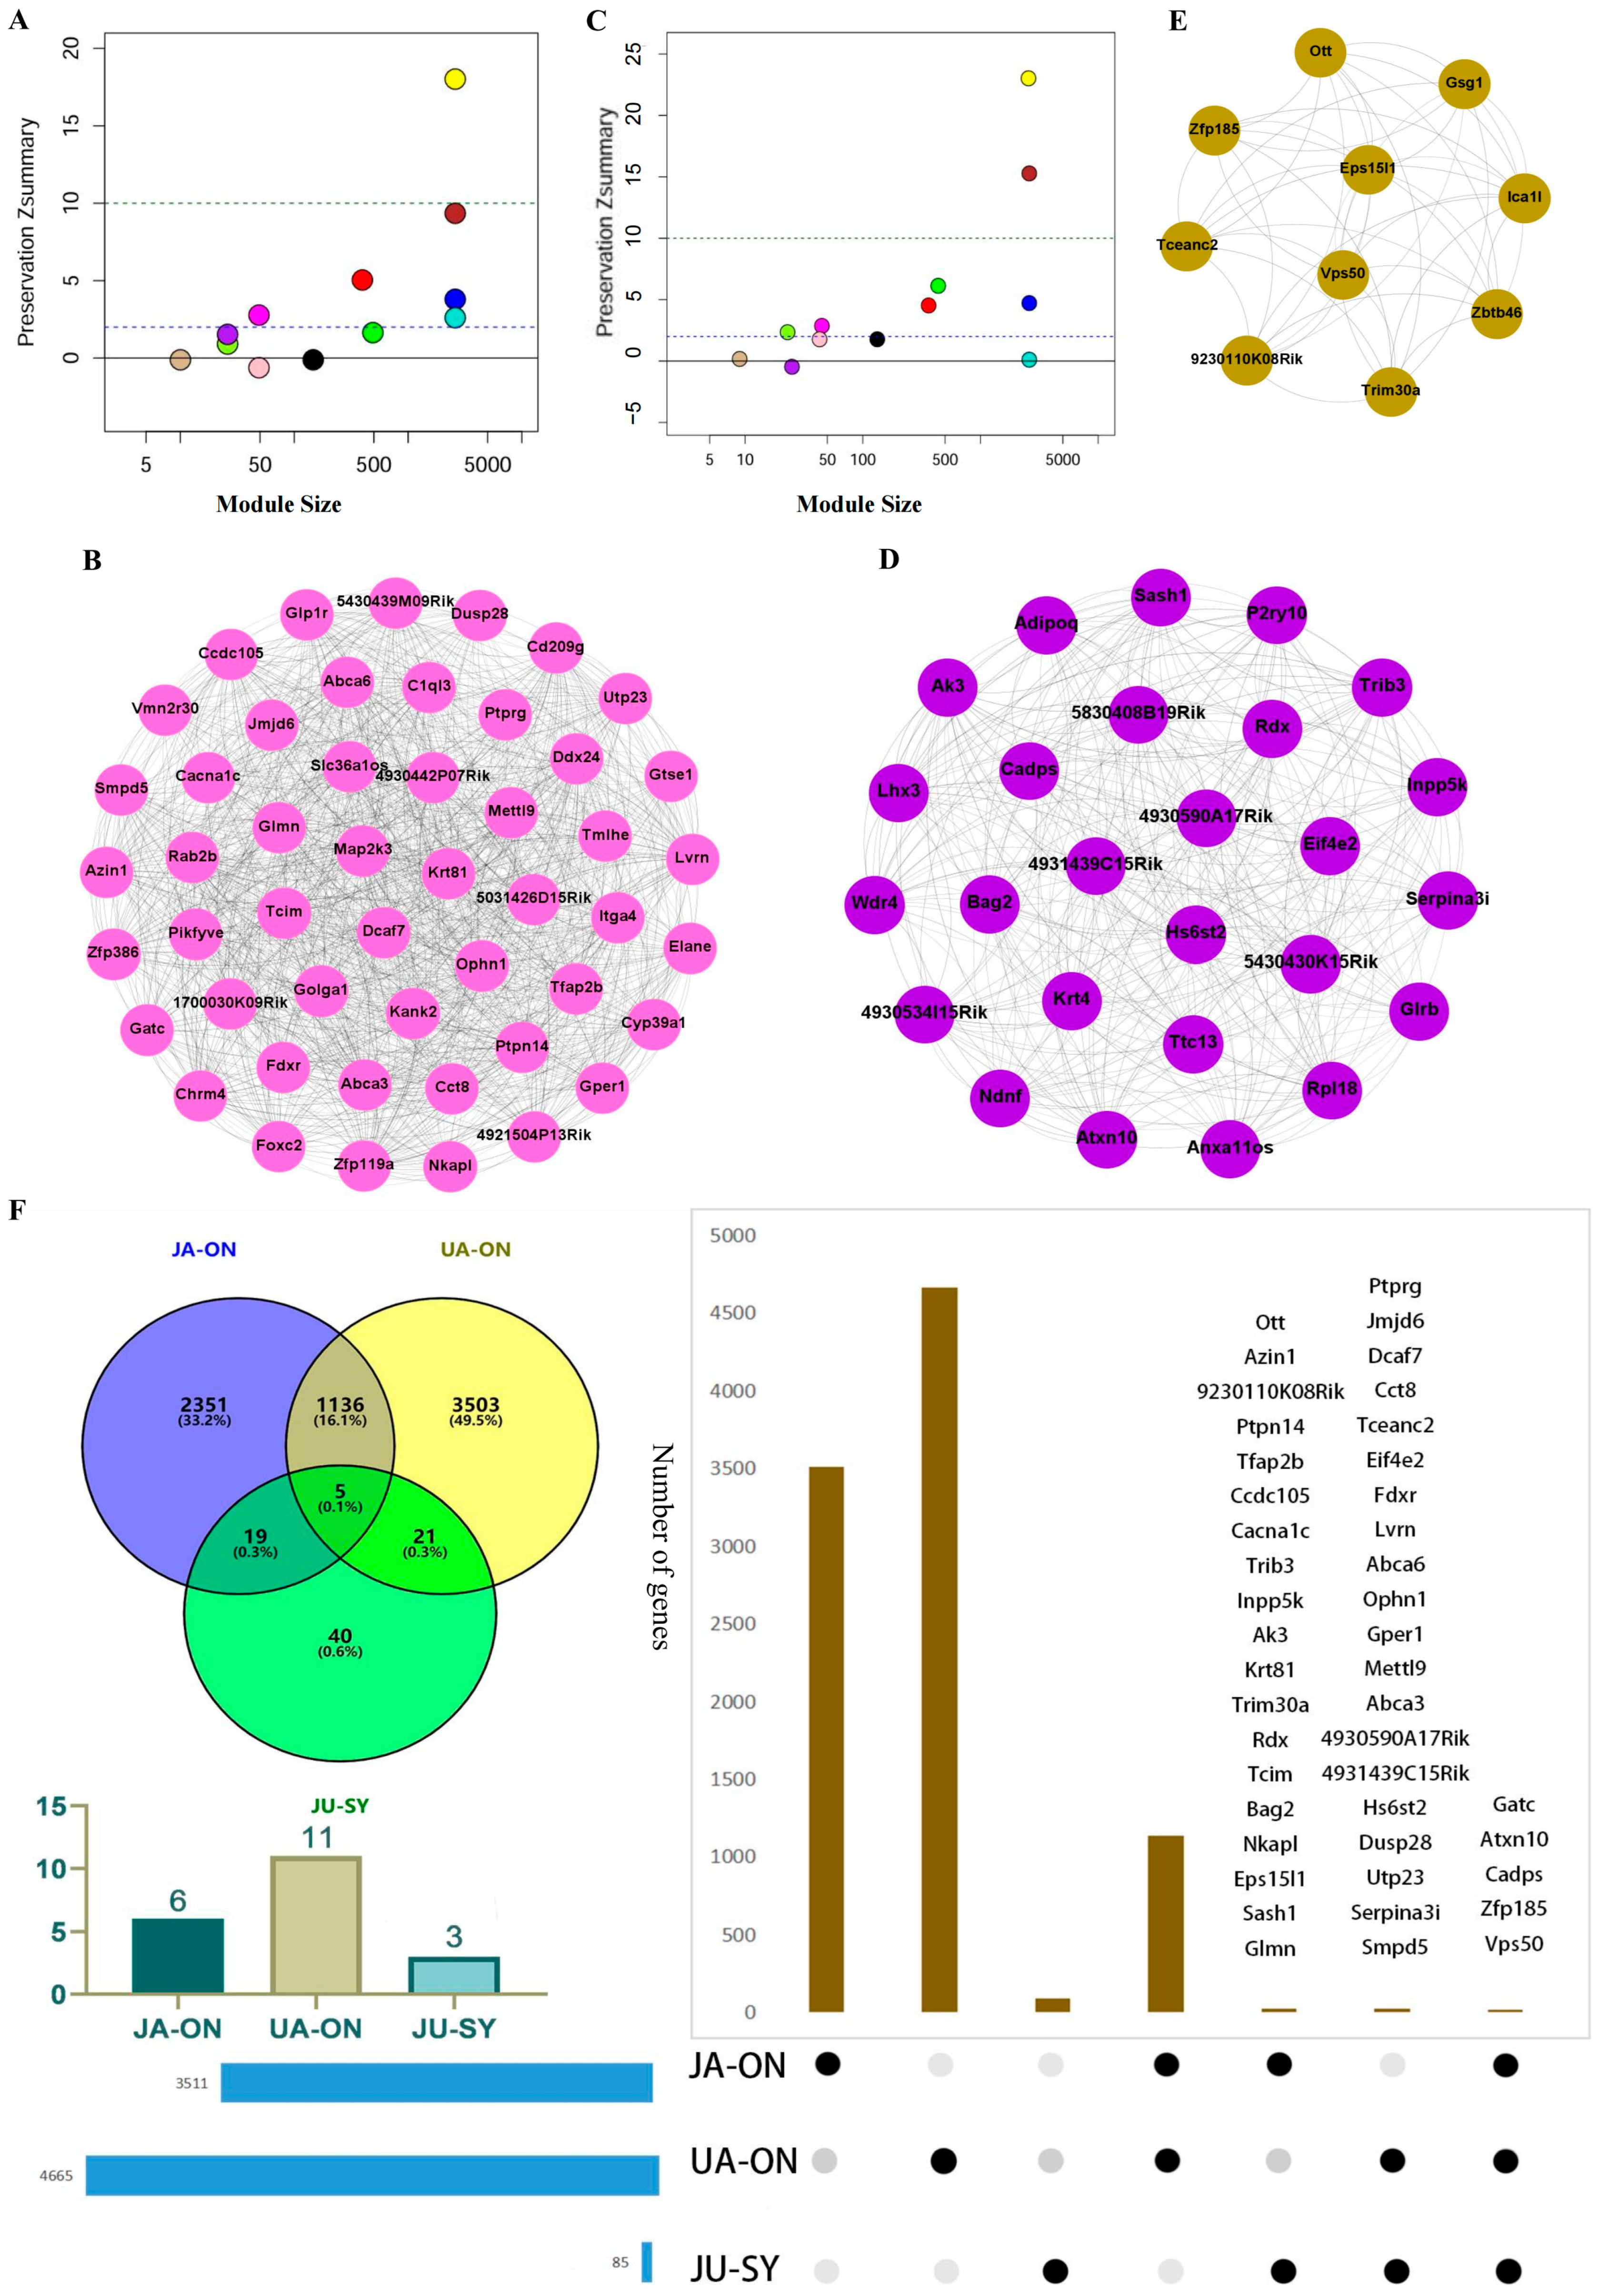
3.1. Co-Expression Modules of Three Drug Groups

Our previous study found that JA, UA, and JU effectively reduce ischemic infarct volume compared with the sham group, and JU is superior to the single drug groups JA and UA [43]. This proves the synergistic effect of JU in the treatment of CI.
A weighted gene co-expression grid map was constructed using the WGCNA package to identify the modules of the different drugs based on the expression profiles of the genes in JA, UA, and JU groups. We identified 29, 21, and 12 co-expression modules for JA, UA, and JU, respectively. Each module corresponded to a subset of the generated clusters and was assigned a unique color corresponding to a cluster (Figure 1A–C).

3.2. The Conserved and On_Modules of JA, UA, and JU

The biological modules in the obtained co-expression network were analyzed. The Z s u m m a r y value in WGCNA was retained compared to the sham group, where Z s u m m a r y 2 was regarded as a conserved module, and Z s u m m a r y < 0 was regarded as an On_module (Figure 1D–F). All modules in the three drug groups were compared with those in the sham group, and we obtained 6 (JA- Mod-6, 9, 24, 25, 26, and 27), 11 (UA-Mod-3, 4, 6, 7, 8, 9, 11, 13, 15, 16, and 18), and 4 (JU-Mod-6, 7, 8, and 10) On_modules of JA, UA, and JU, respectively. In contrast, JA, UA, and JU contained three (JA-Mod-1, 3, and 13), six (UA-Mod-2, 10, 14, 17, 20, and 21), and four (JU-Mod-2, 3, 11, and 12) conserved modules compared to the sham group, respectively.

3.3. The Synergistic Modules of JU

Consistent with the method described in the previous step, the modules of JU were compared with those of JA and UA to identify the synergistic modules (Sy_modules) that may represent the combination therapy mechanism of JU. A Sy_module (JU-Mod-8) was obtained compared to JA (Figure 2A,B). Three Sy_modules (JU-Mod-1, 7, and 10) were obtained compared to UA (Figure 2C–E). The modules reproduced in the On_modules of JU were considered to be Sy_modules, and three Sy_modules were obtained (JU-Mod-7, 8, and 10) that were composed of 49, 26, and 10 genes, respectively. In addition, there were eight conserved modules (JU-Mod-2, 3, 4, 5, 6, 9, 11, and 12) of JU containing 3534, 3517, 491, 25, 49, 397, 3569, and 2872 genes, respectively.
The gene numbers of the On_modules of JA and UA were 3511 and 4665, respectively, and the Sy_modules had 85 genes. Among them, 1136 genes were shared by the JA On_modules and UA On_modules, 21 genes were shared by the On_modules of the UA and Sy_modules, and 19 genes were shared by the On_modules of the JA and Sy_modules. Five common genes (Gatc, Atxn10, Cadps, Zfp185, and Vps50) were identified in all three groups, suggesting their core involvement in post-ischemic molecular responses. Gene overlaps and information on the JA On_modules, UA On_modules, and JU Sy_modules are shown in Figure 2F. Vps50, a component of the endosome-associated recycling protein complex, is implicated in vesicle trafficking and intracellular transport, which are essential for neuronal homeostasis and recovery [44]. Atxn10 is involved in RNA metabolism and gene expression regulation, processes crucial for cellular adaptation and repair following ischemic injury [45]. Cadps facilitates neurotransmitter release [46], while Zfp185, a zinc-finger protein, may function as a transcriptional regulator in response to cellular stress. Gatc is associated with chromatin remodeling and transcriptional regulation, playing a role in gene expression changes under ischemic conditions [47]. Notably, these genes were consistently present in JA On_modules, UA On_modules, and JU Sy_modules, suggesting their fundamental role across different treatment conditions. Their presence in JA and UA modules may indicate involvement in distinct neuroprotective pathways activated by individual treatments, while their inclusion in the JU Sy_modules suggests a potential role in mediating the synergistic effects observed with the combined treatment.

3.4. The Overlap of On_Module Genes and Differentially Expressed Genes

The cDNA expression profile of 16,463 genes identified 229, 165, and 225 DEGs in JA, UA, and JU, respectively (Supplementary Figure S1A–C). The total number of DEGs among the three drug groups was six (1.1%). There were 22 (4%) overlapping DEGs between JA and UA, 16 (2.9%) between UA and JU, and 19 (3.4%) between JA and JU (Supplementary Figure S1D). The low DEG overlap suggests that these treatments regulate distinct biological processes. JA-associated DEGs are primarily enriched in neural and immune-related pathways (e.g., glutamatergic and dopaminergic synapses, chemokine signaling), UA-associated DEGs predominantly involve inflammatory and metabolic pathways (e.g., TNF signaling, non-alcoholic fatty liver disease), while JU-associated DEGs regulate cellular stress and signal transduction (e.g., MAPK and calcium signaling). This indicates that different treatments elicit distinct molecular responses, contributing to the observed low DEG overlap. Despite this, each group’s DEGs are functionally relevant within their respective regulatory networks, potentially influencing neuroimmune interactions, inflammation, and metabolic homeostasis.
The genes in the modules or Sy_modules partially overlapped with the DEGs of each drug group. The number of overlapping genes between the JA-DEGs and the JA On_module was 42, while that between the UA-DEGs and the UA On_module was 29 (Supplementary Figure S1E), and 1 gene (Zfp119a) overlapped between the JU-DEGs and Sy_modules (Supplementary Figure S1F).

3.5. Network Synergistic Map Between Different Levels of Modules

S A B was used to measure the synergistic relationship between different drug groups. A synergistic effect was more likely at a smaller S A B . All S A B of the three drug groups were <0, and the S A B between JA and UA was the smallest from the perspective of DEGs (Table 1). The DEG network diagram of the three drug groups is shown in Figure 3A–C. The S A B values of the JA On_module and UA On_module were <0 from the perspective of On_modules. Based on S A B , the synergistic map of On_modules between JA and UA is shown in Figure 3D,E. The synergistic relationship between both DEGs and the On_module level suggested a synergistic effect between JA and UA.

3.6. Identification of Driver Genes and Literature Verification

The hub genes between the On_modules of the single-agent group were calculated based on two important indicators (shortest path and F C ) in the network. The top ten genes with the shortest path values and largest FC value were selected. Eight common genes (UBC, APP, NRF1, JUN, ELAVL1, GRB2, CUL3 and SUMO2) and four specific genes (YWHAZ, TP53, FN1 and PRKACA) were identified (Table 2). The driver gene UBC was not confirmed to be closely related to cerebral ischemia; however, other driver genes were identified. Many studies confirmed that SUMO [48,49,50], NRF1 [51,52], APP [53], JUN [54], ELAVL1 [55,56,57], GRB2 [58], CUL3 [59], YWHAZ [60], TP53 [61], FN1 [62] and PRKACA [63] are important targets for the treatment of CI. This proves that using the concept of S A B and the two indicators of shortest path and FC value may effectively screen the targets of drug combinations.
Among the identified genes, CUL3 may exacerbate neuronal apoptosis and aggravated cerebral ischemia–reperfusion injury by negatively regulating the Nrf2 signaling pathway [59]. GRB2 plays a key role in neuroprotection, reducing neuronal damage through the regulation of autophagy and the Akt/mTOR pathway in ischemic stroke [58]. FN1 has been implicated in ischemic stroke by promoting inflammation, participating in repair mechanisms, and regulating cell functions in the bone marrow microenvironment [64]. Additionally, ITGA4, present in JU Sy_modules, may regulate cell survival and apoptosis by influencing cell adhesion and migration, ultimately affecting neuronal injury and repair [65].

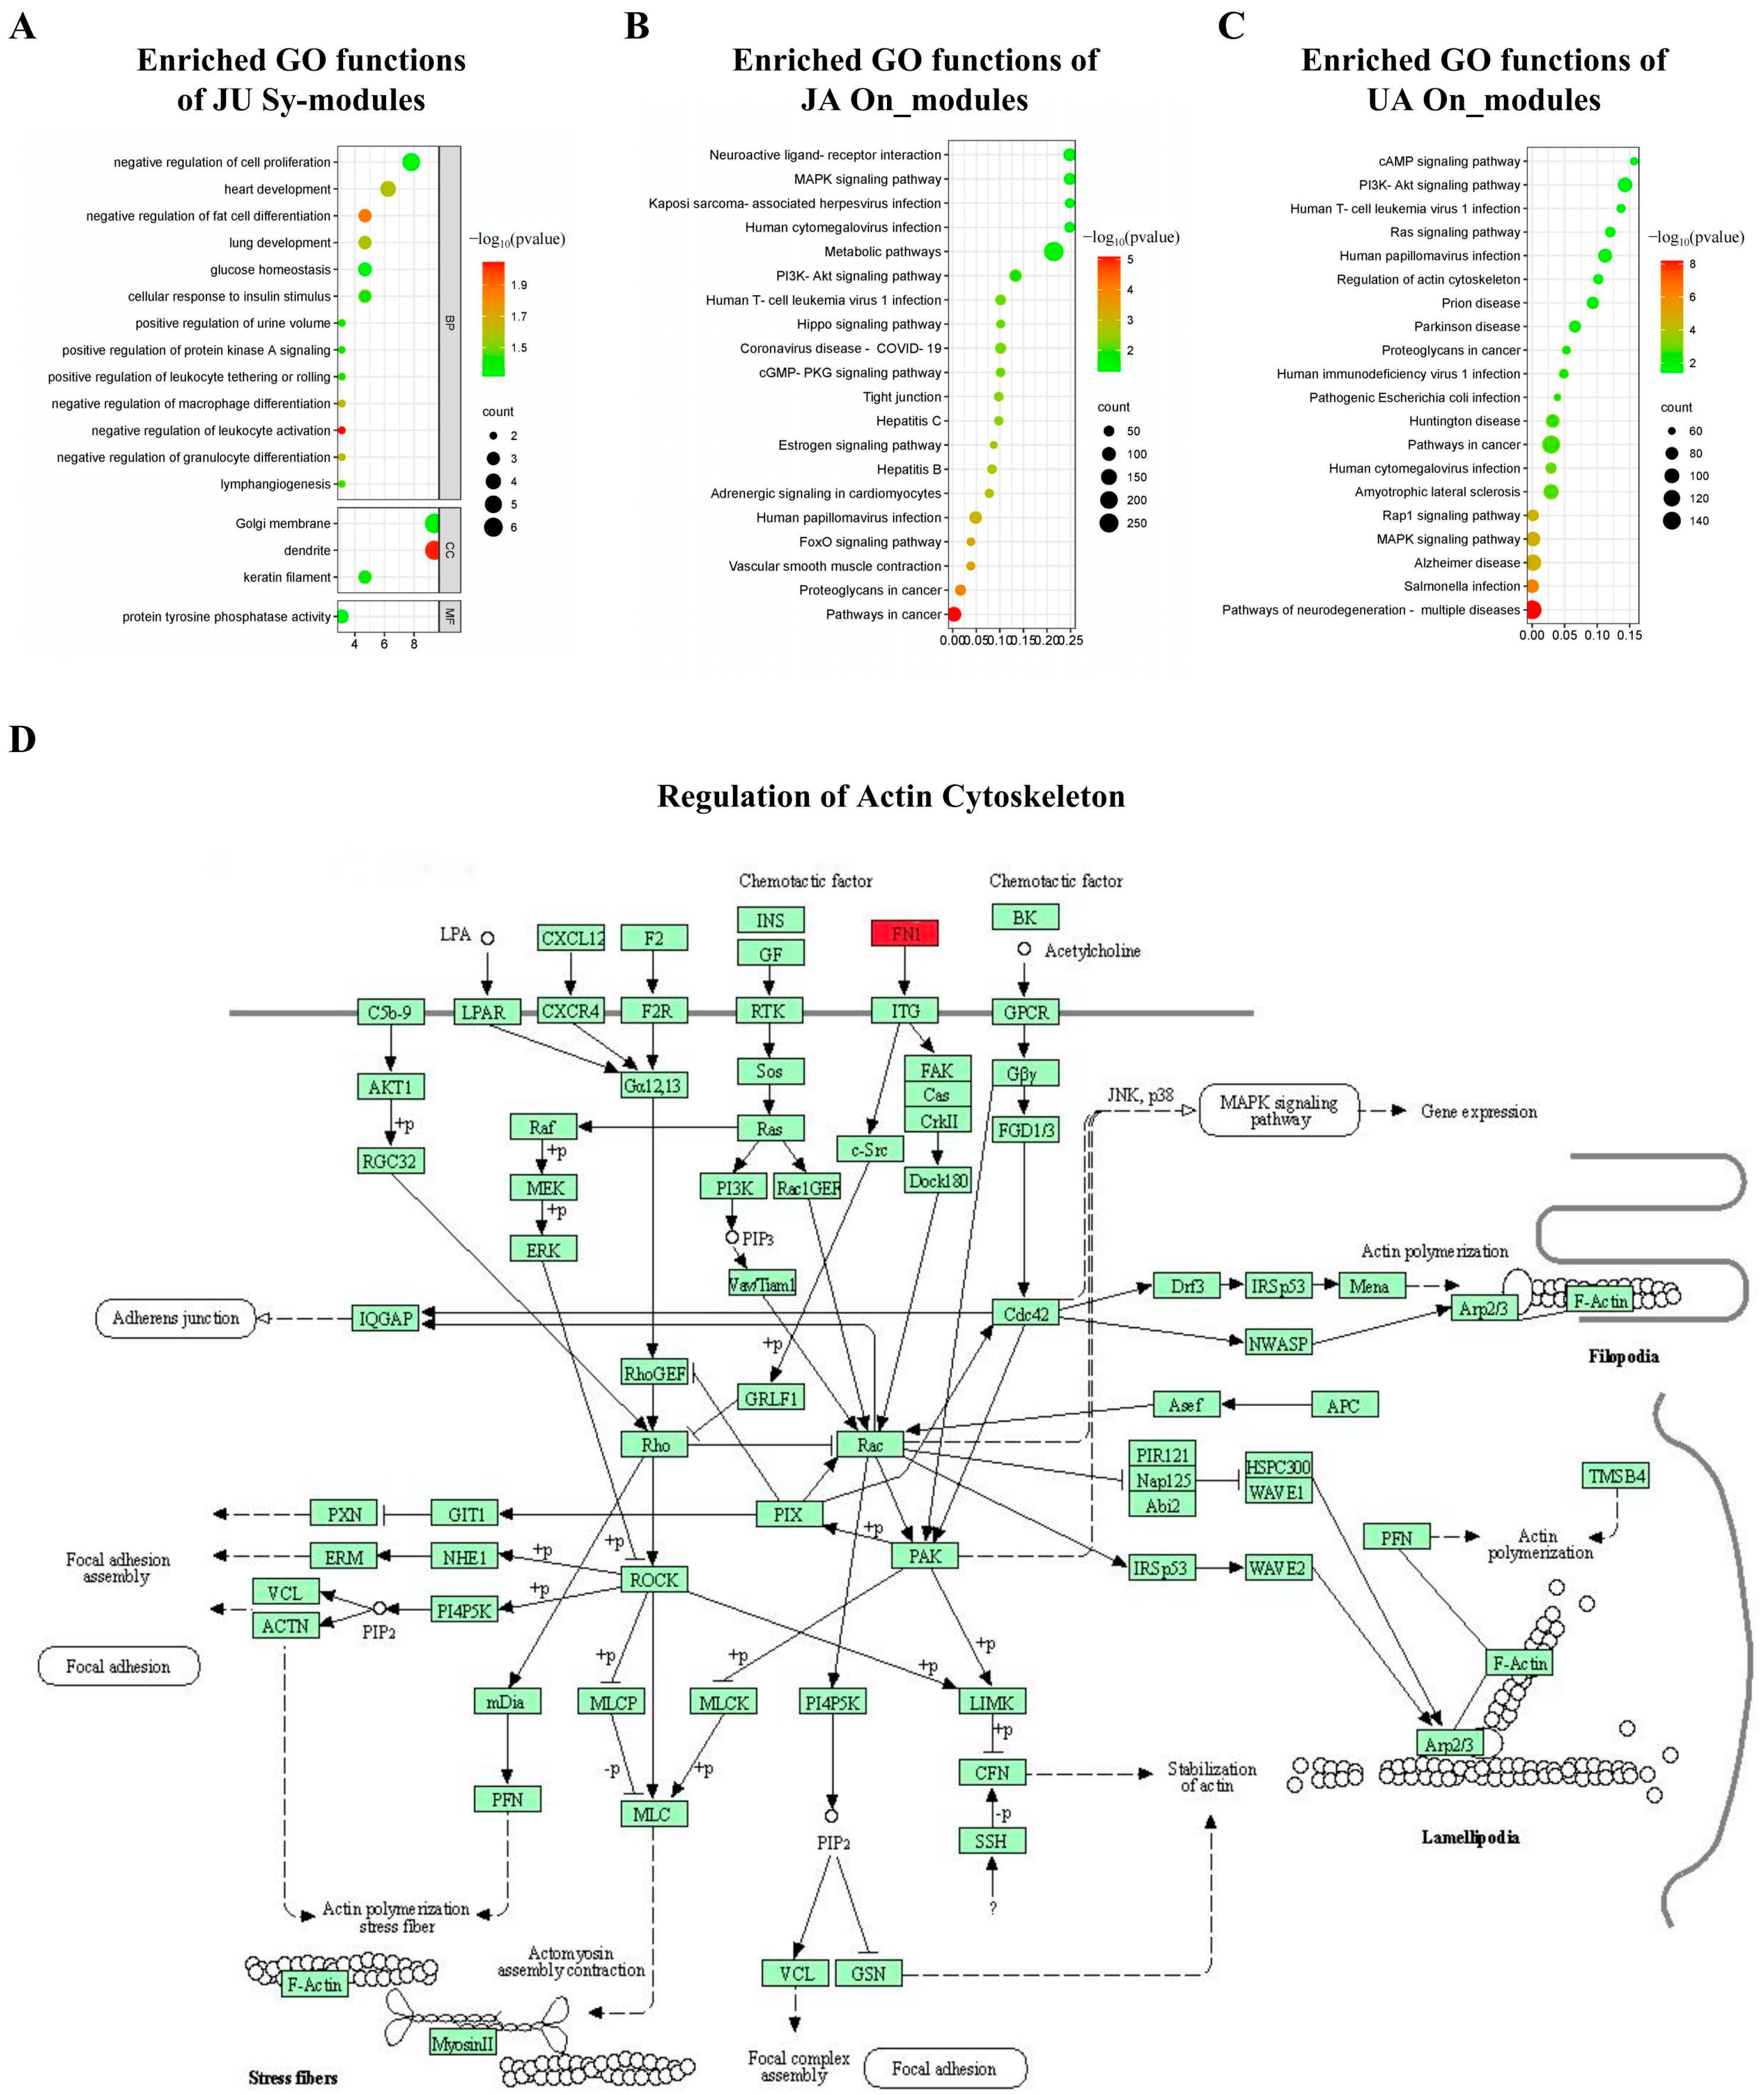
3.7. Significant Biological Functions

We conducted GO analysis and KEGG pathway enrichment analysis using the DAVID database (https://david.ncifcrf.gov/, accessed on 15 April 2023).
In biological process (BP), cellular component (CC), and molecular function (MF) of GO enrichment analysis categories, the significantly enriched functions of JU Sy_modules were identified (p < 0.05, Figure 4A): the BP functions were mainly related to regulation of development and maturation, regulation of protein kinase A signaling, and cell proliferation regulation, among others; the CC functions were mainly related to Golgi membranes and dendrites; the MF functions were related to protein tyrosine phosphatase activity.
For JA and UA On_modules (Figure 4B,C), the enriched KEGG pathways mainly involved the mitogen-activated protein kinase (MAPK), phosphoinositide-3 kinase-protein kinase B (PI3K-Akt), and cyclic adenosine monophosphate (cAMP) signaling pathways. For JU Sy_modules, KEGG enrichment analysis identified a specific enriched pathway, i.e., regulation of the actin cytoskeleton (p = 0.038, Figure 4D). In this regulation pathway, FN1 acted directly on ITG, promoting dendritic growth, providing neuroprotective effects, and improving blood–brain barrier permeability [62].

3.8. Protein Expression of Driver Genes and JU Sy_Modules’ Pathway

To validate the essential roles of the DiMS strategy and the JU Sy_modules in contributing to the synergistic effect of JU, WB analysis was used to examine the expression patterns of driver proteins and pathway proteins across different groups.
In our experiment, the TTC staining showed an increased infarct volume in the vehicle group compared to the sham group, and the infarct volumes were decreased in all of the three drug groups compared to that in the vehicle group (n = 3, Supplementary Figure S2A,B).
Additionally, compared with that of the sham group, the neurological deficit score of the vehicle group (4.5, p < 0.0001) was increased. Compared to that of the vehicle group, those of the UA (3.25, p < 0.05) and JU (2.5, p < 0.01) groups were decreased (Figure 5A). Notably, compared to JA, JU (2.5, p < 0.05) was more effective at improving neurological deficits.
The expression levels of three driver genes (CUL3, NRF1, FN1) identified through the DiMS strategy were analyzed via WB (Figure 5B–E). The driver genes FN1 and ITGA4 in the JU Sy_modules are located within the pathway that regulates the actin cytoskeleton (Figure 5E,F).
Figure 5C presents the relative expression levels of CUL3 across different treatment groups. Compared to the vehicle group (FC = 1), the sham group showed a significant decrease in CUL3 expression (FC = 0.21, p < 0.001). The JA group exhibited a moderate reduction (FC = 0.87), and the UA group showed a slight decrease (FC = 0.71), though neither change was statistically significant. In contrast, the JU group exhibited a further significant reduction in CUL3 expression (FC = 0.48, p < 0.01), indicating a statistically significant downregulation in response to treatment. Additionally, CUL3 expression in the JU group was significantly lower than that in the JA group (p < 0.01), suggesting that JU treatment induces a more pronounced downregulation of CUL3 expression.
Figure 5D presents the relative expression levels of NRF1 across different treatment groups. Compared to the vehicle group (FC = 1), the sham group exhibited a significant increase in NRF1 expression (FC = 5.00, p < 0.001). The JA group showed a moderate increase (FC = 2.00, p < 0.01), and similarly, the UA group demonstrated a slight increase (FC = 3.20, p < 0.01). In contrast, the JU group exhibited a further increase in NRF1 expression (FC = 3.70, p < 0.01), suggesting a more pronounced upregulation. Additionally, NRF1 expression in the JU group was significantly higher than in the JA group (p < 0.01), indicating that JU treatment is more effective in upregulating NRF1 expression compared to JA.
Figure 5E illustrates the relative expression levels of FN1 across different treatment groups. Compared to the vehicle group (FC = 1), the sham group showed a significant decrease in FN1 expression (FC = 0.26, p < 0.001). The UA group exhibited a moderate but significant reduction (FC = 0.74, p < 0.01), while the JU group showed a further decrease (FC = 0.61, p < 0.001). The JA group exhibited a slight reduction (FC = 0.87), but this change was not statistically significant. Further comparisons revealed that FN1 expression in the JU group was significantly lower than in the JA group (p < 0.05), indicating a stronger downregulation effect induced by JU treatment.
Figure 5F presents the relative ITGA4 expression levels across different treatment groups. Compared to the vehicle group (FC = 1), the sham group exhibited a significant decrease in ITGA4 expression (FC = 0.24, p < 0.001). The JA group showed a moderate increase (FC = 0.90), but this change was not statistically significant. The UA group demonstrated a slight increase (FC = 0.74, p < 0.01). In contrast, the JU group displayed a further reduction in ITGA4 expression (FC = 0.58, p < 0.05), indicating a statistically significant downregulation in response to treatment. Moreover, ITGA4 expression in the JU group was significantly lower than in the JA group (p < 0.05), suggesting that JU treatment induces a more pronounced downregulation of ITGA4 expression compared to JA.
The driver genes FN1 and ITGA4 in the JU Sy_modules are located within the pathway that regulates the actin cytoskeleton. WB results (Figure 5E,F) revealed significant downregulation of FN1 (p < 0.001) and ITGA4 (p < 0.05) in the JU group compared to the vehicle group.

4. Discussion

Prescriptions usually play a role in the formation of multi-components, multi-targets, and multi-pathways owing to the polypathogenic genes of complex diseases such as CI. However, it is challenging to fully explain the synergistic mechanism of drug combination therapy [66,67]. A variety of genes, proteins, and other cellular components constitute a complex network in complex life activities such as diseases and drug intervention. Increasing evidence shows that drug etiology and mechanisms of action are modular. The modular network of drugs modulates diseases to produce interventions during drug intervention [68,69,70]. Drugs intervene in diseases through a network, wherein the neighbors of the response gene usually have similar intervention responses, and some genes and neighbors have the same intervention response. Modules are considered gene, protein, or metabolic clusters that are functionally related or respond together when drugs intervene in a disease at the molecular level. These clusters are gathered to drive the modular process of disease drug treatment. This study systematically identified three synergistic modules and twelve driving genes of JU based on the gene expression data of JA, UA, and JU in the anti-CI model through a network topologic method and modular analysis of complex networks. Furthermore, the synergistic mechanism of JU was revealed in the treatment of CI from the field of modular networks and systems. The modular targeted research strategy was improved to provide a new perspective for exploring the advantages of drug combination therapy and screening the synergistic mechanisms of complex diseases.
The specific pathway of the JU Sy_modules was the regulation of the actin cytoskeleton based on the KEGG pathway analysis (Figure 4D). Dynamic changes in the actin cytoskeleton are key to a variety of cellular activities, including cell movement and phagocytosis [71], and the dysfunction of cytoskeletal proteins can lead to various diseases. Actin exists as monomeric and filamentous forms in cells and the transition between these two forms results in a steady-state equilibrium [72]. Rho mediates the regulation of the endothelial actin cytoskeleton, upregulates eNOS expression, and improves severe ischemia after middle cerebral artery occlusion [73]. Responses to GO terms such as stem dendrites, protein tyrosine phosphatase, and cell proliferation are closely related to protective effects against cerebral ischemia [74,75,76]. Regulation of the actin cytoskeleton is closely related to CI, such as neuroprotective effects [77,78], reduction of brain tissue damage [79], and changes in blood–brain barrier permeability [80]. We concluded that the identified Sy_modules are closely related to CI. In this study, we identified Sy_modules that are significantly enriched in the regulation of the actin cytoskeleton pathway, highlighting the potential relevance of this pathway in the treatment of CI. Following ischemic injury, disruption of the neuronal cytoskeleton leads to impaired morphology and function. Dynamic remodeling of the cytoskeleton plays a critical role in neural repair, particularly in neuronal migration, synaptic reconstruction, and neural network recovery. Targeted modulation of cytoskeletal proteins can aid in the recovery of neuronal morphology and promote the restoration of neurological function. Furthermore, the enrichment of Sy_modules in the regulation of the actin cytoskeleton pathway suggests that multi-target drugs may enhance therapeutic effects through synergistic actions. This mechanism provides a new perspective for the development of targeted therapies for CI and promotes the clinical translation of potential drug therapies. Following the analysis of the synergistic mechanism of JU and the involvement of the actin cytoskeleton pathway, it is important to highlight the potential correlation between the observed protein expression changes and behavioral improvements, particularly in the JU group. Based on the experimental results, there may be a correlation between neurological deficit scores and protein expression changes. The JU group exhibited significant downregulation of CUL3 and FN1, along with upregulation of NRF1, which was associated with behavioral improvements. Notably, the behavioral improvement in the JU group was more pronounced, and the changes in protein expression were more substantial, suggesting a link to neurorestoration and functional recovery. This finding reinforces the importance of multi-target interventions in enhancing therapeutic outcomes for complex diseases such as CI.
The network-topology-based driver node set in a biological network can screen hub targets of drug treatments, such as synergistic effects. When S A B < 0 , overlap exists between the On_modules of JA and UA in a complex network according to the calculation results of the JA On_ modules and UA On_modules. Local disturbance of JA in cerebral ischemia may also be involved in the same way UA intervenes in diseases with common or similar pharmacological characteristics. Furthermore, 12 driver genes (UBC, APP, NRF1, JUN, ELAVL1, GRB2, CUL3, SUMO2, YWHAZ, TP53, FN1 and PRKACA) were identified by calculating the shortest path and FC value. Among them, 11 driver genes were closely related to CI, as supported by the literature: SUMO [48,49,50], NRF1 [51,52], APP [53], JUN [54], ELAVL1 [55,56,57], GRB2 [58], CUL3 [59], YWHAZ [60], TP53 [61], FN1 [62] and PRKACA [63]. These results demonstrate the effectiveness of the Sy_modules, JA, and UA in elucidating the JU synergy mechanism through driving genes (Figure 6).
FN1 promotes endothelial cell proliferation and migration through the integrin/FAK/PI3K/Akt axis, enhancing microvascular formation while regulating extracellular matrix (ECM) remodeling to maintain vascular stability. FN1 also strengthens endothelial cell junctions, improving blood–brain barrier (BBB) function, and upregulates Bcl-2 to promote neuronal survival [62]. Additionally, ITGA4, as integrin α4, plays a crucial role in post-ischemic angiogenesis by facilitating endothelial cell migration and vascular formation, as well as regulating VE-cadherin and occludin to maintain BBB integrity [65,81]. ITGA4 modulates inflammatory cell infiltration, reducing inflammation-induced damage and supporting tissue repair in ischemic regions. FN1 and ITGA4 may act synergistically in vascular remodeling, with FN1 mediating ECM formation to support ITGA4-driven cell adhesion and migration. Together, they contribute to vascular repair and functional recovery in ischemic brain tissue. These mechanisms suggest that FN1 and ITGA4 may serve as potential therapeutic targets for ischemic stroke, providing new insights into post-ischemic vascular repair. NRF1 plays a vital role in mitochondrial biogenesis and redox signaling during cerebral ischemia. It regulates the expression of nuclear-encoded mitochondrial genes, promoting mitochondrial biogenesis, with the help of PGC-1α. NRF1 also enhances antioxidant defenses by activating genes like SOD2, GPX1, and CAT, which reduce oxidative stress and neuronal damage. Through its regulation of mitochondrial function and redox balance, NRF1 provides neuroprotection in ischemic stroke, making it a potential therapeutic target [82].
The top 20 overlapping pathways were the PI3K/Akt and mitogen-activated protein kinase/extracellular regulated protein kinases (MAPK/ERK) signaling pathways according to the results of gene function enrichment analysis of JA-DEGs and UA-DEGs. The PI3K/Akt signaling pathway is considered closely related to the occurrence and development of CI and can play an important regulatory role in a series of cascade reactions (including apoptosis, autophagy, oxidative stress, and neuroinflammation) [83,84,85,86,87,88]. The MAPK/ERK signaling pathway plays a role in the inflammatory response and blood–brain barrier dysfunction and is involved in autophagy, which is closely related to CI [89,90,91,92]. This study determined that the S A B values of the JA-DEGs and UA-DEGs in the network were negative, and the driver genes supported by the literature were obtained using the same calculation method. These results verified the effectiveness of the strategy used to explore the combined treatment mechanism.
Although the DiMS method has advantages in module identification, it may still produce false-positive modules that do not accurately reflect the biological characteristics of the system. In future studies, we plan to validate the identified modules across different datasets or conditions and use multi-angle validation to assess their consistency.

5. Conclusions

In conclusion, module-based S A B and network topological analysis identified three Sy_modules and twelve driver genes associated with JU in CI therapy. The driver genes of CUL3, NRF1, FN1, ITGA4 in Sy_modules and pathways were validated using in vivo experiments. These findings demonstrate JU can synergistically mitigate CI–reperfusion injury through regulating the driver genes inducing PI3K-Akt, MAPK, and actin cytoskeleton pathways. The findings highlight the innovative use of modular multi-target analysis to unravel the synergistic mechanisms of JU, providing a deeper understanding of its therapeutic potential. Future research should focus on further validating these pathways in clinical settings and exploring the applicability of the DiMS strategy for combination therapies in other complex diseases.

Supplementary Materials

The following supporting information can be downloaded at: https://www.mdpi.com/article/10.3390/biomedicines13040938/s1, Figure S1: Differentially expressed genes (DEGs) and their overlap across treatments and modules. Figure S2: TTC Staining and Infarct Volume Analysis in Rat Models.

Author Contributions

B.L. and Z.W. contributed to the conceptualization of the manuscript. J.W., Q.N., Y.Y. and J.L. performed the methodology. S.Z., W.Z., S.T. and J.W. contributed to the visualization. B.L., Q.N. and J.W. contributed to the writing—original draft. B.L. and Q.N. contributed to writing—reviewing, and editing. All authors have read and agreed to the published version of the manuscript.

Funding

This study was funded by the National Key Research and Development Project (No. 2023YFC3502900 to B. Li), the TCM Theory Inheritance and Innovation Project of CACMS Innovation Fund (KYG-202404 to B. Li), the Scientific and Technological Innovation Project of the China Academy of Chinese Medical Sciences (No. CI2021A05052 and CI2021B015 to B. Li), National Natural Science Foundation of China (No. 82474376 and No. 81803966 to B. Li), and the Fundamental Research Funds for the Central Public Welfare Research Institutes (ZXKT24002 and L2022054 to B. Li).

Institutional Review Board Statement

The animal study protocol was approved by the Ethics Committee of the Animal Laboratory of the Institute of Chinese Materia Medica, China Academy of Chinese Medical Sciences (license number: 2023B047, approved on 2 March 2023).

Data Availability Statement

The original contributions presented in this study are included in the article/Supplementary Material. Further inquiries can be directed to the corresponding authors.

Acknowledgments

Thanks to Pengqian Wang, Xiang Li, and Ziling Zeng for their contributions to this research.

Conflicts of Interest

The authors declare no conflict of interest.

References

  1. Tsao, C.W.; Aday, A.W.; Almarzooq, Z.I.; Anderson, C.A.M.; Arora, P.; Avery, C.L.; Baker-Smith, C.M.; Beaton, A.Z.; Boehme, A.K.; Buxton, A.E.; et al. Heart Disease and Stroke Statistics-2023 Update: A report from the American Heart Association. Circulation 2023, 147, e93–e621. [Google Scholar] [PubMed]
  2. Yadava, S.; Reddy, D.H.; Nakka, V.P.; Anusha, V.L.; Dumala, N.; Viswanadh, M.K.; Chakravarthi, G.; Nalluri, B.N.; Ramakrishna, K. Unravelling neuroregenerative and neuroprotective roles of Wnt/β-catenin pathway in ischemic stroke: Insights into molecular mechanisms. Neuroscience 2025, 565, 527–547. [Google Scholar] [CrossRef]
  3. Li, W.; Liu, X. Progress in the therapeutic time window for acute ischemic stroke. Stroke Vasc. Neurol. 2018, 13, 364–371. (In Chinese) [Google Scholar]
  4. Powers, W.J.; Rabinstein, A.A.; Ackerson, T.; Adevoe, O.M.; Bambakidis, N.C.; Becker, K. 2018 Guidelines for the Early Management of Patients with Acute Ischemic Stroke: A guideline for healthcare professionals from the American Heart Association/American Stroke Association. Stroke 2018, 49, e46–e110. [Google Scholar] [CrossRef]
  5. Song, K.; Guan, M.; Li, W.; Jing, Z.; Xie, X.; Shi, C.; Liang, J.; Qiao, H.; Huang, L. Acute ischemic stroke patients with diffusion-weighted imaging-Alberta Stroke Program Early Computed Tomography Score ≤ 5 can benefit from endovascular treatment: A single-center experience and literature review. Neuroradiology 2019, 61, 451–459. [Google Scholar] [CrossRef] [PubMed]
  6. Johnston, S.C.; Easton, J.D.; Farrant, M.; Barsan, W.; Conwit, R.A.; Elm, J.J.; Kim, A.S.; Lindblad, A.S.; Palesch, Y.Y. Clopidogrel and Aspirin in Acute Ischemic Stroke and High-Risk TIA. N. Engl. J. Med. 2018, 379, 215–225. [Google Scholar] [CrossRef]
  7. Wu, C.; Sun, C.; Wang, L.; Lian, Y.; Xie, N.; Huang, S.; Zhao, W.; Ren, M.; Wu, D.; Ding, J.; et al. Low-dose tirofiban treatment improves neurological deterioration outcome after intravenous thrombolysis. Stroke 2019, 50, 3481–3487. [Google Scholar] [CrossRef]
  8. Wang, L.; Peng, B.; Zhang, H.; Wang, Y.; Liu, M.; Shan, C.; Cao, L.; Wang, L.; Xie, W.; Wang, P.; et al. Brief report on stroke prevention and treatment in China, 2020. Chin. J. Cerebrovasc. Dis. 2022, 19, 136–144. (In Chinese) [Google Scholar]
  9. Ma, G.; Li, S.; Jia, B.; Mo, D.; Ma, N.; Gao, F.; Huo, X.; Luo, G.; Wang, A.; Pan, Y.; et al. Safety and efficacy of low-dose tirofiban combined with intravenous thrombolysis and mechanical thrombectomy in acute ischemic stroke: A matched-control analysis from a nationwide registry. Front. Neurol. 2021, 12, 666919. [Google Scholar] [CrossRef]
  10. Simats, A.; Ramiro, L.; Valls, R.; de Ramón, H.; García-Rodríguez, P.; Orset, C.; Artigas, L.; Sardon, T.; Rosell, A.; Montaner, J. Ceruletide and alpha-1 antitrypsin as a novel combination therapy for ischemic stroke. Neurotherapeutics 2022, 19, 513–527. [Google Scholar] [CrossRef]
  11. Wang, F.J.; Wang, S.X.; Chai, L.J.; Zhang, Y.; Guo, H.; Hu, L.M. Xueshuantong injection (lyophilized) combined with salvianolate lyophilized injection protects against focal cerebral ischemia/reperfusion injury in rats through attenuation of oxidative stress. Acta Pharmacol. Sin. 2018, 39, 998–1011. [Google Scholar] [CrossRef] [PubMed]
  12. Dou, Y.; Shu, Y.; Wang, Y.; Jia, D.; Han, Z.; Shi, B.; Chen, J.; Yang, J.; Qin, Z.; Huang, S. Combination treatment of Danggui Buxue Decoction and endothelial progenitor cells can enhance angiogenesis in rats with focal cerebral ischemia and hyperlipidemia. J. Ethnopharmacol. 2023, 314, 116563. [Google Scholar] [CrossRef] [PubMed]
  13. Wang, Z.; Wang, Y.Y. Modular pharmacology: Deciphering the interacting structural organization of the targeted networks. Drug Discov. Today 2013, 18, 560–566. [Google Scholar] [CrossRef] [PubMed]
  14. Chihara, N.; Madi, A.; Kondo, T.; Zhang, H.; Acharya, N.; Singer, M.; Nyman, J.; Marjanovic, N.D.; Kowalczyk, M.S.; Wang, C.; et al. Induction and transcriptional regulation of the co-inhibitory gene module in T cells. Nature 2018, 558, 454–459. [Google Scholar] [CrossRef]
  15. Li, B.; Liu, J.; Zhang, Y.; Wang, P.; Yu, Y.; Kang, R.; Wu, H.; Zhang, X.; Wang, Z.; Wang, Y. Quantitative identification of compounds-dependent on-modules and differential allosteric modules from homologous ischemic networks. CPT Pharmacomet. Syst. Pharmacol. 2016, 5, 575–584. [Google Scholar] [CrossRef]
  16. Shen, Z.; Xiang, M.; Chen, C.; Ding, F.; Wang, Y.; Shang, C.; Xin, L.; Zhang, Y.; Cui, X. Glutamate excitotoxicity: Potential therapeutic target for ischemic stroke. Biomed. Pharmacother. 2022, 151, 113125. [Google Scholar]
  17. Sun, Y.Y.; Zhu, H.J.; Zhao, R.Y.; Zhou, S.Y.; Wang, M.Q.; Yang, Y.; Guo, Z.N. Remote ischemic conditioning attenuates oxidative stress and inflammation via the Nrf2/HO-1 pathway in MCAO mice. Redox Biol. 2023, 66, 102852. [Google Scholar] [CrossRef]
  18. Cai, W.; Hu, M.; Li, C.; Wu, R.; Lu, D.; Xie, C.; Zhang, W.; Li, T.; Shen, S.; Huang, H.; et al. FOXP3+ macrophage represses acute ischemic stroke-induced neural inflammation. Autophagy 2022, 19, 1144–1163. [Google Scholar] [CrossRef]
  19. Cheng, Y.-J.; Wang, F.; Feng, J.; Yu, B.; Wang, B.; Gao, Q.; Wang, T.-Y.; Hu, B.; Gao, X.; Chen, J.-F.; et al. Prolonged myelin deficits contribute to neuron loss and functional impairments after ischaemic stroke. Brain 2024, 147, 1294–1311. [Google Scholar] [CrossRef]
  20. Casas, A.I.; Hassan, A.A.; Larsen, S.J.; Gomez-Rangel, V.; Elbatreek, M.; Kleikers, P.W.M.; Guney, E.; Egea, J.; López, M.G.; Baumbach, J.; et al. From single drug targets to synergistic network pharmacology in ischemic stroke. Proc. Natl. Acad. Sci. USA 2019, 116, 7129–7136. [Google Scholar] [CrossRef]
  21. Ma, C.; Wang, X.; Xu, T.; Zhang, S.; Liu, S.; Zhai, C.; Wang, Z.; Mu, J.; Li, C.; Cheng, F.; et al. An integrative pharmacology-based analysis of refined qingkailing injection against cerebral ischemic stroke: A novel combination of baicalin, geniposide, cholic acid, and hyodeoxycholic acid. Front. Pharmacol. 2020, 11, 519. [Google Scholar] [CrossRef]
  22. Rodrigues, C.M.; Spellman, S.R.; Solá, S.; Grande, A.W.; Linehan-Stieers, C.; Low, W.C.; Steer, C.J. Neuroprotection by a bile acid in an acute stroke model in the rat. J. Cereb. Blood Flow Metab. 2002, 22, 463–471. [Google Scholar] [CrossRef] [PubMed]
  23. Rodrigues, C.M.; Steer, C.J. The therapeutic effects of ursodeoxycholic acid as an anti-apoptotic agent. Expert Opin. Investig. Drugs 2001, 10, 1243–1253. [Google Scholar] [CrossRef] [PubMed]
  24. Wang, W.; Han, R.; Zhang, M.; Wang, Y.; Wang, T.; Wang, Y.; Shang, X.; Peng, J. A network-based method for brain disease gene prediction by integrating brain connectome and molecular network. Briefings Bioinform. 2021, 23, bbab459. [Google Scholar] [CrossRef]
  25. Zhou, Y.; Hou, Y.; Shen, J.; Huang, Y.; Martin, W.; Cheng, F. Network-based drug repurposing for novel coronavirus 2019-nCoV/SARS-CoV-2. Cell Discov. 2020, 6, 14. [Google Scholar] [CrossRef]
  26. Wang, W.; Wang, Y.; Zhang, Y.; Liu, D.; Zhang, H.; Wang, X. PPDTS: Predicting potential drug–target interactions based on network similarity. IET Syst. Biol. 2021, 16, 18–27. [Google Scholar] [CrossRef] [PubMed]
  27. Li, S.; Zhang, B.; Jiang, D.; Wei, Y.; Zhang, N. Herb network construction and co-module analysis for uncovering the combination rule of traditional Chinese herbal formulae. BMC Bioinform. 2010, 11, S6. [Google Scholar] [CrossRef]
  28. Gan, X.; Shu, Z.; Wang, X.; Yan, D.; Li, J.; Ofaim, S.; Albert, R.; Li, X.; Liu, B.; Zhou, X.; et al. Network medicine framework reveals generic herb-symptom effectiveness of traditional Chinese medicine. Sci. Adv. 2023, 9, eadh0215. [Google Scholar] [CrossRef]
  29. Wang, Z.; Jing, Z.-W.; Zhou, C.-X.; Zhang, L.; Cheng, J.; Zhang, Z.-J.; Liu, J.; Xu, C.-S.; Li, P.-T.; Wang, Y.-Y. Fusion of core pathways reveals a horizontal synergistic mechanism underlying combination therapy. Eur. J. Pharmacol. 2011, 667, 278–286. [Google Scholar] [CrossRef]
  30. Li, B.; Yu, Y.; Zhang, Y.; Liu, J.; Li, H.; Dang, H.; Guo, S.; Wang, L.; Wu, H.; Wang, Z.; et al. Vertical and horizontal convergences of targeting pathways in combination therapy with baicalin and jasminoidin for cerebral ischemia. CNS Neurol. Disord. Drug Targets 2016, 15, 740–750. [Google Scholar] [CrossRef]
  31. Langfelder, P.; Horvath, S. WGCNA: An R package for weighted correlation network analysis. BMC Bioinform. 2008, 9, 559. [Google Scholar] [CrossRef] [PubMed]
  32. Langfelder, P.; Zhang, B.; Horvath, S. Defining clusters from a hierarchical cluster tree: The Dynamic Tree Cut package for R. Bioinformatics 2008, 24, 719–720. [Google Scholar] [CrossRef]
  33. Langfelder, P.; Luo, R.; Oldham, M.C.; Horvath, S. Is my network module preserved and reproducible? PLoS Comput. Biol. 2011, 7, e1001057. [Google Scholar] [CrossRef] [PubMed]
  34. Chen, Y.; Chen, S.; Lei, E.P. DiffChIPL: A differential peak analysis method for high-throughput sequencing data with biological replicates based on limma. Bioinformatics 2022, 38, 4062–4069. [Google Scholar] [CrossRef] [PubMed]
  35. Cheng, F.; Kovacs, I.A.; Barabási, A.-L. Network-based prediction of drug combinations. Nat. Commun. 2019, 10, 1197. [Google Scholar] [CrossRef]
  36. Wang, Y.; Yang, H.; Chen, L.; Jafari, M.; Tang, J. Network-based modeling of herb combinations in traditional Chinese medicine. Brief Bioinform. 2021, 22, bbab106. [Google Scholar] [CrossRef]
  37. Maiorino, E.; Baek, S.H.; Guo, F.; Zhou, X.; Kothari, P.H.; Silverman, E.K.; Barabási, A.-L.; Weiss, S.T.; Raby, B.A.; Sharma, A. Author Correction: Discovering the genes mediating the interactions between chronic respiratory diseases in the human interactome. Nat. Commun. 2021, 12, 2434. [Google Scholar] [CrossRef]
  38. Li, B.; Wang, Y.; Gu, H.; Yu, Y.; Wang, P.; Liu, J.; Zhang, Y.; Chen, Y.; Niu, Q.; Wang, B.; et al. Modular Screening Reveals Driver Induced Additive Mechanisms of Baicalin and Jasminoidin on Cerebral Ischemia Therapy. Front. Cardiovasc. Med. 2022, 9, 813983. [Google Scholar] [CrossRef]
  39. Gao, A.; Zhang, W.S.; Feng, C.Q. Progress in the absorption, distribution, metabolism, and excretion processes of geniposide and its hepatotoxicity. Chin. J. Pharmacol. Toxicol. 2022, 36, 552–558. (In Chinese) [Google Scholar]
  40. Li, X.Y.; Su, F.F.; Jiang, C.; Zhang, W.; Wang, F.; Zhu, Q.; Yang, G. Overview of the evolution of bear bile efficacy and component research. Chin. J. Chin. Mater. Med. 2022, 47, 4846–4853. (In Chinese) [Google Scholar]
  41. Chen, Y.; Zhou, C.; Yu, Y.; Liu, J.; Jing, Z.; Lv, A.; Meng, F.; Wang, Z.; Wang, Y. Variations in target gene expression and pathway profiles in the mouse hippocampus following treatment with different effective compounds for ischemia–reperfusion injury. Naunyn-Schmiedeberg’s Arch. Pharmacol. 2012, 385, 797–806. [Google Scholar] [CrossRef]
  42. Longa, E.Z.; Weinstein, P.R.; Carlson, S.; Cummins, R. Reversible middle cerebral artery occlusion without craniectomy in rats. Stroke 1989, 20, 84–91. [Google Scholar] [CrossRef] [PubMed]
  43. Liu, J.; Zhou, C.; Zhang, Z.; Wang, L.; Jing, Z.; Wang, Z. Synergistic mechanism of gene expression and pathways between jasminoidin and ursodeoxycholic acid in treating focal cerebral ischemia-reperfusion injury. CNS Neurosci. Ther. 2012, 18, 674–682. [Google Scholar] [CrossRef] [PubMed]
  44. Cheng, L. Study on the Mechanism of Congenital Heart Disease Caused by RCAN1.4 and VPS50 Loss of Function. Ph.D. Thesis, Chongqing Medical University, Chongqing, China, 2018. (In Chinese). [Google Scholar]
  45. Hasan, A.; Furtado, G.V.; Miglorini, E.; Mergener, R.; Massuyama, B.; Barsottini, O.; Pedroso, J.L.; Teive, H.G.; Saraiva-Pereira, M.L.; Ashizawa, T.; et al. The impact of interrupted ATXN10 expansions on clinical findings of spinocerebellar ataxia type 10. J. Neurol. 2025, 272, 261. [Google Scholar] [CrossRef] [PubMed]
  46. Iguchi, H.; Katsuzawa, T.; Saruta, C.; Sadakata, T.; Kobayashi, S.; Sato, Y.; Sato, A.; Sano, Y.; Maezawa, S.; Shinoda, Y.; et al. Calcium-dependent activator protein for secretion 2 is involved in dopamine release in mouse midbrain neurons. Front. Mol. Neurosci. 2024, 17, 1444629. [Google Scholar] [CrossRef]
  47. Nobelmann, B.; Lengeler, J.W. Molecular analysis of the gat genes from Escherichia coli and of their roles in galactitol transport and metabolism. J. Bacteriol. 1996, 178, 6790–6795. [Google Scholar] [CrossRef]
  48. Lesnefsky, E.J.; Chen, Q.; Tandler, B.; Hoppel, C.L. Mitochondrial dysfunction and myocardial ischemia-reperfusion: Implications for novel therapies. Annu. Rev. Pharmacol. Toxicol. 2017, 57, 535–565. [Google Scholar] [CrossRef]
  49. Maneechote, C.; Palee, S.; Chattipakorn, S.C.; Chattipakorn, N. Roles of mitochondrial dynamics modulators in cardiac ischaemia/reperfusion injury. J. Cell. Mol. Med. 2017, 21, 2643–2653. [Google Scholar] [CrossRef]
  50. Sun, G.; Qin, W.; Wang, Q.; Sun, X.; Chen, H.; Li, J.; Sun, L.; Shi, F.; Zhang, G.; Wang, M. Selective-cerebral-hypothermia-induced neuroprotection against-focal cerebral ischemia/reperfusion injury is associated with an increase in SUMO2/3 conjugation. Brain Res. 2021, 1756, 147311. [Google Scholar] [CrossRef]
  51. Peng, K.; Yang, L.; Wang, J.; Ye, F.; Dan, G.; Zhao, Y.; Cai, Y.; Cui, Z.; Ao, L.; Liu, J.; et al. The interaction of mitochondrial biogenesis and fission/fusion mediated by PGC-1α regulates rotenone-induced dopaminergic neurotoxicity. Mol. Neurobiol. 2016, 54, 3783–3797. [Google Scholar] [CrossRef]
  52. Salehpour, F.; Farajdokht, F.; Mahmoudi, J.; Erfani, M.; Farhoudi, M.; Karimi, P.; Rasta, S.H.; Sadigh-Eteghad, S.; Hamblin, M.R.; Gjedde, A. Photobiomodulation and coenzyme Q10 treatments attenuate cognitive impairment associated with model of transient global brain ischemia in artificially aged mice. Front. Cell. Neurosci. 2019, 13, 74. [Google Scholar] [CrossRef] [PubMed]
  53. Antero, S.; Anu, K.; Kai, K. Hypoxia/ischemia activate processing of amyloid precursor protein: Impact of vascular dysfunction in the pathogenesis of Alzheimer’s disease. J. Neurochem. 2017, 140, 536–549. [Google Scholar]
  54. Li, W.; Liu, D.; Xu, J.; Zha, J.; Wang, C.; An, J.; Xie, Z.; Qiao, S. Astrocyte-derived TNF-α-activated platelets promote cerebral ischemia/reperfusion injury by regulating the RIP1/RIP3/AKT signaling pathway. Mol. Neurobiol. 2022, 59, 5734–5749. [Google Scholar] [CrossRef]
  55. Abeysinghe, H.C.S.; Phillips, E.L.; Chin-Cheng, H.; Beart, P.M.; Roulston, C.L. Modulating astrocyte transition after stroke to promote brain rescue and functional recovery: Emerging Targets Include Rho Kinase. Int. J. Mol. Sci. 2016, 17, 288. [Google Scholar] [CrossRef]
  56. Ardelt, A.A.; Carpenter, R.S.; Iwuchukwu, I.; Zhang, A.; Lin, W.; Kosciuczuk, E.; Hinkson, C.; Rebeiz, T.; Reitz, S.; King, P.H. Transgenic expression of HuR increases vasogenic edema and impedes functional recovery in rodent ischemic stroke. Neurosci. Lett. 2017, 661, 126–131. [Google Scholar] [CrossRef] [PubMed]
  57. Kwan, T.; Floyd, C.L.; Patel, J.; Mohaimany-Aponte, A.; King, P.H. Astrocytic expression of the RNA regulator HuR accentuates spinal cord injury in the acute phase. Neurosci. Lett. 2017, 651, 140–145. [Google Scholar] [CrossRef]
  58. Luo, H.-C.; Yi, T.-Z.; Huang, F.-G.; Wei, Y.; Luo, X.-P.; Luo, Q.-S. Role of long noncoding RNA MEG3/miR-378/GRB2 axis in neuronal autophagy and neurological functional impairment in ischemic stroke. J. Biol. Chem. 2020, 295, 14125–14139. [Google Scholar] [CrossRef] [PubMed]
  59. Chen, N.; Liu, Y.; Yu, H.; Liu, S.; Xiao, P.; Jia, Z.; Zhang, Z. The Role of Cullin 3 in Cerebral Ischemia–Reperfusion Injury. Neuroscience 2023, 514, 14–24. [Google Scholar] [CrossRef]
  60. Cheah, P.-S.; Ramshaw, H.S.; Thomas, P.Q.; Toyo-Oka, K.; Xu, X.; Martin, S.; Coyle, P.; Guthridge, M.A.; Stomski, F.; Buuse, M.v.D.; et al. Neurodevelopmental and neuropsychiatric behaviour defects arise from 14-3-3ζ deficiency. Mol. Psychiatry 2011, 17, 451–466. [Google Scholar] [CrossRef]
  61. Almeida, A.; Sánchez-Morán, I.; Rodríguez, C. Mitochondrial–nuclear p53 trafficking controls neuronal susceptibility in stroke. IUBMB Life 2021, 73, 582–591. [Google Scholar] [CrossRef]
  62. Zhao, Y.; Luo, Y.; Qian, J.; Xiao, B.G.; Lu, C.Z. Fibronectin and neuroprotective effect of granulocyte colony-stimulating factor in focal cerebral ischemia. Brain Res. 2006, 1098, 161–169. [Google Scholar]
  63. Zhang, H.; Zhao, L.; Yang, J.; Zhou, S.; Liu, J.; Wang, C.; Wang, B. Research on mechanism of combination of Scutellaria baicalensis Georgi and gardenia in treatment of ischemic stroke based on network pharmacology. Chin. Pharmacol. Bull. 2022, 38, 436–445. (In Chinese) [Google Scholar]
  64. Patel, S.; Khan, M.B.; Kumar, S.; Vyavahare, S.; Mendhe, B.; Lee, T.J.; Cai, J.; Isales, C.M.; Liu, Y.; Hess, D.C.; et al. The impact of ischemic stroke on bone marrow microenvironment and extracellular vesicles: A study on inflammatory and molecular changes. Exp. Neurol. 2024, 379, 114867. [Google Scholar] [CrossRef]
  65. Ding, Y.; Lang, Y.; Zhang, H.; Li, Y.; Liu, X.; Li, M. Candesartan Reduces Neuronal Apoptosis Caused by Ischemic Stroke via Regulating the FFAR1/ITGA4 Pathway. Mediat. Inflamm. 2022, 2022, 2356507. [Google Scholar] [CrossRef] [PubMed]
  66. Jiang, M.; Yin, P.; Bai, X.; Yang, L.; Zhang, J.; Xu, S. Proinflammatory and Anti-inflammatory Genes in Stroke Pathogenesis. Curr. Pharm. Des. 2020, 26, 4220–4233. [Google Scholar] [CrossRef]
  67. Park, H.; Lee, K.; Park, J.; Kang, K.; Lee, S.J.; Kim, J.G.; Cha, J.; Kim, D.; Han, M.; Kang, J.; et al. Prevalence of mutations in Mendelian stroke genes in early onset stroke patients. Ann. Neurol. 2023, 93, 768–782. [Google Scholar] [CrossRef]
  68. Benson, A.R.; Gleich, D.F.; Leskovec, J. Higher-order organization of complex networks. Science 2016, 353, 163–166. [Google Scholar] [CrossRef] [PubMed]
  69. Choobdar, S.; Ahsen, M.E.; Crawford, J.; Tomasoni, M.; Fang, T.; Lamparter, D.; Lin, J.; Hescott, B.; Hu, X.; Marbach, D.; et al. Assessment of network module identification across complex diseases. Nat. Methods 2019, 16, 843–852. [Google Scholar] [CrossRef]
  70. Huang, J.; Chen, J.; Zhang, B.; Zhu, L.; Cai, H. Evaluation of gene–drug common module identification methods using pharmacogenomics data. Briefings Bioinform. 2020, 22, bbaa087. [Google Scholar] [CrossRef]
  71. Ahmadian, E.; Eftekhari, A.; Atakishizada, S.; Valiyeva, M.; Ardalan, M.; Khalilov, R.; Kavetskyy, T. Podocytopathy: The role of actin cytoskeleton. Biomed. Pharmacother. 2022, 156, 113920. [Google Scholar] [CrossRef]
  72. Das, S.; Zhang, Z.; Kalvakota, S.; Soto, R.; Phillips, M.L.; Terman, J.R.; Reisler, E. Parallel actin monomers in the 8S complex of actin–INF2. J. Biomol. Struct. Dyn. 2022, 41, 3295–3304. [Google Scholar] [CrossRef] [PubMed]
  73. Wang, G.; Wang, T.; Hu, Y.; Wang, J.; Wang, Y.; Zhang, Y.; Li, F.; Liu, W.; Sun, Y.; Yu, B.; et al. NMMHC IIA triggers neuronal autophagic cell death by promoting F-actin-dependent ATG9A trafficking in cerebral ischemia/reperfusion. Cell Death Dis. 2020, 11, 428. [Google Scholar] [CrossRef] [PubMed]
  74. Wang, X.-P.; Yu, X.; Yan, X.-J.; Lei, F.; Chai, Y.-S.; Jiang, J.-F.; Yuan, Z.-Y.; Xing, D.-M.; Du, L.-J. TRPM8 in the negative regulation of TNFα expression during cold stress. Sci. Rep. 2017, 7, 45155. [Google Scholar] [CrossRef]
  75. Zhang, B.; Chen, X.; Lv, Y.; Wu, X.; Gui, L.; Zhang, Y.; Qiu, J.; Song, G.; Yao, W.; Wan, L.; et al. Cdh1 overexpression improves emotion and cognitive-related behaviors via regulating hippocampal neuroplasticity in global cerebral ischemia rats. Neurochem. Int. 2019, 124, 225–237. [Google Scholar] [CrossRef] [PubMed]
  76. Zhu, Y.; Yu, J.; Gong, J.; Shen, J.; Ye, D.; Cheng, D.; Xie, Z.; Zeng, J.; Xu, K.; Shen, J.; et al. PTP1B inhibitor alleviates deleterious microglial activation and neuronal injury after ischemic stroke by modulating the ER stress-autophagy axis via PERK signaling in microglia. Aging 2021, 13, 3405–3427. [Google Scholar] [CrossRef]
  77. Vafiadaki, E.; Arvanitis, D.A.; Eliopoulos, A.G.; Kranias, E.G.; Sanoudou, D. The cardioprotective PKA-mediated Hsp20 phosphorylation modulates protein associations regulating cytoskeletal dynamics. Int. J. Mol. Sci. 2020, 21, 9572. [Google Scholar] [CrossRef]
  78. Yadunandanan Nair, N.; Samuel, V.; Ramesh, L.; Marib, A.; David, D.T.; Sundararaman, A. Actin cytoskeleton in angiogenesis. Biol. Open 2022, 11, bio058899. [Google Scholar]
  79. Guo, C.-Y.; Xiong, T.-Q.; Tan, B.-H.; Gui, Y.; Ye, N.; Li, S.-L.; Li, Y.-C. The temporal and spatial changes of actin cytoskeleton in the hippocampal CA1 neurons following transient global ischemia. Brain Res. 2019, 1720, 146297. [Google Scholar] [CrossRef]
  80. Xue, Y.; He, J.-T.; Zhang, K.-K.; Chen, L.-J.; Wang, Q.; Xie, X.-L. Methamphetamine reduces expressions of tight junction proteins, rearranges F-actin cytoskeleton and increases the blood brain barrier permeability via the RhoA/ROCK-dependent pathway. Biochem. Biophys. Res. Commun. 2019, 509, 395–401. [Google Scholar] [CrossRef]
  81. Shang, G.; Zhang, W.; Jia, Y.; Ji, D.; Wei, E.; Gao, C.; Zeng, C.; Wang, C.; Liu, N.; Ge, P.; et al. GAS41 promotes ITGA4-mediated PI3K/Akt/mTOR signaling pathway and glioma tumorigenesis. Biochem. Pharmacol. 2025, 233, 116747. [Google Scholar] [CrossRef]
  82. You, W.; Knoops, K.; Berendschot, T.T.J.M.; Benedikter, B.J.; Webers, C.A.B.; Reutelingsperger, C.P.M.; Gorgels, T.G.M.F. PGC-1a mediated mitochondrial biogenesis promotes recovery and survival of neuronal cells from cellular degeneration. Cell Death Discov. 2024, 10, 180. [Google Scholar] [CrossRef] [PubMed]
  83. Zheng, T.; Shi, Y.; Zhang, J.; Peng, J.; Zhang, X.; Chen, K.; Chen, Y.; Liu, L. MiR-130a exerts neuroprotective effects against ischemic stroke through PTEN/PI3K/AKT pathway. Biomed. Pharmacother. 2019, 117, 109117. [Google Scholar] [CrossRef] [PubMed]
  84. Tu, X.; Yang, B.; Tu, D.; Liang, R.; Shi, S. Propofol attenuates neuroinflammation and brain damage via modulating PI3K/Akt signaling pathway in rats of focal cerebral ischemia. Chin. Pharmacol. Bull. 2019, 35, 630–633. (In Chinese) [Google Scholar]
  85. Wang, C.; Wan, H.; Li, M.; Zhang, C. Celastrol attenuates ischemia/reperfusion-mediated memory dysfunction by downregulating AK005401/MAP3K12. Phytomedicine 2021, 82, 153441. [Google Scholar] [CrossRef] [PubMed]
  86. Yang, B.; Li, Y.; Ma, Y.; Zhang, X.; Yang, L.; Shen, X.; Zhang, J.; Jing, L. Selenium attenuates ischemia/reperfusion injury-induced damage to the blood-brain barrier in hyperglycemia through PI3K/AKT/mTOR pathway-mediated autophagy inhibition. Int. J. Mol. Med. 2021, 48, 178. [Google Scholar] [CrossRef]
  87. Lan, H.; Zheng, Q.; Wang, K.; Li, C.; Xiong, T.; Shi, J.; Dong, N. Cinnamaldehyde protects donor heart from cold ischemia–reperfusion injury via the PI3K/AKT/mTOR pathway. Biomed. Pharmacother. 2023, 165, 114867. [Google Scholar] [CrossRef]
  88. Li, R.; Zheng, Y.; Zhang, J.; Zhou, Y.; Fan, X. Gomisin N attenuated cerebral ischemia-reperfusion injury through inhibition of autophagy by activating the PI3K/AKT/mTOR pathway. Phytomedicine Int. J. Phytother. Phytopharm. 2023, 110, 154644. [Google Scholar] [CrossRef]
  89. Zhang, T.; Wang, D.; Li, X.; Jiang, Y.; Wang, C.; Zhang, Y.; Kong, Q.; Tian, C.; Dai, Y.; Zhao, W.; et al. Excess salt intake promotes M1 microglia polarization via a p38/MAPK/AR-dependent pathway after cerebral ischemia in mice. Int. Immunopharmacol. 2020, 81, 106176. [Google Scholar] [CrossRef]
  90. Zhou, D.; Zhang, M.; Min, L.; Jiang, K.; Jiang, Y. Cerebral ischemia-reperfusion is modulated by macrophage-stimulating 1 through the MAPK-ERK signaling pathway. J. Cell Physiol. 2020, 235, 7067–7080. [Google Scholar] [CrossRef]
  91. Zhang, Q.; Zheng, M.; Betancourt, C.E.; Liu, L.; Sitikov, A.; Sladojevic, N.; Zhao, Q.; Zhang, J.H.; Liao, J.K.; Wu, R. Increase in blood-brain barrier (BBB) permeability is regulated by MMP3 via the ERK signaling pathway. Oxidative Med. Cell. Longev. 2021, 2021, 6655122. [Google Scholar] [CrossRef]
  92. Li, G.; Duan, L.; Yang, F.; Yang, L.; Deng, Y.; Yu, Y.; Xu, Y.; Zhang, Y. Curcumin suppress inflammatory response in traumatic brain injury via p38/MAPK signaling pathway. Phytother. Res. 2022, 36, 1326–1337. [Google Scholar] [CrossRef] [PubMed]
Figure 1. Hierarchical clustering tree diagram of three drug groups and hierarchical clustering tree diagram of On_modules. (AC) Hierarchical clustering tree diagram of three drug groups and hierarchical clustering tree diagram of On_modules (JA, UA, and JU). (DF) On_modules of JA, UA, and JU compared with sham group. JA, UA, and JU modules are labeled with a specific color. Modules are color-coded, with each color representing a distinct gene co-expression module without specific biological meaning. JA, jasminoidin; JU, combination of jasminoidin and ursodeoxycholic acid; UA, ursodeoxycholic acid.
Biomedicines 13 00938 g001
Figure 2. Preservation analysis and visualization of Sy_modules in JU compared to single-drug treatments (JA or UA). (A) Preservation Zsummary values for different gene modules in JU compared to JA. The solid line represents the threshold of 0, and the dashed line represents the threshold of 2. Modules below the solid line are considered Sy_modules (response modules), indicating significant changes in gene expression patterns under JU treatment compared to JA treatment. (B) Visualization of the Sy_module (JU-Mod-8) identified in JU compared to JA. (C) Preservation Zsummary values for different gene modules in JU compared to UA. Modules below the solid line are considered Sy_modules (response modules), indicating significant changes in gene expression patterns under JU treatment compared to UA treatment. (D) Visualization of the Sy_module (JU-Mod-10) identified in JU compared to UA. (E) Visualization of the Sy_module (JU-Mod-7) identified in JU compared to UA. (F) Gene overlap and information among JA On_ modules (response modules identified in JA compared to the sham group), UA On_modules (response modules identified in UA compared to the sham group), and JU Sy_modules (response modules identified in JU compared to single-drug groups). JA, jasminoidin; JU, combination of jasminoidin and ursodeoxycholic acid; UA, ursodeoxycholic acid.
Biomedicines 13 00938 g002
Figure 3. The network map of three drug groups at the DEG level and On_module level. (A) The network map of JA-UA at the DEG level. (B) The network map of JA-JU at the DEG level. (C) The network map of UA-JU at the DEG level. The blue module represents the JA group, the green module represents the UA, the purple module represents the JU, and the pink region represents the common gene group. (D) S A B diagram of JA On_modules and UA On_modules. (E) Heatmap between small modules in JA On_modules and UA On_modules. DEG, differentially expressed gene; JA, jasminoidin; JU, combination of jasminoidin and ursodeoxycholic acid; UA, ursodeoxycholic acid.
Biomedicines 13 00938 g003
Figure 4. Functional enrichment of JU Sy_modules, JA On_modules, and UA On_modules. (A) Significant Gene Ontology (GO) terms enriched in Sy_modules, illustrating the enrichment of biological processes, molecular functions, and cellular components associated with Sy_modules, which represent response modules of JU compared to single-drug groups. (B) Significant Gene Ontology (GO) terms enriched in JA On_modules, illustrating the biological processes, molecular functions, and cellular components associated with JA On_modules, which represent response modules of JA compared to the sham group. (C) Significant Gene Ontology (GO) terms enriched in UA On_modules, illustrating the biological processes, molecular functions, and cellular components associated with UA On_modules, which represent response modules of UA compared to the sham group. (D) Sy_modules enriched in the regulation of the actin cytoskeleton signaling pathway, with the driver genes of the JU Sy_module (highlighted in red in the figure) showing strong associations with this pathway, suggesting that JU may influence cytoskeletal dynamics, which could play a role in cellular structural remodeling. JA, jasminoidin; JU, combination of jasminoidin and ursodeoxycholic acid; UA, ursodeoxycholic acid.
Biomedicines 13 00938 g004
Figure 5. Neurological deficit scores and validation of driver gene and Sy_module gene expression levels at 24 h post-MCAO/R. (A) Comparison of the neurological deficit scores across each group 24 h after MCAO/R (n = 6). This measure provides insight into the functional impairment following ischemic injury, with the score reflecting the severity of the neurological deficits. A lower score indicates milder neurological dysfunction. (B) Western blotting results showing the expression levels of three representative proteins, with β-actin as a loading control. Differences in band intensity indicate variations in protein expression across treatment groups, reflecting the molecular effects of JU, JA, and UA treatments on these proteins. (CF) Validation of the expression levels of key driver genes (CUL3, NRF1) and pathway-related proteins (FN1, ITGA4) in each group (n = 3), as determined by Western blotting. The comparison of protein expression levels among the groups reflects the differential regulation of these molecules after JU, JA, or UA treatment, compared to the sham or single-drug groups. * p < 0.05, ** p< 0.01, *** p < 0.001, **** p < 0.0001, and ns, non-significant.
Biomedicines 13 00938 g005
Figure 6. The mechanism map of cerebral ischemia in JU. The circles represent the genes and the rectangles represent the enrichment pathways. The red genes are the identified driver genes, the purple genes play mediating roles, and the driver genes drive the purple genes to complete the therapeutic effect. JU, combination of jasminoidin and ursodeoxycholic acid.
Biomedicines 13 00938 g006
Table 1. Detailed SAB values of JA-JU, JA-JU, and UA-JU at the DEG level.
Module-aModule-aSAB
JA-DEGsUA-DEGs−0.266
JA-DEGsJU-DEGs−0.183
UA-DEGsJU-DEGs−0.149
Abbreviations: DEG, differentially expressed gene; JA, jasminoidin; JU, combination of jasminoidin and ursodeoxycholic acid; UA, ursodeoxycholic acid.
Table 2. The literature support and data of JA and UA On_modules.
Driver GeneThe Shortest DistanceFlow CentralityLiterature
UBC59042,442,296.72-
SUMO2875844,576.78[48,49,50]
NRF18445156,372.58[51,52]
APP8420171,885.22[53]
JUN858952,966.16[54]
ELAVL1860189,125.44[55,56,57]
GRB2874661,624.5[58]
CUL3875731,379.5[59]
YWHAZ8828-[60]
TP538841-[61]
FN1-38,194.56[62]
PRKACA-33,893.5[63]
Abbreviations: JA, jasminoidin; UA, ursodeoxycholic acid.
Disclaimer/Publisher’s Note: The statements, opinions and data contained in all publications are solely those of the individual author(s) and contributor(s) and not of MDPI and/or the editor(s). MDPI and/or the editor(s) disclaim responsibility for any injury to people or property resulting from any ideas, methods, instructions or products referred to in the content.

