Abstract
Background: The EGF domain-specific O-GlcNAc transferase (EOGT), a migrasome marker, plays emerging roles in cancer biology through O-GlcNAcylation modifications, yet its pan-cancer functions and therapeutic implications remain underexplored. This study aimed to systematically characterize EOGT’s oncogenic mechanisms across malignancies, with particular focus on hepatocellular carcinoma (HCC) progression and sorafenib resistance. Methods: Multi-omics analysis integrated TCGA/GTEx data from 33 cancer types with spatial/single-cell transcriptomics and 10 HCC cohorts. Functional validation employed Huh7 cell models with EOGT modulation, RNA sequencing, and ceRNA network construction. Drug sensitivity analysis leveraged GDSC/CTRP/PRISM databases, while immune microenvironment assessment utilized ESTIMATE/TIMER algorithms. Results: EOGT showed cancer-specific dysregulation, marked by significant upregulation in HCC correlating with advanced stages and poor survival. Pan-cancer analysis revealed EOGT’s association with genomic instability, tumor stemness, and angiogenesis. Experimental validation demonstrated EOGT’s promotion of HCC proliferation and migration. A novel exosomal circ_0058189/miR-130a-3p/EOGT axis was identified, showing that circ_0058189 was upregulated in HCC tissues, plasma samples and exosomes of sorafenib-resistant cells. Conclusion: This study establishes EOGT as a pan-cancer angiogenesis biomarker, while elucidating its role in therapeutic resistance via exosomal circRNA-mediated regulation, providing mechanistic insights for targeted intervention strategies.
1. Introduction
O-GlcNAcylation, a dynamic post-translational modification characterized by the attachment of β-N-acetylglucosamine to serine/threonine residues of nuclear and cytoplasmic proteins, has emerged as a key regulator in cancer pathogenesis [1]. Recent studies have elucidated the functional consequences of this modification in various malignancies. In hepatocellular carcinoma (HCC), glucose-induced O-GlcNAcylation at Thr241 of YAP has been shown to modulate its transcriptional activity, promoting oncogenic transformation through enhanced protein stability and functionality [2]. Similarly, in colorectal cancer models, YY1 modification at Thr236 has been demonstrated to regulate downstream targets, including SLC22A15 and AANAT, establishing a molecular link between O-GlcNAcylation and tumor progression [3]. Pancreatic cancer studies have further revealed a metabolic connection where elevated folate metabolism drives increased UDP-GlcNAc production, subsequently enhancing cMYC modification and PD-L1 expression, thereby facilitating immune escape mechanisms [4].
While O-GlcNAc transferase (OGT) and O-GlcNAcase (OGA) are widely recognized as the primary enzymes regulating this modification cycle [5,6,7], emerging evidence suggests additional players in this process. Notably, EGF domain-specific O-GlcNAc transferase (EOGT) has been identified as a specialized enzyme mediating the O-GlcNAcylation of extracellular and membrane-associated proteins containing EGF-like repeats [8]. The biological significance of EOGT in cancer remains incompletely understood, though recent discoveries have begun to shed light on its potential roles. Intriguingly, EOGT has been identified as a biomarker of migrasomes—novel cellular structures implicated in intercellular communication through the transport of bioactive molecules, potentially influencing tumor cell motility and vascularization processes [9,10].
Molecular interactions involving EOGT are gaining attention in cancer research. In pancreatic cancer models, EOGT has been shown to form a complex with SHCBP1, leading to enhanced NOTCH1 modification and subsequent tumor progression [11]. Our initial investigations have further revealed a correlation between EOGT expression patterns and immune cell infiltration in HCC, suggesting its potential utility as a clinical prognostic indicator [12]. These collective findings underscore the need for deeper exploration of EOGT-mediated O-GlcNAcylation in cancer biology, particularly its role in tumor microenvironment regulation and therapeutic resistance mechanisms.
Although existing evidence suggests a possible regulatory role of EOGT across multiple malignancies, comprehensive investigations exploring its pan-cancer functions remain notably absent in current scientific literature. The predominant focus on individual cancer types in most studies may lead to an incomplete understanding of this target gene’s mechanistic significance, primarily due to the absence of a holistic analytical framework. This knowledge gap underscores the critical necessity for the systematic evaluation of EOGT expression patterns and their functional implications across diverse cancer subtypes, which would provide valuable insights for guiding subsequent translational research and therapeutic development.
In this investigation, we implemented a comprehensive poly-omics approach to elucidate EOGT’s pan-cancer implications through the systematic integration of multi-dimensional datasets encompassing diverse malignancies and corresponding normal tissues. Our pan-cancer analysis framework specifically focused on the following aspects: the expression patterns of EOGT and their clinical significance, the association between EOGT and genomic variations/genomic instability, the functional regulatory mechanisms of EOGT in DNA repair, tumor stemness, epigenetic regulation, alternative splicing, the signaling pathways mediated by EOGT, the interactions between EOGT and the tumor immune microenvironment, and the drug sensitivity analysis of EOGT. Through initially rigorous validation employing cellular models, we demonstrated EOGT’s functional impact on HCC progression. Furthermore, our results preliminarily revealed a potential new mechanism that exosome-derived circ_0058189 may be involved in HCC progression and sorafenib resistance through the miR-130a/EOGT axis.
2. Materials and Methods
2.1. Pan-Cancer Data Collection and Processing
EOGT expression data and clinical features from The Cancer Genome Atlas (TCGA) and Genotype-Tissue Expression (GTEx) databases were accessed via the University of California Santa Cruz (UCSC) Xena platform [13]. All 36 TCGA pan-cancer cohort abbreviations and their corresponding sample sizes are comprehensively listed in Table S1. Although the sample sizes for certain cancer types and their corresponding controls in the TCGA pan-cancer analysis were relatively limited, we integrated healthy tissue samples from the GTEx database for subsequent pan-cancer analyses. Ten HCC transcriptome datasets, including GSE102079, GSE102083, GSE121248, GSE136247, GSE45267, GSE45436, GSE62232, GSE64041, GSE76297, and GSE84005, were obtained from Gene Expression Omnibus (GEO), employing a multi-cohort strategy to mitigate potential biases inherent in single-study analyses. EOGT expression profiles across cancer cell lines were analyzed using Cancer Cell Line Encyclopedia (CCLE) [14], while Simple Nucleotide Variation (SNV) and methylation data were sourced from cBioPortal [15]. To ensure data robustness, inclusion criteria focused on 33 cancer types with matched normal tissues from these resources, prioritizing HCC datasets and EOGT-related functional pathways. Low-quality samples, non-cancer studies, and redundant entries were systematically excluded. Transcriptome data were normalized using log2 (Transcripts Per Million (TPM) + 1). EOGT protein sequences were retrieved from the National Center for Biotechnology Information (NCBI).
2.2. Pan-Cancer Analyses of Differential EOGT Expression
EOGT mRNA expression in tumors versus normal tissues across 33 cancers was compared using integrated TCGA and GTEx data. Differential expression was analyzed using R’s ggplot2 package. Protein-level differences were assessed via UALCAN [16], and expression variations by gender, stage, grade, and TNM classification were visualized.
2.3. Diagnostic and Prognostic Evaluation
Clinical data, including overall survival (OS), disease-specific survival (DSS), progression-free interval (PFI), and disease-free interval (DFI), were extracted from the TCGA and GTEx databases. OS was defined as the time from diagnosis to death from any cause, DSS as the time from diagnosis to death specifically from the disease, PFI as the time from diagnosis to disease progression or recurrence, and DFI as the time from the end of treatment to disease recurrence. Patients with incomplete or missing data were excluded from the analysis. Data normalization was performed using log2 transformation.
ROC curves were generated using the pROC package in R, with patients stratified by EOGT expression cutoffs determined by the Youden index. Kaplan–Meier survival curves were plotted to compare survival outcomes between high and low EOGT expression groups, and log-rank tests were used to assess statistical significance. Univariate Cox regression analysis was performed to evaluate the prognostic value of EOGT for OS, DSS, PFI, and DFI, with hazard ratios (HRs) and 95% confidence intervals (CIs) reported.
2.4. Genomic Alteration and Mutational Burden
cBioPortal’s Cancer Type Summary module [17] analyzed EOGT mutations, amplifications, and deletions. TCGA SNV data processed by MuTect2 [18] were integrated, and EOGT domain mutations were identified using R’s maftools [19]. Correlations between EOGT expression and tumor mutational burden (TMB), microsatellite instability (MSI), homologous recombination deficiency (HRD), neoantigens, tumor ploidy/aneuploidy, and silent mutation rate/nonsilent mutation rate were evaluated using Spearman’s correlation.
2.5. DNA Repair, Stemness, and Epigenetic Analysis
EOGT’s relationship with mismatch repair (MMR) [20] and homologous recombination repair (HRR) genes [21] was assessed using Gene Expression Profiling Interactive Analysis 2 (GEPIA2) [22]. Tumor stemness was evaluated via the differentially methylated probes-based stemness index (DMPsi) [23], and epigenetic modifications were analyzed for DNMTs [24] and RNA modification genes (N1-methyladenosine: m1A, 5-methylcytosine: m5C, N6-methyladenosine: m6A) [25]. EOGT methylation’s impact on survival was analyzed using cBioPortal data and R’s Survival package, and significance was set at p < 0.05.
2.6. Alternative Splicing Analysis
Clinically relevant EOGT alternative splicing (AS) events were identified using OncoSplicing’s ClinicalAS tool [26]. Percent spliced-in (PSI) values from SpliceSeq and SplAdder projects were compared between tumors and normal tissues using Student’s t-test or the Mann–Whitney U-test, with AS events in ≥3 cancers highlighted.
2.7. Protein Interaction and Functional Enrichment
EOGT’s protein interaction network was constructed using Search Tool for the Retrieval of Interacting Genes/Proteins (STRING) [27]. Reverse Phase Protein Array (RPPA) data from The Cancer Proteome Atlas (TCPA) assessed EOGT’s correlation with 10 cancer pathways [28]. Differential expression analysis (limma) and GSEA (ClusterProfiler) [29] identified enriched pathways visualized via bubble plots. Significant pathways were identified based on p < 0.05 and a false discovery rate (FDR) < 0.1.
2.8. Immune Response Analysis
ESTIMATE scores [30] quantified immune and stromal cell proportions in 33 cancers. EOGT expression differences across six immune subtypes (C1–C6) [31] were evaluated using TISIDB. Spearman’s correlation coefficients were calculated to assess the relationship between immune-related genes and checkpoint markers [32]. TISMO assessed EOGT expression changes post-cytokine and anti-PD-1 treatment [33]. Immune cell infiltration was quantified using EPIC, MCPcounter, CIBERSORT, and Xcell [34,35,36] and validated via TIMER2.0 [37]. Spatial and single-cell transcriptomic data (TISCH [19], CancerSEA [38]) further explored EOGT’s role in immune modulation.
2.9. Chemotherapeutic Drug Screening
EOGT’s association with drug sensitivity was explored using Cancer Therapeutics Response Portal (CTRP), Genomics of Drug Sensitivity in Cancer (GDSC), and Project on Precision Oncology for Every Nation (PRISM) databases. Samples were stratified by median EOGT expression, and drug sensitivity (AUC, IC50) was compared. Spearman correlations identified the top 30 drugs linked to EOGT expression, and the results were consolidated into a bubble heatmap for visualization. Connectivity Map (CMap) [39] identified potential EOGT inhibitors by matching gene signatures, with results summarized and visualized.
2.10. Cell Line, Lentivirus Infection, and Transfection of miRNA Mimics
The original cell line was obtained from the Cell Resource Center of the Chinese Academy of Medical Sciences (CAMS). Hepatoma cell line Huh7 was cultured with Dulbecco’s modified Eagle’s medium, High Glucose (EallBio, Beijing, China) containing 10% fetal bovine serum (FBS, ExCell Bio, Suzhou, China), 100 U/mL penicillin, and 100 μg/mL streptomycin. Cells were cultured in 5% CO2 and 37 °C conditions.
To induce EOGT overexpression in hepatoma cells, a lentiviral vector system was utilized, specifically the pCDH-CMV-MCS-EF1-CopGFP-T2A-Puro construct (TranSheepBio, Shanghai, China). Huh7 cells, a hepatoma cell line, were seeded into six-well plates and maintained in DMEM supplemented with 10% FBS and 1% penicillin/streptomycin. When cell confluence reached 30–40%, lentiviral particles carrying the EOGT gene (NM_001278689.1) were introduced at a multiplicity of infection (MOI) of 20. Following a 72 h incubation, puromycin selection was initiated at 2 µg/mL and maintained for 3–7 days, with the culture medium refreshed every 1–2 days to ensure optimal cell growth and selection efficiency. For EOGT knockdown experiments, hepatoma cells were transduced with lentiviral plasmids (LV3-H1/GFP&Puro, GenePharma, Suzhou, China) designed to express EOGT-specific short hairpin RNA (shRNA) or a control shRNA. The shRNA target sequence used was GCGAACCTCTGTATAACTATG (5′ to 3′). Incubation and screening processes were performed as before.
Transfections of miRNA mimics were performed using Lipofectamine 3000 (Thermo Fisher Scientific, Waltham, MA, USA) in Opti-MEM medium (Thermo Fisher Scientific, Waltham, MA, USA). All the miRNA mimics were purchased from GenePharma (Suzhou, China), and the sequence information of the miRNA mimics used for transient transfection is shown in Table S2.
2.11. Western Blot Analysis
Radioimmunoprecipitation Assay (RIPA, Beyotime, Nanjing, China) buffer was used to extract total protein lysates from cells or tissues. The protein lysates were subjected to SDS-PAGE and then transferred to a nitrocellulose membrane. The membrane was blocked with 5% non-fat milk for 1 h and incubated with the first antibody for >12 h at 4 °C. After incubation with the secondary antibody for 1 h at 37 °C, the membrane was visualized by ECL Western Blotting Substrate from Thermo Fisher Scientific (Cleveland, OH, USA). All the antibodies are listed in Supplementary Table S3.
2.12. RNA-Seq and Bioinformatic Analysis
Total RNA was isolated from two distinct groups of Huh7 cells: those overexpressing EOGT (n = 3) and those with EOGT knockdown (n = 3). Subsequently, RNA-seq analysis was performed on the isolated RNA by Gene-Denovo (Guangzhou, China). Data analysis was carried out utilizing the online platform OmicShare, along with Sangerbox [40] and STRING [41]. Additional bioinformatics resources that were employed comprised the GEPIA2 [22], Biomarker Exploration for Solid Tumors (BEST) [42], the Integrative HCC Gene Analysis (IHGA) [43], and the UALCAN database [16]. The spatial transcriptome data came from the study of Liu et al. [44].
2.13. ceRNA Network Construction and Validation
To construct the EOGT-centered ceRNA network, candidate miRNAs targeting EOGT were screened using mirDIP (score class: High; top 5% ranking; Integrated Score > 0.7) and miRwalk (stringency score = 1; Targetscan, Mirdb, Mirtarbase databases), followed by intersection with downregulated miRNAs (log2FC ≥ 1, adjusted p < 0.01) identified from the CancerMIRNome database. The prognostic validation of miRNAs was performed using the dbDEMC database and survival analysis of HCC patient data. Exosomal circRNAs were analyzed using the GEO dataset GSE101850 (sorafenib-resistant vs. sensitive HepG2 cells; p <0.05), and circRNA-miRNA interactions were predicted via circMINE. Functional validation included Western blotting for miRNA-mediated EOGT regulation. The external validation of circRNAs utilized GEO datasets GSE166678 (HCC plasma) and GSE97332 (HCC tissues), with host gene expression and survival analysis conducted using TCGA data. Binding interactions were confirmed via Targetscan (miRNA-EOGT) and circBase (circRNA-miRNA).
2.14. Statistical Analysis
All analyses and graphs were generated with R_4.2.1 and GraphPad Prism 8. Statistical significance was assessed by comparing mean values (±SD) using a Student’s t-test for independent groups when the assumptions of normality (Kolmogorov–Smirnov test) and homogeneity of variance (Bartlett’s test) were met. For datasets that violated these assumptions, Welch’s t-test or the Mann–Whitney U-test was used. Significance was expressed for * p < 0.05; ** p < 0.01; *** p < 0.001; **** p < 0.0001.
Survival comparisons were performed using the Kaplan–Meier method, and statistical significance was assessed using the log-rank test. Univariate Cox regression analysis was conducted to evaluate the prognostic value of EOGT expression, with hazard ratios (HRs) and 95% confidence intervals (CIs) reported. For correlation analyses, Spearman’s rank correlation coefficient was used to assess the relationship between variables.
3. Results
3.1. Pan-Cancer Landscape of EOGT Expression and Clinical Relevance
A systematic pan-cancer analysis of EOGT mRNA expression was conducted using TCGA and GTEx databases, revealing differential expression across 33 cancer types (Figure 1A). Notably, EOGT was significantly upregulated in CHOL, COAD, GBM, HNSC, KIRC, LIHC, PCPG, STAD, and THCA (p < 0.05, Student’s t-test), while downregulated in BLCA, BRCA, CESC, KICH, LUAD, LUSC, PRAD, and UCEC compared to normal tissues (p < 0.05). In 10 HCC transcriptome datasets, EOGT expression was significantly higher in HCC tissues compared to adjacent normal or healthy tissues (Figure 1B). Notably, analysis of GSE109211 data from the BEST database demonstrated significant upregulation of EOGT in tumor tissue samples from sorafenib non-responders (Figure 1C). Relative EOGT expression levels across various cell lines obtained from CCLE are shown in Figure S1A. UALCAN data indicated upregulated EOGT protein levels in KIRC, PAAD, HNSC, GBM, and LIHC, while downregulation was observed in OV, UCEC, and LUAD, consistent with transcriptomic findings (Figure 1D). We further evaluated EOGT expression across 33 tumor types, stratifying the analysis by gender, clinical stage, tumor grade, and TNM classification (Figure S1B). Notably, EOGT expression showed a significant positive correlation with advanced tumor grades in HNSC, STAD, GBMLGG, and LGG, suggesting its potential role in promoting tumor progression. Additionally, in tumors such as KIPAN, SKCM, and ACC, EOGT expression was positively associated with distant metastasis, further supporting its involvement in aggressive cancer phenotypes. In our focused analysis of HCC, EOGT expression exhibited a strong positive correlation with both clinical stage and tumor grade. Statistically significant differences were observed in comparisons between grade 1 vs. 2 (p = 2.01 × 10⁻²), grade 1 vs. 3 (p = 4.41 × 10⁻⁴), and stage 1 vs. 3 (p = 1.45 × 10⁻²). These findings highlight EOGT as a potential biomarker for HCC progression and aggressiveness.
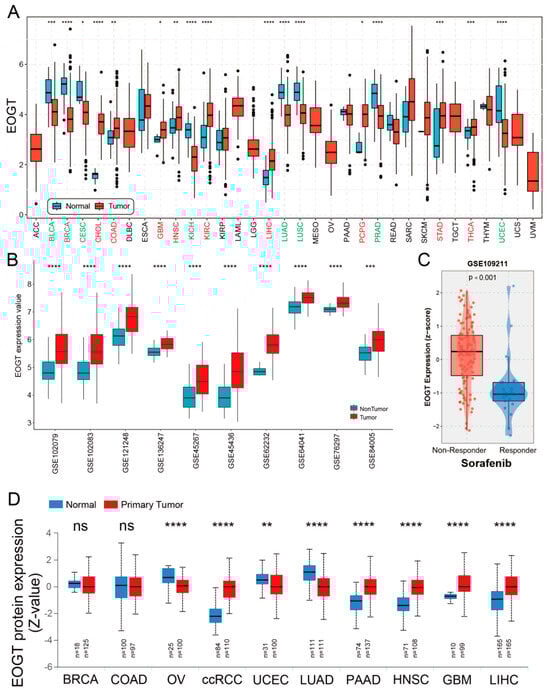
Figure 1.
Pan-cancer analysis of EOGT expression. (A) Systematic pan-cancer analysis of EOGT mRNA expression using TCGA and GTEx databases showing differential expression across over 30 cancer types. (B) EOGT expression in 10 HCC transcriptome datasets, indicating significantly higher expression in HCC tissues compared to adjacent normal or healthy tissues. (C) Significant upregulation of EOGT in tumor tissue samples from sorafenib non-responders. (D) UALCAN data presenting protein-level differences in EOGT in various cancers. Upregulated EOGT protein levels were observed in KIRC, PAAD, HNSC, GBM, and LIHC, while downregulation was seen in OV, UCEC, and LUAD, which is consistent with transcriptomic findings. ccRCC, clear cell renal cell carcinoma; full terminology for abbreviations is provided in Table S1; * p < 0.05, ** p < 0.01, *** p < 0.001, **** p < 0.0001, ns, not significant.
3.2. Diagnostic and Prognostic Value of EOGT in Pan-Cancers
Clinically, EOGT served as a robust prognostic marker. ROC curve analysis revealed EOGT’s potential as a diagnostic biomarker across multiple cancer types, with area under the curve (AUC) values exceeding 0.8 in over 11 malignancies. Notably, in LIHC, EOGT demonstrated high diagnostic accuracy (AUC = 0.844) (Figure S2). Univariate Cox regression analysis revealed that high EOGT expression was associated with poorer OS in GBMLGG, LGG, KIPAN, ACC, LAML, and LIHC (log-rank test, p < 0.05) while acting as a protective factor in SKCM (p < 0.05, Figure 2A). Similarly, EOGT was a risk factor for worse DSS in GBMLGG, LGG, KIPAN, ACC, and LIHC but protective in SKCM (p < 0.05, Figure 2B). For DFI, EOGT was a risk factor in PAAD and LIHC (p < 0.05, Figure 2C), while for PFI, it was a risk factor in GBMLGG, LGG, KIPAN, ACC, LIHC, SKCM, and KICH but protective in UCEC (p < 0.05, Figure 2D). Kaplan–Meier curves further validated these findings (Figure S3), indicating that high EOGT expression generally correlates with poor prognosis in LGG, KIPAN, ACC, LAML, and LIHC, with LIHC consistently identified as a high-risk cancer across all survival metrics (log-rank test, p < 0.05).
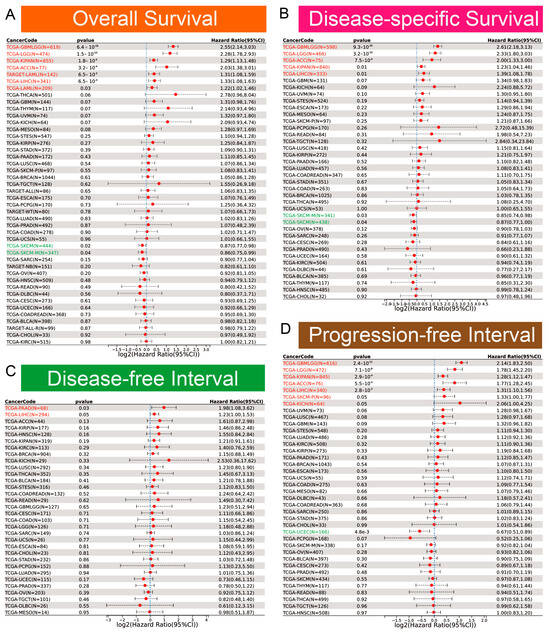
Figure 2.
Diagnostic and prognostic value of EOGT in multiple cancers. (A–D): Univariate Cox regression analysis demonstrating the association between high EOGT expression and overall survival (OS), disease-specific survival (DSS), disease-free interval (DFI), and progression-free interval (PFI). Full terminology for abbreviations is provided in Table S1.
3.3. Genomic Alterations and Instability of EOGT
Pan-cancer analysis of EOGT copy number variations (CNVs) and SNVs using cBioPortal and GDC databases revealed gene amplifications in bladder cancer, melanoma, head and neck cancer, esophageal cancer, diffuse large B-cell lymphoma, hepatobiliary tumors, prostate cancer, and germ cell tumors, while deep deletions were common in non-small cell lung cancer, breast cancer, bone tumors, and pancreatic cancer. High SNV rates were observed in endometrial, intestinal, and breast cancers (Figure 3A,B). Survival analysis showed significantly lower survival rates in patients with EOGT mutations (p < 0.01, Figure 3C).

Figure 3.
Genomic alterations and instability of EOGT. (A,B) Pan-cancer analysis of EOGT copy number variations (CNVs) and single-nucleotide variations (SNVs) using cBioPortal and GDC databases. (C) Survival analysis showing significantly lower survival rates in patients with EOGT mutations (p < 0.01). (D) Correlations between EOGT expression and tumor mutational burden (TMB). (E) Correlations between EOGT expression and microsatellite instability (MSI). (F) Correlations between EOGT expression and homologous recombination deficiency (HRD). (G) Correlations between EOGT expression and single-nucleotide variant (SNV) neoantigens. (H,I) Analyses of correlations between EOGT expression and tumor ploidy and aneuploidy. (J) Correlations between EOGT expression and non-silent mutation rates. (K) Correlations between EOGT expression and silent mutation rates. Full terminology for abbreviations is provided in Table S1; * p < 0.05, ** p < 0.01, *** p < 0.001, **** p < 0.0001.
Correlations between EOGT expression and genomic instability markers, including TMB, MSI, HRD, SNV neoantigens, tumor ploidy, aneuploidy, and mutation rates, were evaluated [45,46]. Positive correlations with TMB were observed in ACC, COAD, READ, SKCM, and UCEC, while negative correlations were noted in BLCA and LUAD (Figure 3D). EOGT positively correlated with MSI in LGG but negatively in DLBC, KIPAN, GBMLGG, PRAD, and HNSC (Figure 3E). Positive correlations with HRD were found in ACC and THYM, while negative correlations were observed in BLCA, CESC, GBM, HNSC, LAML, LUAD, LUSC, PRAD, SKCM, STAD, TGCT, and UCEC (Figure 3F). EOGT also showed positive correlations with SNV neoantigens in ACC, KIRC, LGG, and OV but negative correlations in BLCA, CESC, HNSC, LIHC, LUAD, LUSC, PAAD, PRAD, SARC, and STAD (Figure 3G). Tumor ploidy analyses revealed positive correlations in ACC, KIRC, and LAML but negative correlations in BLCA, BRCA, HNSC, LUAD, SARC, STAD, and UCEC (Figure 3H). Tumor aneuploidy analyses revealed positive correlations in THYM and LGG but negative correlations in BLCA, HNSC, KIRC, LUAD, PAAD, PRAD, STAD, TGCT, UCEC, and UCS (Figure 3I). EOGT positively correlated with nonsilent mutation rates in ACC, LGG, OV, and THYM but negatively in BLCA, CESC, HNSC, LIHC, LUAD, LUSC, PAAD, PRAD, and STAD (Figure 3J). Similarly, positive correlations with silent mutation rates were observed in ACC, LGG, OV, THYM, and UCS, while negative correlations were noted in BLCA, HNSC, LIHC, LUAD, LUSC, PAAD, PRAD, and STAD (Figure 3K). These findings suggest a significant association between EOGT and genomic instability, highlighting its potential as a target for immunotherapy.
3.4. EOGT Expression and DNA Repair, Stemness, and Epigenetic Modifications
EOGT expression was positively correlated with MMR and HRR genes in most cancers, except GBM, MESO, THYM, and UCS, with particularly strong correlations in KICH, KIRP, LIHC, READ, THCA, and UVM (Figure 4A). Positive correlations with HRR gene signatures were also observed in 28 cancers, including ACC, LIHC, SKCM, and THCA (Figure 4D). Additionally, EOGT positively correlated with tumor stemness in KIRP, LGG, and GBMLGG (Figure 4B), suggesting its role in regulating DNA damage repair and cancer progression.

Figure 4.
EOGT expression and DNA repair, stemness, and epigenetic modifications. (A) Correlations between EOGT expression and mismatch repair (MMR) and homologous recombination repair (HRR) genes. (B) Correlations between EOGT and tumor stemness. (C) Correlations between EOGT and DNA methyltransferases (DNMTs). (D) Positive correlations with HRR gene signatures in 28 cancers. (E) Significant correlations between EOGT and RNA modification genes. Full terminology for abbreviations is provided in Table S1, * p < 0.05, ** p < 0.01, *** p < 0.001, **** p < 0.0001.
Epigenetic analysis revealed significant positive correlations between EOGT and DNMTs in ACC, DLBC, KICH, KIRP, LGG, LIHC, OV, PAAD, THCA, and UVM (Figure 4C). EOGT expression was inversely correlated with promoter methylation in 30 cancer types (Figure S4), and reduced methylation predicted shorter survival in LGG and THYM (Figure S5). EOGT also showed significant correlations with RNA modification genes (Figure 4E), indicating its potential role in DNA methylation and mRNA regulation.
3.5. EOGT Alternative Splicing and Survival Outcomes
Fifteen clinically relevant EOGT alternative splicing (AS) events were identified using OncoSplicing (Table S4). The EOGT_intron_retention_100969 event, present in ≥3 cancer types, showed higher PSI values in BLCA, COAD, KICH, KIRP, LUAD, LUSC, READ, and STAD compared to normal tissues, prognostic analysis based on the optimal PSI cut-off value revealed significant differences in OS and PFI across multiple tumor types (Figure 5A,B). These findings suggest that EOGT AS events may significantly impact cancer progression.
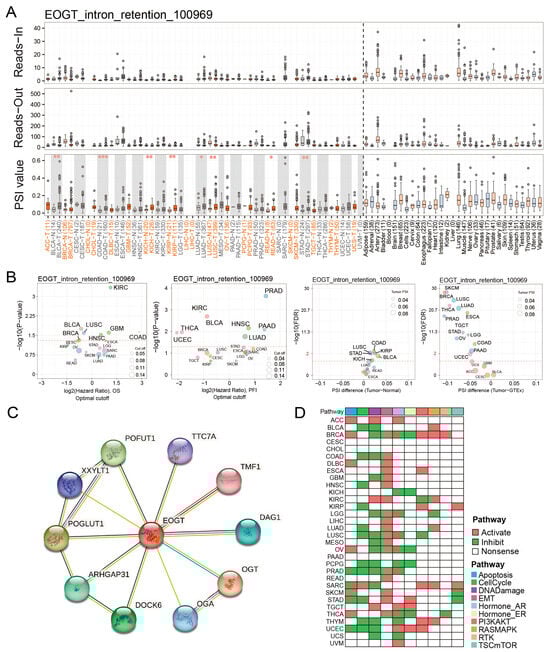
Figure 5.
EOGT alternative splicing and survival outcomes. (A,B) Fifteen clinically relevant EOGT alternative splicing (AS) events were identified using OncoSplicing. The EOGT_intron_retention_100969 event, present in ≥3 cancer types, showed higher percent spliced-in (PSI) values in BLCA, COAD, KICH, KIRP, LUAD, LUSC, READ, and STAD compared to normal tissues, and optimal PSI cut-off-based analysis showed significant OS and PFI differences across tumors, the red dashed line denotes the p-value threshold (p = 0.05). (C) STRING analysis identifying 10 potential EOGT-interacting proteins. (D) Pathway enrichment analysis using TCPA data, revealing that high EOGT expression was associated with activated epithelial-to-mesenchymal transition (EMT) and suppressed DNA damage response pathways. Full terminology for abbreviations is provided in Table S1; * p < 0.05, ** p < 0.01, *** p < 0.001.
3.6. EOGT Promotes Cancer via EMT and DNA Damage Suppression
STRING analysis identified 10 potential EOGT-interacting proteins, indicating unexplored mechanisms (Figure 5C). Pathway enrichment analysis using TCPA data revealed that high EOGT expression was associated with activated EMT and suppressed DNA damage response pathways (Figure 5D). GSEA further linked high EOGT expression to the activation of pro-cancer pathways, including EMT, angiogenesis, inflammatory response, and TNFα signaling via NFκB, while suppressing oxidative phosphorylation (Figure S6), suggesting EOGT’s involvement in multiple oncogenic pathways.
3.7. EOGT and Immune Cell Infiltration in Tumors
To elucidate the role of EOGT in the tumor immune microenvironment (TIME), we employed the ESTIMATE algorithm to assess its association with immunological characteristics across 33 cancer types. Strikingly, EOGT expression showed a significant positive correlation with ESTIMATE scores in 19 cancer types, underscoring its potential involvement in immune modulation. Conversely, negative correlations were observed in SARC and THYM (Figure 6A). Scatter plots highlighting the strongest correlations in the top six cancer types further illustrate these relationships (Figure S7A).

Figure 6.
EOGT and immune cell infiltration in tumors. (A) The ESTIMATE algorithm was used to evaluate the association between EOGT and immunological characteristics across 33 cancer types. A significant positive correlation between ESTIMATE scores and EOGT expression levels was observed in 19 cancer types. (B) Analysis using the TISIDB database showing significant differences in EOGT expression across immunological subtypes in 16 cancer types. EOGT exhibited upregulation in the C6 immunological subtype of BRCA, COAD, HNSC, KIRC, LUAD, LUSC, STAD, and THCA, suggesting a potential functional relationship with TGF-β signaling activity. (C) TIMER2.0 analysis showing that EOGT expression positively correlated with endothelial cell abundance in multiple cancers. (D) TISCH single-cell data confirmed EOGT upregulation in endothelial and malignant cells, highlighted by red boxes across pan-cancer datasets. (E–H) Spatial transcriptomics revealing overlapping EOGT expression patterns with tumor cells in LIHC. Full terminology for abbreviations is provided in Table S1; * p < 0.05, ** p < 0.01, *** p < 0.001, **** p < 0.0001.
Building on these findings, we leveraged the TISIDB database to investigate EOGT expression across immunological subtypes. Significant differences were identified in 16 cancer types, with EOGT particularly upregulated in the C6 immunological subtype of BRCA, COAD, HNSC, KIRC, LUAD, LUSC, STAD, and THCA (Figure 6B). This upregulation suggests a potential functional link between EOGT and TGF-β signaling activity, a pathway known to play a critical role in immune evasion and tumor progression (Figure S7B).
To further explore EOGT’s role in immune regulation, we conducted a pan-cancer analysis of its correlations with immune-related genes (Figure S8). Additionally, using the TISMO database, we compared EOGT expression in samples before and after treatment with immune checkpoint inhibitors (ICIs) in vivo (Figure S9A) and in tumor cell lines treated with cytokines in vitro (Figure S9B). Notably, EOGT expression was upregulated in the TNFα-treated mouse breast cancer cell line 4T1. The effects of IFNβ and IFNγ on EOGT expression varied across cell lines, with IFNγ generally inducing upregulation and IFNβ more frequently causing downregulation. In ICI-treated samples, EOGT expression levels were significantly reduced in responder groups in some datasets, while no significant changes were observed in non-responder groups across all datasets.
Collectively, these findings reveal the complex and multifaceted relationship between EOGT expression and immune cell infiltration. EOGT’s modulation by cytokines and its differential expression in response to ICIs highlight its potential as a key player in tumor immunology. These insights pave the way for future investigations into EOGT as a biomarker for immune response and a therapeutic target in cancer immunotherapy.
3.8. EOGT as a Biomarker for Tumor Angiogenesis
To better understand the association between EOGT expression and cancer-related immune activity, we assessed the correlation between EOGT expression and the infiltration of various immune cell types (Figure S10). The TIMER2.0 analysis shows that EOGT expression positively correlated with endothelial cell abundance in multiple cancers (Figure 6C). Single-cell transcriptomic data from TISCH confirmed EOGT upregulation in endothelial and malignant cells (Figure 6D). Spatial transcriptomics revealed overlapping EOGT expression patterns with tumor cells in LIHC (Figure 6E–H), SKCM, and GBM (Figure S11A–H), suggesting its promotional role in tumors. CancerSEA analysis linked EOGT to angiogenesis, cell differentiation, EMT, inflammation, metastasis, and stemness while showing weak or negative correlations with cell cycle, DNA repair, and DNA damage (Figure S11I,J).
3.9. EOGT and Chemotherapy Sensitivity
Through a comprehensive analysis of the GDSC1/2, CTRP, and PRISM databases, we identified a significant association between high EOGT expression and resistance to multiple chemotherapeutic agents. Drug sensitivity was evaluated using two key metrics: IC50 (half-maximal inhibitory concentration; higher IC50 indicates stronger resistance) and AUC (area under the concentration-effect curve; higher AUC suggests greater drug sensitivity). In GDSC1/2, IC50 was used, while CTRP and PRISM employed AUC. As illustrated in Figure S12A, EOGT shows a clear correlation with resistance to various drugs, particularly tyrosine kinase inhibitors (TKIs). For example, Afatinib demonstrated correlations of 0.246 (p = 1.65 × 10⁻¹⁰) in CTRP and 0.215 (p = 2.40 × 10⁻⁶) in PRISM. Similarly, Lapatinib exhibited correlations of 0.277 (p = 4.49 × 10⁻¹³) in CTRP, −0.333 (p < 0.001) in GDSC1, and 0.215 (p = 2.32 × 10⁻⁶) in PRISM. Gefitinib showed correlations of 0.120 (p = 0.00203) in CTRP and 0.183 (p = 6.39 × 10⁻⁵) in PRISM, while Selumetinib displayed correlations of −0.179 (p = 2.80 × 10⁻⁷) in GDSC1 and −0.226 (p = 3.16 × 10⁻⁹) in GDSC2.
To identify potential EOGT inhibitors, we utilized the Connectivity Map (CMap) database, which compares disease-associated gene expression profiles with drug-induced gene expression changes using pattern-matching algorithms. The core hypothesis is that if a drug-induced expression profile reverses the disease-associated expression pattern, the drug may have therapeutic potential. In the context of EOGT, negative correlation scores indicate that the drug may inhibit EOGT-related pro-tumorigenic pathways, with lower scores suggesting stronger inhibition. As shown in the heatmap of Figure S12B, we integrated the three lowest-scoring (i.e., most inhibitory) drugs for each cancer type. Statistical analysis revealed that arachidonyltrifluoromethane and W.13 each appeared nine times (across nine cancer types, including ACC, BRCA, and KICH), while MK-886 and X4.5.dianilinophthalimide each appeared eight times (involving eight cancer types, such as BLCA, GBM, and MESO). The significant enrichment of these four drugs across multiple cancer types suggests their potential to target EOGT or its synergistic pathways, providing promising candidates for the development of EOGT-targeted therapies.
3.10. EOGT Facilitates HCC Cell Proliferation and Migration
To investigate the role of EOGT in cellular behavior, the stable knockdown and overexpression of EOGT were achieved in the Huh7 cell line (Figure 7A–D). The CCK8 assay demonstrated that Huh7-OE#EOGT and Huh7-SH#EOGT cells exhibited elevated and reduced proliferation compared to control cells, respectively (Figure 7E,F). Additionally, the wound healing assay indicated that overexpression of EOGT promotes cell migration, while the knockdown of EOGT was just the opposite (Figure 7G–J).
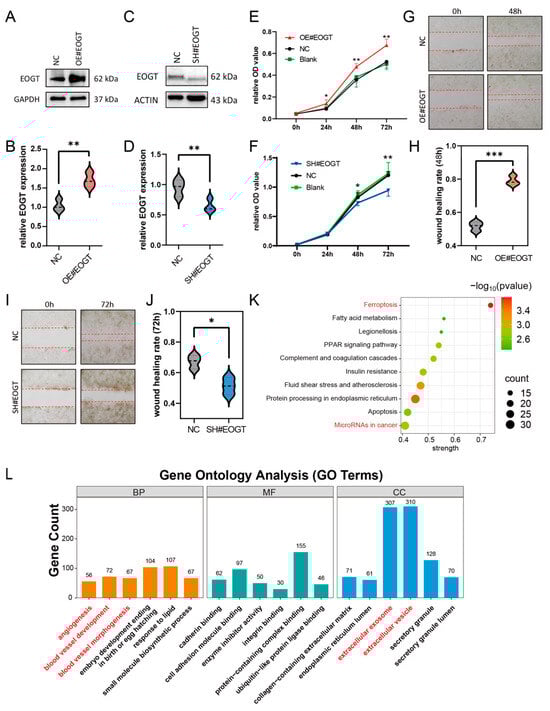
Figure 7.
EOGT facilitates HCC cell proliferation and migration. (A–D) Stable knockdown and overexpression of EOGT in the Huh7 cell line were achieved, as confirmed by Western blot analyses. (E,F) The CCK8 assay demonstrates that Huh7-OE#EOGT and Huh7-SH#EOGT cells exhibited elevated and reduced proliferation compared to control cells, respectively. (G–J) The wound healing assay indicates that overexpression of EOGT promoted cell migration, while knockdown of EOGT had the opposite effect. (K,L) KEGG pathway and gene ontology (GO) analysis of RNA-seq results from Huh7 cells with EOGT overexpression and knockdown, showing significant enrichment in several cancer-related pathways and biological processes, including microRNA regulation in cancer, angiogenesis, etc.; * p < 0.05, ** p < 0.01, *** p < 0.001.
To elucidate the functional consequences of EOGT modulation in HCC, we established isogenic Huh7 cell models with stable EOGT knockdown and overexpression, as confirmed by Western blot analyses (Figure 7A–D). Functional characterization revealed that EOGT expression levels significantly influenced cellular proliferation kinetics, with EOGT-overexpressing clones (Huh7-OE#EOGT) demonstrating enhanced growth potential, while EOGT-depleted cells (Huh7-SH#EOGT) showed attenuated proliferation rates in CCK-8 assays (Figure 7E,F). Furthermore, the quantitative assessment of cell motility through wound healing assays demonstrated a positive correlation between EOGT expression levels and migratory capacity, with EOGT-overexpressing cells displaying accelerated wound closure compared to their controls (Figure 7G–J).
To gain deeper insights into the molecular mechanisms underlying EOGT-mediated oncogenic effects, we performed transcriptomic profiling of EOGT-modulated Huh7 cells (n = 3 per group). Comparative RNA-seq analysis identified 1325 differentially expressed genes (DEGs) with significant expression changes (fold change ≥ 2, FDR < 0.01), comprising 426 upregulated and 879 downregulated transcripts associated with EOGT overexpression. Pathway enrichment analysis using the STRING database identified several EOGT-associated oncogenic pathways, particularly highlighting its involvement in cancer-related microRNA networks, vascular development processes (angiogenesis, blood vessel morphogenesis), and extracellular vesicle-mediated communication (Figure 7K,L). These findings collectively suggest that EOGT exerts multifaceted effects on HCC progression through the regulation of diverse oncogenic pathways.
3.11. EOGT-Mediated ceRNA Network in HCC Progression and Sorafenib Resistance
Given the pivotal role of EOGT in HCC progression and sorafenib resistance, combined with the significant enrichment of exosome-related pathways and microRNA functions in our GO and KEGG analyses, we constructed a competitive endogenous RNA (ceRNA) network centered on EOGT. This network explores potential exosomal circRNA/microRNA/EOGT regulatory axes that may drive HCC progression and therapeutic resistance.
To identify EOGT-targeting miRNAs, we performed integrated screening using mirDIP and miRwalk databases under stringent criteria. In mirDIP, we set the score class to High, selected the top 5% ranking miRNAs, and applied an Integrated Score threshold >0.7, yielding 20 candidate miRNAs (Table S5). For miRwalk, we used the maximum stringency (Score = 1) and analyzed three genomic regions (coding sequences, 3′-UTR, and 5′-UTR) using Targetscan, Mirdb, and Mirtarbase databases, which identified 67 additional miRNAs. The combined dataset from both databases comprised 79 unique miRNAs (Table S6).
Differential expression analysis using the CancerMIRNome database identified 109 downregulated miRNAs in HCC (log2FC = 1, adjusted p < 0.01). Intersection with our initial 79 miRNAs revealed six potential EOGT-targeting miRNAs: hsa-let-7c-5p, hsa-miR-122-5p, hsa-miR-130a-3p, hsa-miR-153-5p, hsa-miR-223-5p, and hsa-miR-542-5p (Figure 8A). To validate the robustness of their downregulation in HCC, we queried the dbDEMC database, which confirmed the downregulation of all except hsa-miR-153-5p, reducing our candidate list to five miRNAs (Table 1). Further analysis of the prognostic significance of these five miRNAs revealed that the high expression of hsa-let-7c-5p, hsa-miR-122-5p, and hsa-miR-130a-3p was significantly associated with improved OS in HCC patients (Figure 8B). These three miRNAs were, therefore, selected as the core components for constructing the ceRNA network.
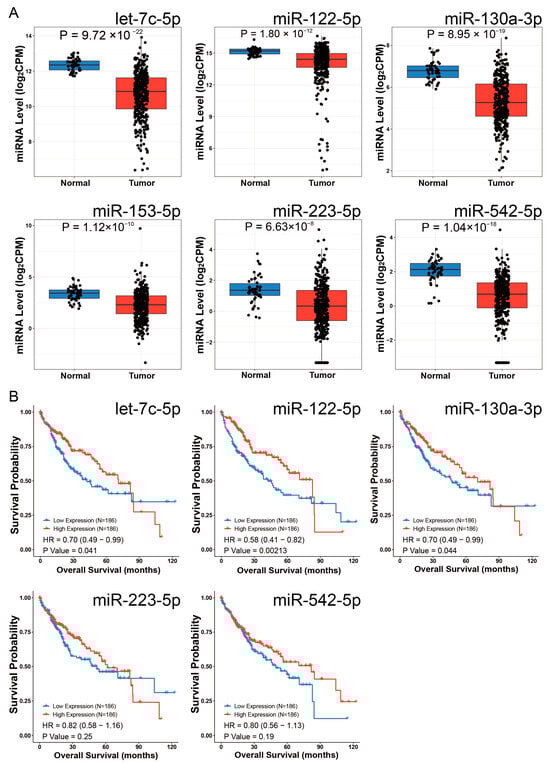
Figure 8.
Identification of potential EOGT-targeting miRNAs. (A) Differential expression analysis using the CancerMIRNome database identified 109 downregulated miRNAs in HCC. Intersection with the initial 79 miRNAs from mirDIP and miRwalk databases revealed six potential EOGT-targeting miRNAs: hsa-let-7c-5p, hsa-miR-122-5p, hsa-miR-130a-3p, hsa-miR-153-5p, hsa-miR-223-5p, and hsa-miR-542-5p. (B) Analysis of the prognostic significance of the five miRNAs (after excluding hsa-miR-153-5p) showing that high expression of hsa-let-7c-5p, hsa-miR-122-5p, and hsa-miR-130a-3p was significantly associated with improved OS in HCC patients.

Table 1.
The data from the dbDEMC database were utilized to further validate and obtain five miRNAs with more robust downregulated expression.
We then analyzed exosomal circRNAs from sorafenib-resistant HepG2 cells using dataset GSE101850. Comparing three sorafenib-resistant versus three sensitive samples (p < 0.05), we identified 131 upregulated circRNAs (Figure 9A, Table S7). Using circMINE’s circRNA-miRNA prediction function, we mapped interactions between the 131 circRNAs and our three key miRNAs (Table 2). This analysis enabled the construction of a preliminary circRNA/miRNA/EOGT network (Figure 9B).

Figure 9.
Potential critical role of circ_0058189/miR-130a/EOGT axis in HCC progression and sorafenib resistance. (A) Analysis of exosomal circRNAs from sorafenib-resistant HepG2 cells using dataset GSE101850, identifying 131 upregulated circRNAs. (B) Construction of a preliminary circRNA/miRNA/EOGT network using circMINE’s circRNA-miRNA prediction function to map interactions between the 131 circRNAs and the three key miRNAs (hsa-let-7c-5p, hsa-miR-122-5p, hsa-miR-130a-3p). (C) Western blot analysis showing that among the three key miRNAs, hsa-miR-130a-3p demonstrated the most significant regulatory effect on EOGT expression, establishing it as the central miRNA in the network. (D) External validation using GEO datasets GSE166678 and GSE97332, identifying hsa_circ_0058189 as consistently upregulated in both HCC tissues and plasma samples. (E) Bioinformatic analysis confirming molecular interactions within the axis: Targetscan identified a 7mer-m8 binding pattern between hsa-miR-130a-3p and EOGT, while circBase analysis revealed a non-canonical binding mode between hsa_circ_0058189 and hsa-miR-130a-3p. Red box represents the seed region, blue box represents the complementary region of EOGT, and green box represents the complementary region of circ_0058189. (F,G) Analysis of circ_0058189 host gene SMRACAL1 in the TCGA database reveals significant upregulation in HCC, correlating with poor overall survival. (H) A model where circ_0058189 functions as a molecular sponge for hsa-miR-130a-3p, leading to EOGT derepression and contributing to HCC progression and sorafenib resistance, red upward arrows indicate upregulated protein expression, pathway activation, or HCC progression; * p < 0.05, ** p < 0.01, ns, not significant.
Table 2.
Potential circRNAs screened from the circMINE database.
3.12. Potential Critical Role of circ_0058189/miR-130a/EOGT Axis in HCC Progression and Sorafenib Resistance
To validate the functional relevance of these interactions, we performed Western blot analysis to assess the interference efficiency of the three key miRNAs on EOGT expression. Among the three key miRNAs, hsa-miR-130a-3p demonstrated the most significant regulatory effect, establishing it as the central miRNA in our network (Figure 9C).
Further refinement of the network focused on circRNAs interacting with hsa-miR-130a-3p. External validation using GEO datasets GSE166678 (plasma samples from three HCC patients vs. three healthy controls) and GSE97332 (seven HCC tissues vs. seven adjacent normal tissues) identified hsa_circ_0058189 as consistently upregulated in both HCC tissues and plasma samples (Figure 9D). Analysis of its host gene SMRACAL1 in the TCGA database revealed significant upregulation in HCC, correlating with poor overall survival (Figure 9F,G) and suggesting SMRACAL1 overexpression as a potential driver of hsa_circ_0058189 upregulation in HCC.
Bioinformatic analysis confirmed molecular interactions within the axis: Targetscan identified a 7mer-m8 binding pattern between hsa-miR-130a-3p and EOGT, while circBase analysis revealed a non-canonical binding mode between hsa_circ_0058189 and hsa-miR-130a-3p (Figure 9E). These findings support a model where hsa_circ_0058189 functions as a molecular sponge for hsa-miR-130a-3p, leading to EOGT derepression and contributing to HCC progression and sorafenib resistance (Figure 9H).
This regulatory axis is particularly prominent in HCC samples, suggesting its potential critical role in both HCC progression and therapeutic resistance. The identification of this axis provides a theoretical foundation for understanding HCC pathogenesis and developing novel therapeutic targets.
4. Discussion
EOGT, an endoplasmic reticulum-localized glycosyltransferase, catalyzes the addition of O-GlcNAc to proteins with EGF-like domains, thereby modulating their functional properties. Among the known O-GlcNAc glycosyltransferases, OGT and EOGT are the most well characterized. While OGT exhibits a broad substrate range, EOGT is specialized in modifying membrane-associated proteins. Previous research has established that OGT regulates iron metabolism and ferroptosis via dynamic intracellular O-GlcNAcylation [47]. In contrast, the role of EOGT-mediated O-GlcNAcylation in disease pathogenesis remains poorly understood. EOGT deficiency has been linked to genetic disorders, including Adams–Oliver syndrome, primarily through its modification of NOTCH receptors and subsequent regulation of downstream signaling pathways [48]. Furthermore, EOGT has been implicated in HCC, pancreatic cancer, and autoimmune liver diseases [11,12,49]; however, the underlying molecular mechanisms remain elusive. Notably, EOGT has recently been identified as a protein marker of migrasomes [50], a novel type of extracellular vesicle-like organelle generated during cell migration and a hallmark of malignant tumor behavior. Based on these findings, our study aimed to systematically analyze the expression, prognostic relevance, and functional roles of EOGT across various cancer types. Through a series of experimental validations, we identified EOGT as a novel driver of tumorigenesis in HCC. EOGT is significantly upregulated in HCC tissues and strongly correlates with poor patient prognosis. Furthermore, EOGT enhances the proliferation and migration capabilities of the HCC cell line. Notably, our study identifies EOGT as a key regulator in HCC progression and sorafenib resistance. Through a ceRNA network centered on EOGT, we uncovered the hsa_circ_0058189/miR-130a/EOGT axis as a critical regulatory mechanism. hsa_circ_0058189 functions as a molecular sponge for miR-130a-3p, effectively sequestering this miRNA and alleviating its inhibitory effect on EOGT expression. This axis is associated with poor prognosis and therapeutic resistance, providing insights into HCC pathogenesis and potential therapeutic targets.
In pan-cancer analysis, our findings align with recent studies demonstrating the upregulation of EOGT in multiple cancer types, including HCC and PAAD [11,12]. However, unlike the expected result, EOGT mRNA levels were downregulated in BRCA and COAD tumor tissues compared to their normal counterparts, while no significant differences were observed at the protein level. This discrepancy may be attributed to post-transcriptional and post-translational modifications of EOGT. For instance, in lung adenocarcinoma cells, METTL3, through its m6A methyltransferase activity, mediates the m6A modification of JUNB mRNA, which enhances mRNA stability and promotes its nuclear translocation as a transcription factor to activate downstream gene expression. m6A modification can compensate for low transcriptional levels by increasing mRNA stability and translation efficiency [51]. In our study, EOGT was found to be associated with the expression of multiple RNA modification-related genes, suggesting that the observed mRNA–protein discrepancy may result from post-transcriptional modifications. Additionally, in HCC, the E3 ubiquitin ligase TRIM21 targets β-catenin for polyubiquitination, reducing its levels and suppressing Wnt signaling, thereby inhibiting tumor cell proliferation and migration. However, TRIM21 downregulation in some HCC samples leads to insufficient β-catenin ubiquitination, allowing its accumulation despite reduced mRNA levels due to an impaired degradation mechanism [52]. This results in aberrant activation of the Wnt/β-catenin signaling pathway, promoting tumor growth and progression. These findings suggest that post-translational modifications also contribute to the discrepancy between protein and mRNA expression levels. However, whether EOGT is regulated by post-translational modifications requires extensive experimental validation, providing a direction for future research into the mechanisms of EOGT in cancer.
Furthermore, the high diagnostic accuracy of EOGT in LIHC (AUC = 0.844) is consistent with recent studies highlighting its role as a potential biomarker in HCC [12]. Our survival analysis revealed that EOGT appears to function as a protective factor in SKCM prognosis while acting as a risk factor in GBMLGG, LGG, KIPAN, ACC, LAML, and LIHC. This dual role of EOGT may stem from the activation of distinct molecular pathways in different cancer types, highlighting the inherent complexity and heterogeneity of cancer biology. EOGT has also been identified as a potential pan-cancer biomarker for tumor angiogenesis, and several candidate drugs targeting EOGT have been identified through screening studies. Notably, among these candidates, drugs such as tretinoin, mercaptopurine, imatinib, and butein have demonstrated anti-tumor effects, targeting diverse pathways, including lipid metabolism, purine metabolism, and inflammatory mediators. This suggests that EOGT may promote cancer through its glycosylation activity by modulating multiple mechanisms.
ICIs, primarily targeting CTLA-4, PD-1, and PD-L1, represent the most widely used and effective form of immunotherapy in clinical practice. TMB and MSI are predictive biomarkers for ICI sensitivity, with tumors exhibiting high TMB or MSI being more likely to respond to ICIs [53]. In most cancer types analyzed in this study, EOGT expression positively correlated with immune checkpoint gene expression, but only a subset of cancers showed significant associations with TMB and MSI. Following ICI treatment, non-responders showed no significant changes in EOGT levels compared to baseline, while responders in some datasets exhibited lower EOGT levels, suggesting that high EOGT levels may suppress the efficacy of immunotherapy in certain cancer types.
Considering the regulatory role of EOGT in the immune microenvironment, we further investigated its association with key tumor signaling pathways, and the enrichment analysis of proteomics data revealed that high EOGT expression is associated with active EMT pathways and DNA damage response pathways. Transcriptomic enrichment analysis indicated that high EOGT expression is linked to the activation of pro-tumorigenic pathways, including EMT, angiogenesis, inflammatory responses, TNFα signaling via NFκB, and TGF-β signaling, as well as the suppression of oxidative phosphorylation. When evaluating six different therapy-related tumor subtypes, high EOGT expression was predominantly observed in the C6 subtype, characterized by TGF-β dominance. TGF-β, a multifunctional cytokine, plays a critical role in regulating cell proliferation, differentiation, apoptosis, and immune modulation [54]. TGF-β is a key driver of EMT, whose activation induces tumor cell morphological changes, reduced cell adhesion, and enhanced motility, promoting local invasion and distant metastasis. These findings align with our transcriptomic, proteomic, and single-cell sequencing enrichment analyses [55]. TGF-β also contributes to angiogenesis by stimulating the expression of vascular endothelial growth factor (VEGF) and other pro-angiogenic factors, thereby promoting neovascularization. In advanced tumors, a rich vascular network not only supplies essential nutrients for rapid growth but also facilitates cancer cell entry into the bloodstream, increasing the risk of distant metastasis [56]. Additionally, TGF-β aids tumor immune evasion by modulating immunosuppressive states, such as increasing regulatory T-cell (Treg) numbers or function and reducing effector T-cell activity [57]. Therefore, the mechanism by which EOGT modulates multiple pathways through TGF-β to influence tumorigenesis remains unexplored, providing a direction for future research.
Endothelial cells play a pivotal role in the tumor microenvironment, not only supporting tumor progression through angiogenesis—providing essential nutrients and oxygen while removing metabolic waste—but also facilitating metastasis by enabling tumor cell proliferation within blood vessels. Additionally, endothelial cells contribute to immune regulation; for example, in HCC, tumor endothelial cells (TECs) can induce CD8+ T-cell exhaustion through GPNMB expression, thereby impairing the immune system’s ability to combat tumors [58]. In this study, both transcriptomic and single-cell transcriptomic data revealed a positive correlation between high EOGT expression and endothelial cell abundance. Additionally, transcriptomic, single-cell, and spatial transcriptomic data consistently indicated elevated EOGT expression in tumor cells. Knockdown and overexpression experiments in HCC cells further confirmed the critical role of EOGT in promoting malignant phenotypes. Therefore, the integration of potential EOGT inhibitors with current therapeutic regimens has the potential to augment treatment strategies by elevating tumor cell drug sensitivity, particularly in the context of current resistance to TKI-based medications.
The treatment landscape for HCC has evolved significantly, with novel targeted agents (e.g., lenvatinib) and ICIs (e.g., atezolizumab + bevacizumab) now serving as first-line therapies. Nevertheless, sorafenib—the first FDA-approved targeted drug for advanced HCC—remains an important therapeutic option. As a multi-kinase angiogenesis inhibitor, sorafenib functions through the dual inhibition of Raf kinase signaling and receptor tyrosine kinase (RTK) autophosphorylation (VEGFR, PDGFR, c-Kit, RET), thereby suppressing tumor progression and vascular development. However, the emergence of sorafenib resistance poses a major clinical challenge [59]. While the direct role of EOGT in sorafenib resistance remains uncharacterized, substantial evidence establishes its involvement in NOTCH pathway-mediated angiogenesis regulation. The angiogenic network comprises a dynamic balance of pro- and anti-angiogenic mediators, including growth factors, adhesion molecules, proteolytic enzymes, extracellular matrix components, transcriptional regulators, angiopoietins, angiostatin, endostatin, and interleukins. These elements collectively activate transmembrane receptors to drive endothelial cell proliferation, survival, and neovascularization. Of particular relevance, NOTCH receptors—subject to EOGT-mediated modification—represent one of the critical components of this signaling architecture.
Our mechanistic hypothesis derives from two critical considerations: (1) NOTCH receptors constitute a distinct non-RTK protein class unaffected by sorafenib’s primary targets, and (2) the compensatory activation of alternative pro-angiogenic pathways—recognized as the principal driver of sorafenib resistance—may include NOTCH pathway upregulation following the suppression of dominant angiogenic signaling. This biological context positions EOGT as a potential key mediator of resistance-associated compensatory angiogenesis. Consequently, the regulatory axis involving EOGT may indeed be pivotal in the development of sorafenib resistance.
CircRNAs, particularly those enriched in exosomes, show promise as cancer biomarkers and therapeutic targets [60]. Emerging evidence suggests that exosomal circRNAs from drug-resistant cells can mediate therapy resistance [61]. For instance, circ_002136 promotes HCC progression through the miR-19a-3p/RAB1A axis [62], while tumor-derived exosomal circUHRF1 induces NK cell exhaustion and PD-1 resistance [63]. In this context, our findings demonstrate significant upregulation of circ_0058189 in HCC tissues, plasma, and exosomes from sorafenib-resistant HepG2 cells, suggesting its potential role in therapeutic resistance.
The tumor-suppressive role of miR-130a-3p has been established across multiple cancers, including HCC [64,65,66,67,68]. Its downregulation in HCC tissues correlates with poor prognosis, consistent with Wang’s findings linking miR-130a-3p deficiency to COX7RP-mediated ROS/NF-κB activation and Hu’s work demonstrating its regulation of HIF1A-driven glycolysis [66,69]. Our bioinformatic and experimental analyses reveal that circ_0058189 acts as a molecular sponge for miR-130a-3p, with predicted binding sites supporting this interaction.
Notably, EOGT emerges as a critical oncogenic target in HCC. Our multi-modal validation confirms EOGT as a direct target of miR-130a-3p, establishing the circ_0058189/miR-130a-3p/EOGT regulatory axis. The consistent upregulation of circ_0058189 in HCC tissues, plasma, and exosomes from sorafenib-resistant HepG2 cells highlights its potential as a dual diagnostic and therapeutic resistance biomarker.
While our study highlights the critical role of exosome-mediated circ_0058189 in regulating the miR-130a-3p/EOGT axis during HCC progression and sorafenib resistance, several limitations should be acknowledged. First, although TCGA and other public datasets provide valuable insights, and our core findings in HCC are supported by substantial sample sizes (TCGA-LIHC: 369 tumor vs. 50 normal samples, as shown in Table S1), the limited sample size may restrict the generalizability of our findings. Future studies should validate these results in larger, independent cohorts. Second, while we employed multi-layered bioinformatic analyses and preliminary experiments to explore the circ_0058189/miR-130a-3p/EOGT axis, more comprehensive functional validation in cellular and animal models is needed to elucidate its mechanistic and clinical significance. For instance, we could employ RNA pull-down combined with dual-luciferase reporter assays to validate the specific binding between circ_0058189 and miR-130a-3p; utilize AGO2-RIP experiments to confirm the direct targeting of EOGT mRNA by miR-130a-3p; and establish patient-derived xenograft (PDX) models coupled with liquid biopsy cohorts to verify the clinical translational potential of this axis in sorafenib resistance in HCC. Third, HCC pathogenesis involves complex interactions among multiple molecular pathways. Focusing on a single axis may not fully capture the disease’s complexity. Integrating multi-omics data to construct a more comprehensive molecular network is essential for a deeper understanding of HCC mechanisms. Fourth, our findings do not exclude EOGT’s pleiotropic functions in therapy resistance. Future studies must prioritize the systematic characterization of EOGT-O-GlcNAc substrates in diverse treatment contexts using approaches such as CRISPR-based screens coupled with drug sensitivity profiling. Fifth, while our study provides insights into EOGT as a pan-cancer angiogenesis marker, it is important to note that EOGT is not universally upregulated across all tumor types. Future investigations integrating single-cell omics with spatial proteomics could fully resolve the spatiotemporal heterogeneity of EOGT expression within tumor-associated endothelial niches, potentially addressing this limitation. Finally, our study primarily focused on exosomes derived from HepG2 cells. Given the heterogeneity of the tumor microenvironment, exosomes from other cell types may exhibit distinct functional properties. Future investigations should explore the roles of exosomes from diverse cellular sources in HCC progression and therapy resistance.
5. Conclusions
In summary, through pan-cancer analyses, we identified EOGT as a key oncogene significantly upregulated in HCC and associated with poor prognosis. Functional experiments demonstrated that EOGT drives tumor progression by enhancing proliferation and migration in HCC. Mechanistically, we revealed a novel circ_0058189/miR-130a-3p/EOGT axis, illustrating how the ceRNA network regulates EOGT to promote carcinogenesis and drug resistance. Furthermore, EOGT’s roles in immune modulation, angiogenesis, and DNA repair underscore its multifaceted contributions to cancer biology. Notably, EOGT emerged as a potential pan-cancer biomarker and a mediator of chemotherapeutic resistance, highlighting its therapeutic relevance. These findings deepen our understanding of EOGT’s oncogenic functions and provide a foundation for developing targeted therapies against HCC and other cancers. Future studies should focus on EOGT’s post-translational regulation and clinical translation.
Supplementary Materials
The following supporting information can be downloaded at: https://www.mdpi.com/article/10.3390/biomedicines13040773/s1, Figure S1. A Relative EOGT expression levels across various cell lines, obtained from the Cancer Cell Line Encyclopedia (CCLE). B EOGT expression evaluated across 33 tumor types based on gender, clinical stage, grade, and TNM classification; * p < 0.05, ** p < 0.01, *** p < 0.001, **** p < 0.0001. Full terminology for abbreviations is provided in Table S1. Figure S2. Receiver Operating Characteristic Curve (ROC) curves demonstrating EOGT’s potential as a diagnostic biomarker for various cancers. Full terminology for abbreviations is provided in Table S1. Figure S3. Kaplan Meier curves validating the associations between EOGT expression and survival outcomes (OS, DSS, DFI, PFI) in different cancers, indicating that high EOGT expression generally correlates with poor prognosis in LGG, KIPAN, ACC, LAML, and LIHC. Full terminology for abbreviations is provided in Table S1. Figure S4. Inverse correlation between EOGT expression and promoter methylation in 30 cancer types. Full terminology for abbreviations is provided in Table S1. Figure S5. Reduced methylation of EOGT predicting shorter survival in LGG and THYM. Full terminology for abbreviations is provided in Table S1. Figure S6. Gene Set Enrichment Analysis (GSEA) linking high EOGT expression to the activation of pro-cancer pathways, including EMT, angiogenesis, inflammatory response, and TNFα signaling via NF-κB while suppressing oxidative phosphorylation. Full terminology for abbreviations is provided in Table S1. Figure S7. A Scatter plots illustrating the strongest correlations between ESTIMATE scores and EOGT expression levels in the top 6 cancer types. B EOGT upregulation in the C6 immunological subtype of BRCA, COAD, HNSC, KIRC, LUAD, LUSC, STAD, and THCA, suggesting a potential functional relationship with TGF-β signaling activity. Full terminology for abbreviations is provided in Table S1. Figure S8. Pan-cancer analysis of correlations between EOGT and immune-related genes; * p < 0.05. Full terminology for abbreviations is provided in Table S1. Figure S9. A Comparison of EOGT expression in samples before and after treatment with immune checkpoint inhibitors (ICIs) in vivo using the TISMO database. B Comparison of EOGT expression in tumor cell lines treated with cytokines in vitro using the TISMO database; * p < 0.05, ** p < 0.01, *** p < 0.001. Figure S10. Assessment of the correlation between EOGT expression and infiltration of various immune cell types to understand the association between EOGT expression and cancer-related immune activity. Full terminology for abbreviations is provided in Table S1; * p < 0.05, ** p < 0.01, *** p < 0.001, **** p < 0.0001. Figure S11. A-H Spatial transcriptomics revealing overlapping EOGT expression patterns with tumor cells in SKCM and GBM. I, J CancerSEA analysis linking EOGT to angiogenesis, cell differentiation, EMT, inflammation, metastasis, and stemness while showing weak or negative correlations with cell cycle, DNA repair, and DNA damage. Full terminology for abbreviations is provided in Table S1; * p < 0.05, ** p < 0.01, *** p < 0.001, **** p < 0.0001. Figure S12. Association of EOGT expression with drug resistance and identification of potential EOGT inhibitors. A Heatmap illustrating the association of high EOGT expression with resistance to multiple chemotherapeutic agents, particularly tyrosine kinase inhibitors, across the GDSC1/2, CTRP, and PRISM databases. Drug sensitivity was evaluated using IC50 and AUC. Representative examples include Afatinib, Lapatinib, Gefitinib, and Selumetinib, showing significant correlations in multiple datasets. B Heatmap summarizing the three most inhibitory drugs for each cancer type, as identified through CMAP analysis. Arachidonyltrifluoromethane and W.13 each appear 9 times, while MK-886 and X4.5.dianilinophthalimide each appear 8 times, suggesting their potential to target EOGT or its synergistic pathways across multiple cancer types. Full terminology for abbreviations is provided in Table S1. Table S1. TCGA cancer classification and sample inventory. Table S2. The miRNA mimics and their sequences. Table S3. All information of antibodies. Table S4. Fifteen EOGT clinical-relevant AS events on OncoSplicing. Table S5. Results of the top 20 miRNAs targeting EOGT screened from the mirDIP database. Table S6. Results of the 79 miRNAs targeting EOGT screened from the mirDIP and miRwalk databases. Table S7. The 131 upregulated circRNAs and name conversion results from the GSE101850 dataset.
Author Contributions
Z.Y. and J.L.: conceptualization, data curation, software, and writing—original draft; W.A. and H.W. (Herui Wei): data curation, formal analysis, and resources; M.L., L.H. and F.X.: review and editing of the manuscript; H.W. (Hongshan Wei): conceptualization, funding acquisition, and supervision. All authors have read and agreed to the published version of the manuscript.
Funding
This work was supported by the National Natural Science Foundation of China (No. 82170541).
Institutional Review Board Statement
Not applicable.
Informed Consent Statement
Not applicable.
Data Availability Statement
All data are provided in the Supplementary Materials or are available from the corresponding author upon reasonable request.
Acknowledgments
We would like to thank the creators and maintainers of the publicly available datasets used in this study. Their contributions have been invaluable to our research.
Conflicts of Interest
The authors declare that no competing financial interests exist.
Abbreviations
SLC7A11: Solute carrier family 7 member 11; NRF2: Nuclear factor erythroid-2; ChIP: chromatin immunoprecipitation; OS: overall survival; PFS: progression-free survival; DFS: disease-free survival; DSS: disease-specific survival; OD: optical density; ROS: reactive oxygen species; HCC: hepatocellular carcinoma; CRC: colorectal cancer; GlcNAc: O-linked N-acetylglucosamine; O-GlcNAcylation: O-linked β-N-acetylglucosamine modification; YAP: Yes-associated protein; YY1: Yin-yang 1 transcription factor; SLC22A15: Solute carrier family 22 member 15; AANAT: Arylalkylamine N-acetyltransferase; UDP-GlcNAc: Uridine diphosphate N-acetylglucosamine; PD-L1: Programmed Death-Ligand 1; OGT: O-GlcNAc transferase; OGA: O-GlcNAcase; GSH: Glutathione; NOTCH: Notch receptor; HEY1: Hes related family bHLH transcription factor 1; HES1: Hes family bHLH transcription factor 1; PINK1: PTEN-induced putative kinase 1; CAMS: Chinese Academy of Medical Sciences; PBS: Phosphate-buffered solution; DMEM: Dulbecco’s modified Eagle’s medium; FBS: fetal bovine serum; DAPT: Notch receptor inhibitor; DMSO: dimethyl sulfoxide; shRNA: short hairpin RNA; CCK-8: Cell Counting Kit-8; SD: standard deviation; ICGC: International Cancer Genome Consortium; TCGA: The Cancer Genome Atlas; GEO: Gene Expression Omnibus; HPA: Human Protein Atlas; EGF: epidermal growth factor; LRP8: Low-Density Lipoprotein Receptor-Related Protein 8; HDACs: histone deacetylases; EMT: epithelial-to-mesenchymal transition.
References
- He, X.-F.; Hu, X.; Wen, G.-J.; Wang, Z.; Lin, W.-J. O-GlcNAcylation in cancer development and immunotherapy. Cancer Lett. 2023, 566, 216258. [Google Scholar] [CrossRef]
- Zhang, X.; Qiao, Y.; Wu, Q.; Chen, Y.; Zou, S.; Liu, X.; Zhu, G.; Zhao, Y.; Chen, Y.; Yu, Y.; et al. The essential role of YAP O-GlcNAcylation in high-glucose-stimulated liver tumorigenesis. Nat. Commun. 2017, 8, 15280. [Google Scholar] [CrossRef] [PubMed]
- Zhu, G.; Qian, M.; Lu, L.; Chen, Y.; Zhang, X.; Wu, Q.; Liu, Y.; Bian, Z.; Yang, Y.; Guo, S.; et al. O-GlcNAcylation of YY1 stimulates tumorigenesis in colorectal cancer cells by targeting SLC22A15 and AANAT. Carcinogenesis 2019, 40, 1121–1131. [Google Scholar] [CrossRef] [PubMed]
- Shang, M.; Yang, H.; Yang, R.; Chen, T.; Fu, Y.; Li, Y.; Fang, X.; Zhang, K.; Zhang, J.; Li, H.; et al. The folate cycle enzyme MTHFD2 induces cancer immune evasion through PD-L1 up-regulation. Nat. Commun. 2021, 12, 1940. [Google Scholar] [CrossRef] [PubMed]
- Hart, G.W. Nutrient regulation of signaling and transcription. J. Biol. Chem. 2019, 294, 2211–2231. [Google Scholar] [CrossRef]
- Lubas, W.A.; Frank, D.W.; Krause, M.; Hanover, J.A. O-Linked GlcNAc transferase is a conserved nucleocytoplasmic protein containing tetratricopeptide repeats. J. Biol. Chem. 1997, 272, 9316–9324. [Google Scholar] [CrossRef]
- Kreppel, L.K.; Blomberg, M.A.; Hart, G.W. Dynamic glycosylation of nuclear and cytosolic proteins. Cloning and characterization of a unique O-GlcNAc transferase with multiple tetratricopeptide repeats. J. Biol. Chem. 1997, 272, 9308–9315. [Google Scholar] [CrossRef]
- Sawaguchi, S.; Varshney, S.; Ogawa, M.; Sakaidani, Y.; Yagi, H.; Takeshita, K.; Murohara, T.; Kato, K.; Sundaram, S.; Stanley, P.; et al. O-GlcNAc on NOTCH1 EGF repeats regulates ligand-induced Notch signaling and vascular development in mammals. eLife 2017, 6, e24419. [Google Scholar] [CrossRef]
- Zhao, X.; Lei, Y.; Zheng, J.; Peng, J.; Li, Y.; Yu, L.; Chen, Y. Identification of markers for migrasome detection. Cell Discov. 2019, 5, 27. [Google Scholar] [CrossRef]
- Zhang, K.; Zhu, Z.; Jia, R.; Wang, N.A.; Shi, M.; Wang, Y.; Xiang, S.; Zhang, Q.; Xu, L. CD151-enriched migrasomes mediate hepatocellular carcinoma invasion by conditioning cancer cells and promoting angiogenesis. J. Exp. Clin. Cancer Res. CR 2024, 43, 160. [Google Scholar] [CrossRef]
- Yang, C.; Hu, J.-F.; Zhan, Q.; Wang, Z.-W.; Li, G.; Pan, J.-J.; Huang, L.; Liao, C.-Y.; Huang, Y.; Tian, Y.-F.; et al. SHCBP1 interacting with EOGT enhances O-GlcNAcylation of NOTCH1 and promotes the development of pancreatic cancer. Genomics 2021, 113, 827–842. [Google Scholar] [CrossRef] [PubMed]
- Shu, Y.; He, L.; Gao, M.; Xiao, F.; Yang, J.; Wang, S.; Wei, H.; Zhang, F.; Wei, H. EOGT Correlated With Immune Infiltration: A Candidate Prognostic Biomarker for Hepatocellular Carcinoma. Front. Immunol. 2021, 12, 780509. [Google Scholar] [CrossRef]
- Goldman, M.J.; Craft, B.; Hastie, M.; Repečka, K.; McDade, F.; Kamath, A.; Banerjee, A.; Luo, Y.; Rogers, D.; Brooks, A.N.; et al. Visualizing and interpreting cancer genomics data via the Xena platform. Nat. Biotechnol. 2020, 38, 675–678. [Google Scholar] [CrossRef]
- Barretina, J.; Caponigro, G.; Stransky, N.; Venkatesan, K.; Margolin, A.A.; Kim, S.; Wilson, C.J.; Lehár, J.; Kryukov, G.V.; Sonkin, D.; et al. The Cancer Cell Line Encyclopedia enables predictive modelling of anticancer drug sensitivity. Nature 2012, 483, 603–607. [Google Scholar] [CrossRef] [PubMed]
- Cerami, E.; Gao, J.; Dogrusoz, U.; Gross, B.E.; Sumer, S.O.; Aksoy, B.A.; Jacobsen, A.; Byrne, C.J.; Heuer, M.L.; Larsson, E.; et al. The cBio cancer genomics portal: An open platform for exploring multidimensional cancer genomics data. Cancer Discov. 2012, 2, 401–404. [Google Scholar] [CrossRef] [PubMed]
- Chandrashekar, D.S.; Karthikeyan, S.K.; Korla, P.K.; Patel, H.; Shovon, A.R.; Athar, M.; Netto, G.J.; Qin, Z.S.; Kumar, S.; Manne, U.; et al. UALCAN: An update to the integrated cancer data analysis platform. Neoplasia 2022, 25, 18–27. [Google Scholar] [CrossRef]
- Gao, J.; Aksoy, B.A.; Dogrusoz, U.; Dresdner, G.; Gross, B.; Sumer, S.O.; Sun, Y.; Jacobsen, A.; Sinha, R.; Larsson, E.; et al. Integrative analysis of complex cancer genomics and clinical profiles using the cBioPortal. Sci. Signal. 2013, 6, pl1. [Google Scholar] [CrossRef]
- Beroukhim, R.; Mermel, C.H.; Porter, D.; Wei, G.; Raychaudhuri, S.; Donovan, J.; Barretina, J.; Boehm, J.S.; Dobson, J.; Urashima, M.; et al. The landscape of somatic copy-number alteration across human cancers. Nature 2010, 463, 899–905. [Google Scholar] [CrossRef]
- Mayakonda, A.; Lin, D.-C.; Assenov, Y.; Plass, C.; Koeffler, H.P. Maftools: Efficient and comprehensive analysis of somatic variants in cancer. Genome Res. 2018, 28, 1747–1756. [Google Scholar] [CrossRef]
- Latham, A.; Srinivasan, P.; Kemel, Y.; Shia, J.; Bandlamudi, C.; Mandelker, D.; Middha, S.; Hechtman, J.; Zehir, A.; Dubard-Gault, M.; et al. Microsatellite Instability Is Associated with the Presence of Lynch Syndrome Pan-Cancer. J. Clin. Oncol. 2019, 37, 286–295. [Google Scholar] [CrossRef]
- Coleman, R.L.; Oza, A.M.; Lorusso, D.; Aghajanian, C.; Oaknin, A.; Dean, A.; Colombo, N.; Weberpals, J.I.; Clamp, A.; Scambia, G.; et al. ARIEL3 investigators, Rucaparib maintenance treatment for recurrent ovarian carcinoma after response to platinum therapy (ARIEL3): A randomised, double-blind, placebo-controlled, phase 3 trial. Lancet 2017, 390, 1949–1961. [Google Scholar] [CrossRef]
- Tang, Z.; Kang, B.; Li, C.; Chen, T.; Zhang, Z. GEPIA2: An enhanced web server for large-scale expression profiling and interactive analysis. Nucleic Acids Res. 2019, 47, W556–W560. [Google Scholar] [CrossRef] [PubMed]
- Malta, T.M.; Sokolov, A.; Gentles, A.J.; Burzykowski, T.; Poisson, L.; Weinstein, J.N.; Kamińska, B.; Huelsken, J.; Omberg, L.; Gevaert, O.; et al. Machine Learning Identifies Stemness Features Associated with Oncogenic Dedifferentiation. Cell 2018, 173, 338–354.e15. [Google Scholar] [CrossRef] [PubMed]
- Lyko, F. The DNA methyltransferase family: A versatile toolkit for epigenetic regulation. Nat. Rev. Genet. 2018, 19, 81–92. [Google Scholar] [CrossRef]
- Shi, H.; Chai, P.; Jia, R.; Fan, X. Novel insight into the regulatory roles of diverse RNA modifications: Re-defining the bridge between transcription and translation. Mol. Cancer 2020, 19, 78. [Google Scholar] [CrossRef]
- Zhang, Y.; Yao, X.; Zhou, H.; Wu, X.; Tian, J.; Zeng, J.; Yan, L.; Duan, C.; Liu, H.; Li, H.; et al. OncoSplicing: An updated database for clinically relevant alternative splicing in 33 human cancers. Nucleic Acids Res. 2022, 50, D1340–D1347. [Google Scholar] [CrossRef] [PubMed]
- Szklarczyk, D.; Gable, A.L.; Nastou, K.C.; Lyon, D.; Kirsch, R.; Pyysalo, S.; Doncheva, N.T.; Legeay, M.; Fang, T.; Bork, P.; et al. The STRING database in 2021: Customizable protein-protein networks, and functional characterization of user-uploaded gene/measurement sets. Nucleic Acids Res. 2021, 49, D605–D612. [Google Scholar] [CrossRef]
- Liu, C.-J.; Hu, F.-F.; Xie, G.-Y.; Miao, Y.-R.; Li, X.-W.; Zeng, Y.; Guo, A.-Y. GSCA: An integrated platform for gene set cancer analysis at genomic, pharmacogenomic and immunogenomic levels. Brief. Bioinf. 2023, 24, bbac558. [Google Scholar] [CrossRef]
- Yu, G.; Wang, L.-G.; Han, Y.; He, Q.-Y. clusterProfiler: An R package for comparing biological themes among gene clusters. OMICS: J. Integr. Biol. 2012, 16, 284–287. [Google Scholar] [CrossRef]
- Yoshihara, K.; Shahmoradgoli, M.; Martínez, E.; Vegesna, R.; Kim, H.; Torres-Garcia, W.; Treviño, V.; Shen, H.; Laird, P.W.; Levine, D.A.; et al. Inferring tumour purity and stromal and immune cell admixture from expression data. Nat. Commun. 2013, 4, 2612. [Google Scholar] [CrossRef]
- Ru, B.; Wong, C.N.; Tong, Y.; Zhong, J.Y.; Zhong, S.S.W.; Wu, W.C.; Chu, K.C.; Wong, C.Y.; Lau, C.Y.; Chen, I.; et al. TISIDB: An integrated repository portal for tumor-immune system interactions. Bioinformatics 2019, 35, 4200–4202. [Google Scholar] [CrossRef] [PubMed]
- Kalbasi, A.; Ribas, A. Tumour-intrinsic resistance to immune checkpoint blockade. Nat. Rev. Immunol. 2020, 20, 25–39. [Google Scholar] [CrossRef] [PubMed]
- Zeng, Z.; Wong, C.J.; Yang, L.; Ouardaoui, N.; Li, D.; Zhang, W.; Gu, S.; Zhang, Y.; Liu, Y.; Wang, X.; et al. TISMO: Syngeneic mouse tumor database to model tumor immunity and immunotherapy response. Nucleic Acids Res. 2022, 50, D1391–D1397. [Google Scholar] [CrossRef] [PubMed]
- Newman, A.M.; Liu, C.L.; Green, M.R.; Gentles, A.J.; Feng, W.; Xu, Y.; Hoang, C.D.; Diehn, M.; Alizadeh, A.A. Robust enumeration of cell subsets from tissue expression profiles. Nat. Methods 2015, 12, 453–457. [Google Scholar] [CrossRef]
- Becht, E.; Giraldo, N.A.; Lacroix, L.; Buttard, B.; Elarouci, N.; Petitprez, F.; Selves, J.; Laurent-Puig, P.; Sautès-Fridman, C.; Fridman, W.H.; et al. Erratum to: Estimating the population abundance of tissue-infiltrating immune and stromal cell populations using gene expression. Genome Biol. 2016, 17, 249. [Google Scholar] [CrossRef]
- Aran, D.; Hu, Z.; Butte, A.J. xCell: Digitally portraying the tissue cellular heterogeneity landscape. Genome Biol. 2017, 18, 220. [Google Scholar] [CrossRef]
- Li, T.; Fu, J.; Zeng, Z.; Cohen, D.; Li, J.; Chen, Q.; Li, B.; Liu, X.S. TIMER2.0 for analysis of tumor-infiltrating immune cells. Nucleic Acids Res. 2020, 48, W509–W514. [Google Scholar] [CrossRef]
- Yuan, H.; Yan, M.; Zhang, G.; Liu, W.; Deng, C.; Liao, G.; Xu, L.; Luo, T.; Yan, H.; Long, Z.; et al. CancerSEA: A cancer single-cell state atlas. Nucleic Acids Res. 2019, 47, D900–D908. [Google Scholar] [CrossRef]
- Yang, C.; Chen, M.; Wang, S.; Qian, R.; Huang, X.; Wang, J.; Liu, Z.; Qin, W.; Wang, C.; Hang, H.; et al. A survey of optimal strategy for signature-based drug repositioning and an application to liver cancer. eLife 2022, 11, e71880. [Google Scholar] [CrossRef]
- Shen, W.; Song, Z.; Zhong, X.; Huang, M.; Shen, D.; Gao, P.; Qian, X.; Wang, M.; He, X.; Wang, T.; et al. Sangerbox: A comprehensive, interaction-friendly clinical bioinformatics analysis platform. iMeta 2022, 1, e36. [Google Scholar] [CrossRef]
- DSzklarczyk Kirsch, R.; Koutrouli, M.; Nastou, K.; Mehryary, F.; Hachilif, R.; Gable, A.L.; Fang, T.; Doncheva, N.T.; Pyysalo, S.; Bork, P. The STRING database in 2023: Protein-protein association networks and functional enrichment analyses for any sequenced genome of interest. Nucleic Acids Res. 2023, 51, D638–D646. [Google Scholar] [CrossRef]
- Liu, Z.; Liu, L.; Weng, S.; Xu, H.; Xing, Z.; Ren, Y.; Ge, X.; Wang, L.; Guo, C.; Li, L.; et al. BEST: A web application for comprehensive biomarker exploration on large-scale data in solid tumors. J. Big Data 2023, 10, 165. [Google Scholar] [CrossRef]
- Zhang, Q.; Hu, W.; Xiong, L.; Wen, J.; Wei, T.; Yan, L.; Liu, Q.; Zhu, S.; Bai, Y.; Zeng, Y.; et al. IHGA: An interactive web server for large-scale and comprehensive discovery of genes of interest in hepatocellular carcinoma. Comput. Struct. Biotechnol. J. 2023, 21, 3987–3998. [Google Scholar] [CrossRef]
- Liu, Y.; Xun, Z.; Ma, K.; Liang, S.; Li, X.; Zhou, S.; Sun, L.; Liu, Y.; Du, Y.; Guo, X.; et al. Identification of a tumour immune barrier in the HCC microenvironment that determines the efficacy of immunotherapy. J. Hepatol. 2023, 78, 770–782. [Google Scholar] [CrossRef] [PubMed]
- Ben-David, U.; Amon, A. Context is everything: Aneuploidy in cancer. Nat. Rev. Genet. 2020, 21, 44–62. [Google Scholar] [CrossRef]
- Qu, X.; Li, H.; Braziel, R.M.; Passerini, V.; Rimsza, L.M.; Hsi, E.D.; Leonard, J.P.; Smith, S.M.; Kridel, R.; Press, O.; et al. Genomic alterations important for the prognosis in patients with follicular lymphoma treated in SWOG study S0016. Blood 2019, 133, 81–93. [Google Scholar] [CrossRef]
- Yu, F.; Zhang, Q.; Liu, H.; Liu, J.; Yang, S.; Luo, X.; Liu, W.; Zheng, H.; Liu, Q.; Cui, Y.; et al. Dynamic O-GlcNAcylation coordinates ferritinophagy and mitophagy to activate ferroptosis. Cell Discov. 2022, 8, 40. [Google Scholar] [CrossRef]
- Schröder, K.C.; Duman, D.; Tekin, M.; Schanze, D.; Sukalo, M.; Meester, J.; Wuyts, W.; Zenker, M. Adams-Oliver syndrome caused by mutations of the EOGT gene. Am. J. Med. Genet. A 2019, 179, 2246–2251. [Google Scholar] [CrossRef]
- Hao, X.; Li, Y.; Wang, J.; Ma, J.; Zhao, S.; Ye, X.; He, L.; Yang, J.; Gao, M.; Xiao, F.; et al. Deficient O-GlcNAc Glycosylation Impairs Regulatory T Cell Differentiation and Notch Signaling in Autoimmune Hepatitis. Front. Immunol. 2018, 9, 2089. [Google Scholar] [CrossRef]
- Deng, S.; Wu, Y.; Huang, S.; Yang, X. Novel insights into the roles of migrasome in cancer. Discov. Oncol. 2024, 15, 166. [Google Scholar] [CrossRef]
- Wanna-Udom, S.; Terashima, M.; Lyu, H.; Ishimura, A.; Takino, T.; Sakari, M.; Tsukahara, T.; Suzuki, T. The m6A methyltransferase METTL3 contributes to transforming growth factor-beta-induced epithelial-mesenchymal transition of lung cancer cells through the regulation of JUNB. Biochem. Biophys. Res. Commun. 2020, 524, 150–155. [Google Scholar] [CrossRef] [PubMed]
- Zhang, Z.; Zhu, Z.; Sheng, H.; Sun, J.; Cao, C. TRIM21 suppresses invasion of hepatocellular carcinoma cells by promoting β-catenin ubiquitylation and degradation. J. South. Med. Univ. 2022, 42, 55–62. [Google Scholar] [CrossRef]
- Jardim, D.L.; Goodman, A.; de Melo Gagliato, D.; Kurzrock, R. The Challenges of Tumor Mutational Burden as an Immunotherapy Biomarker. Cancer Cell 2021, 39, 154–173. [Google Scholar] [CrossRef] [PubMed]
- Deng, Z.; Fan, T.; Xiao, C.; Tian, H.; Zheng, Y.; Li, C.; He, J. TGF-β signaling in health, disease, and therapeutics. Signal Transduct. Target. Ther. 2024, 9, 61. [Google Scholar] [CrossRef]
- Wang, X.; Eichhorn, P.J.A.; Thiery, J.P. TGF-β, EMT, and resistance to anti-cancer treatment. Semin. Cancer Biol. 2023, 97, 1–11. [Google Scholar] [CrossRef]
- Watabe, T.; Takahashi, K.; Pietras, K.; Yoshimatsu, Y. Roles of TGF-β signals in tumor microenvironment via regulation of the formation and plasticity of vascular system. Semin. Cancer Biol. 2023, 92, 130–138. [Google Scholar] [CrossRef]
- Moreau, J.M.; Velegraki, M.; Bolyard, C.; Rosenblum, M.D.; Li, Z. Transforming growth factor-β1 in regulatory T cell biology. Sci. Immunol. 2022, 7, eabi4613. [Google Scholar] [CrossRef]
- Sakano, Y.; Noda, T.; Kobayashi, S.; Sasaki, K.; Iwagami, Y.; Yamada, D.; Tomimaru, Y.; Akita, H.; Gotoh, K.; Takahashi, H.; et al. Tumor endothelial cell-induced CD8+ T-cell exhaustion via GPNMB in hepatocellular carcinoma. Cancer Sci. 2022, 113, 1625–1638. [Google Scholar] [CrossRef]
- Ladd, A.D.; Duarte, S.; Sahin, I.; Zarrinpar, A. Mechanisms of drug resistance in HCC. Hepatology 2024, 79, 926–940. [Google Scholar] [CrossRef]
- Conn, V.M.; Chinnaiyan, A.M.; Conn, S.J. Circular RNA in cancer. Nat. Rev. Cancer 2024, 24, 597–613. [Google Scholar] [CrossRef]
- Guo, X.; Gao, C.; Yang, D.-H.; Li, S. Exosomal circular RNAs: A chief culprit in cancer chemotherapy resistance. Drug Resist. Updates Rev. Comment. Antimicrob. Anticancer Chemother. 2023, 67, 100937. [Google Scholar] [CrossRef]
- Yuan, P.; Song, J.; Wang, F.; Chen, B. Exosome-transmitted circ_002136 promotes hepatocellular carcinoma progression by miR-19a-3p/RAB1A pathway. BMC Cancer 2022, 22, 1284. [Google Scholar] [CrossRef]
- Zhang, P.-F.; Gao, C.; Huang, X.-Y.; Lu, J.-C.; Guo, X.-J.; Shi, G.-M.; Cai, J.-B.; Ke, A.-W. Cancer cell-derived exosomal circUHRF1 induces natural killer cell exhaustion and may cause resistance to anti-PD1 therapy in hepatocellular carcinoma. Mol. Cancer 2020, 19, 110. [Google Scholar] [CrossRef] [PubMed]
- Liu, Y.; Li, Y.; Wang, R.; Qin, S.; Liu, J.; Su, F.; Yang, Y.; Zhao, F.; Wang, Z.; Wu, Q. MiR-130a-3p regulates cell migration and invasion via inhibition of Smad4 in gemcitabine resistant hepatoma cells. J. Exp. Clin. Cancer Res. CR 2016, 35, 19. [Google Scholar] [CrossRef]
- Zhu, J.; Luo, Y.; Zhao, Y.; Kong, Y.; Zheng, H.; Li, Y.; Gao, B.; Ai, L.; Huang, H.; Huang, J.; et al. circEHBP1 promotes lymphangiogenesis and lymphatic metastasis of bladder cancer via miR-130a-3p/TGFβR1/VEGF-D signaling. Mol. Ther. 2021, 29, 1838–1852. [Google Scholar] [CrossRef] [PubMed]
- Hu, M.; Fu, Q.; Jing, C.; Zhang, X.; Qin, T.; Pan, Y. LncRNA HOTAIR knockdown inhibits glycolysis by regulating miR-130a-3p/HIF1A in hepatocellular carcinoma under hypoxia. Biomed. Pharmacother. 2020, 125, 109703. [Google Scholar] [CrossRef]
- Song, G.-L.; Xiao, M.; Wan, X.-Y.; Deng, J.; Ling, J.-D.; Tian, Y.-G.; Li, M.; Yin, J.; Zheng, R.-Y.; Tang, Y.; et al. MiR-130a-3p suppresses colorectal cancer growth by targeting Wnt Family Member 1 (WNT1). Bioengineered 2021, 12, 8407–8418. [Google Scholar] [CrossRef]
- Poodineh, J.; Sirati-Sabet, M.; Rajabibazl, M.; Mohammadi-Yeganeh, S. MiR-130a-3p blocks wnt signaling cascade in the triple-negative breast cancer by targeting the key players at multiple points. Heliyon 2020, 6, e05434. [Google Scholar] [CrossRef]
- Wang, G.; Popovic, B.; Tao, J.; Jiang, A. Overexpression of COX7RP promotes tumor growth and metastasis by inducing ROS production in hepatocellular carcinoma cells. Am. J. Cancer Res. 2020, 10, 1366–1383. [Google Scholar]
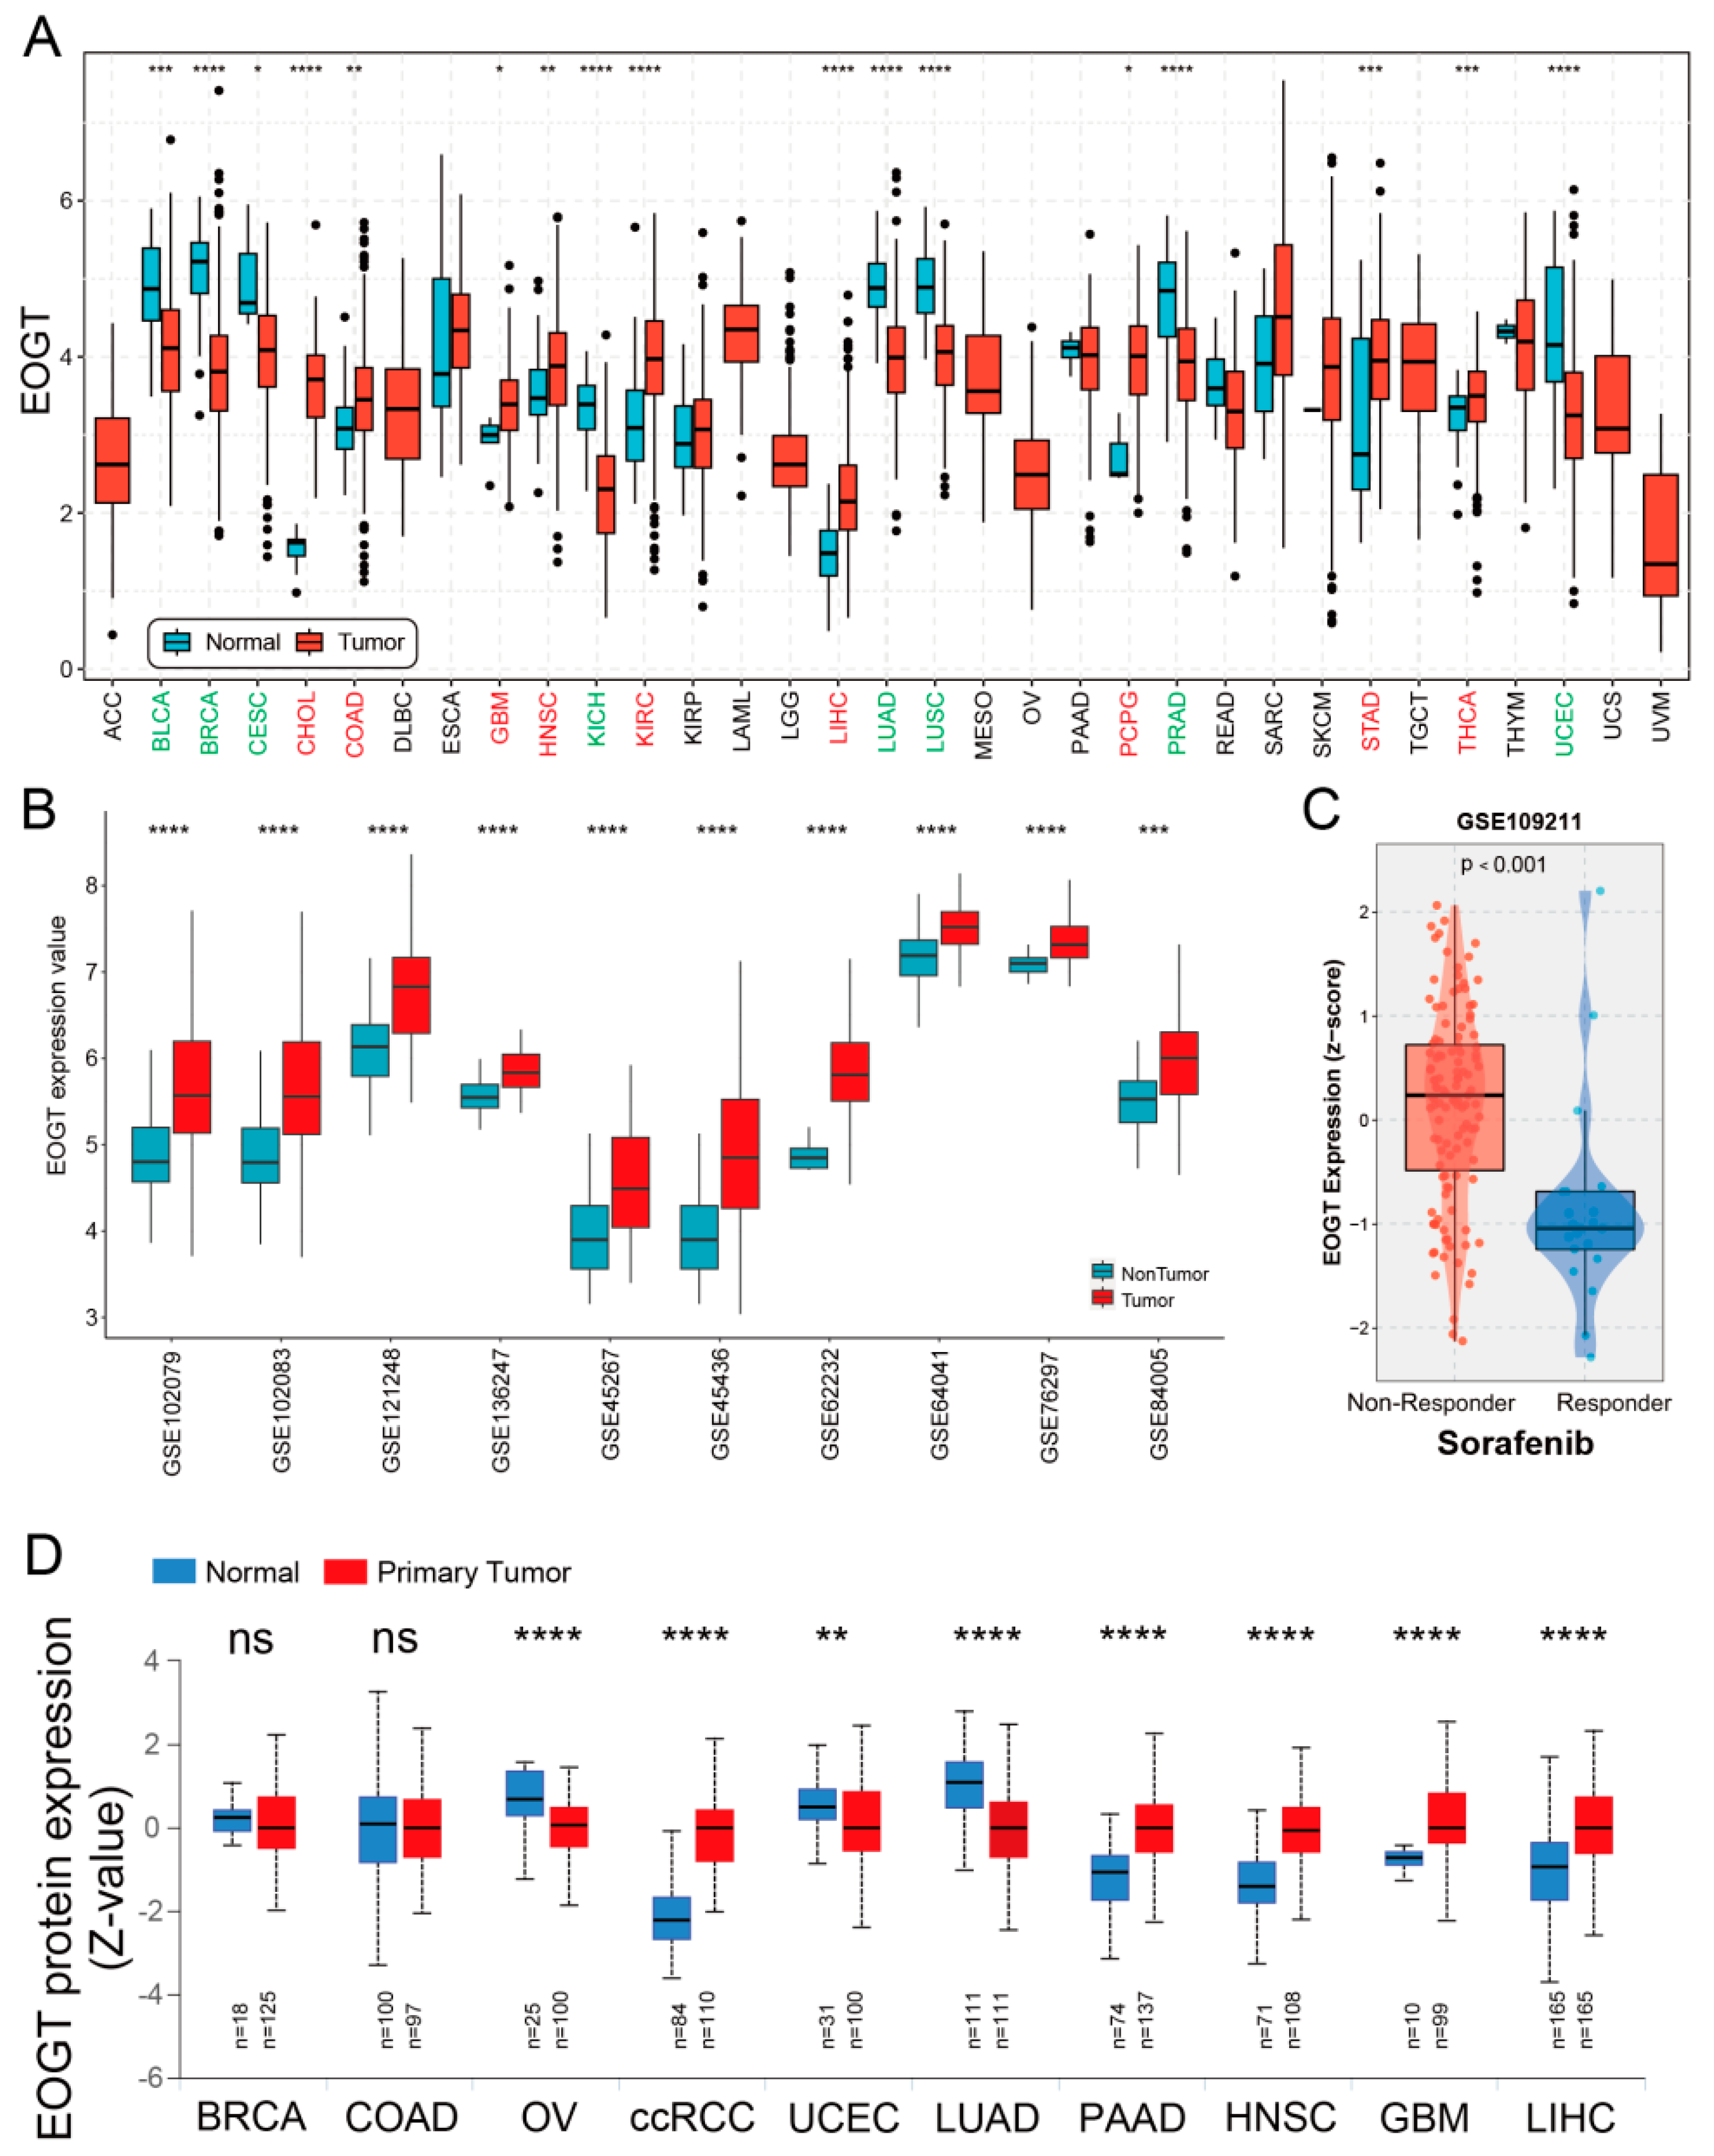
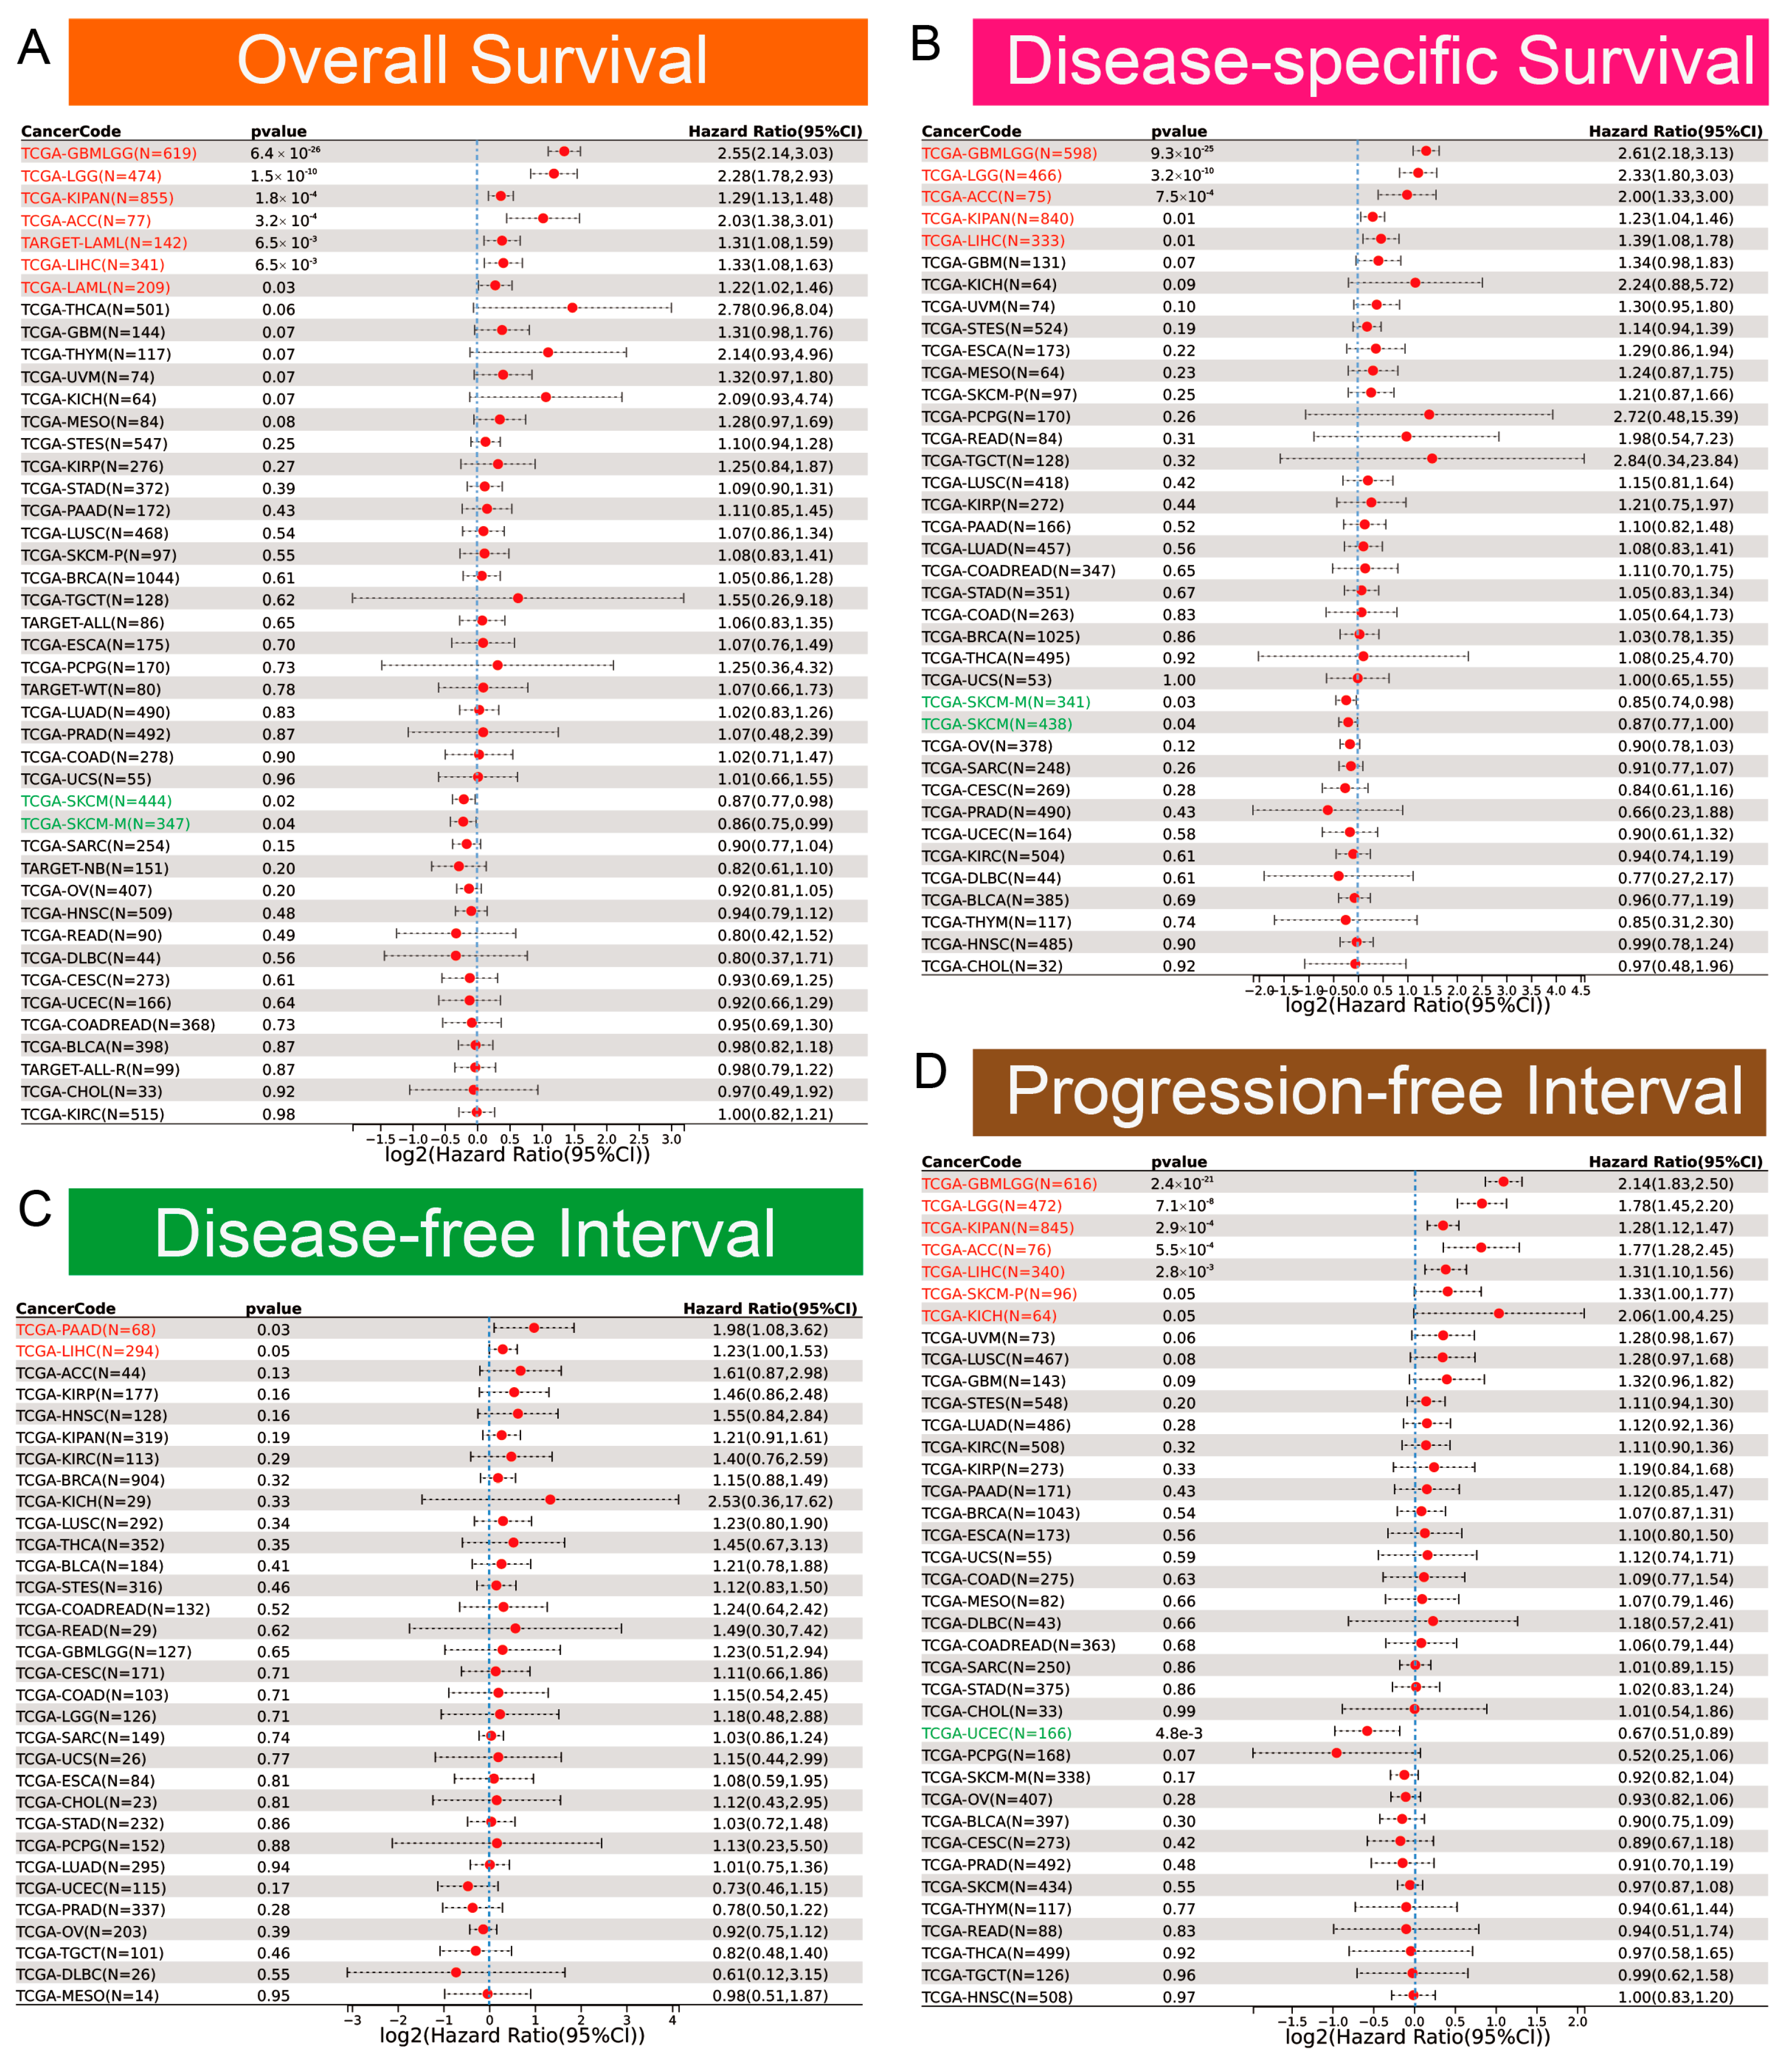
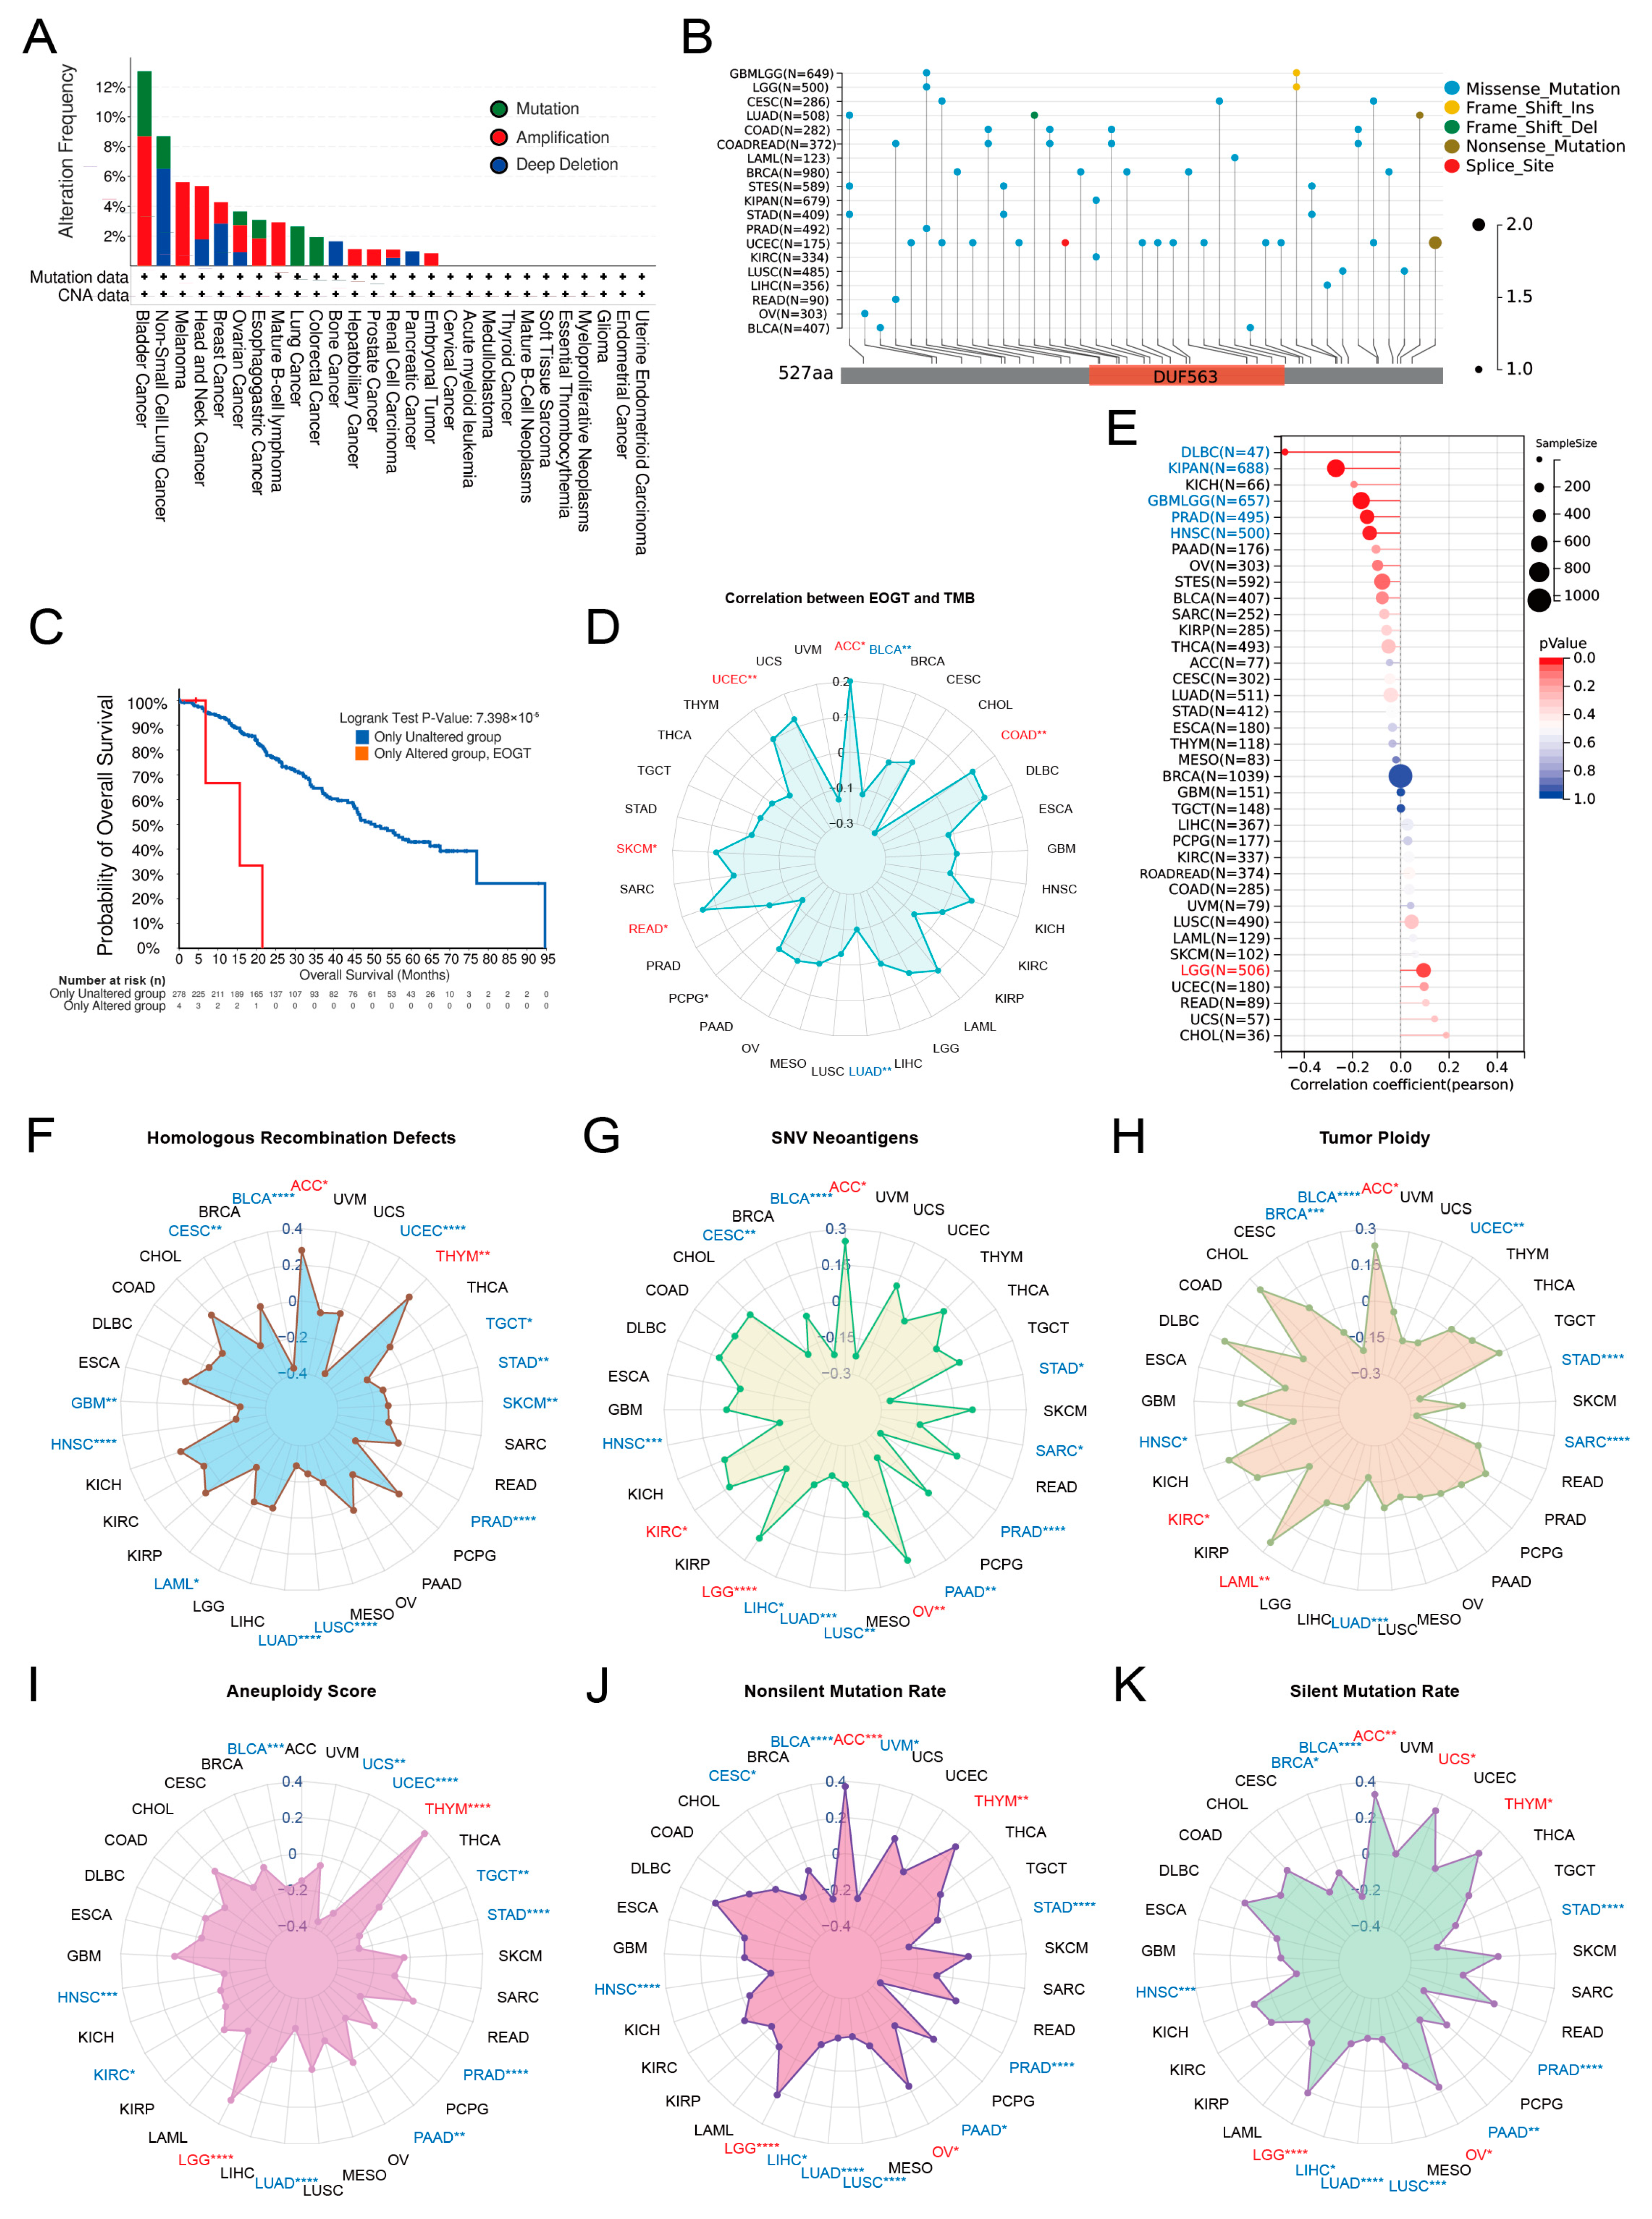
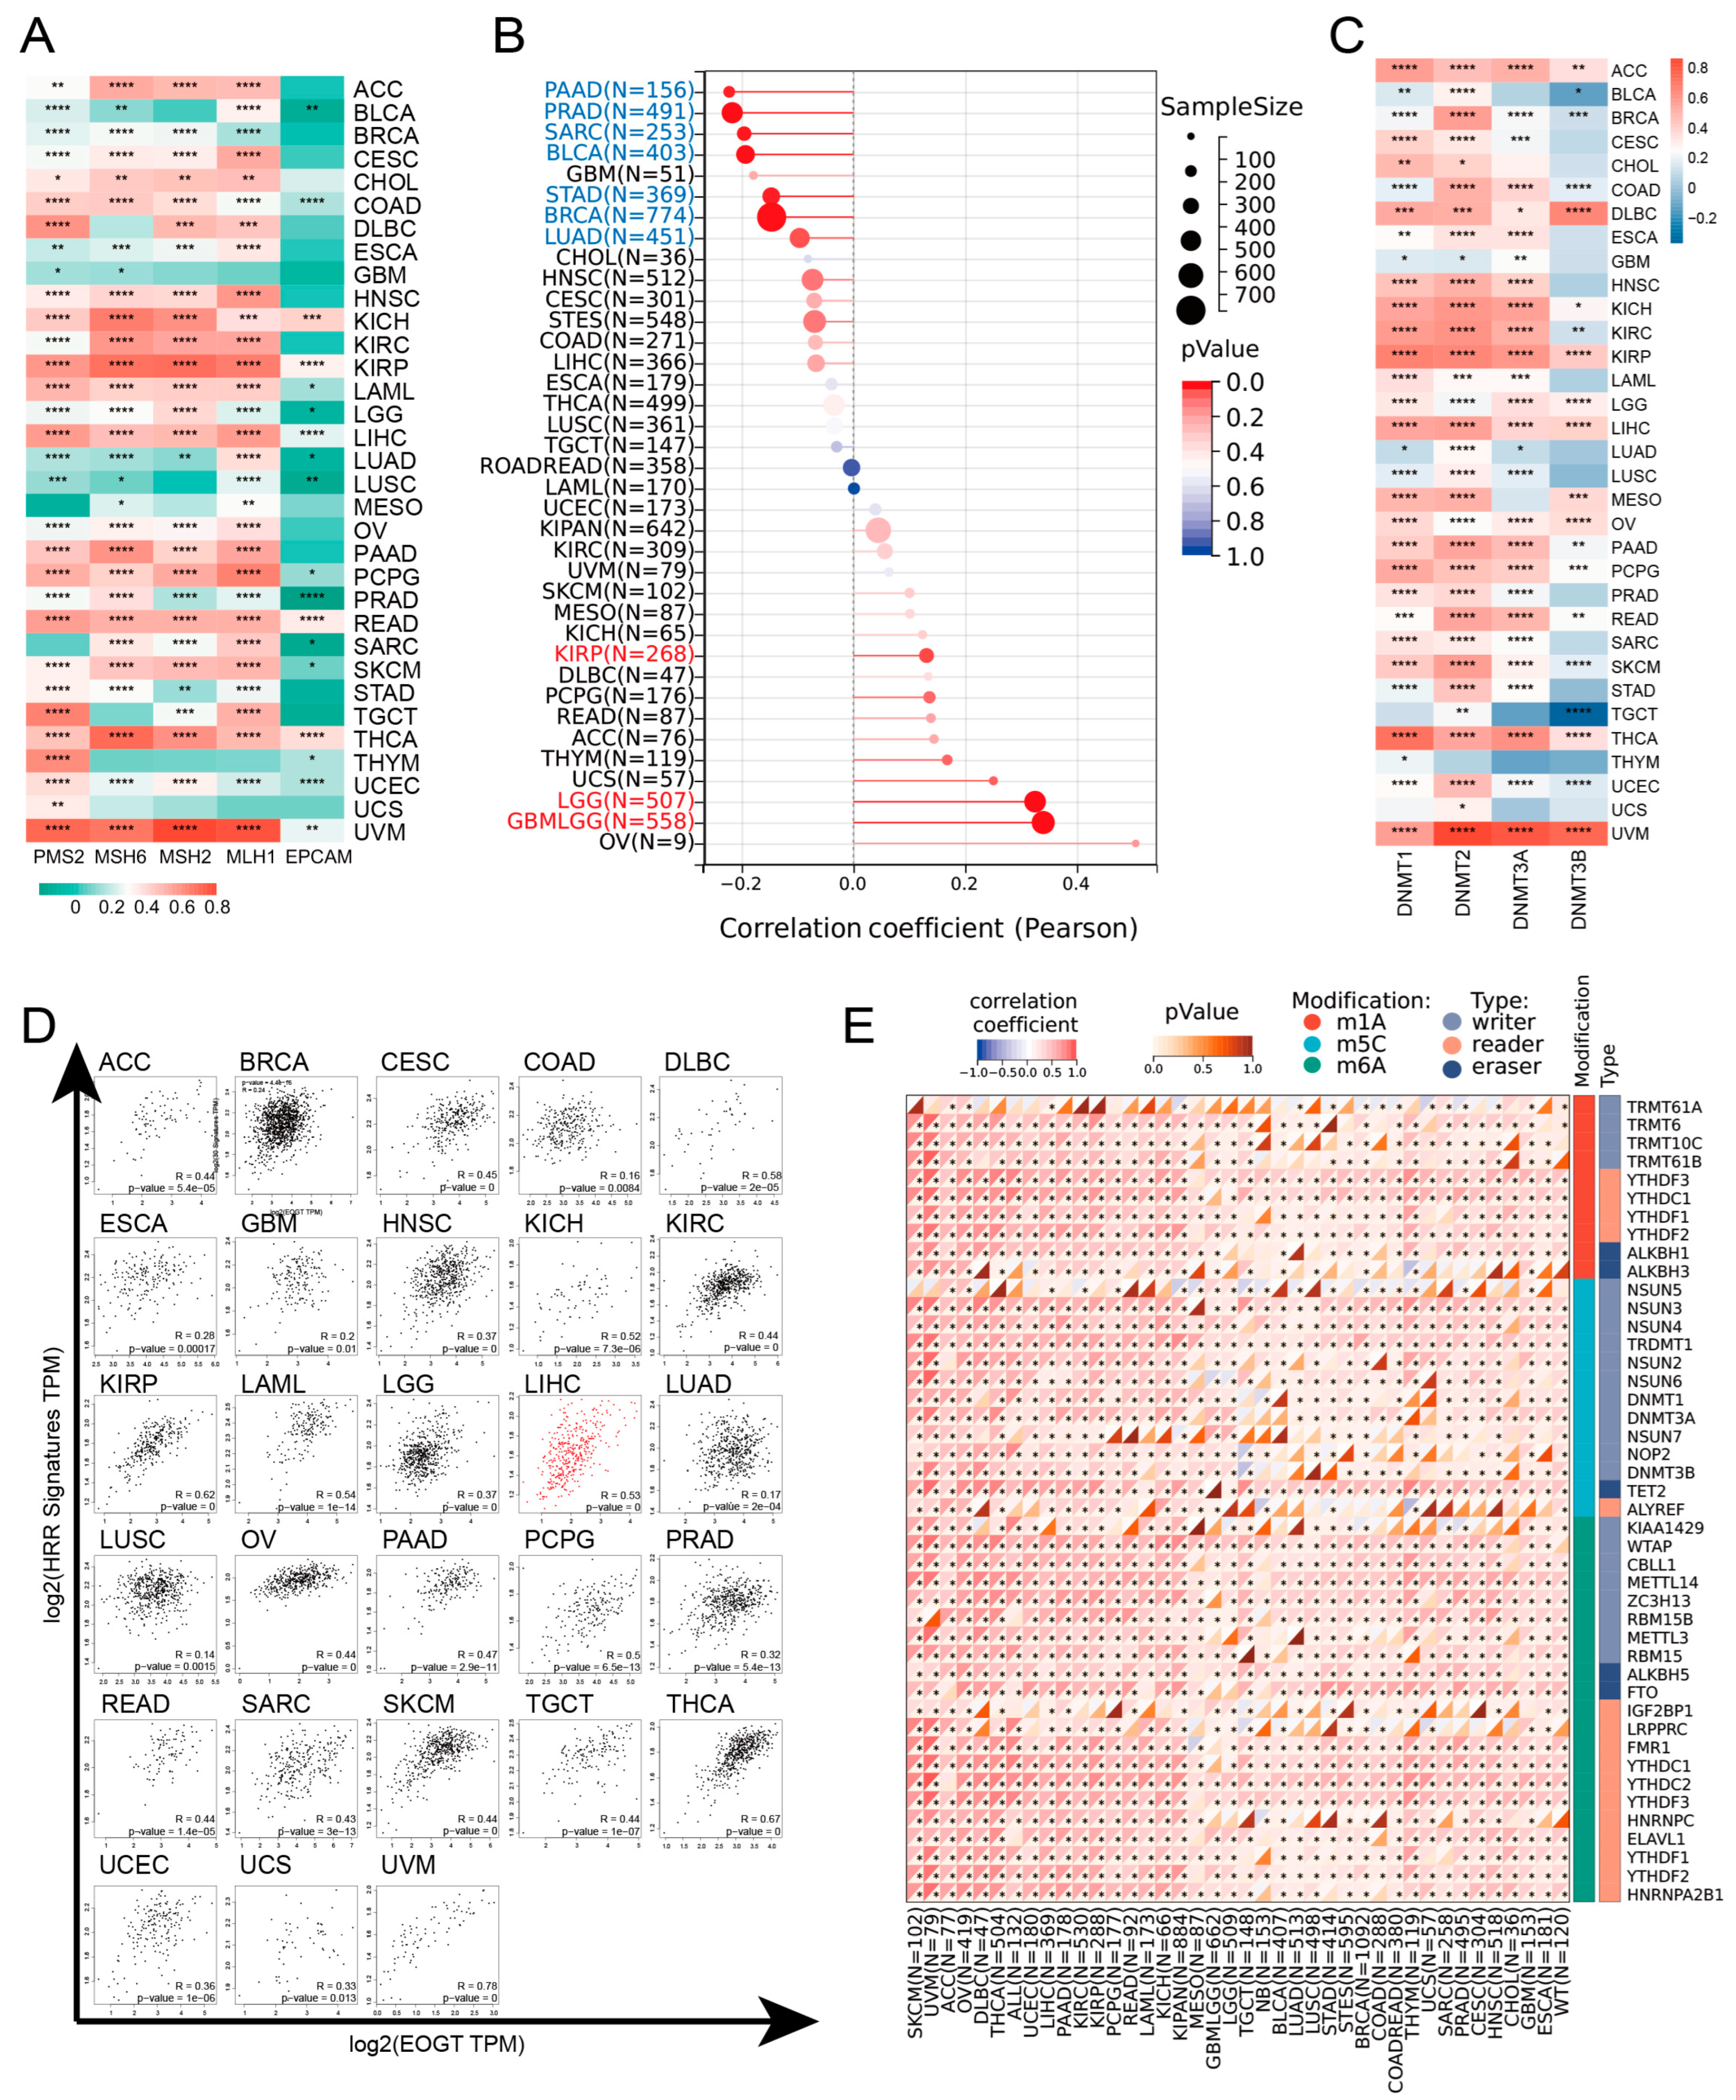
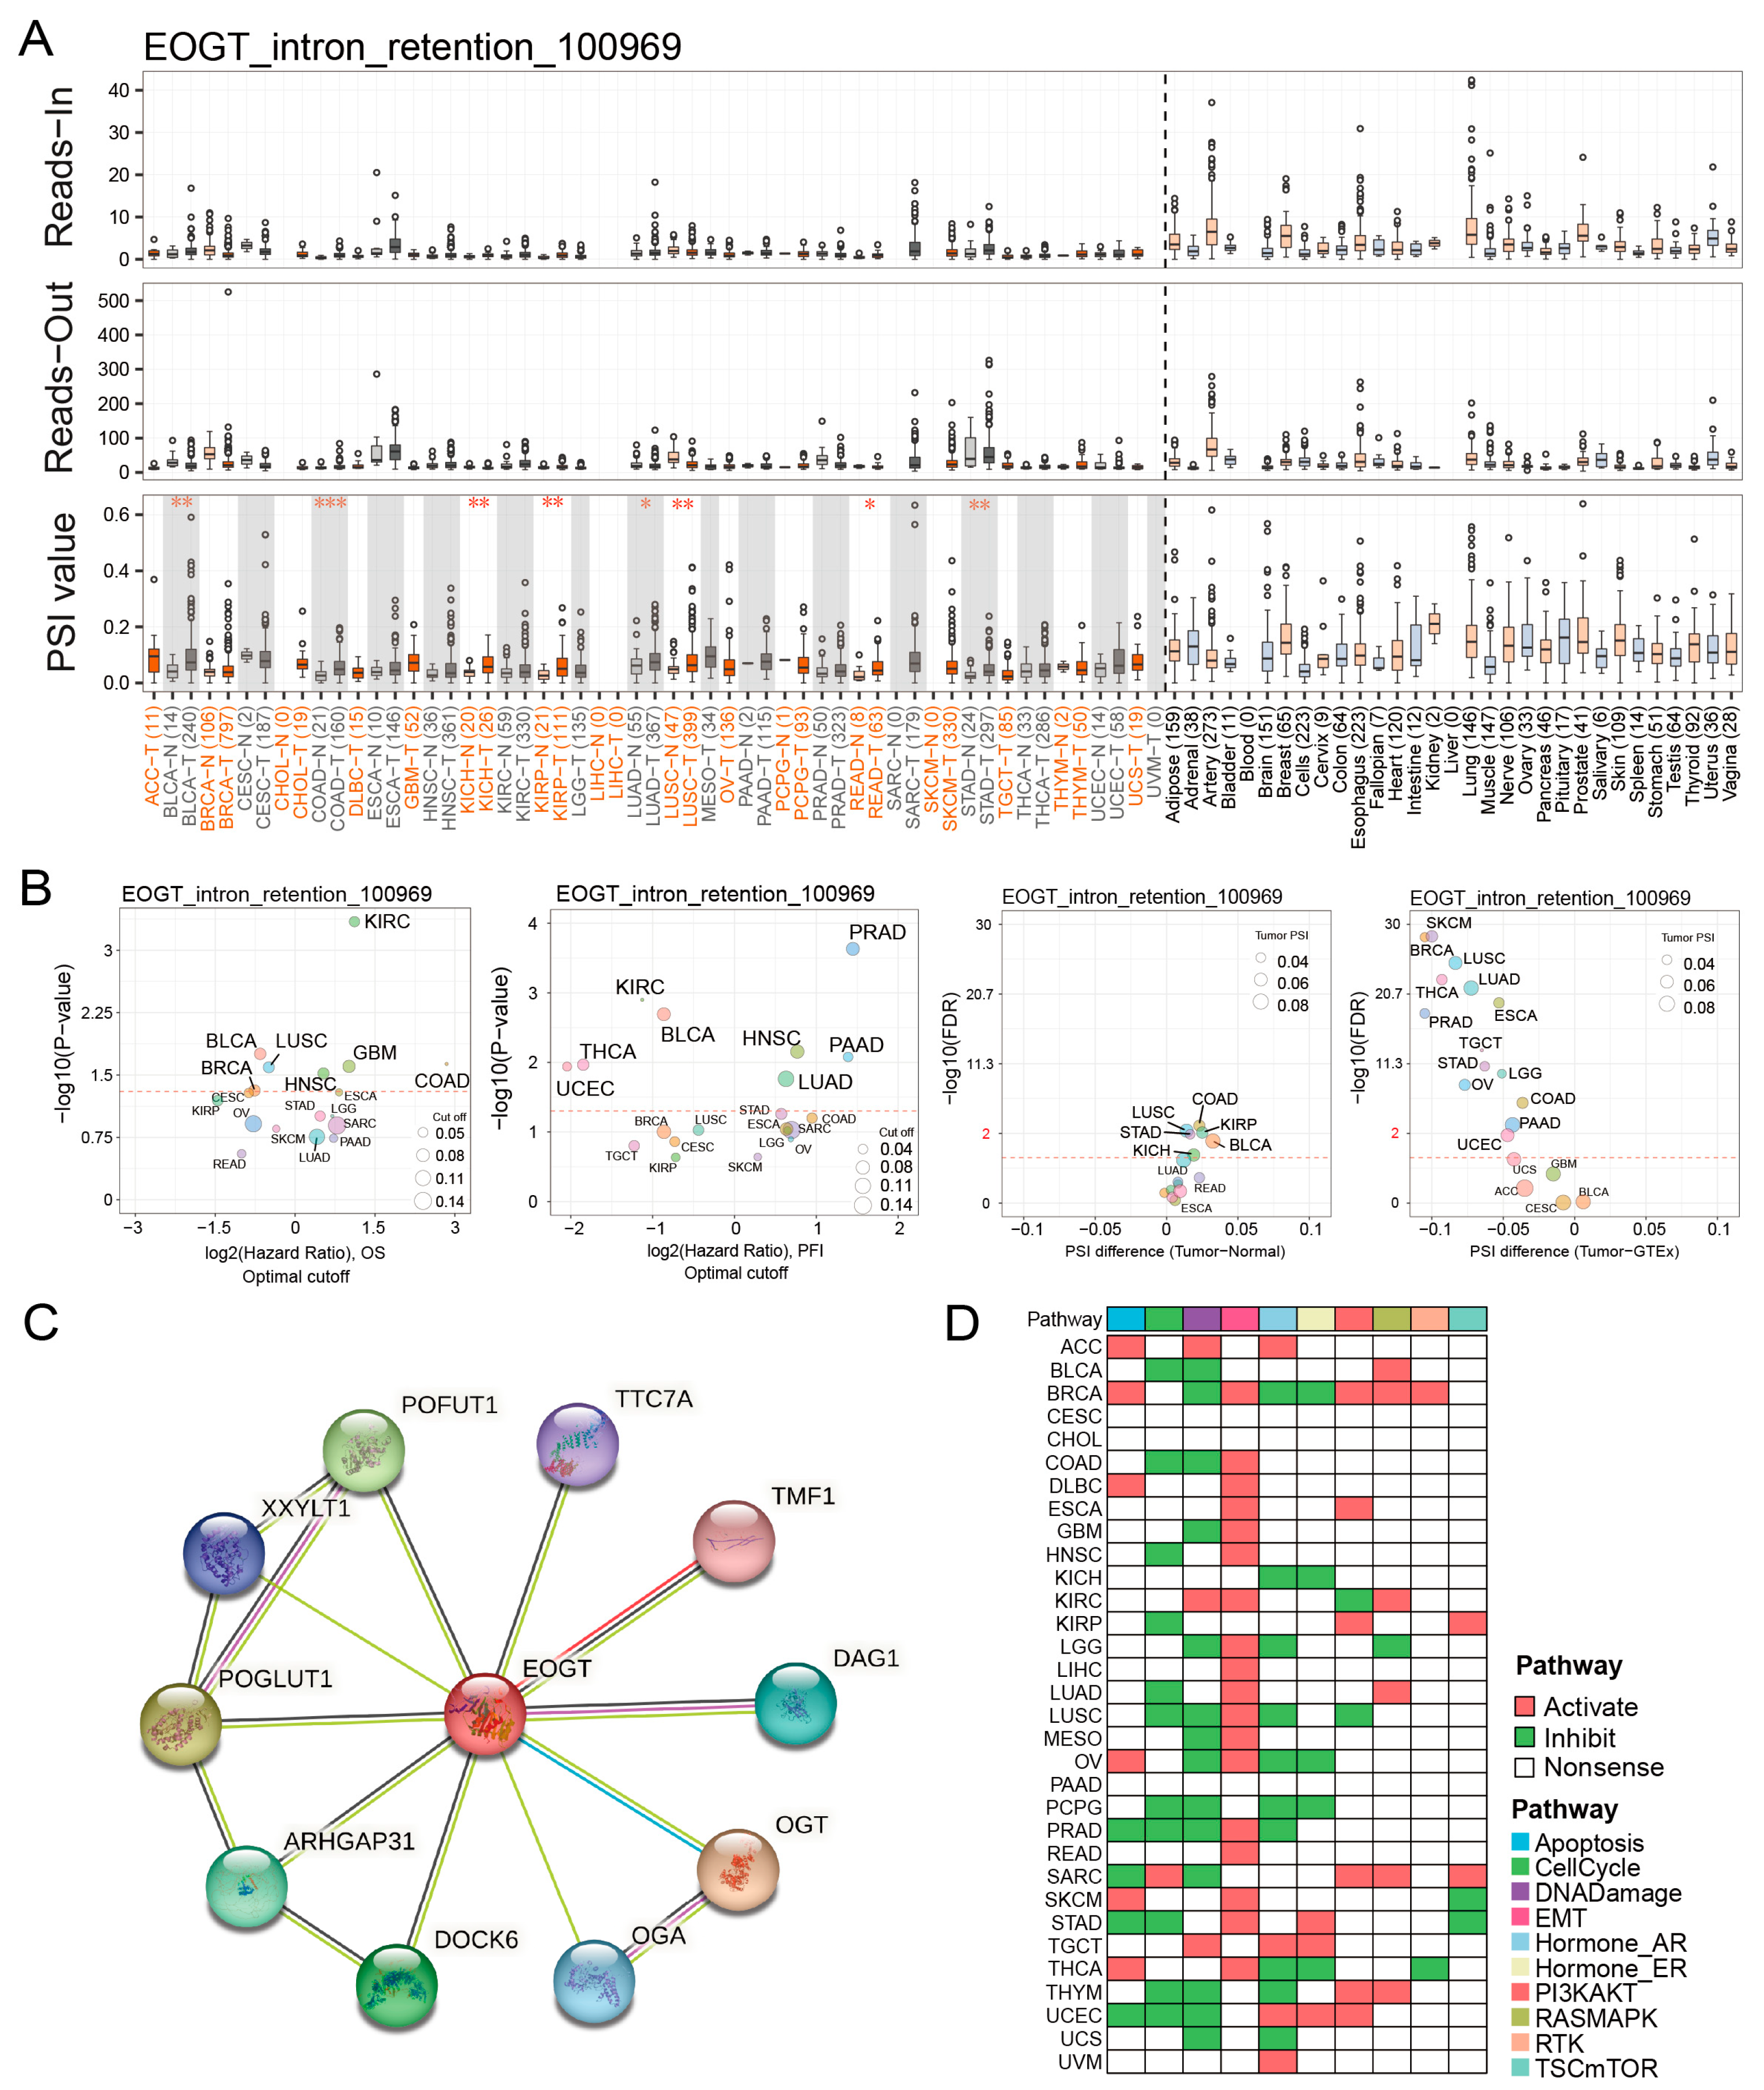
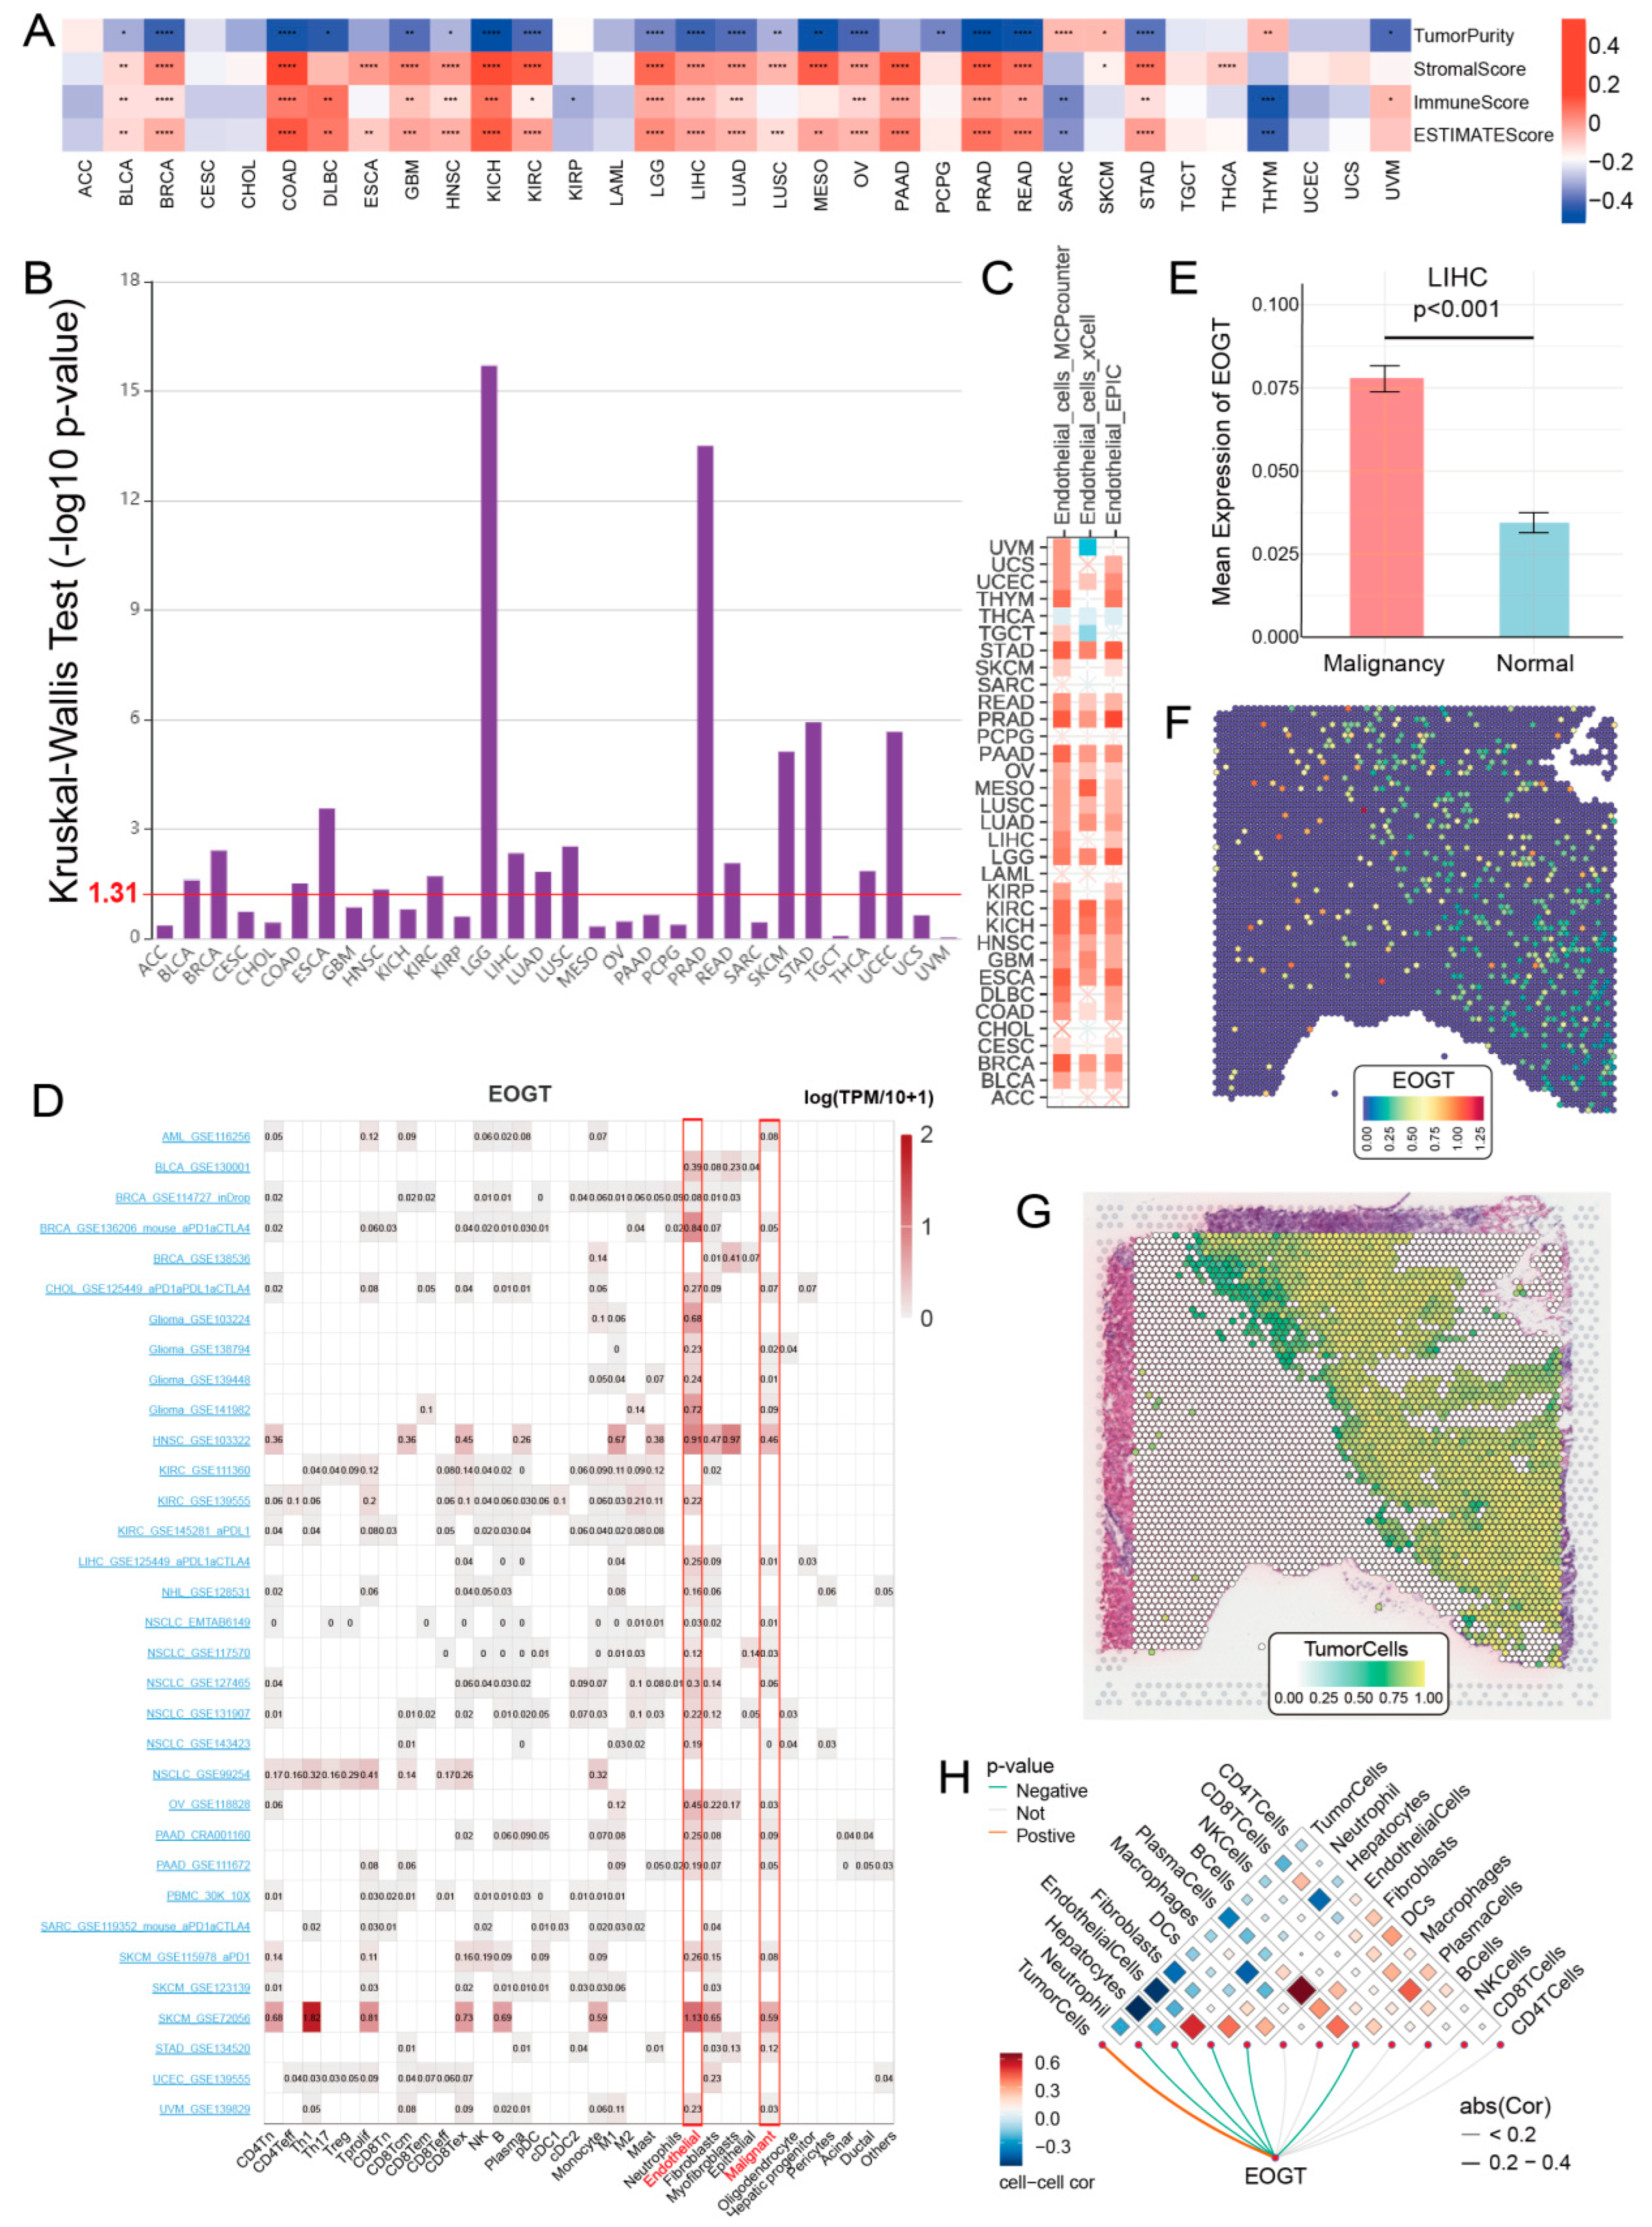

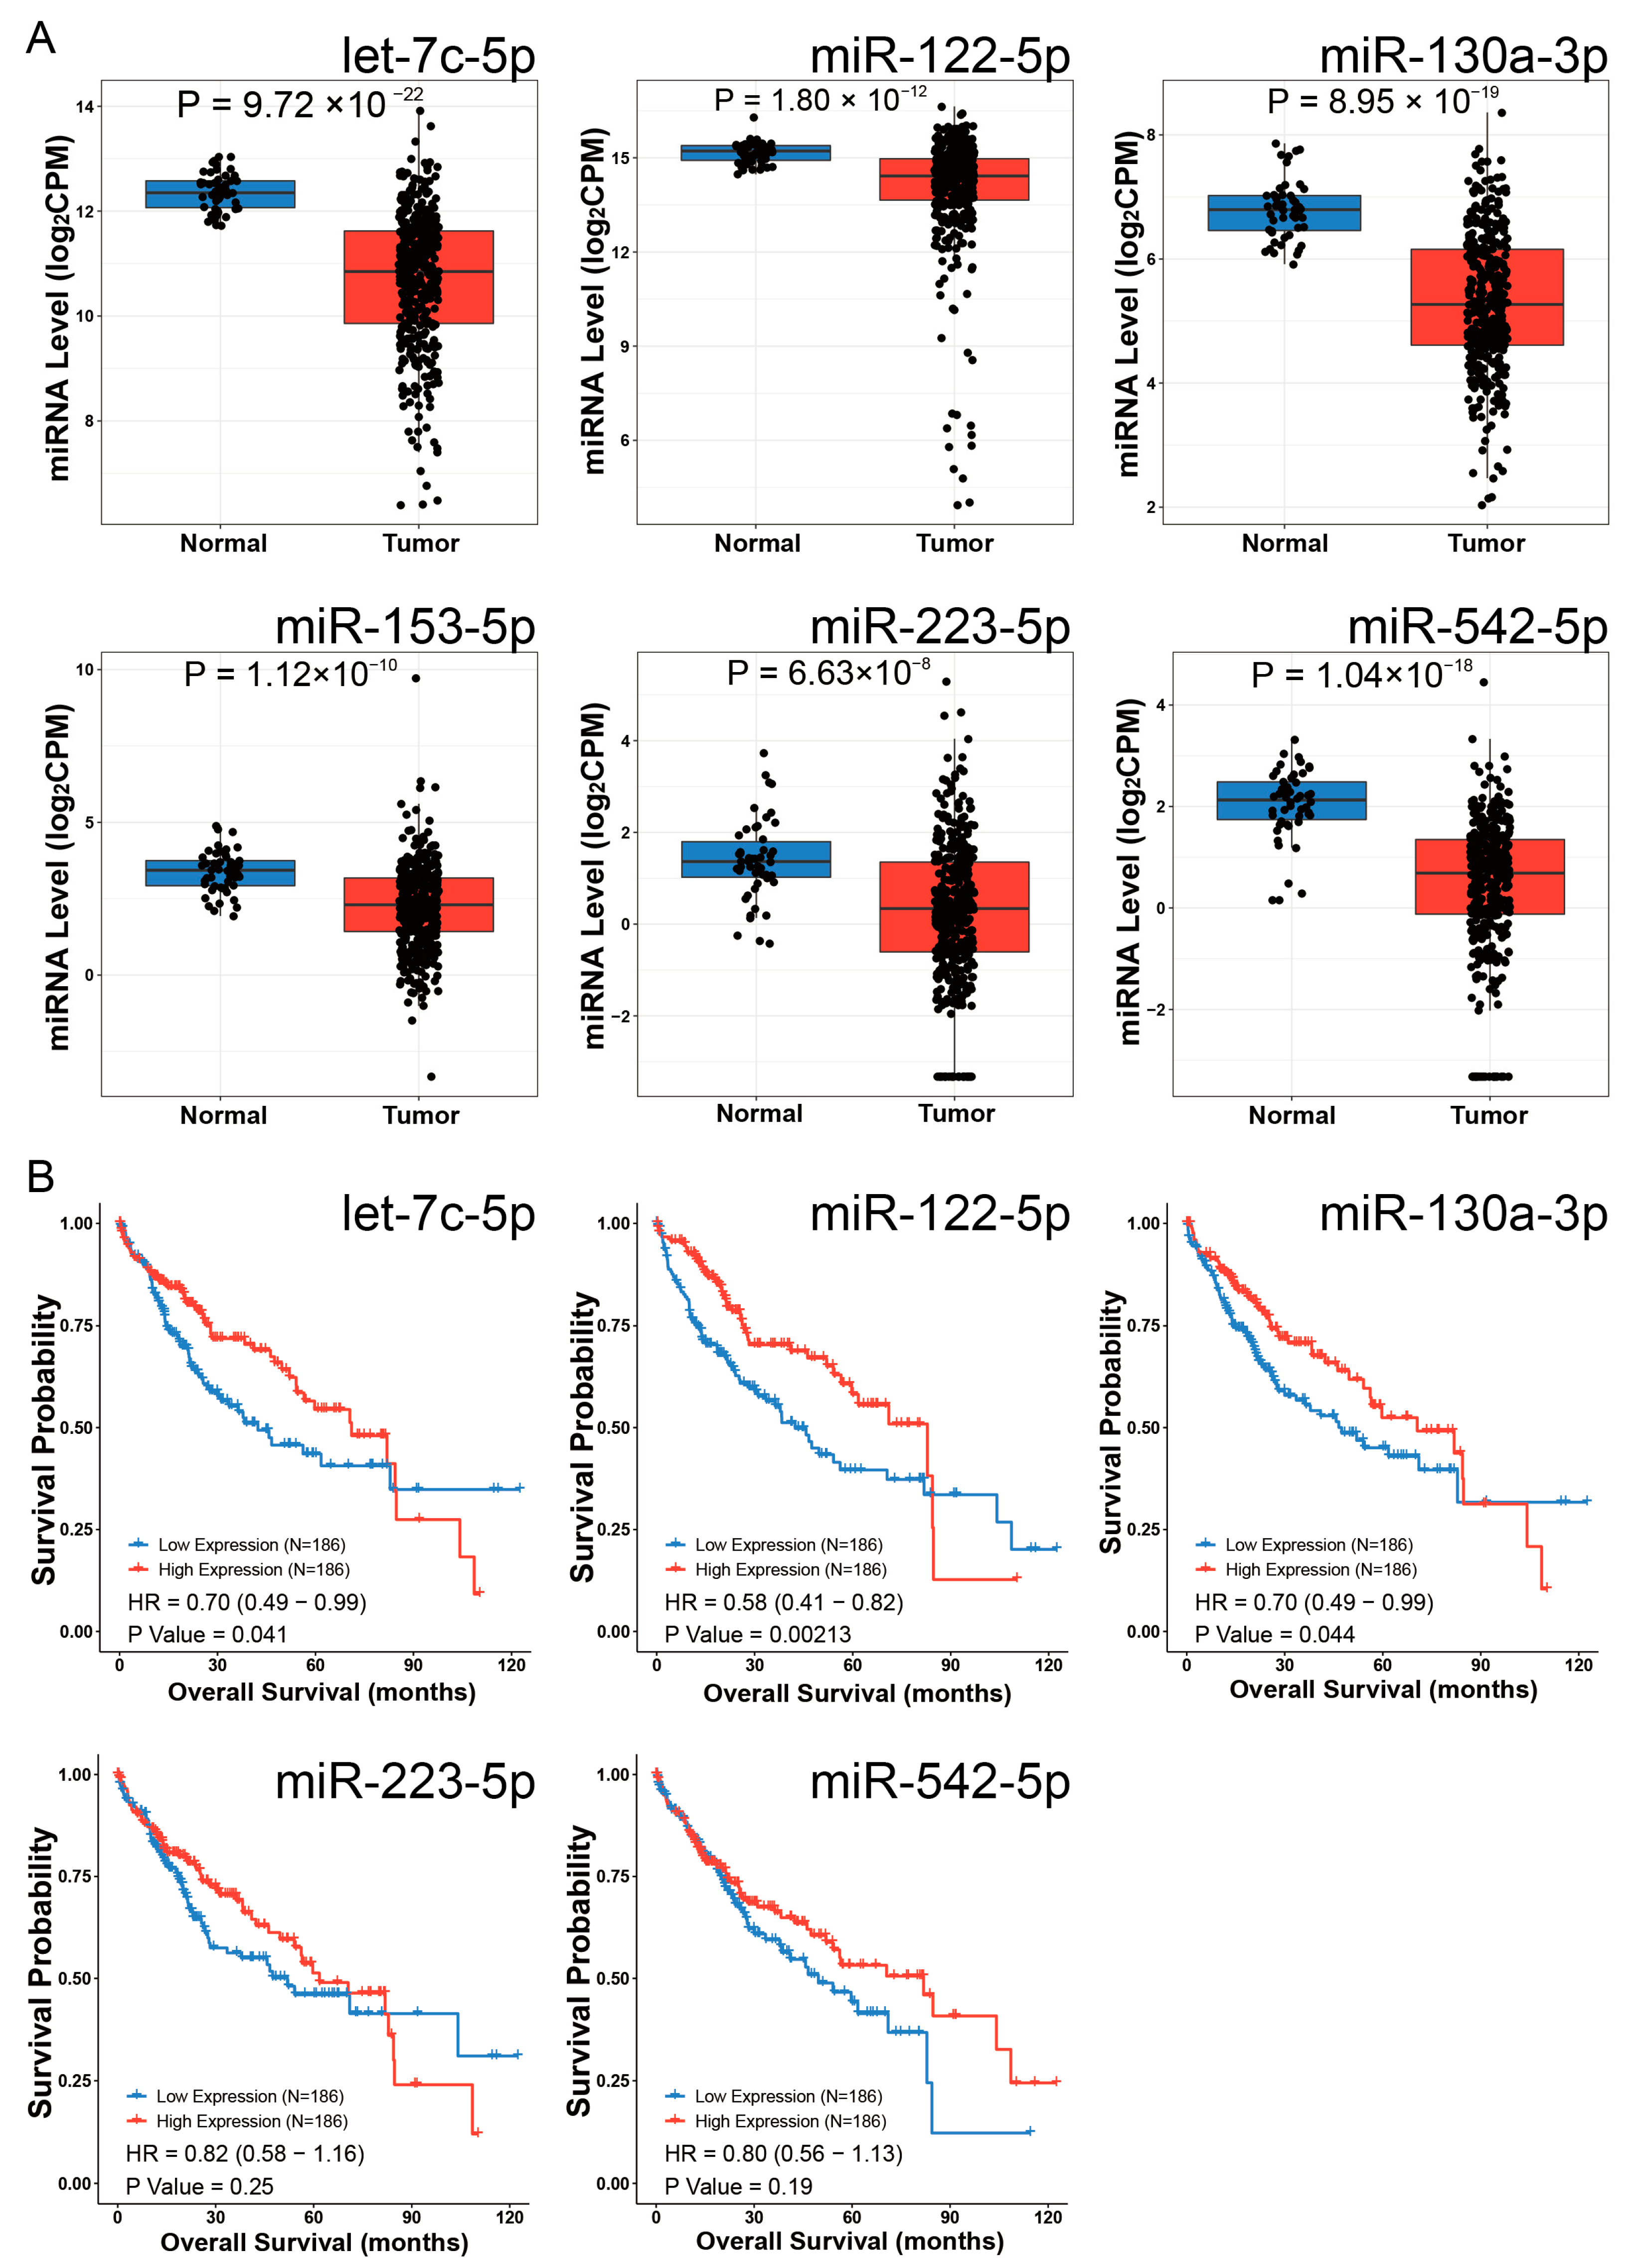
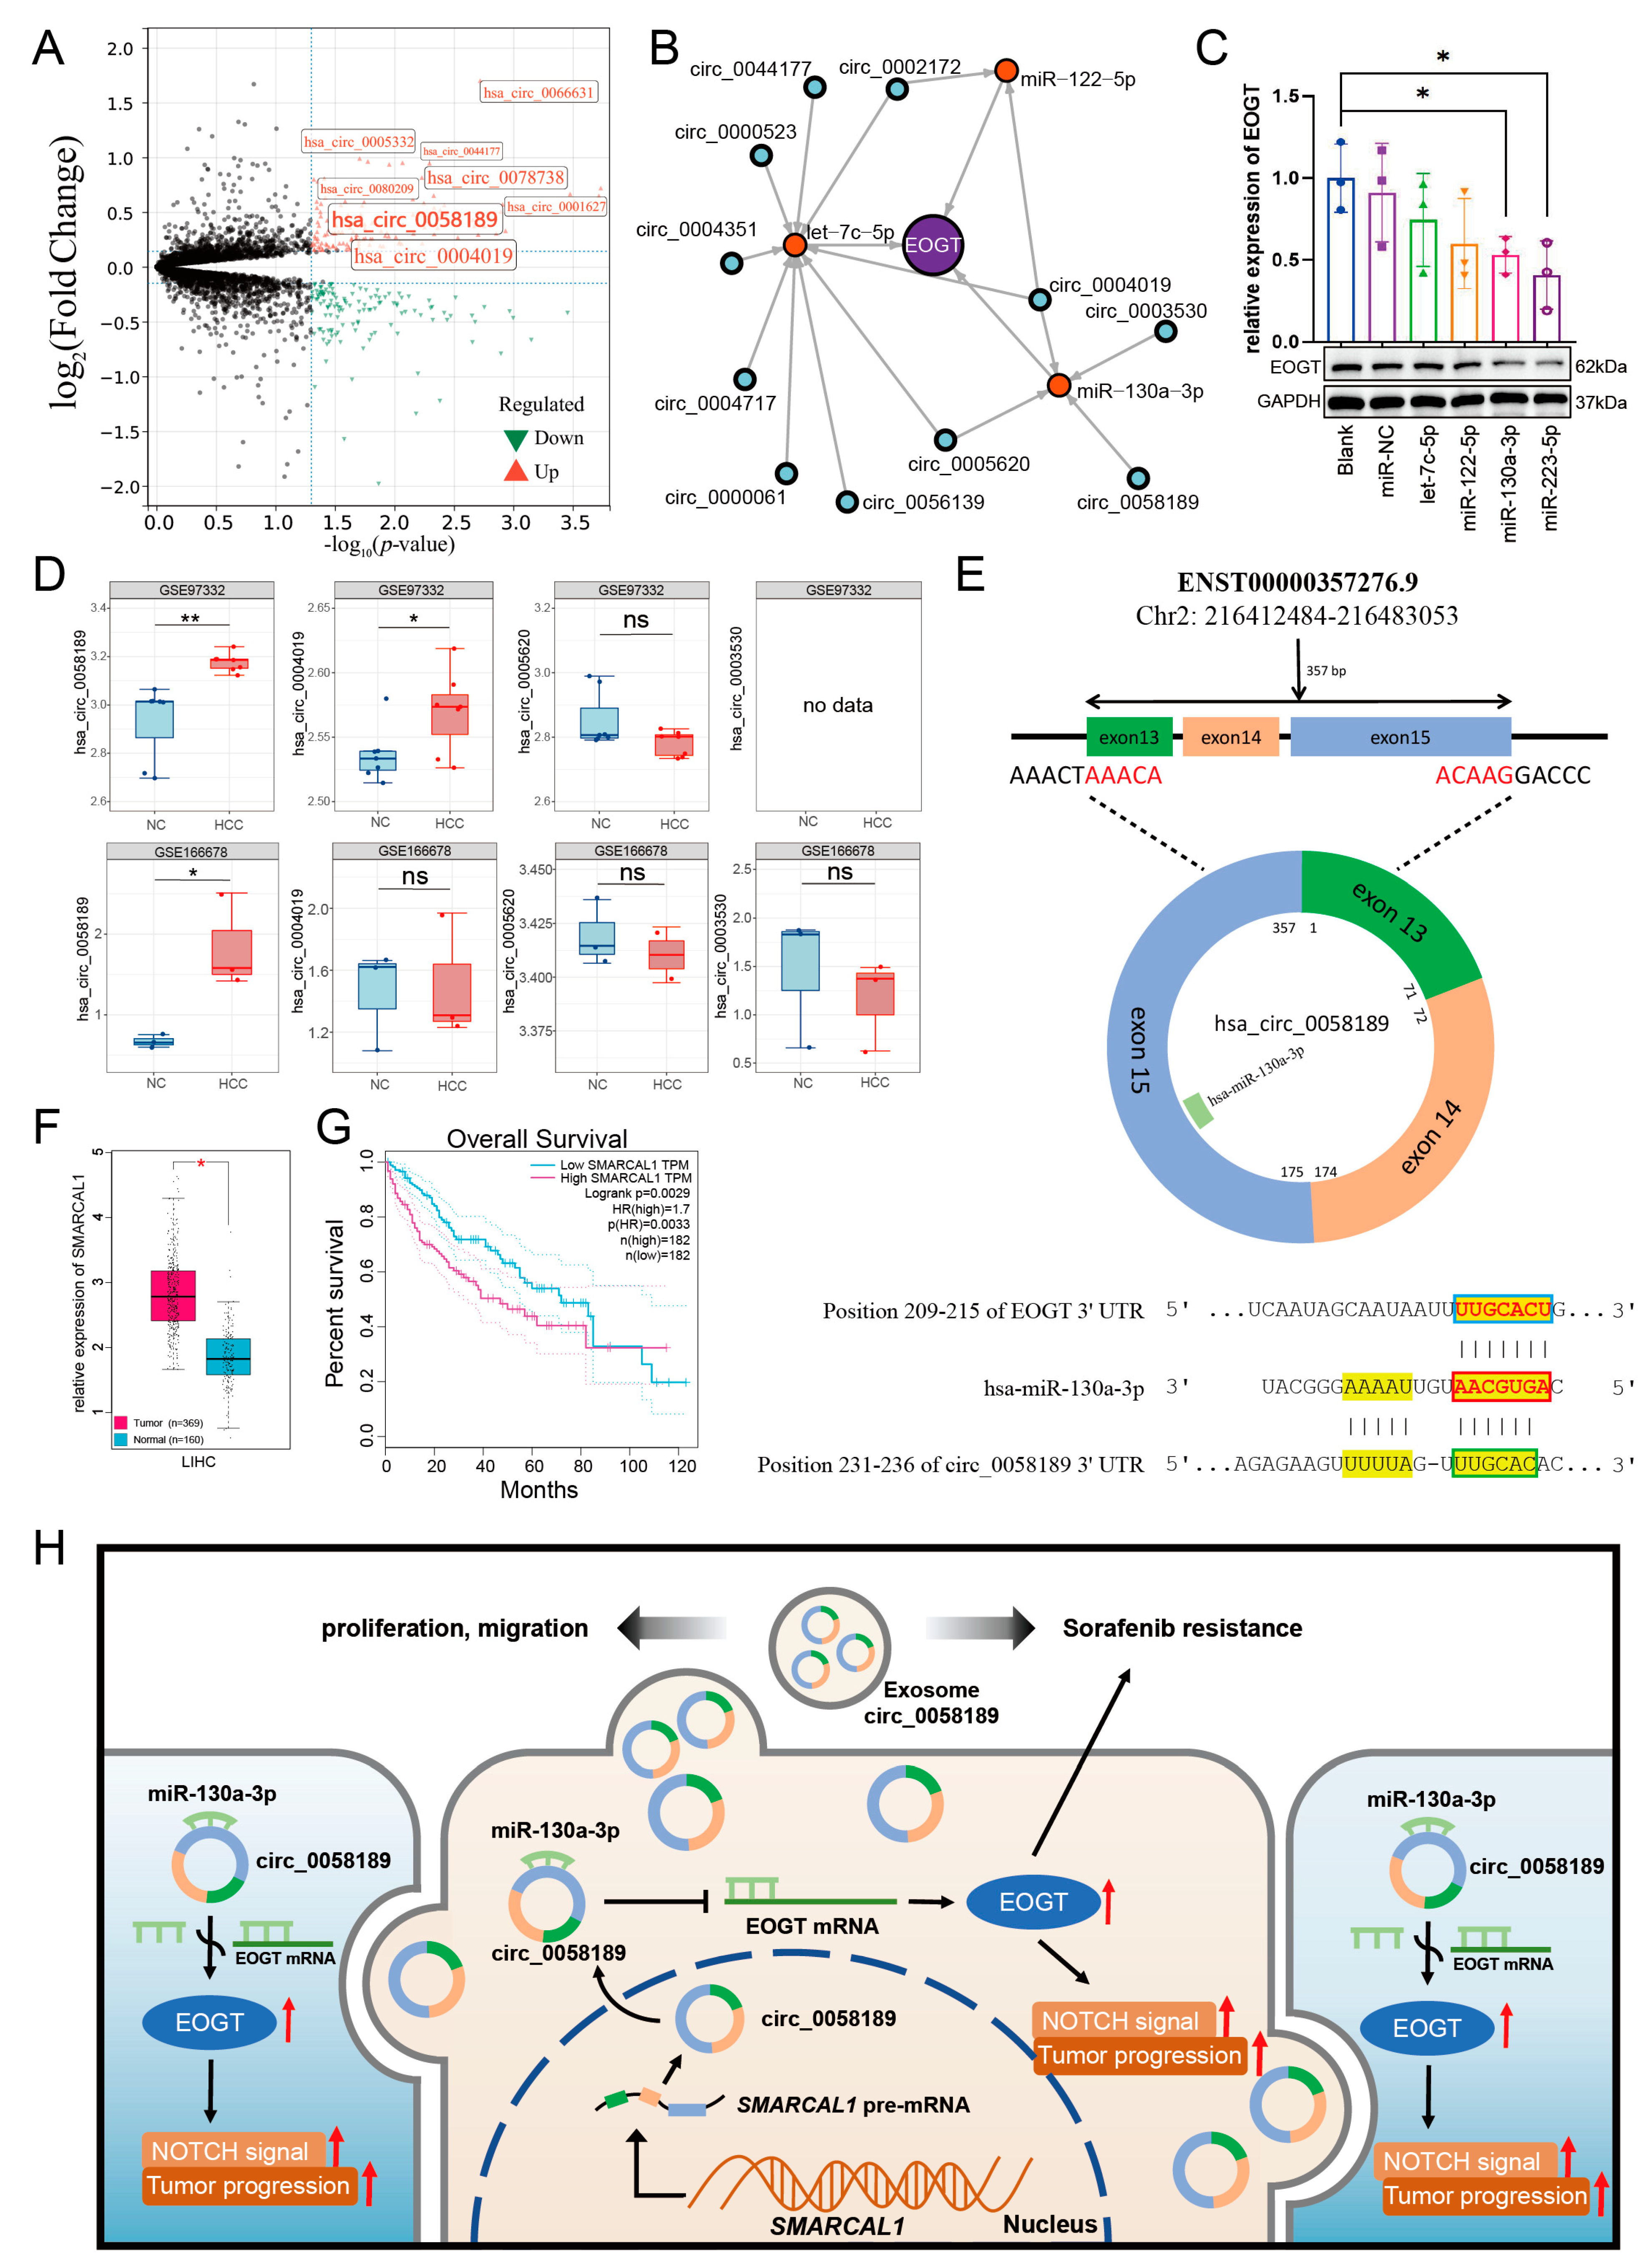
Disclaimer/Publisher’s Note: The statements, opinions and data contained in all publications are solely those of the individual author(s) and contributor(s) and not of MDPI and/or the editor(s). MDPI and/or the editor(s) disclaim responsibility for any injury to people or property resulting from any ideas, methods, instructions or products referred to in the content. |
© 2025 by the authors. Licensee MDPI, Basel, Switzerland. This article is an open access article distributed under the terms and conditions of the Creative Commons Attribution (CC BY) license (https://creativecommons.org/licenses/by/4.0/).