Article

Amnestic Mild Cognitive Impairment Does Not Alter Cerebrocortical Oxygenation Dynamics During Acute Hypoxia–Reoxygenation in Older Adults

1
Departments of Pharmacology and Neuroscience, University of North Texas Health Science Center, Fort Worth, TX 76107, USA
2
Departments of Internal Medicine, University of North Texas Health Science Center, Fort Worth, TX 76107, USA
3
Departments of Physiology and Anatomy, University of North Texas Health Science Center, Fort Worth, TX 76107, USA
*
Author to whom correspondence should be addressed.
Biomedicines 2025, 13(11), 2661; https://doi.org/10.3390/biomedicines13112661
Submission received: 10 September 2025 / Revised: 22 October 2025 / Accepted: 24 October 2025 / Published: 30 October 2025

Abstract

Background: This study examined the impact of amnestic mild cognitive impairment (aMCI) on dynamic changes in cerebrocortical oxygen saturation (ScO2) and O2 extraction during acute, moderately intense, normobaric hypoxia and reoxygenation in elderly adults (71 ± 6 years old). Methods: Thirty-two aMCI and thirty-five control subjects participated. Inspired and expired fractions of O2 and CO2 (mass spectrometry), arterial O2 saturation (SaO2) and prefrontal ScO2 (near-infrared spectroscopy), heart rate, tidal volume and breathing frequency were monitored while subjects breathed hypoxic air (fractional inspired O2 0.10) for 3–5 min (aMCI: 4.5 ± 0.7 min; control: 4.5 ± 0.6 min) and recovered on room air. Values at the pre-hypoxia baseline, the first and last min of hypoxia and the first min of recovery were compared within and between groups using two-factor ANOVA. Results: Despite a similar baseline SaO2 in aMCI (97.2 ± 1.6%) and control (97.3 ± 1.3%) subjects, prefrontal ScO2 was lower (p < 0.05) in the aMCI subjects in both the left (67.0 ± 1.7% vs. 69.6 ± 4.5%) and right (66.8 ± 4.6% vs. 69.4 ± 4.1%) hemispheres. Hypoxia similarly decreased SaO2 and ScO2 in both groups (last min hypoxia, aMCI vs. control subjects: SaO2 76.6 ± 5.3% vs. 77.4 ± 6.1%, left prefrontal ScO2 54.0 ± 4.9% vs. 55.2 ± 6.4%, right prefrontal ScO2 56.0 ± 4.3% vs. 58.2 ± 4.4%). Upon the resumption of room-air breathing, ScO2 recovered at similar rates in aMCI and control subjects. Conclusions: Although it produced a greater deoxygenation in the left vs. the right prefrontal cortex, acute, normobaric, moderate hypoxia was well tolerated by elderly adults, even those with aMCI. Dynamic changes in cerebral oxygenation during hypoxia and recovery were unaltered by aMCI. Brief, moderate hypoxia does not impose more intense cerebrocortical oxygen depletion in elderly adults with aMCI, despite pre-hypoxic cerebrocortical oxygenation below that of their non-MCI counterparts.

1. Introduction

Cerebral hemodynamic responses to acute hypoxia vs. reoxygenation proceed at different rates. Poulin et al. [1] demonstrated that the blood flow velocity of the middle cerebral artery (VMCA) monitored using a transcranial Doppler increased less rapidly when normobaric hypoxia was applied to the lower end-tidal partial pressure of O2 (PETO2) from 100 to 50 mmHg than it fell upon the resumption of room-air breathing. Using arterial spin labeling magnetic resonance spectroscopy, Harris et al. [2] confirmed that blood flows to gray matter changed more gradually and to a lesser extent during the room-air-to-hypoxia transition, when the mean arterial oxygen saturation (SaO2) stabilized at ~83% (with PETO2 at 52 mmHg) for 20 min, than during the reverse process. Since increases in cerebral blood flow during hypoxic exposures are mediated by the cerebral vasodilatory response to hypoxemia and cerebral tissue hypoxia [3,4,5,6,7], we postulated that the dynamic responses of cerebral tissue oxygenation, like those of cerebral blood flow, would proceed at different rates at the onset of acute hypoxic exposure vs. recovery on room air. However, data comparing the dynamic responses of cerebral tissue oxygenation (ScO2) during on-and-off phases of hypoxia are scant. Accordingly, this study examined prefrontal cortical ScO2 responses during acute hypoxia vs. room-air reoxygenation.
Mounting evidence suggests that cerebral blood flow is reduced in humans with mild cognitive impairments, i.e., MCI [8,9,10]. Furthermore, Tarumi et al. reported [11] that prefrontal cortical ScO2 was lower in subjects with MCI than their cognitively normal counterparts. Murayama et al. [12] examined 113 older adults with cognitive functions ranging from normal to severe impairment and found a direct correlation between mini-mental state examination (MMSE) scores and prefrontal ScO2. In our recent report, ScO2 responses to either mental or physical challenges were similar in older adults with vs. without MCI, although the baseline ScO2 tended to be lower in the MCI subjects [13]. However, whether MCI might affect ScO2 responses differently during de- vs. reoxygenation is not known.
Normobaric hypoxic exposures have been proposed as an intervention to slow or prevent cognitive decline in elderly adults [14,15]. Studies in rodents have identified several mechanisms whereby hypoxia may benefit cognitive functions. Hypoxia induced hippocampal neurogenesis in adult rats modeling depression [16] and elicited the cerebrocortical expression of erythropoietin and brain-derived neurotrophic factor in transgenic mice modeling Alzheimer’s disease [17]. Hypoxia also suppressed hippocampal amyloid β (Aβ) plaque formation and pro-inflammatory cytokine expression in transgenic mice and streptozotocin-injected rats modeling Alzheimer’s disease [18,19]. The clinical translation of these studies requires knowledge of the acute effects of hypoxia and reoxygenation on cerebral tissue oxygenation and cardiopulmonary responses in older adults with vs. without cognitive impairments. Accordingly, this study compared ScO2 response rates at the onsets of acute hypoxia and recovery in older adults with vs. without amnestic MCI (aMCI).
This study tested the hypothesis that breathing moderately hypoxic gas (10% O2) does not produce more severe cerebrocortical O2 depletion in elderly adults with aMCI vs. their cognitively normal counterparts, despite the lower cerebrocortical oxygenation before hypoxia in the aMCI subjects. SaO2 and bilateral ScO2 in the prefrontal cortex were monitored concurrently with inspired and expired O2 and CO2 fractions and minute ventilation, while the subjects breathed 10% O2 for up to 5 min of acute normobaric hypoxia and then recovered while breathing room air. We also hypothesized that the decline in ScO2 at the onset of hypoxia is more gradual than ScO2 recovery following the resumption of room-air breathing, both in elderly adults with aMCI and cognitively normal elderly subjects.

2. Materials and Methods

2.1. Study Participants

A total of 32 subjects with aMCI (24 women) and 35 non-MCI control subjects (28 women) were recruited from the Fort Worth area and signed informed consent to participate in the study. The study protocol was reviewed and approved by the North Texas Regional Institutional Review Board for Protection of Human Subjects. After physical screening and an orientation visit to the laboratory, all participants underwent a clinical dementia rating (CDR) evaluation and a battery of neurocognitive function tests including verbal memory and visuospatial memory tests conducted by a geriatric neuropsychologist or psychiatrist in the Geriatric Center at UNT Health Science Center [20]. Amnestic MCI was assessed from the consensus criteria [21,22]. Briefly, subjects were considered to have aMCI if they had a self- or family member-reported memory complaint, a clinical dementia rating ~0.5 and at least one memory testing score more than one standard deviation below the age- and education-adjusted normal group mean, but with normal daily living functionality and no dementia. Neither age nor educational attainment differed between the groups, and the groups had similar medication histories (Table 1).

2.2. Study Protocol

During the pre-testing orientation, the testing procedures and instrumentation were explained to and experienced by all subjects. Subjects breathed through air-cushioned disposable facemasks (VacuMed, Ventura, CA, USA) which were fitted to cover the nose and mouth and connected through a Universal Ventilation Meter (UVM; VacuMed, Ventura, CA, USA) to a one-way Hans Rudolph T-tube (Model 2100 VacuMed, Ventura, CA, USA). The inlet of the T-tube was connected to a three-way valve (VacuMed, Ventura, CA, USA), which controlled inflow from the room air or a balloon containing 10% O2 (balance N2). Subjects who could not tolerate the facemask or had cardiac rhythm abnormalities during orientation were released from the study. During the experiment, subjects breathed poikilocapnic, normobaric hypoxic gas for 5 min or until SaO2 fell below 70% for ≥5 s and/or heart rate (HR) increased by ≥30 beats/min—whichever came first. The lab was maintained at 735–745 mmHg barometric pressure, 50–58% relative humidity and 23 ± 1 °C room temperature.

2.3. Measurements

During the test, breath-by-breath inspired and expired fractions of O2 and CO2, collected through a capillary embedded in the proximal inlet of the UVM were analyzed continuously using a mass spectrometer (Perkin-Elmer, 1100 Medical Gas Analyzer, St. Louis, MO, USA) with minimum delay (~0.1 s). Analog signals of breath-by-breath inspiratory tidal volume (TV) and breathing frequency (fBr) monitored by the UVM were recorded. The UVM was calibrated using a 3-liter calibration syringe (VacuMed, Ventura, CA, USA) for flow rate and the mass spectrometer was calibrated against a medical gas containing 5% CO2 and 20% O2 (balance N2). Heart rate was continuously monitored using three-lead electrocardiography (BIOPAC Model ECG100C, Santa Barbara, CA, USA). Double finger cuffs placed on the proximal phalanges of the index and middle fingers of the non-dominant hand (CNAP 500, Graz, Austria) detected beat-to-beat systolic (SP) and diastolic (DP) arterial pressures. Mean arterial pressure (MAP) was computed off-line as one-third of SP plus two-thirds of DP.
Systemic arterial O2 saturation (SaO2) was monitored in the right earlobe by a transcutaneous sensor (TOSCA 500, Radiometer America Inc., Westlake, OH, USA) maintained at 42 °C to dilate and thereby arterialize the cutaneous capillary blood in the earlobe. Cerebral tissue O2 saturation (ScO2) of the prefrontal cortex was monitored using NIRS (NIRO-200, Hamamatsu Photonics, Bridgewater, NJ, USA) with a pair of sensors placed on the subject’s forehead at an analog signal output of 1 Hz. All measurements were carried out with the subject in supine position. Analog data were continuously digitized on-line at 250 Hz by a computer interfaced with a data acquisition system (MP150 BIOPAC, Santa Barbara, CA, USA).
After instrumentation and ≥20 min supine relaxation, baseline values were taken, and then hypoxic ventilation (10% O2) was initiated. The duration of hypoxic ventilation did not differ (p = 0.825) in the aMCI (273 ± 43 s; 180–300 s) vs. control subjects (271 ± 37 s; 185–300 s). Figure 1 presents a typical recording of the monitored variables during the experiment.

2.4. Data Analysis and Statistics

A ~60 s segment of continuous, stable analog data collected before hypoxic exposure was averaged to obtain baseline values (designated Base). Data collected at 30–60 s of the first and last minutes of hypoxic exposure (designated H-1 and H-2) and the first min of recovery (designated Rec) were averaged to represent the values at the respective experimental stages (see Figure 1), as in previous studies [23,24,25]. Additional 60 s segments were extracted after the initial ~30 s of breathing 10% O2 gas, i.e., after equilibration of hypoxic gas in the facemask, and during the 1st min of room-air breathing after hypoxia (Figure 1). Data from consecutive 10 s intervals of these segments were averaged, and the slopes of the least-squares regressions were computed, yielding the de- and reoxygenation response rates. Partial pressures of end-tidal O2 (PETO2) and CO2 (PETCO2) were estimated from expired fractions of O2 and CO2 multiplied by the ambient barometric pressure. Left and right prefrontal cortical oxygen extraction fractions (O2EF) equaled (SaO2–ScO2)/SaO2.
Frequencies of categorical variables in the aMCI and control groups were compared with Fisher’s exact test for two-tailed probability. Scalar variables of basic characteristics in the two groups (Table 1) were compared using Student’s t-test for two independent groups. Group data at different timepoints were analyzed with two-factor ANOVA to assess the impacts of group and time factors. ScO2 slopes (i.e., ΔScO2/s) during de- and reoxygenation were calculated from least-square linear regression. Three-factor ANOVA was applied to compare ΔScO2/s slopes in aMCI vs. control groups, de- vs. reoxygenation phases and left vs. right cerebral hemispheres during the first 60 s of hypoxia and room-air recovery. Post hoc analysis with Tukey’s Studentized Range test was applied to factors identified as statistically significant through ANOVA.
Numerical values are reported as group means ± standard deviation (SD) of the means. Pearson correlation coefficients were determined for the associations between ScO2 and O2EF, and a general linear model procedure was applied for the interaction of group and cerebral hemisphere factors on the association. Statistical significance was accepted at p-values ≤ 0.05. Statistical analyses were performed with Statistical Analysis System software (SAS Version 9.4, Cary, NC, USA).

3. Results

3.1. Cardiopulmonary Responses to Hypoxia and Reoxygenation

During hypoxia, the MAP tended to decrease (time factor p = 0.033), while the HR increased as expected (time factor p < 0.0001). At 60 s of recovery, neither the MAP nor the HR differed significantly from the respective baselines. Ventilatory responses to hypoxia and reoxygenation were similar in the aMCI and control subjects. The tidal volume trended upward (time factor p = 0.037), and breathing frequency increased marginally (time factor p = 0.055) during hypoxia, while minute ventilation increased as expected (time factor p < 0.0001), producing hypocapnia, indicated by a reduced PETCO2 (time factor p < 0.0001). Although breathing frequency during hypoxia trended higher in the aMCI vs. control subjects (group factor p = 0.004), the post hoc analysis did not reveal a statistical significance at any timepoint. During the recovery, minute ventilation fell below the baseline in the control subjects (Table 2).

3.2. Cerebrocortical Oxygenation During Hypoxia and Reoxygenation

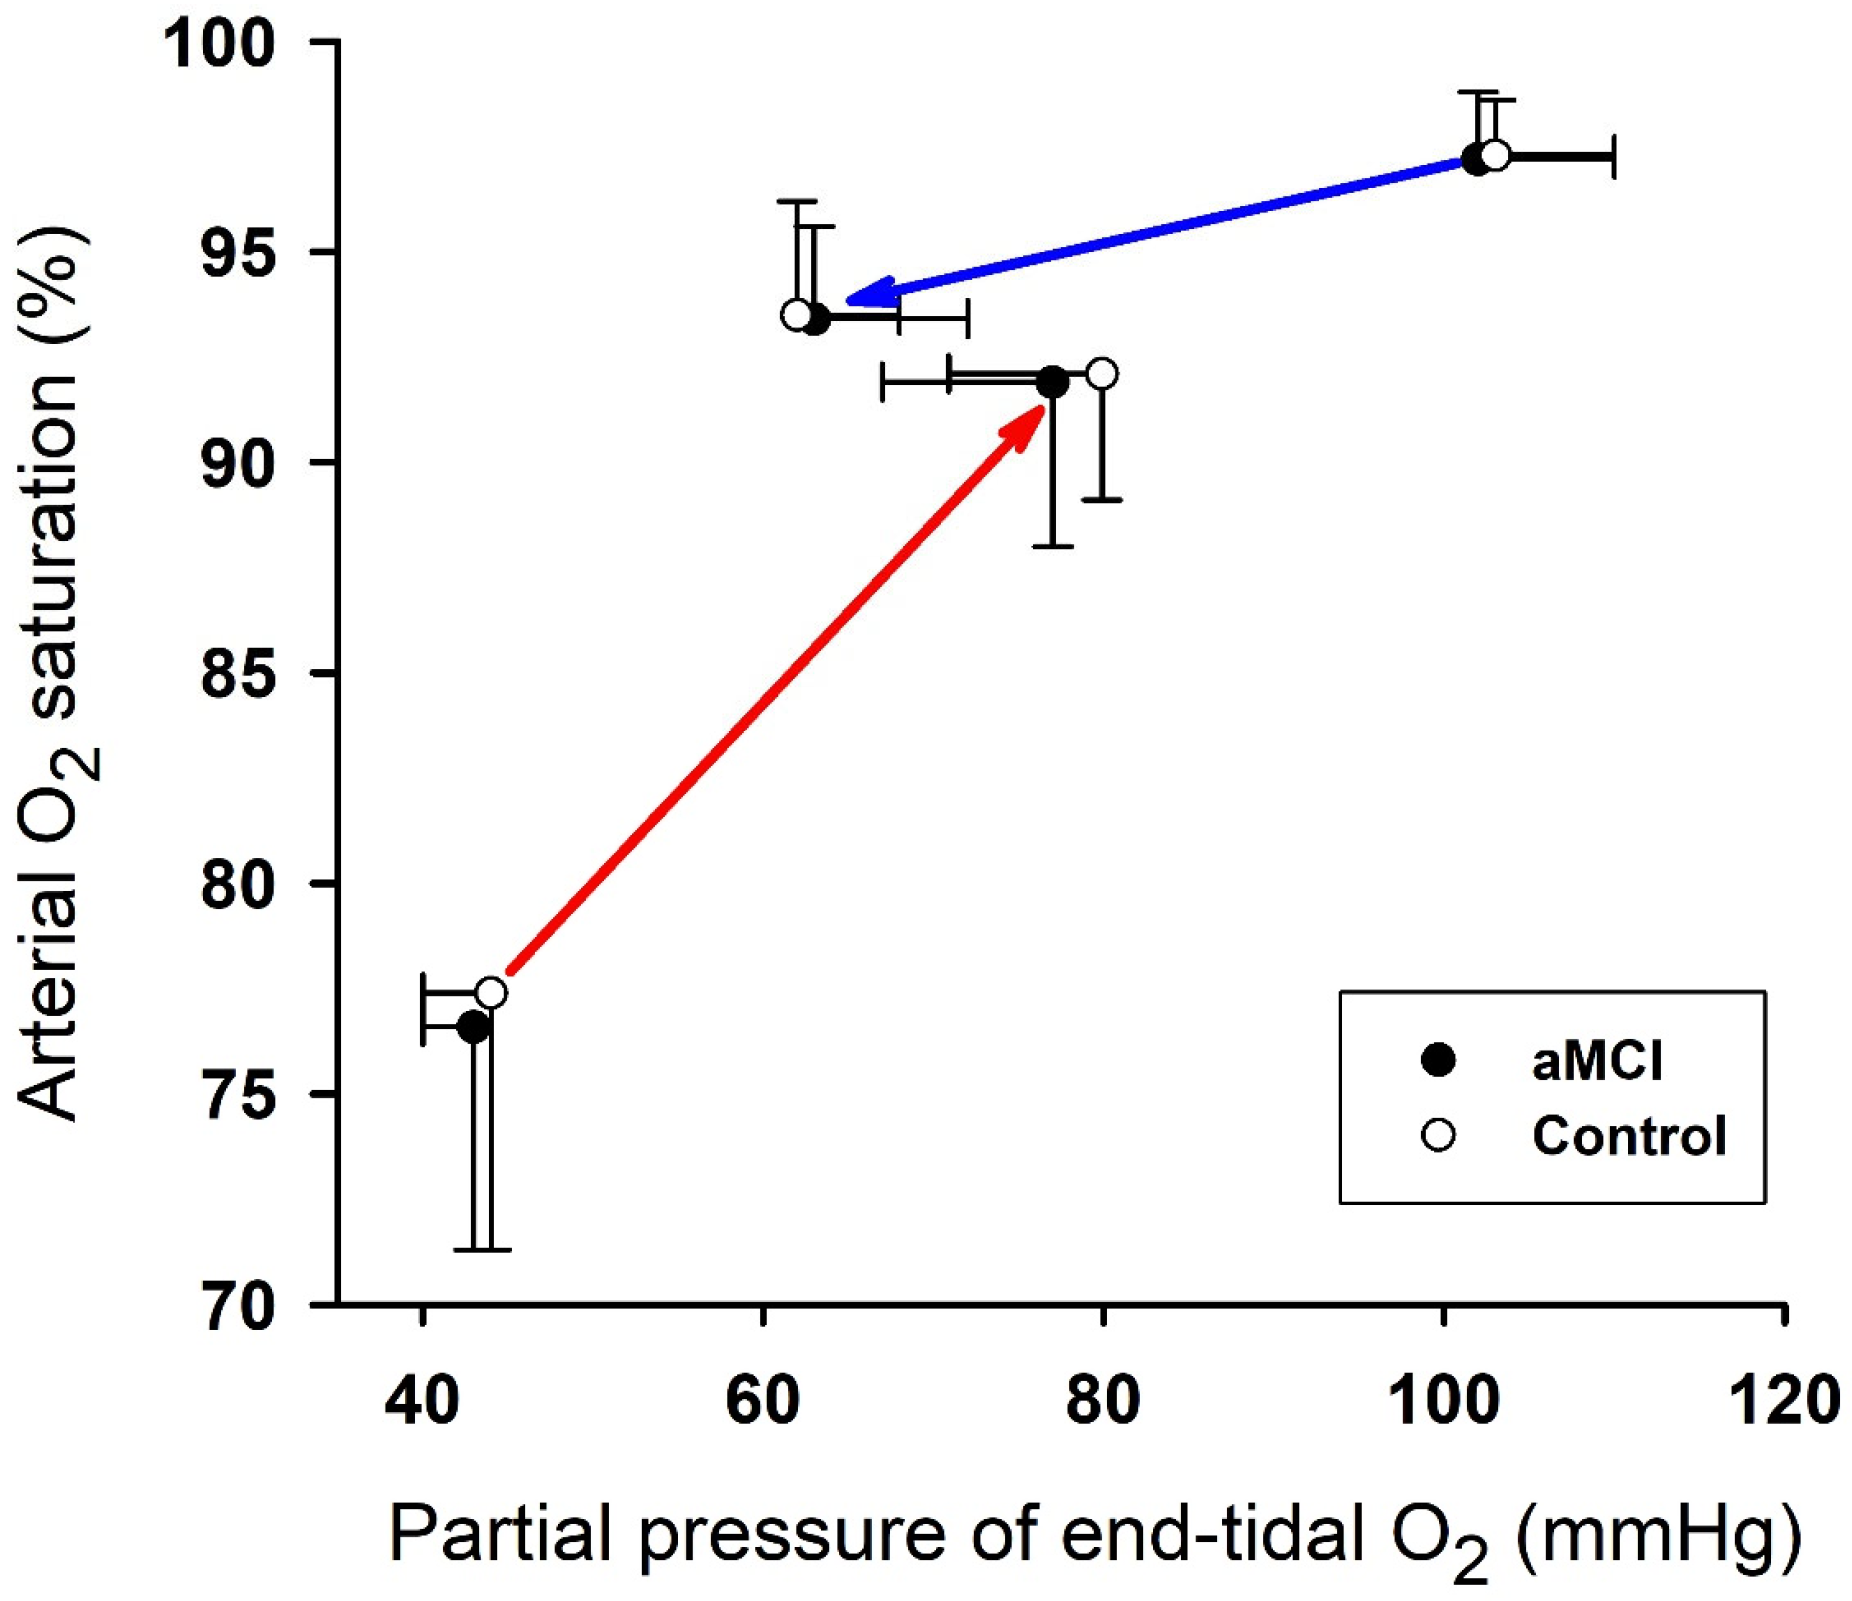
At the pre-hypoxia baseline, ScO2 in both the left and right prefrontal cortices was lower (group factor p < 0.001) in the aMCI vs. cognitively normal subjects (Table 2). PETO2 and SaO2 in both groups fell within the first min of hypoxia, but ScO2 did not fall significantly (Table 2). SaO2 during the last min hypoxia was appreciably lower (~77%) than the respective baseline and first min hypoxia values in both groups. By the last min of hypoxia, ScO2 had fallen significantly below the baseline in both groups, and to a greater extent in the left vs. right prefrontal cortex (hemisphere factor p = 0.015). The post hoc analysis revealed a significant difference between the left and right cortical ScO2 in the control group during the last min of hypoxia (Table 2). The SaO2 recovery upon the resumption of room-air breathing was more rapid than the SaO2 decline at the onset of hypoxia (Figure 2). Within 1 min of recovery on room air, SaO2 and ScO2 in both groups returned to ~92% and ~90% of the respective baseline values, but remained significantly below their respective baselines (Table 2).
Cerebrocortical O2EF (Table 2) was significantly affected by group (p < 0.0001), time (p < 0.0001) and hemisphere (p = 0.007) factors. However, only in the right prefrontal cortex did the post hoc analysis reveal a statistically significant difference in O2EF between the aMCI and control groups. O2EF did not change during the first min of hypoxia in either group, but fell significantly below the baseline by the last min of hypoxia in the right but not the left prefrontal cortex in both aMCI and control subjects. Although prefrontal O2EF during the first min of room-air recovery trended upward in both groups, O2EF differed significantly from the baseline only in the right prefrontal cortex. O2EF fell further in the right vs. left cortex during hypoxia, but the post hoc analysis revealed a statistically significant difference between the hemispheres only in the control group during the last min of hypoxic ventilation (Table 2).
Decreases in ScO2 were significantly correlated with increases in O2EF in both the left and right prefrontal cortices of the aMCI (Figure 3A,B) and control (Figure 3C,D) subjects. The ΔSaO2/ΔO2EF slopes (%/fraction) in the left and right prefrontal cortices were −58.5 ± 9.7 and −38.3 ± 8.6 in the aMCI subjects and −76.5 ± 8.7 and −33.5 ± 9.8 in the controls, respectively. The ΔSaO2/ΔO2EF slopes were significantly steeper in the left vs. right prefrontal cortex in the control group (side × O2EF interaction p = 0.002), but were not significantly different in the aMCI group (side × O2EF interaction p = 0.112). These slopes did not differ significantly in the aMCI vs. control groups in the left (group × O2EF interaction p = 0.169) or right (group × O2EF interaction p = 0.713) hemispheres.

3.3. Rates of De- and Reoxygenation

Figure 4 presents the PETO2, SaO2 and ScO2 group responses during the first 60 s of hypoxia (Figure 4A–D) and the first 60 s of recovery (Figure 4E,F). PETO2 closely paralleled the dynamic changes in SaO2 in the aMCI and cognitively normal subjects. In both groups, PETO2, SaO2 and left and right prefrontal ScO2 fell progressively during the first min of hypoxia (Figure 4A–D), and recovered over the first 60 s of reoxygenation (Figure 4E–H). Time × group interaction factors revealed no statistically significant between-group differences in the rates of change in these variables during de- or reoxygenation. However, ScO2 values in both the left and right prefrontal cortices were consistently lower in the aMCI subjects vs. controls.
None of the slopes of PETO2, SaO2 and left and right ScO2 vs. time (s) differed significantly between the aMCI and control groups during the initial phase of acute hypoxia (deoxygenation phase) and first min of reoxygenation (Table 3). ΔScO2/s (Table 3) revealed a more rapid deoxygenation in the left vs. right prefrontal cortex in aMCI and control groups. In both groups, the ΔPETO2/s, ΔSaO2/s and left and right prefrontal ScO2/s slopes were significantly greater (phase factor p < 0.0001) during reoxygenation vs. deoxygenation.
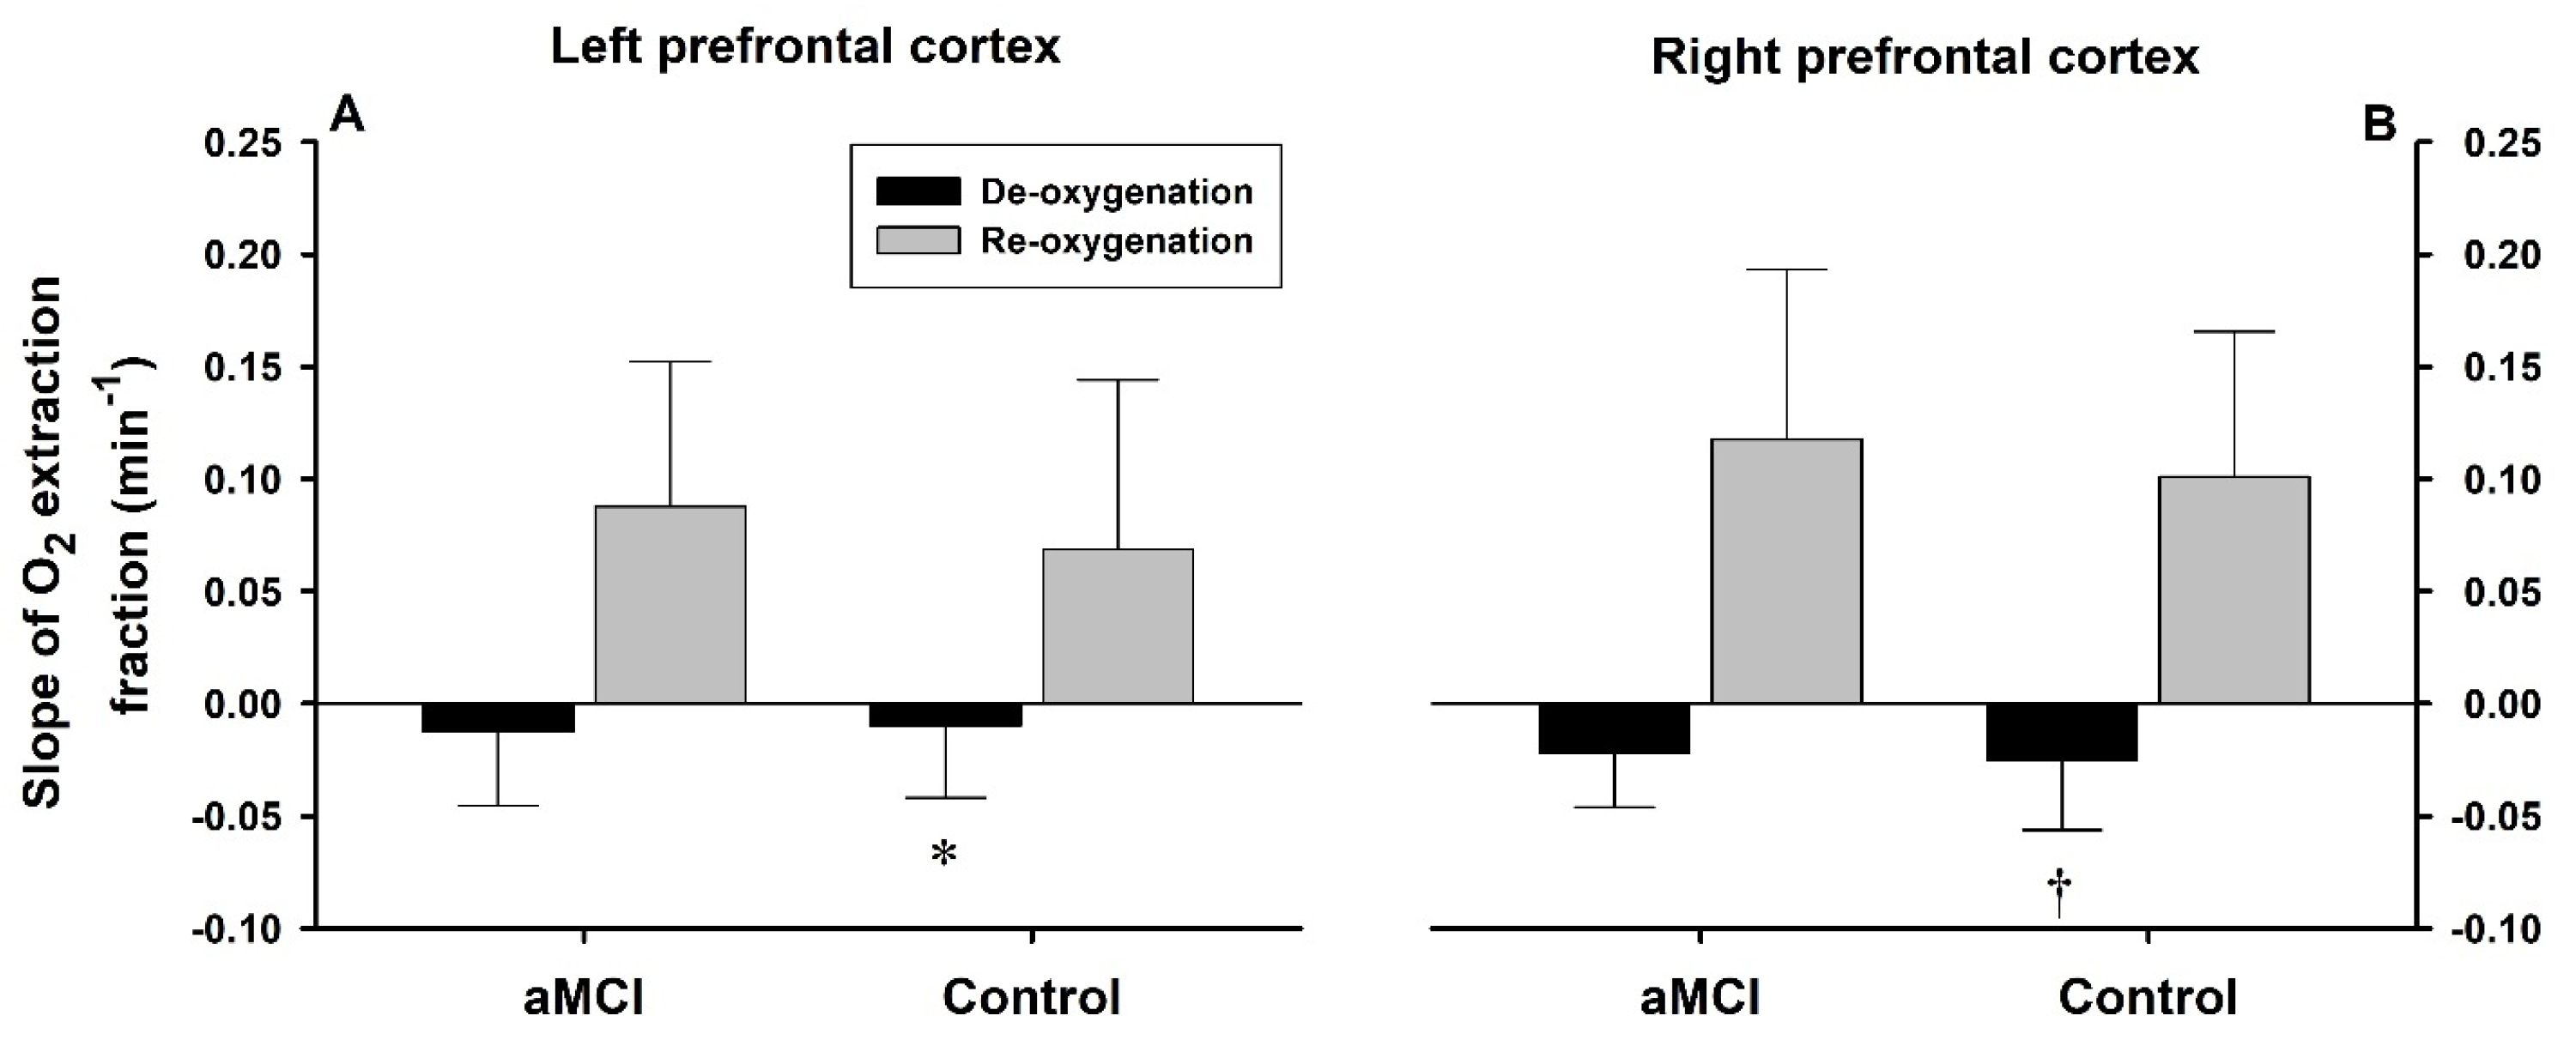
Rates of O2EF changes (Figure 5) were similar in the aMCI and control groups (group factor p = 0.179). The ΔO2EF/min slopes in the left and right prefrontal cortices, respectively, were −0.012 ± 0.033 and −0.022 ± 0.024 in the aMCI subjects vs. −0.010 ± 0.032 and −0.025 ± 0.031 in the controls during deoxygenation, and 0.088 ± 0.064 and 0.118 ± 0.085 in the aMCI group vs. 0.069 ± 0.075 and 0.101 ± 0.065 in the controls during recovery. Both phase (p < 0.001) and hemisphere factors (p = 0.001) significantly affected the ΔO2EF/min slopes. During deoxygenation, the ΔO2EF/min slope was steeper in the right vs. left cortex in the control but not the aMCI subjects.

4. Discussion

This study demonstrated that the declines of PETO2, SaO2 and ScO2 at the onset of acute, normobaric, moderate (10% O2) hypoxia were considerably slower than their respective recoveries upon the resumption of room-air breathing. However, none of these responses differed significantly in elderly adults with aMCI vs. their cognitively normal counterparts. Although prefrontal cortical ScO2 was significantly lower in the aMCI than in the cognitively normal subjects before hypoxia despite similar SaO2 values, during hypoxia, neither left nor right prefrontal ScO2 differed in aMCI vs. control subjects. The lower left and right prefrontal ScO2 values in the aMCI vs. cognitively normal subjects are concordant with a previous report [11], and may be related to a lower cerebral perfusion in elderly adults with MCI [8,9,10].
The rates of ScO2 changes at the onset of hypoxia and upon the resumption of room-air breathing were anatomically asymmetric, with more rapid responses in the left vs. the right prefrontal cortex. Furthermore, during hypoxia, ScO2 fell to a greater extent in the left vs. the right prefrontal cortex in the cognitively normal subjects, but not the aMCI subjects. The greater stability of right vs. left prefrontal ScO2 was associated with decreased O2EF during hypoxia; consequently, a significant inverse correlation emerged between ScO2 and O2EF in the right prefrontal cortex.

4.1. Hypoxemia and Cerebral Tissue Hypoxia During Hypoxia vs. Reoxygenation

The SaO2 decline at the onset of hypoxia was considerably slower than the SaO2 recovery upon the resumption of room-air breathing, and PETO2 closely paralleled the dynamic changes in SaO2 in the aMCI and cognitively normal subjects. The mechanisms underlying the different SaO2 response rates are unclear. We propose that the different rates may reflect the nonlinear changes in the O2 affinity of hemoglobin as arterial PO2 changes during the baseline-to-hypoxia and hypoxia-to-reoxygenation transitions (Figure 2). Due to hemoglobin’s high O2 saturation at PO2 >60 mmHg, SaO2 would decline only gradually until arterial PO2 reaches the “shoulder” of the sigmoid hemoglobin O2 saturation curve (Figure 2: red arrow). Conversely, the resumption of room-air breathing would produce rapid increases in SaO2 as arterial PO2 recovered from its nadir of c. 40 mm Hg, where the O2 saturation curve is steep (Figure 2: blue arrow).
Paralleling SaO2, ScO2 changes in both prefrontal cortices were more gradual during de- than reoxygenation in both the aMCI and control subjects. The slower ScO2 decline at hypoxia onset vs. its recovery upon reoxygenation may contribute to the previously reported slower changes in cerebral blood flow during hypoxic vs. normoxic respiration [2,5]. These data are in accordance with the cerebrovascular vasodilatory response to maintain cerebral O2 delivery during hypoxemia. Indeed, smaller cerebral hyperemic responses during hypoxia were associated with smaller ScO2 responses [2,5]. On the other hand, ScO2 recovery and, thus, cerebrocortical O2 replenishment during reoxygenation were more rapid than the antecedent declines during hypoxia. Furthermore, the robust ScO2 response to reoxygenation was associated with a rapid increase in cerebrocortical O2EF (Figure 4) in the left and right prefrontal cortices, helping “repay” the cerebrocortical O2 debt accrued during hypoxia in elderly adults with or without aMCI.

4.2. Impact of MCI on Cerebral O2 Dynamics During Hypoxia–Reoxygenation

Cerebrocortical O2 saturation was reportedly higher in the right vs. the left prefrontal cerebral cortex in right-handed young adults [26]. However, Olopade et al. [27] reported no difference between left and right ScO2 in young healthy adults and those with sleep apnea, although overall ScO2 was significantly lower in the sleep apnea subjects. The present study demonstrated a significantly lower ScO2 at baseline in both prefrontal cortices in the aMCI subjects vs. their cognitively normal counterparts, although the baseline ScO2 did not differ in the right vs. left cortex in either group (Table 2). Nonetheless, ScO2 tended to change more rapidly in the left vs. the right prefrontal cortex during both de- and reoxygenation in both elderly groups (Table 3). Moreover, ScO2 during the last min of hypoxia was appreciably lower in the left vs. the right prefrontal cortex in the control group (Table 2). This observation aligns with Ide’s study in young adults, where hypoxic exposure with PETO2 clamped at 45 mmHg for 10 min elicited a greater ScO2 reduction in the left than the right prefrontal cortex [28]. A greater ScO2 reduction during hypoxia could be ascribed to a less robust increase in cerebral blood flow and/or greater tissue oxygen consumption in the left vs. the right cortex. Since increases in total cortical hemoglobin content (an index of perfusion) during hypoxic exposure did not differ in the left vs. the right cortex [28], the greater ScO2 reduction in the left prefrontal cortex is more likely related to a greater tissue oxygen consumption or metabolic demand/rate than the contralateral cortex, as indicated by the greater O2EF in the left vs. the right cortex (Table 2 and Figure 3).
Interestingly, the differences in ScO2 and O2EF of left vs. right prefrontal cortices were more appreciable in the cognitively normal subjects than their aMCI counterparts (Table 2, Figure 3), suggesting that the cerebral metabolic demand/rate was greater in the left than the right hemisphere, and this cerebrocortical asymmetry might be diminished with aMCI. Although the mechanism for the more rapid ScO2 recovery in the left vs. the right prefrontal cortex was not clear, it may represent a repayment of the greater O2 debt accrued during the antecedent hypoxia in the left prefrontal cortex, which experienced the greater hypoxic decrease in ScO2.

4.3. Study Limitations and Perspectives

Cerebral tissue oxygenation represents the dynamic balance between O2 delivery, i.e., cerebral blood flow times arterial O2 content, and tissue O2 utilization for oxidative metabolism; consequently, cerebral blood flow is a central determinant of cerebral tissue oxygenation. Cerebral blood flow, which in human subjects typically is estimated from middle cerebral artery flow velocities monitored using transcranial Doppler sonography [23], was not assessed in this study, due to the technical challenges of bilateral transcranial Doppler instrumentation in subjects wearing facemasks and bilateral sensors for near-infrared spectroscopy. The anterior cerebral artery perfuses the superior and lateral portions of the prefrontal cortex [29]; consequently, the flow velocity in the middle cerebral artery might not represent the region where ScO2 was monitored. The ScO2 responses in the two cerebral hemispheres differed unexpectedly, yet we could not discern if the greater ScO2 reduction in the left prefrontal cortex during hypoxia was ascribable to a less robust cerebral blood flow response and/or greater O2 extraction in the left vs. the right prefrontal cortex.
The dynamic ScO2 response was slower at the onset of hypoxia vs. reoxygenation. Since cerebral tissue O2 content regulates cerebral perfusion [30], the different ScO2 response rates could explain the previously reported [1,2] slower cerebral blood flow responses to acute hypoxia vs. recovery on room air.
The extent to which short-term memory is affected by low pre-hypoxia ScO2 in the aMCI group and whether chronic cerebral under-perfusion or hypoxia may induce adaptive angiogenesis [31] to minimize or prevent low ScO2 in aMCI are as of yet unknown. Such adaptations may alter the trajectory of neurodegenerative progression from aMCI to Alzheimer’s disease and/or dementia. Indeed, repeated bouts of hypoxia, similar in intensity and duration to the hypoxia exposures of this study, are proposed to slow or interrupt cognitive decline in older adults [15]. Studies in rodent models of cognitive impairment identified potential mechanisms underlying the cognitive benefits of intermittent hypoxia. Hypoxia promoted hippocampal neurogenesis [16] and suppressed amyloid β (Aβ) plaque formation and pro-inflammatory tumor necrosis factor α expression [19] in rat models of cognitive impairment. In transgenic mice modeling Alzheimer’s disease, intermittent hypoxia activated cerebrocortical erythropoietin and brain-derived neurotrophic factor expression [17], and attenuated Aβ plaque formation and the expression of pro-inflammatory interleukins 1 and 6 [18]. Whether cyclic hypoxia of the duration and intensity of the present exposures elicits such adaptations in elderly humans, and to similar extents in aMCI vs. cognitively intact adults, is unclear, although the cerebrocortical deoxygenation during hypoxia was similar in the aMCI and control groups. Although medication use was similar in the aMCI and control subjects, the potential impact of medications on the studied responses cannot be excluded.

4.4. Conclusions

This study is the first to demonstrate that SaO2 and ScO2 change more gradually at the onset of hypoxic breathing than reoxygenation in elderly adults. However, the rates of these dynamic SaO2 and ScO2 responses were similar in elderly adults with aMCI vs. their cognitively normal counterparts. ScO2 declines during hypoxia and recovers upon reoxygenation more rapidly in the left vs. the right prefrontal cortex, both in aMCI and cognitively normal elderly adults. Although pre-hypoxia ScO2 was lower in both hemispheres in the aMCI vs. cognitively normal subjects despite similar SaO2 values, these ScO2 differences subsided during hypoxia. Thus, brief exposures to moderate, normobaric hypoxia do not impose more intense cerebrocortical hypoxia in elderly adults with aMCI vs. their cognitively normal counterparts.

Author Contributions

Conceptualization: C.C., R.T.M. and X.S.; performed experiments: C.C., J.R., H.D. and X.S.; analyzed data: C.C., H.D., R.T.M. and X.S.; interpreted results of experiments: C.C., H.D., S.R., R.T.M. and X.S.; prepared figures and drafted manuscript: C.C., R.T.M. and X.S.; edited and approved final version of manuscript: C.C., J.R., H.D., S.R., R.T.M. and X.S. All authors have read and agreed to the published version of the manuscript.

Funding

This study is supported by grant R01-AG076675 from the National Institute on Aging.

Institutional Review Board Statement

This study was conducted in accordance with the Declaration of Helsinki and approved by the North Texas Regional Institutional Review Board (Protocol #2022-031; approved 4 March 2025).

Informed Consent Statement

Informed consent was obtained from all subjects involved in the study.

Data Availability Statement

The datasets used and/or analyzed during the current study are available from the corresponding author upon request.

Acknowledgments

We thank the volunteer participants for their cheerful cooperation during the study and Sandra Davis and April Wiechmann for screening the subjects.

Conflicts of Interest

The authors declare no conflict of interest.

References

  1. Poulin, M.J.; Liang, P.J.; Robbins, P.A. Dynamics of the cerebral blood flow response to step changes in end-tidal PCO2 and PO2 in humans. J. Appl. Physiol. 1996, 81, 1084–1095. [Google Scholar] [CrossRef]
  2. Harris, A.D.; Murphy, K.; Diaz, C.M.; Saxena, N.; Hall, J.E.; Liu, T.T.; Wise, R.G. Cerebral blood flow response to acute hypoxic hypoxia. NMR Biomed. 2013, 26, 1844–1852. [Google Scholar] [CrossRef]
  3. Kety, S.S.; Schmidt, C.F. The effects of altered arterial tensions of carbon dioxide and oxygen on cerebral blood flow and cerebral oxygen consumption of normal young men. J. Clin. Investig. 1948, 27, 484–492. [Google Scholar] [CrossRef]
  4. Xu, F.; Liu, P.; Pascual, J.M.; Xiao, G.; Lu, H. Effect of Hypoxia and Hyperoxia on Cerebral Blood Flow, Blood Oxygenation, and Oxidative Metabolism. J. Cereb. Blood Flow Metab. 2012, 32, 1909–1918. [Google Scholar] [CrossRef]
  5. Ainslie, P.N.; Shaw, A.D.; Smith, K.J.; Willie, C.K.; Ikeda, K.; Graham, J.; Macleod, D.B. Stability of cerebral metabolism and substrate availability in humans during hypoxia and hyperoxia. Clin. Sci. 2014, 126, 661–670. [Google Scholar] [CrossRef]
  6. Vestergaard, M.B.; Lindberg, U.; Aachmann-Andersen, N.J.; Lisbjerg, K.; Christensen, S.J.; Law, I.; Rasmussen, P.; Olsen, N.V.; Larsson, H.B.W. Acute hypoxia increases the cerebral metabolic rate—A magnetic resonance imaging study. J. Cereb. Blood Flow Metab. 2016, 36, 1046–1058. [Google Scholar] [CrossRef]
  7. Vestergaard, M.B.; Ghanizada, H.; Lindberg, U.; Arngrim, N.; Paulson, O.B.; Gjedde, A.; Ashina, M.; Larsson, H.B.W. Human Cerebral Perfusion, Oxygen Consumption, and Lactate Production in Response to Hypoxic Exposure. Cereb. Cortex 2022, 32, 1295–1306. [Google Scholar] [CrossRef]
  8. Johnson, N.A.; Jahng, G.H.; Weiner, M.W.; Miller, B.L.; Chui, H.C.; Jagust, W.J.; Gorno-Tempini, M.L.; Schuff, N. Pattern of cerebral hypoperfusion in Alzheimer disease and mild cognitive impairment measured with arterial spin-labeling MR imaging: Initial experience. Radiology 2005, 234, 851–859. [Google Scholar] [CrossRef] [PubMed]
  9. Chao, L.L.; Pa, J.; Duarte, A.; Schuff, N.; Weiner, M.W.; Kramer, J.H.; Miller, B.L.; Freeman, K.M.; Johnson, J.K. Patterns of cerebral hypoperfusion in amnestic and dysexecutive MCI. Alzheimer Dis. Assoc. Disord. 2009, 23, 245–252. [Google Scholar] [CrossRef] [PubMed]
  10. Kim, C.M.; RAlvarado, L.; Stephens, K.; Wey, H.Y.; Wang, D.J.J.; Leritz, E.C.; Salat, D.H. Associations between cerebral blood flow and structural and functional brain imaging measures in individuals with neuropsychologically defined mild cognitive impairment. Neurobiol. Aging 2020, 86, 64–74. [Google Scholar] [CrossRef] [PubMed]
  11. Tarumi, T.; Dunsky, D.I.; Khan, M.A.; Liu, J.; Hill, C.; Armstrong, K.; Martin-Cook, K.; Cullum, C.M.; Zhang, R. Dynamic cerebral autoregulation and tissue oxygenation in amnestic mild cognitive impairment. J. Alzheimers Dis. 2014, 41, 765–778. [Google Scholar] [CrossRef]
  12. Murayama, Y.; Sato, Y.; Hu, L.; Brugnera, A.; Compare, A.; Sakatani, K. Relation Between Cognitive Function and Baseline Concentrations of Hemoglobin in Prefrontal Cortex of Elderly People Measured by Time-Resolved Near-Infrared Spectroscopy. Adv. Exp. Med. Biol. 2017, 977, 269–276. [Google Scholar] [PubMed]
  13. Elbanna, S.; Cortez, C.; Smith, E.; Rattanavong, J.; Ross, S.; Kline, G.; Wiechmann, A.; Dyson, H.; Mallet, R.T.; Shi, X. Enhanced cerebral oxygenation during mental and physical activity in older adults is unaltered by amnestic mild cognitive impairment. Front. Physiol. 2025, 16, 1535045. [Google Scholar] [CrossRef] [PubMed]
  14. Bayer, U.; Likar, R.; Pinter, G.; Stettner, H.; Demschar, S.; Trummer, B.; Neuwersch, S.; Glazachev, O.; Burtscher, M. Intermittent hypoxic-hyperoxic training on cognitive performance in geriatric patients. Alzheimers Dement. 2017, 3, 114–122. [Google Scholar] [CrossRef] [PubMed]
  15. Wang, H.; Shi, X.; Schenck, H.; Hall, J.R.; Ross, S.E.; Kline, G.P.; Chen, S.; Mallet, R.T.; Chen, P. Intermittent Hypoxia Training for Treating Mild Cognitive Impairment: A Pilot Study. Am. J. Alzheimers Dis. Other Dement. 2020, 35, 1533317519896725. [Google Scholar] [CrossRef]
  16. Zhu, X.H.; Yan, H.C.; Zhang, J.; Qu, H.D.; Qiu, X.S.; Chen, L.; Li, S.J.; Cao, X.; Bean, J.C.; Chen, L.H.; et al. Intermittent hypoxia promotes hippocampal neurogenesis and produces antidepressant-like effects in adult rats. J. Neurosci. 2010, 30, 12653–12663. [Google Scholar] [CrossRef]
  17. Ryou, M.G.; Chen, X.; Cai, M.; Wang, H.; Jung, M.E.; Metzger, D.B.; Mallet, R.T.; Shi, X. Intermittent Hypoxia Training Prevents Deficient Learning-Memory Behavior in Mice Modeling Alzheimer’s Disease: A Pilot Study. Front. Aging Neurosci. 2021, 13, 674688. [Google Scholar] [CrossRef]
  18. Yue, X.; Zhou, Y.; Qiao, M.; Zhao, X.; Huang, X.; Zhao, T.; Cheng, X.; Fan, M.; Zhao, Y.; Chen, R.; et al. Intermittent hypoxia treatment alleviates memory impairment in the 6-month-old APPswe/PS1dE9 mice and reduces amyloid beta accumulation and inflammation in the brain. Alzheimers Res. Ther. 2021, 13, 194. [Google Scholar] [CrossRef]
  19. Serebrovska, Z.; Xi, L.; Fedoriuk, M.; Dosenko, V.; Shysh, A.; Khetsuriani, M.; Porkhalo, D.; Savchenko, A.; Goncharov, S.; Utko, N.; et al. Intermittent hypoxia-hyperoxia training ameliorates cognitive impairment and neuroinflammation in a rat model of Alzheimer’s disease. Brain Res. 2025, 1847, 149301. [Google Scholar] [CrossRef]
  20. Smith, E.; Cortez, C.; Wiechmann, A.; Davis, S.; Dyson, H.; Kucharski, K.; Ross, S.; Kline, G.; Mallet, R.T.; Shi, X. Preserved learning despite impaired short-term memory in older adults with mild cognitive impairment. Front. Aging Neurosci. 2025, 17, 1560791. [Google Scholar] [CrossRef]
  21. Winblad, B.; Palmer, K.; Kivipelto, M.; Jelic, V.; Fratiglioni, L.; Wahlund, L.O.; Nordberg, A.; Bäckman, L.; Albert, M.; Almkvist, O.; et al. Mild cognitive impairment–beyond controversies, towards a consensus: Report of the International Working Group on Mild Cognitive Impairment. J. Intern. Med. 2004, 256, 240–246. [Google Scholar] [CrossRef]
  22. Petersen, R.C.; Roberts, R.O.; Knopman, D.S.; Geda, Y.E.; Cha, R.H.; Pankratz, V.S.; Boeve, B.F.; Tangalos, E.G.; Ivnik, R.J.; Rocca, W.A. Prevalence of mild cognitive impairment is higher in men. Neurology 2010, 75, 889–897. [Google Scholar] [CrossRef]
  23. Liu, X.; Xu, D.; Hall, J.R.; Ross, S.; Chen, S.; Liu, H.; Mallet, R.T.; Shi, X. Enhanced cerebral perfusion during brief exposures to cyclic intermittent hypoxemia. J. Appl. Physiol. 2017, 123, 1689–1697. [Google Scholar] [CrossRef] [PubMed]
  24. Liu, X.; Chen, X.; Kline, G.; Ross, S.E.; Hall, J.R.; Ding, Y.; Mallet, R.T.; Shi, X. Reduced cerebrovascular and cardioventilatory responses to intermittent hypoxia in elderly. Respir. Physiol. Neurobiol. 2020, 271, 103306. [Google Scholar] [CrossRef]
  25. Zhao, J.; Ding, Y.; Kline, G.P.; Zhou, Z.; Mallet, R.T.; Shi, X. Hypoxic breathing produces more intense hypoxemia in elderly women than in elderly men. Front. Physiol. 2022, 13, 989635. [Google Scholar] [CrossRef]
  26. Zohdi, H.; Scholkmann, F.; Wolf, U. Frontal cerebral oxygenation asymmetry: Intersubject variability and dependence on systemic physiology, season, and time of day. Neurophotonics 2020, 7, 025006. [Google Scholar] [CrossRef] [PubMed]
  27. Olopade, C.O.; Mensah, E.; Gupta, R.; Huo, D.; Picchietti, D.L.; Gratton, E.; Michalos, A. Noninvasive determination of brain tissue oxygenation during sleep in obstructive sleep apnea: A near-infrared spectroscopic approach. Sleep 2007, 30, 1747–1755. [Google Scholar] [CrossRef] [PubMed]
  28. Ide, K. Acute hypoxia elicits prefrontal oxygenation asymmetry in young adults. Neurophotonics 2023, 10, 045002. [Google Scholar] [CrossRef]
  29. Matsukawa, K.; Asahara, R.; Uzumaki, M.; Hashiguchi, Y.; Ishii, K.; Wang, J.; Smith, S.A. Central command-related increases in blood velocity of anterior cerebral artery and prefrontal oxygenation at the onset of voluntary tapping. Am. J. Physiol. Heart Circ. Physiol. 2021, 321, H518–H531. [Google Scholar] [CrossRef]
  30. Masamoto, K.; Tanishita, K. Oxygen transport in brain tissue. J. Biomech. Eng. 2009, 131, 074002. [Google Scholar] [CrossRef]
  31. Xu, K.; Lamanna, J.C. Chronic hypoxia and the cerebral circulation. J. Appl. Physiol. 2006, 100, 725–730. [Google Scholar] [CrossRef] [PubMed]
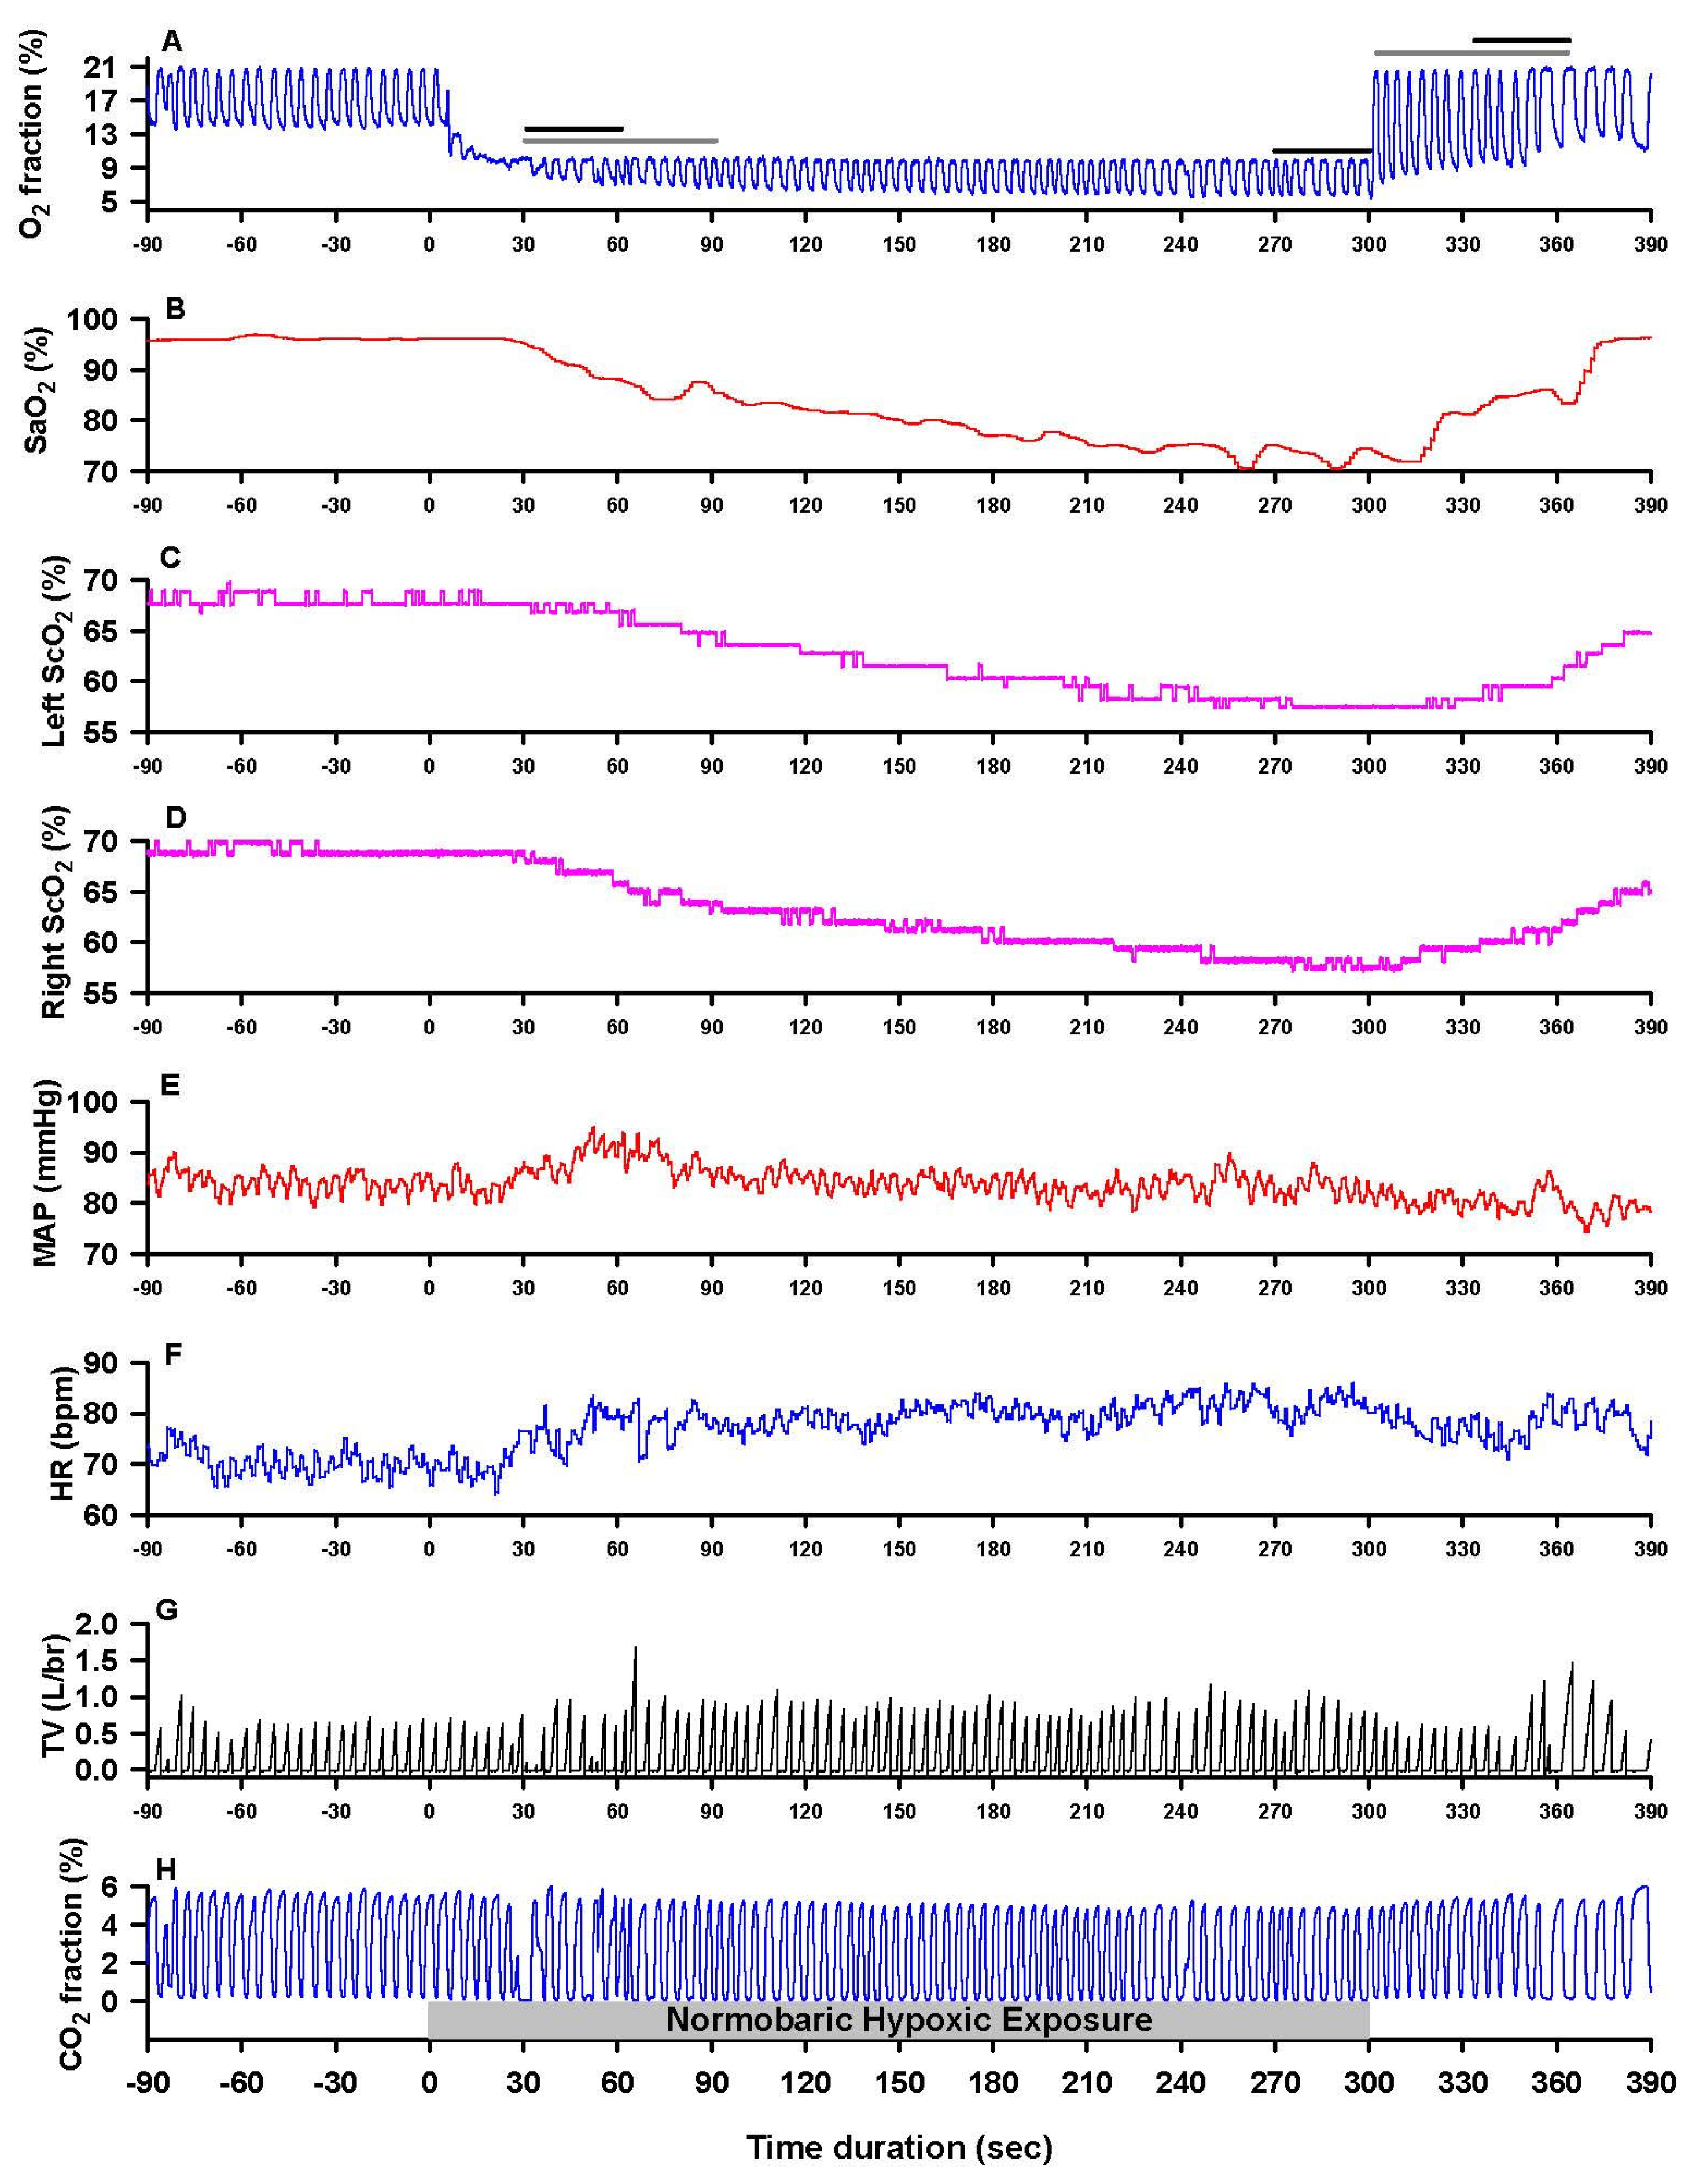
Figure 1. Hypoxia–reoxygenation protocol: monitored variables. (A) inspired (peak of cycle) and expired (nadir of cycle) O2 fractions; (B) arterial oxygen saturation (SaO2); left (C) and right (D) prefrontal cortex oxygenation (ScO2); (E) mean arterial pressure (MAP); (F) heart rate (HR); (G) inspiratory tidal volume (TV); (H) inspired and expired fractions of CO2. Pre-hypoxia baseline is from −90 s to 0 s, followed by 5 min normobaric hypoxia (fractional inspired O2 0.10) and then 90 s recovery breathing room air. Baseline values are the mean values from c. 60 s of continuous data acquisition before the hypoxic exposure. Values for the first and final min of hypoxia and the first min of recovery were taken as the mean values from 30 to 60 s of each interval (indicated by horizontal black lines in panel A). The horizontal black lines (panel A) indicate the data averaged for the first and last minutes of hypoxic exposure and the first minute of recovery, respectively. The horizontal gray lines (panel A) indicate the initial deoxygenation phase of hypoxic breathing (equilibration of the inspired air inside facemask takes ~30 s) and the reoxygenation phase during the first min of recovery, respectively. Data are from a 71-year-old female subject.
Biomedicines 13 02661 g001
Figure 2. Changes in hemoglobin O2 saturation during hypoxia and reoxygenation. Changes in SaO2 vs. PETO2 from the baseline to the 1st min of hypoxic exposure (blue arrow) and from the last min of hypoxia to the 1st min of recovery (red arrow) demonstrate different rates of hemoglobin-O2 disassociation vs. reassociation at the onsets of hypoxia vs. recovery, respectively. Mean values ± SD are from Table 2. Because the aMCI and control values were nearly identical, the overall mean values of the two groups determined the positions of the arrows. The SaO2/ΔPETO2 slope was greater (p < 0.05) during O2 reassociation (0.43%/mmHg) than disassociation (0.10%/mmHg).
Biomedicines 13 02661 g002
Figure 3. Correlation of ScO2 with O2EF. Decreases in ScO2 significantly correlated with increases in O2EF in both aMCI (panels (A,B)) and control (panels (C,D)) subjects. The slopes of ScO2/O2EF (%/fraction) were not influenced by the group × O2EF interaction factor in the left (p = 0.169) and right (p = 0.713) prefrontal cortices. However, the ScO2/O2EF slope was significantly steeper in the left (−76.5 ± 8.7) than the right (−33.5 ± 9.8) prefrontal cortex in the control group (cerebral hemisphere × O2EF interaction factor p = 0.002), and not different between the left (−58.5 ± 9.7) vs. right (−38.3 ± 8.6) prefrontal cortex in the aMCI group (cerebral hemisphere × O2EF interaction factor p = 0.112).
Biomedicines 13 02661 g003
Figure 4. Dynamic responses of arterial and cerebrocortical oxygen saturation during de- and reoxygenation. Left (AD) and right (EH) panels show the responses of partial pressure of end-tidal O2 (PETO2), arterial oxygen saturation (SaO2) and left and right cerebrocortical oxygen saturation (ScO2) at 30–90 s hypoxia (panels AD) and first min of reoxygenation (panels EH), respectively. Mean values (circles) ± SD.
Biomedicines 13 02661 g004
Figure 5. Slopes of oxygen extraction fractions during hypoxia and reoxygenation. Left (A) and right (B) prefrontal cortical O2EF decreased with time during initial phase of deoxygenation, breathing hypoxic air, and increased with time during the first min of reoxygenation, breathing room air during recovery. The decline of O2EF (absolute unit) during deoxygenation was substantially slower than the rate of O2EF recovery during reoxygenation (phase factor p < 0.001). The O2EF slopes did not differ between the aMCI and control subjects (group factor p = 0.179). Overall, the rate of O2EF change was greater in the right than the left prefrontal cortical tissues (side factor p = 0.001). *: O2EF slope not significantly different from zero (p = 0.082); : p < 0.05 vs. left prefrontal cortex in the same group during deoxygenation phase.
Biomedicines 13 02661 g005
Table 1. Characteristics, neurobehavioral test scores and medications of aMCI and control subjects.
aMCI
(n = 32)
Control
(n = 35)
tp
Men, Women8, 247, 280.771
Age (year)71.1 ± 5.771.2 ± 5.8−0.060.955
Weight (kg)72.8 ± 17.176.4 ± 14.4−0.920.361
Height (m)1.66 ± 0.091.67 ± 0.10−0.580.568
Education (year)16.2 ± 1.315.9 ± 1.80.860.396
Geriatric Depression Scale (score)1.1 ± 1.21.0 ± 1.20.220.830
Clinical Dementia Rating (point)0.48 ± 0.090.33 ± 0.243.570.001
Mini-mental State Examination (point)27.7 ± 1.428.7 ± 1.1−3.160.003
Trail Making Test–version A (sec)44 ± 1729 ± 74.67<0.001
Trail Making Test–version B (sec)128 ± 6171 ± 185.05<0.001
Verbal Memory (word)5.8 ± 1.97.6 ± 1.8−3.650.001
Visuospatial Memory (point)5.3 ± 2.68.6 ± 1.8−5.91<0.001
Right vs. Left Handedness27 vs. 530 vs. 51.000
Duration of Hypoxic Exposure (sec)273 ± 43271 ± 370.220.825
Number (%) of subjects with prescribed medications
Category of MedicationaMCIControlTotalp
Hypertension/Coronary Arterial Disease17 (53.1)12 (34.3)29 (43.3)0.309
Hyper-cholesterol/Hyper-lipidemia 12 (37.5)11 (31.4)23 (34.3)0.618
Hyperglycemia 7 (21.9)3 (8.6)10 (14.9)0.175
Anxiety/Depression15 (46.9)9 (25.7)24 (36.8)0.081
Reflux/Gastric Acid9 (28.1)10 (28.6)19 (28.4)1.000
Hypothyroid/Hyperthyroid6 (18.8)11 (31.4)17 (25.4)0.384
Allergy9 (28.1)8 (22.9)17 (25.4)0.780
Sleep Aid7 (21.9)3 (8.6)10 (14.9)0.175
Hormone Replacement6 (18.8)4 (11.4)10 (14.9)0.501
Scalar values are group means ± standard deviation. p values are from comparisons of scalar variables in the aMCI vs. control subjects using t-test for two independent groups, and from comparisons of categorical subject distributions in the two groups using Fisher’s exact test for two-tailed probability. t: unpaired t test statistic; p: probability the null hypothesis is true. Verbal memory and visuospatial memory: 10 min delayed free recall of the words and 30 min delayed recall of the sketch shape and location, respectively.
Table 2. Minute data during the experiment.
aMCI SubjectsControl SubjectsANOVA
BaseH-1H-2RecBaseH-1H-2RecFactorFp
HR
(bpm)
67 ± 1070 ± 1077 ± 11 *71 ± 1069 ± 1071 ± 1178 ± 11 *72 ± 10Group
Time
0.83
9.26
0.3636
<0.0001
MAP (mmHg)95 ± 1097 ± 994 ± 1092 ± 996 ± 996 ± 1093 ± 1091 ± 10Group
Time
0.29
2.95
0.593
0.033
TV
(L)
0.80 ± 0.320.88 ± 0.300.99 ± 0.450.93 ± 0.450.88 ± 0.371.01 ± 0.401.12 ± 0.490.92 ± 0.49Group
Time
2.56
2.86
0.1107
0.0374
fBr
(c/m)
12.6 ± 3.913.0 ± 4.512.9 ± 5.611.2 ± 5.111.0 ± 4.411.3 ± 4.611.5 ± 4.49.4 ± 4.0Group
Time
8.42
2.57
0.0040
0.0549
Vent
(L/m)
9.5 ± 3.710.7 ± 3.111.4 ± 4.19.3 ± 4.98.8 ± 2.410.6 ± 3.612.0 ± 5.0 *7.8 ± 3.2 *Group
Time
0.77
8.79
0.3824
<0.0001
PETCO2 (mmHg)43 ± 341 ± 438 ± 4 §41 ± 443 ± 342 ± 339 ± 3 §42 ± 3Group
Time
0.80
19.99
0.3711
<0.0001
PETO2 (mmHg)102 ± 863 ± 9 §43 ± 3 §77 ± 10 §103 ± 762 ± 6 §44 ± 4 §79 ± 9 §Group
Time
0.64
772.9
0.425
<0.0001
SaO2
(%)
97.2 ± 1.693.4 ± 2.2 *76.6 ± 5.3 §91.9 ± 3.9 *97.3 ± 1.393.5 ± 2.7 *77.4 ± 6.1 §92.1 ± 3.0 *Group
Time
0.33
399.3
0.564
<0.0001
L-ScO2
(%)
67.0 ± 4.764.0 ± 4.354.0 ± 4.9 §60.5 ± 4.5 *69.6 ± 4.5 66.6 ± 4.4 55.2 ± 6.4 §62.1 ± 5.7 *Group
Time
Side
31.31
175.2
6.01
<0.0001
<0.0001
0.015
R-ScO2
(%)
66.8 ± 4.664.4 ± 4.556.0 ± 4.3 §61.4 ± 4.5 *69.4 ± 4.1 67.0 ± 3.9 58.2 ± 4.4 §†‡63.8 ± 4.5 *
L-O2EF0.31 ± 0.050.31 ± 0.050.29 ± 0.060.34 ± 0.050.28 ± 0.050.29 ± 0.040.29 ± 0.080.33 ± 0.06Group
Time
Side
24.90
22.90
7.56
<0.0001
<0.0001
0.007
R-O2EF0.31 ± 0.050.31 ± 0.050.27 ± 0.06 *0.33 ± 0.05 §0.29 ± 0.04 0.28 ± 0.04 0.25 ± 0.05 *0.31 ± 0.05 §
Base: baseline; H-1 and H-2: first and last min hypoxic exposure, respectively; Rec: first min recovery on room air; F: F test statistic; p: probability the null hypothesis is true. HR: heart rate; MAP: mean arterial pressure; TV: inspiratory tidal volume; fBr: breathing frequency; Vent: minute ventilation; PETCO2 and PETO2: partial pressures of end-tidal CO2 and O2, respectively; SaO2: arterial oxygen saturation; L-ScO2 and R-ScO2: O2 saturation of left and right prefrontal cortices, respectively; L-O2EF and R-O2EF: O2 extract fraction of left and right prefrontal cortices, respectively. F: F value from ANOVA determined by the ratio of the variance between the group means to the variance within the groups. * p < 0.05 vs. baseline of the same group; § p < 0.05 vs. all other timepoints within the group;  p < 0.05 vs. aMCI;  p < 0.05 vs. L-ScO2. There were no significant interactions of group × time factors for any of these variables. n = 32 aMCI and 35 normal subjects, respectively, except for PETO2 (29 aMCI subjects, 32 control subjects).
Table 3. Response rates of PETO2, SaO2 and left and right prefrontal ScO2 during initial phase of acute hypoxia exposure and first min of recovery.
aMCI (n = 32)Control (n = 35)ANOVA
HypoxiaRecoveryHypoxiaRecoveryFactorFp
PETO2/time
(mmHg/s)
−0.37 ± 0.220.83 ± 0.21 *−0.35 ± 0.190.81 ± 0.21 *Group
Phase
0.33
157.85
0.568
<0.0001
SaO2/time
(%/s)
−0.16 ± 0.060.40 ± 0.13 *−0.17 ± 0.050.37 ± 0.12 *Group
Phase
0.38
179.10
0.539
<0.0001
L-ScO2/time
(%/s)
−0.09 ± 0.040.16 ± 0.07 *−0.11 ± 0.040.17 ± 0.06 *Group
Phase
Hemisphere
2.80
75.94
17.42
0.096
<0.0001
<0.0001
R-ScO2/time
(%/s)
−0.08 ± 0.030.12 ± 0.05 *−0.09 ± 0.03 0.13 ± 0.06 *
PETO2: partial pressure of end-tidal O2; SaO2: arterial oxygen saturation; L-ScO2 and R-ScO2: oxygenation in left and right prefrontal cortices, respectively. *: p < 0.05, hypoxia vs. recovery; : p < 0.05, left vs. right cortex in the same phase and group (2- or 3-factor ANOVA). Values are group means ± standard deviation of the means.
Disclaimer/Publisher’s Note: The statements, opinions and data contained in all publications are solely those of the individual author(s) and contributor(s) and not of MDPI and/or the editor(s). MDPI and/or the editor(s) disclaim responsibility for any injury to people or property resulting from any ideas, methods, instructions or products referred to in the content.