

Research on Lipidomic Profiling and Biomarker Identification for Osteonecrosis of the Femoral Head


Abstract

1. Introduction
2. Materials and Methods
2.1. Participant Information
2.2. Blood Sample Collection and Lipid Extraction
2.3. UHPLC-MS/MS Analysis
2.4. Data Search
2.5. Feature Selection Methods
2.6. Statistical Analysis
3. Results
3.1. Basic Clinical Information on the Participants
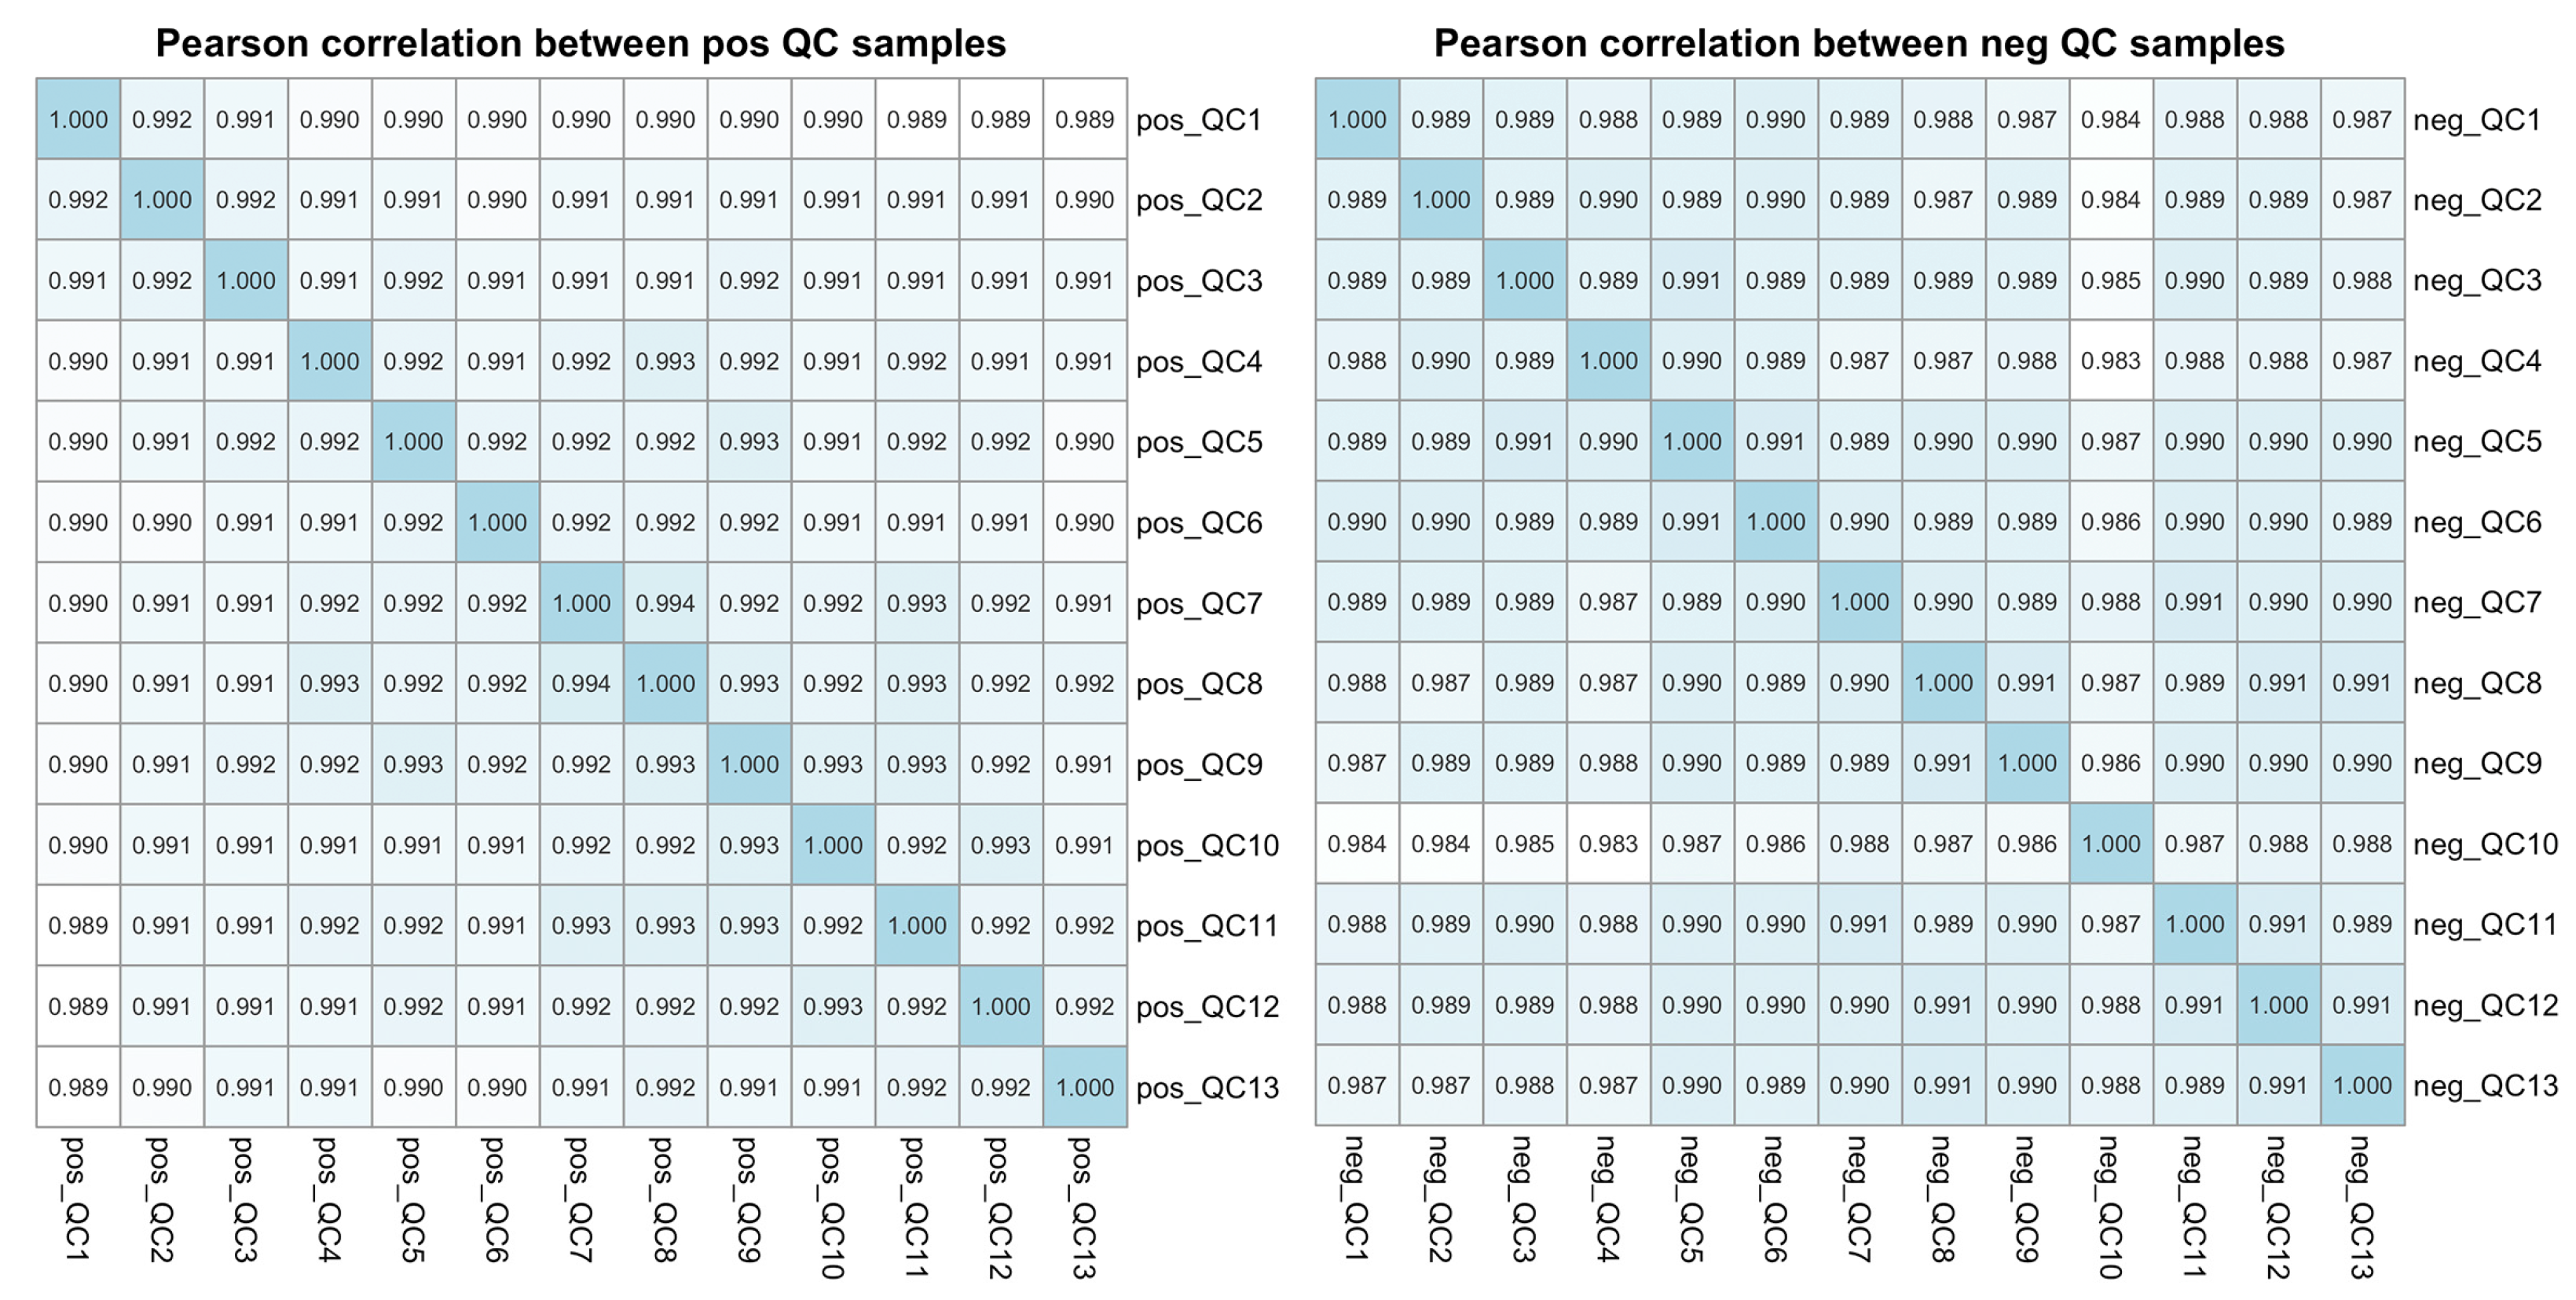
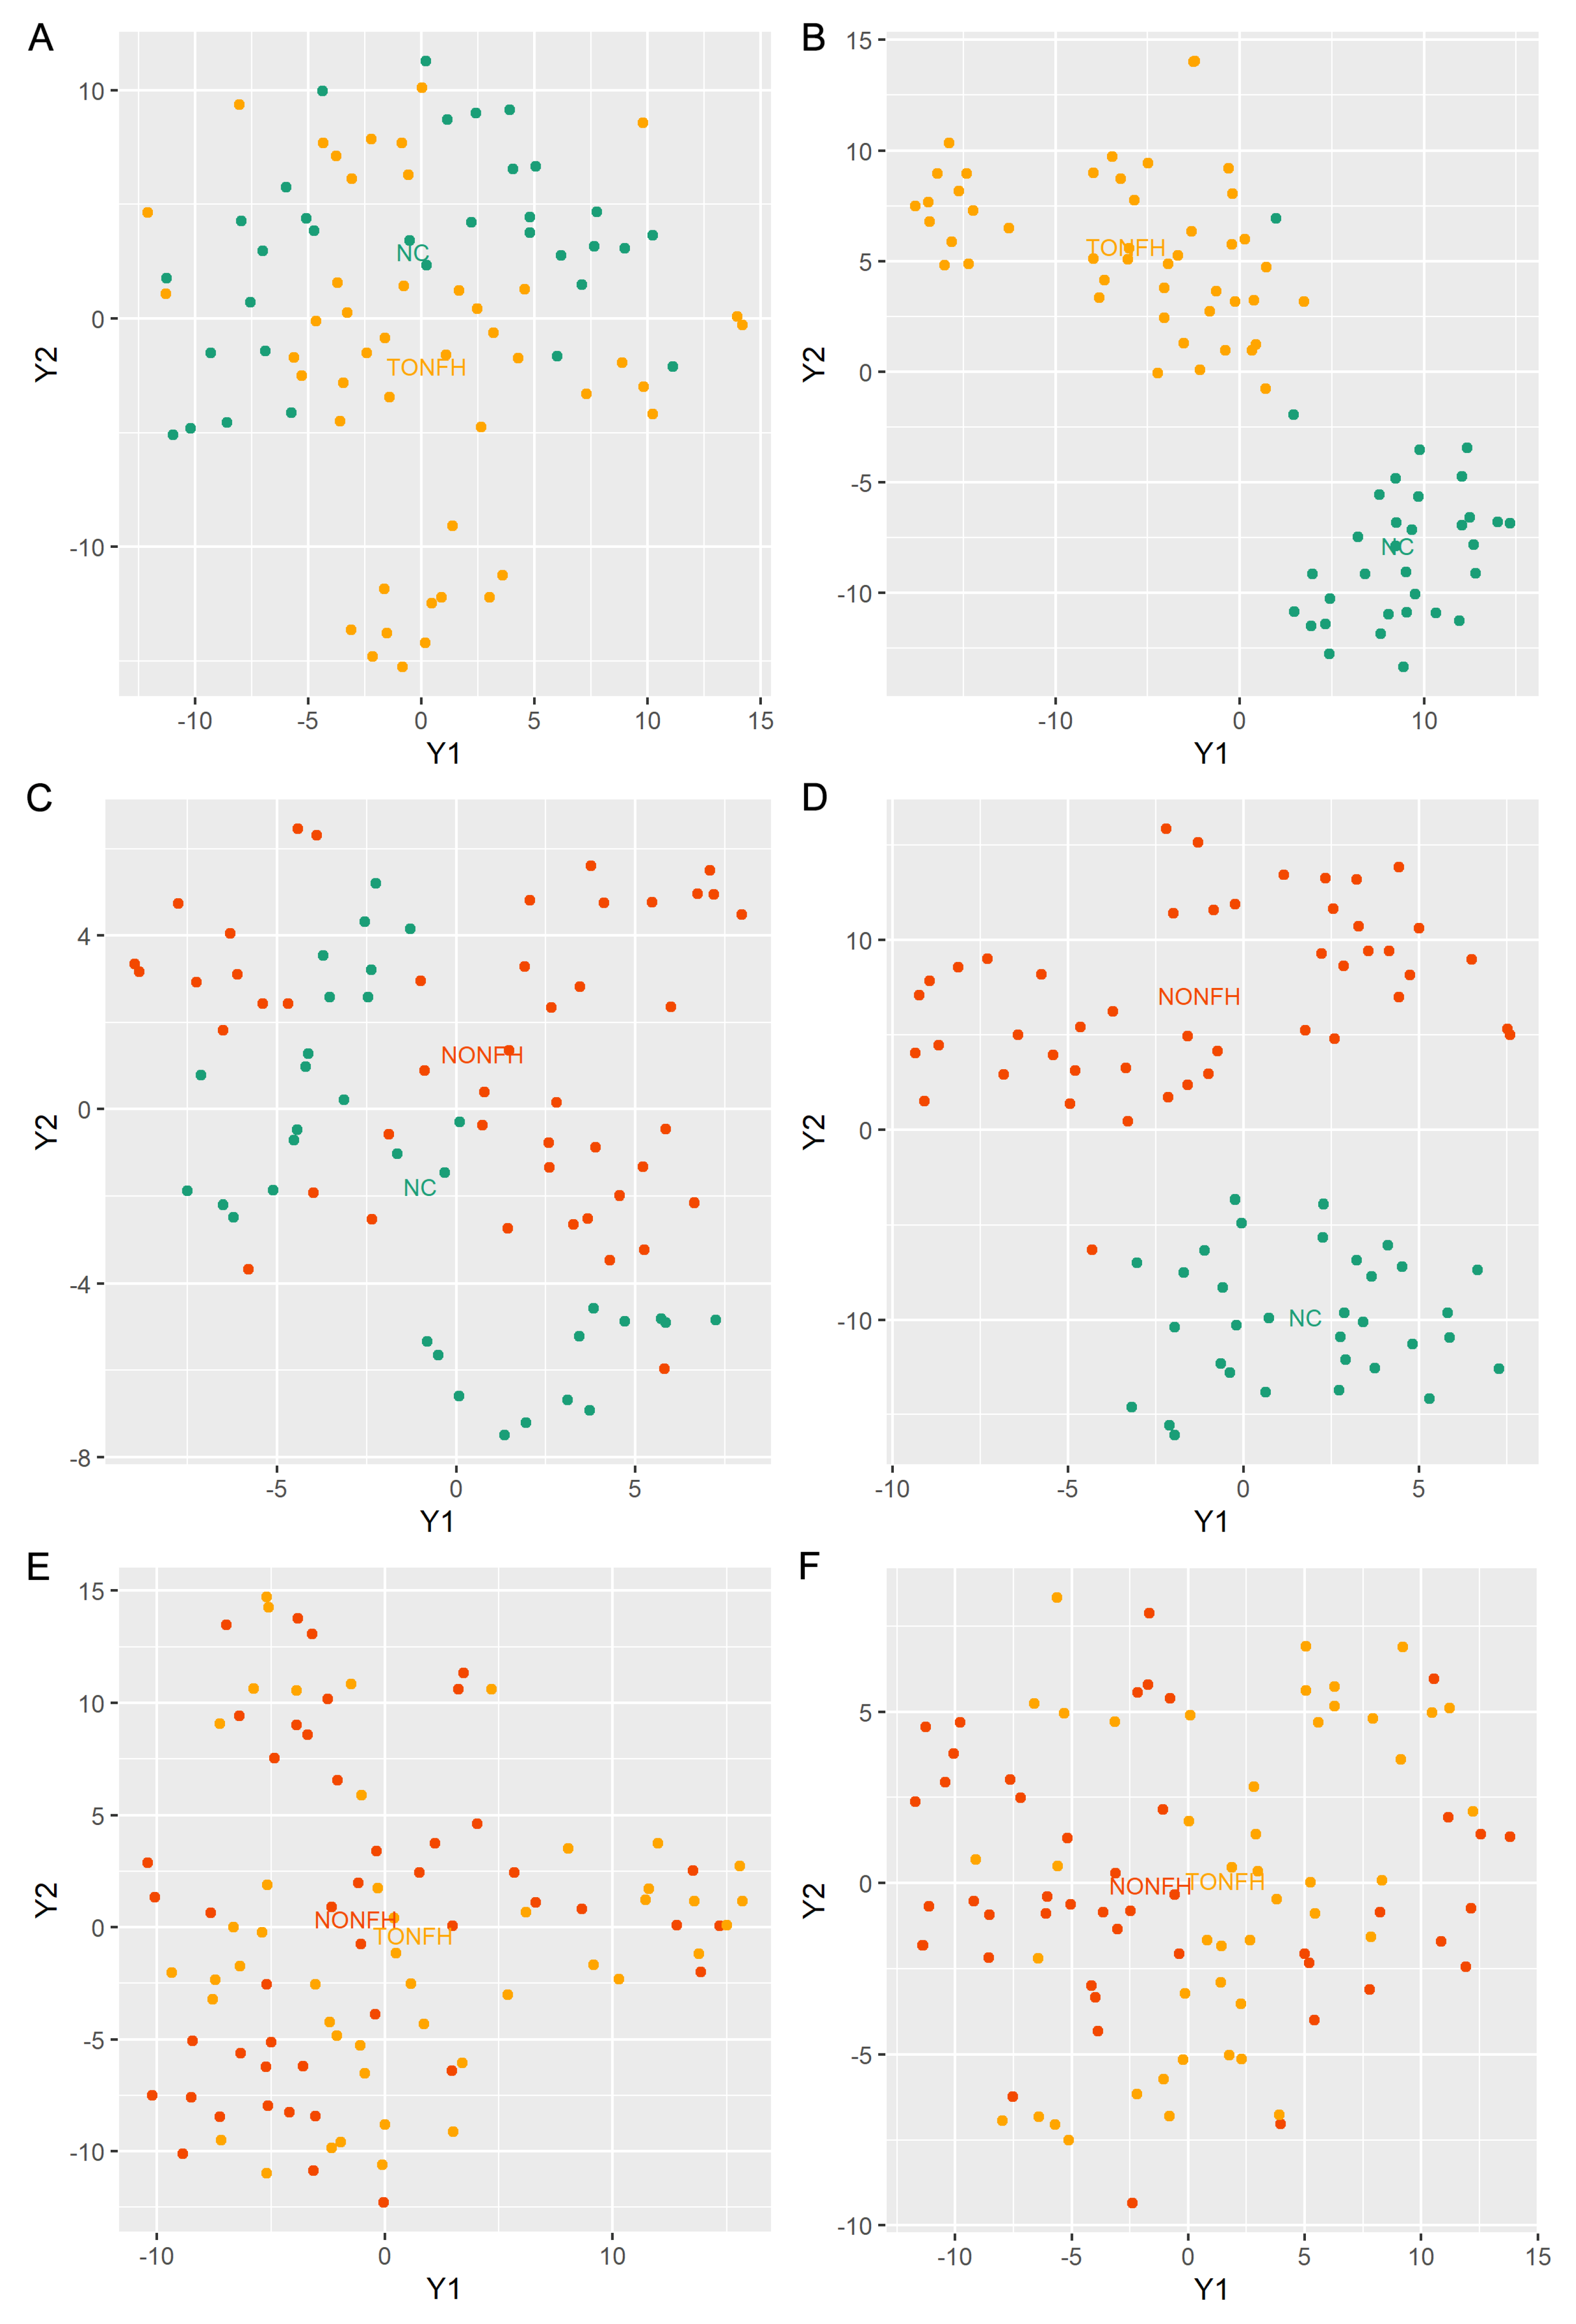
3.2. Overview of Lipidomic Profiling in TONFH, NONFH, and NC Samples
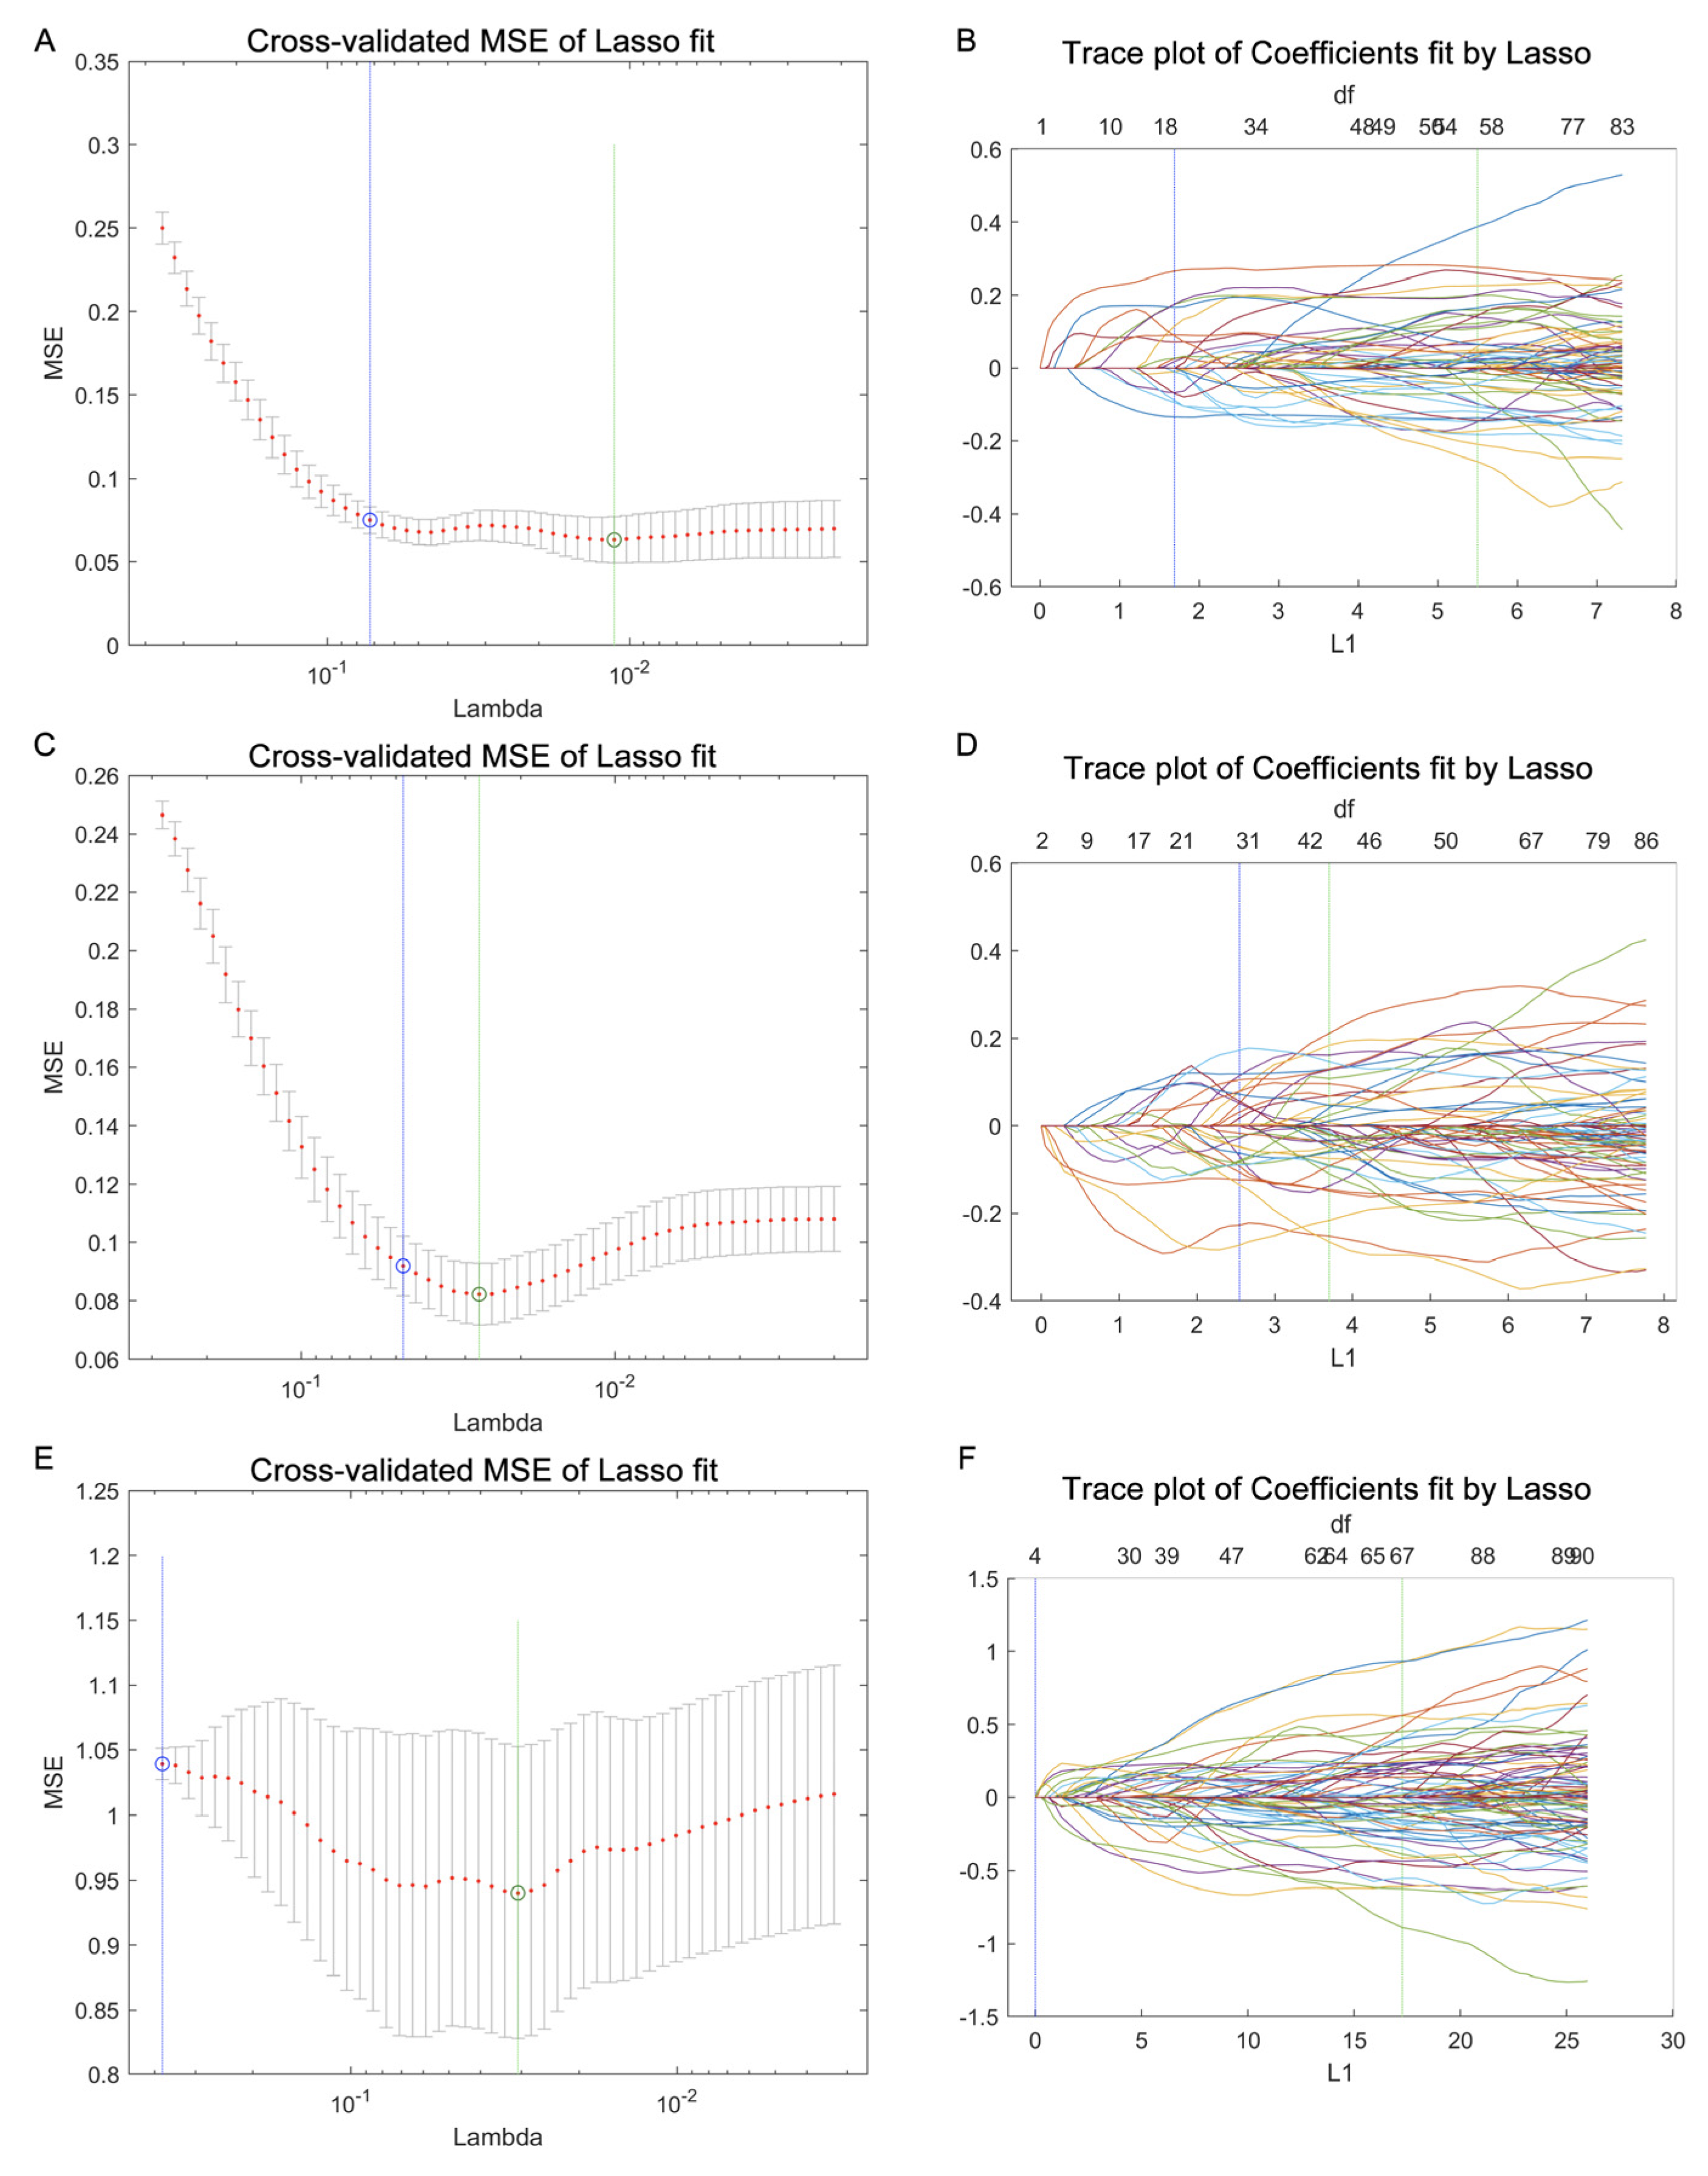
3.3. Using LASSO Regression for Lipid Feature Selection
4. Discussion
5. Conclusions
Supplementary Materials
Author Contributions
Funding
Institutional Review Board Statement
Informed Consent Statement
Data Availability Statement
Conflicts of Interest
References
- Rezus, E.; Tamba, B.I.; Badescu, M.C.; Popescu, D.; Bratoiu, I.; Rezus, C. Osteonecrosis of the Femoral Head in Patients with Hypercoagulability-From Pathophysiology to Therapeutic Implications. Int. J. Mol. Sci. 2021, 22, 6801. [Google Scholar] [CrossRef] [PubMed]
- Chen, Y.; Miao, Y.; Liu, K.; Xue, F.; Zhu, B.; Zhang, C.; Li, G. Evolutionary Course of the Femoral Head Osteonecrosis: Histopathological—Radiologic Characteristics and Clinical Staging Systems. J. Orthop. Transl. 2022, 32, 28–40. [Google Scholar] [CrossRef] [PubMed]
- Hwang, Y.; Park, J.; Choi, S.H.; Kim, G. Traumatic and Non-Traumatic Osteonecrosis in the Femoral Head of a Rabbit Model. Lab. Anim. Res. 2011, 27, 127–131. [Google Scholar] [CrossRef]
- Tripathy, S.K.; Goyal, T.; Sen, R.K. Management of Femoral Head Osteonecrosis: Current Concepts. Indian J. Orthop. 2015, 49, 28–45. [Google Scholar] [CrossRef]
- Li, Z.; Shao, W.; Lv, X.; Wang, B.; Han, L.; Gong, S.; Wang, P.; Feng, Y. Advances in Experimental Models of Osteonecrosis of the Femoral Head. J. Orthop. Transl. 2023, 39, 88–99. [Google Scholar] [CrossRef] [PubMed]
- Wen, Z.; Li, Y.; Cai, Z.; Fan, M.; Wang, J.; Ding, R.; Huang, C.; Xiao, W. Global Trends and Current Status in Osteonecrosis of the Femoral Head: A Bibliometric Analysis of Publications in the Last 30 Years. Front. Endocrinol. 2022, 13, 897439. [Google Scholar] [CrossRef]
- Zhao, D.; Zhang, F.; Wang, B.; Liu, B.; Li, L.; Kim, S.Y.; Goodman, S.B.; Hernigou, P.; Cui, Q.; Lineaweaver, W.C.; et al. Guidelines for Clinical Diagnosis and Treatment of Osteonecrosis of the Femoral Head in Adults (2019 Version). J. Orthop. Transl. 2020, 21, 100–110. [Google Scholar] [CrossRef]
- Mont, M.A.; Salem, H.S.; Piuzzi, N.S.; Goodman, S.B.; Jones, L.C. Nontraumatic Osteonecrosis of the Femoral Head: Where Do We Stand Today? A 5-Year Update. J. Bone Jt. Surg. Am. 2020, 102, 1084–1099. [Google Scholar] [CrossRef]
- Liu, N.; Zheng, C.; Wang, Q.; Huang, Z. Treatment of Non-Traumatic Avascular Necrosis of the Femoral Head (Review). Exp. Ther. Med. 2022, 23, 321. [Google Scholar] [CrossRef]
- Choi, H.R.; Steinberg, M.E.; Cheng, E.Y. Osteonecrosis of the Femoral Head: Diagnosis and Classification Systems. Curr. Rev. Musculoskelet. Med. 2015, 8, 210–220. [Google Scholar] [CrossRef]
- Yu, X.; Zhang, S.; Zhang, B.; Dai, M. Relationship of Idiopathic Femoral Head Necrosis with Blood Lipid Metabolism and Coagulation Function: A Propensity Score-Based Analysis. Front. Surg. 2022, 9, 938565. [Google Scholar] [CrossRef] [PubMed]
- Yan, Y.; Wang, J.; Huang, D.; Lv, J.; Li, H.; An, J.; Cui, X.; Zhao, H. Plasma Lipidomics Analysis Reveals Altered Lipids Signature in Patients with Osteonecrosis of the Femoral Head. Metabolomics 2022, 18, 14. [Google Scholar] [CrossRef] [PubMed]
- Rendina-Ruedy, E.; Rosen, C.J. Lipids in the Bone Marrow: An Evolving Perspective. Cell Metab. 2020, 31, 219–231. [Google Scholar] [CrossRef] [PubMed]
- Petek, D.; Hannouche, D.; Suva, D. Osteonecrosis of the Femoral Head: Pathophysiology and Current Concepts of Treatment. EFORT Open Rev. 2019, 4, 85–97. [Google Scholar] [CrossRef]
- Wang, B.; Wang, H.; Li, Y.; Song, L. Lipid Metabolism within the Bone Micro-Environment Is Closely Associated with Bone Metabolism in Physiological and Pathophysiological Stages. Lipids Heal. Dis. 2022, 21, 5. [Google Scholar] [CrossRef]
- Moya-Angeler, J.; Gianakos, A.L.; Villa, J.C.; Ni, A.; Lane, J.M. Current Concepts on Osteonecrosis of the Femoral Head. World J. Orthop. 2015, 6, 590–601. [Google Scholar] [CrossRef]
- Kang, P.; Gao, H.; Pei, F.; Shen, B.; Yang, J.; Zhou, Z. Effects of an Anticoagulant and a Lipid-Lowering Agent on the Prevention of Steroid-Induced Osteonecrosis in Rabbits. Int. J. Exp. Pathol. 2010, 91, 235–243. [Google Scholar] [CrossRef]
- Konarski, W.; Pobozy, T.; Konarska, K.; Sliwczynski, A.; Kotela, I.; Hordowicz, M.; Krakowiak, J. Osteonecrosis Related to Steroid and Alcohol Use-An Update on Pathogenesis. Healthcare 2023, 11, 1846. [Google Scholar] [CrossRef]
- Birla, V.; Vaish, A.; Vaishya, R. Risk Factors and Pathogenesis of Steroid-Induced Osteonecrosis of Femoral Head—A Scoping Review. J. Clin. Orthop. Trauma. 2021, 23, 101643. [Google Scholar] [CrossRef]
- Clish, C.B. Metabolomics: An Emerging but Powerful Tool for Precision Medicine. Cold Spring Harb. Mol. Case Stud. 2015, 1, a000588. [Google Scholar] [CrossRef]
- Fuller, H.; Zhu, Y.; Nicholas, J.; Chatelaine, H.A.; Drzymalla, E.M.; Sarvestani, A.K.; Julian-Serrano, S.; Tahir, U.A.; Sinnott-Armstrong, N.; Raffield, L.M.; et al. Metabolomic Epidemiology Offers Insights into Disease Aetiology. Nat. Metab. 2023, 5, 1656–1672. [Google Scholar] [CrossRef] [PubMed]
- Schmidt, D.R.; Patel, R.; Kirsch, D.G.; Lewis, C.A.; Vander Heiden, M.G.; Locasale, J.W. Metabolomics in Cancer Research and Emerging Applications in Clinical Oncology. CA Cancer J. Clin. 2021, 71, 333–358. [Google Scholar] [CrossRef] [PubMed]
- Ahluwalia, K.; Ebright, B.; Chow, K.; Dave, P.; Mead, A.; Poblete, R.; Louie, S.G.; Asante, I. Lipidomics in Understanding Pathophysiology and Pharmacologic Effects in Inflammatory Diseases: Considerations for Drug Development. Metabolites 2022, 12, 333. [Google Scholar] [CrossRef] [PubMed]
- Zandl-Lang, M.; Plecko, B.; Kofeler, H. Lipidomics-Paving the Road towards Better Insight and Precision Medicine in Rare Metabolic Diseases. Int. J. Mol. Sci. 2023, 24, 1709. [Google Scholar] [CrossRef]
- Wang, R.; Li, B.; Lam, S.M.; Shui, G. Integration of Lipidomics and Metabolomics for In-Depth Understanding of Cellular Mechanism and Disease Progression. J. Genet. Genom. 2020, 47, 69–83. [Google Scholar] [CrossRef]
- Han, X.; Gross, R.W. The Foundations and Development of Lipidomics. J. Lipid Res. 2022, 63, 100164. [Google Scholar] [CrossRef]
- Belhaj, M.R.; Lawler, N.G.; Hoffman, N.J. Metabolomics and Lipidomics: Expanding the Molecular Landscape of Exercise Biology. Metabolites 2021, 11, 151. [Google Scholar] [CrossRef]
- Rampler, E.; Abiead, Y.E.; Schoeny, H.; Rusz, M.; Hildebrand, F.; Fitz, V.; Koellensperger, G. Recurrent Topics in Mass Spectrometry-Based Metabolomics and Lipidomics-Standardization, Coverage, and Throughput. Anal. Chem. 2021, 93, 519–545. [Google Scholar] [CrossRef]
- Chappel, J.R.; Kirkwood-Donelson, K.I.; Reif, D.M.; Baker, E.S. From Big Data to Big Insights: Statistical and Bioinformatic Approaches for Exploring the Lipidome. Anal. Bioanal. Chem. 2023, 416, 2189–2202. [Google Scholar] [CrossRef]
- Petrick, L.M.; Shomron, N. AI/ML-Driven Advances in Untargeted Metabolomics and Exposomics for Biomedical Applications. Cell Rep. Phys. Sci. 2022, 3, 100978. [Google Scholar] [CrossRef]
- Bifarin, O.O.; Sah, S.; Gaul, D.A.; Moore, S.G.; Chen, R.; Palaniappan, M.; Kim, J.; Matzuk, M.M.; Fernandez, F.M. Machine Learning Reveals Lipidome Remodeling Dynamics in a Mouse Model of Ovarian Cancer. J. Proteome Res. 2023, 22, 2092–2108. [Google Scholar] [CrossRef] [PubMed]
- Galal, A.; Talal, M.; Moustafa, A. Applications of Machine Learning in Metabolomics: Disease Modeling and Classification. Front. Genet. 2022, 13, 1017340. [Google Scholar] [CrossRef] [PubMed]
- Pudjihartono, N.; Fadason, T.; Kempa-Liehr, A.W.; O’Sullivan, J.M. A Review of Feature Selection Methods for Machine Learning-Based Disease Risk Prediction. Front. Bioinform. 2022, 2, 927312. [Google Scholar] [CrossRef] [PubMed]
- Saeys, Y.; Inza, I.; Larranaga, P. A Review of Feature Selection Techniques in Bioinformatics. Bioinformatics 2007, 23, 2507–2517. [Google Scholar] [CrossRef]
- Lee, I.C.H.; Tumanov, S.; Wong, J.W.H.; Stocker, R.; Ho, J.W.K. Integrative Processing of Untargeted Metabolomic and Lipidomic Data Using MultiABLER. iScience 2023, 26, 106881. [Google Scholar] [CrossRef]
- Acharjee, A.; Ament, Z.; West, J.A.; Stanley, E.; Griffin, J.L. Integration of Metabolomics, Lipidomics and Clinical Data Using a Machine Learning Method. BMC Bioinform. 2016, 17, 440. [Google Scholar] [CrossRef]
- Fahy, E.; Subramaniam, S.; Murphy, R.C.; Nishijima, M.; Raetz, C.R.; Shimizu, T.; Spener, F.; van Meer, G.; Wakelam, M.J.; Dennis, E.A. Update of the LIPID MAPS Comprehensive Classification System for Lipids. J. Lipid Res. 2009, 50, S9–S14. [Google Scholar] [CrossRef]
- Kind, T.; Okazaki, Y.; Saito, K.; Fiehn, O. LipidBlast Templates as Flexible Tools for Creating New In-Silico Tandem Mass Spectral Libraries. Anal. Chem. 2014, 86, 11024–11027. [Google Scholar] [CrossRef]
- Vasquez, M.M.; Hu, C.; Roe, D.J.; Chen, Z.; Halonen, M.; Guerra, S. Least Absolute Shrinkage and Selection Operator Type Methods for the Identification of Serum Biomarkers of Overweight and Obesity: Simulation and Application. BMC Med. Res. Methodol. 2016, 16, 154. [Google Scholar] [CrossRef]
- Li, Y.; Lu, F.; Yin, Y. Applying Logistic LASSO Regression for the Diagnosis of Atypical Crohn’s Disease. Sci. Rep. 2022, 12, 11340. [Google Scholar] [CrossRef]
- Tian, L.; Yu, X. Lipid Metabolism Disorders and Bone Dysfunction--Interrelated and Mutually Regulated (Review). Mol. Med. Rep. 2015, 12, 783–794. [Google Scholar] [CrossRef] [PubMed]
- Alekos, N.S.; Moorer, M.C.; Riddle, R.C. Dual Effects of Lipid Metabolism on Osteoblast Function. Front. Endocrinol. 2020, 11, 578194. [Google Scholar] [CrossRef] [PubMed]
- Srivastava, R.K.; Sapra, L.; Mishra, P.K. Osteometabolism: Metabolic Alterations in Bone Pathologies. Cells 2022, 11, 3943. [Google Scholar] [CrossRef] [PubMed]
- Wang, X.Y.; Zhang, L.L.; Jiang, C.; Hua, B.X.; Ji, Z.F.; Fan, W.S.; Gong, L.J.; Zhu, L.; Wang, X.D.; Yan, Z.Q. Altered Lipidomic Profiles in Patients with and without Osteonecrosis of the Femoral Head after 1-Month Glucocorticoid Treatment. Clin. Transl. Med. 2021, 11, e298. [Google Scholar] [CrossRef]
- Wang, H.; Leng, Y.; Gong, Y. Bone Marrow Fat and Hematopoiesis. Front. Endocrinol. 2018, 9, 694. [Google Scholar] [CrossRef]
- Wang, J.; Han, X. Analytical Challenges of Shotgun Lipidomics at Different Resolution of Measurements. Trends Anal. Chem. 2019, 121, 115697. [Google Scholar] [CrossRef]
- Zullig, T.; Kofeler, H.C. High Resolution Mass Spectrometry in Lipidomics. Mass. Spectrom. Rev. 2021, 40, 162–176. [Google Scholar] [CrossRef]


| Groups | Number | Age (Years) | Gender | BMI | ARCO Stage | |
|---|---|---|---|---|---|---|
| Female/Male | I/II | III/IV | ||||
| NC | 33 | 48.33 ± 8.60 | 15/18 | 23.17 ± 2.68 | --- | --- |
| TONFH | 46 | 49.46 ± 12.38 | 21/25 | 23.88 ± 2.73 | 6/7 | 18/15 |
| NONFH | 46 | 48.87 ± 14.43 | 17/29 | 23.93 ± 2.84 | 5/8 | 16/17 |
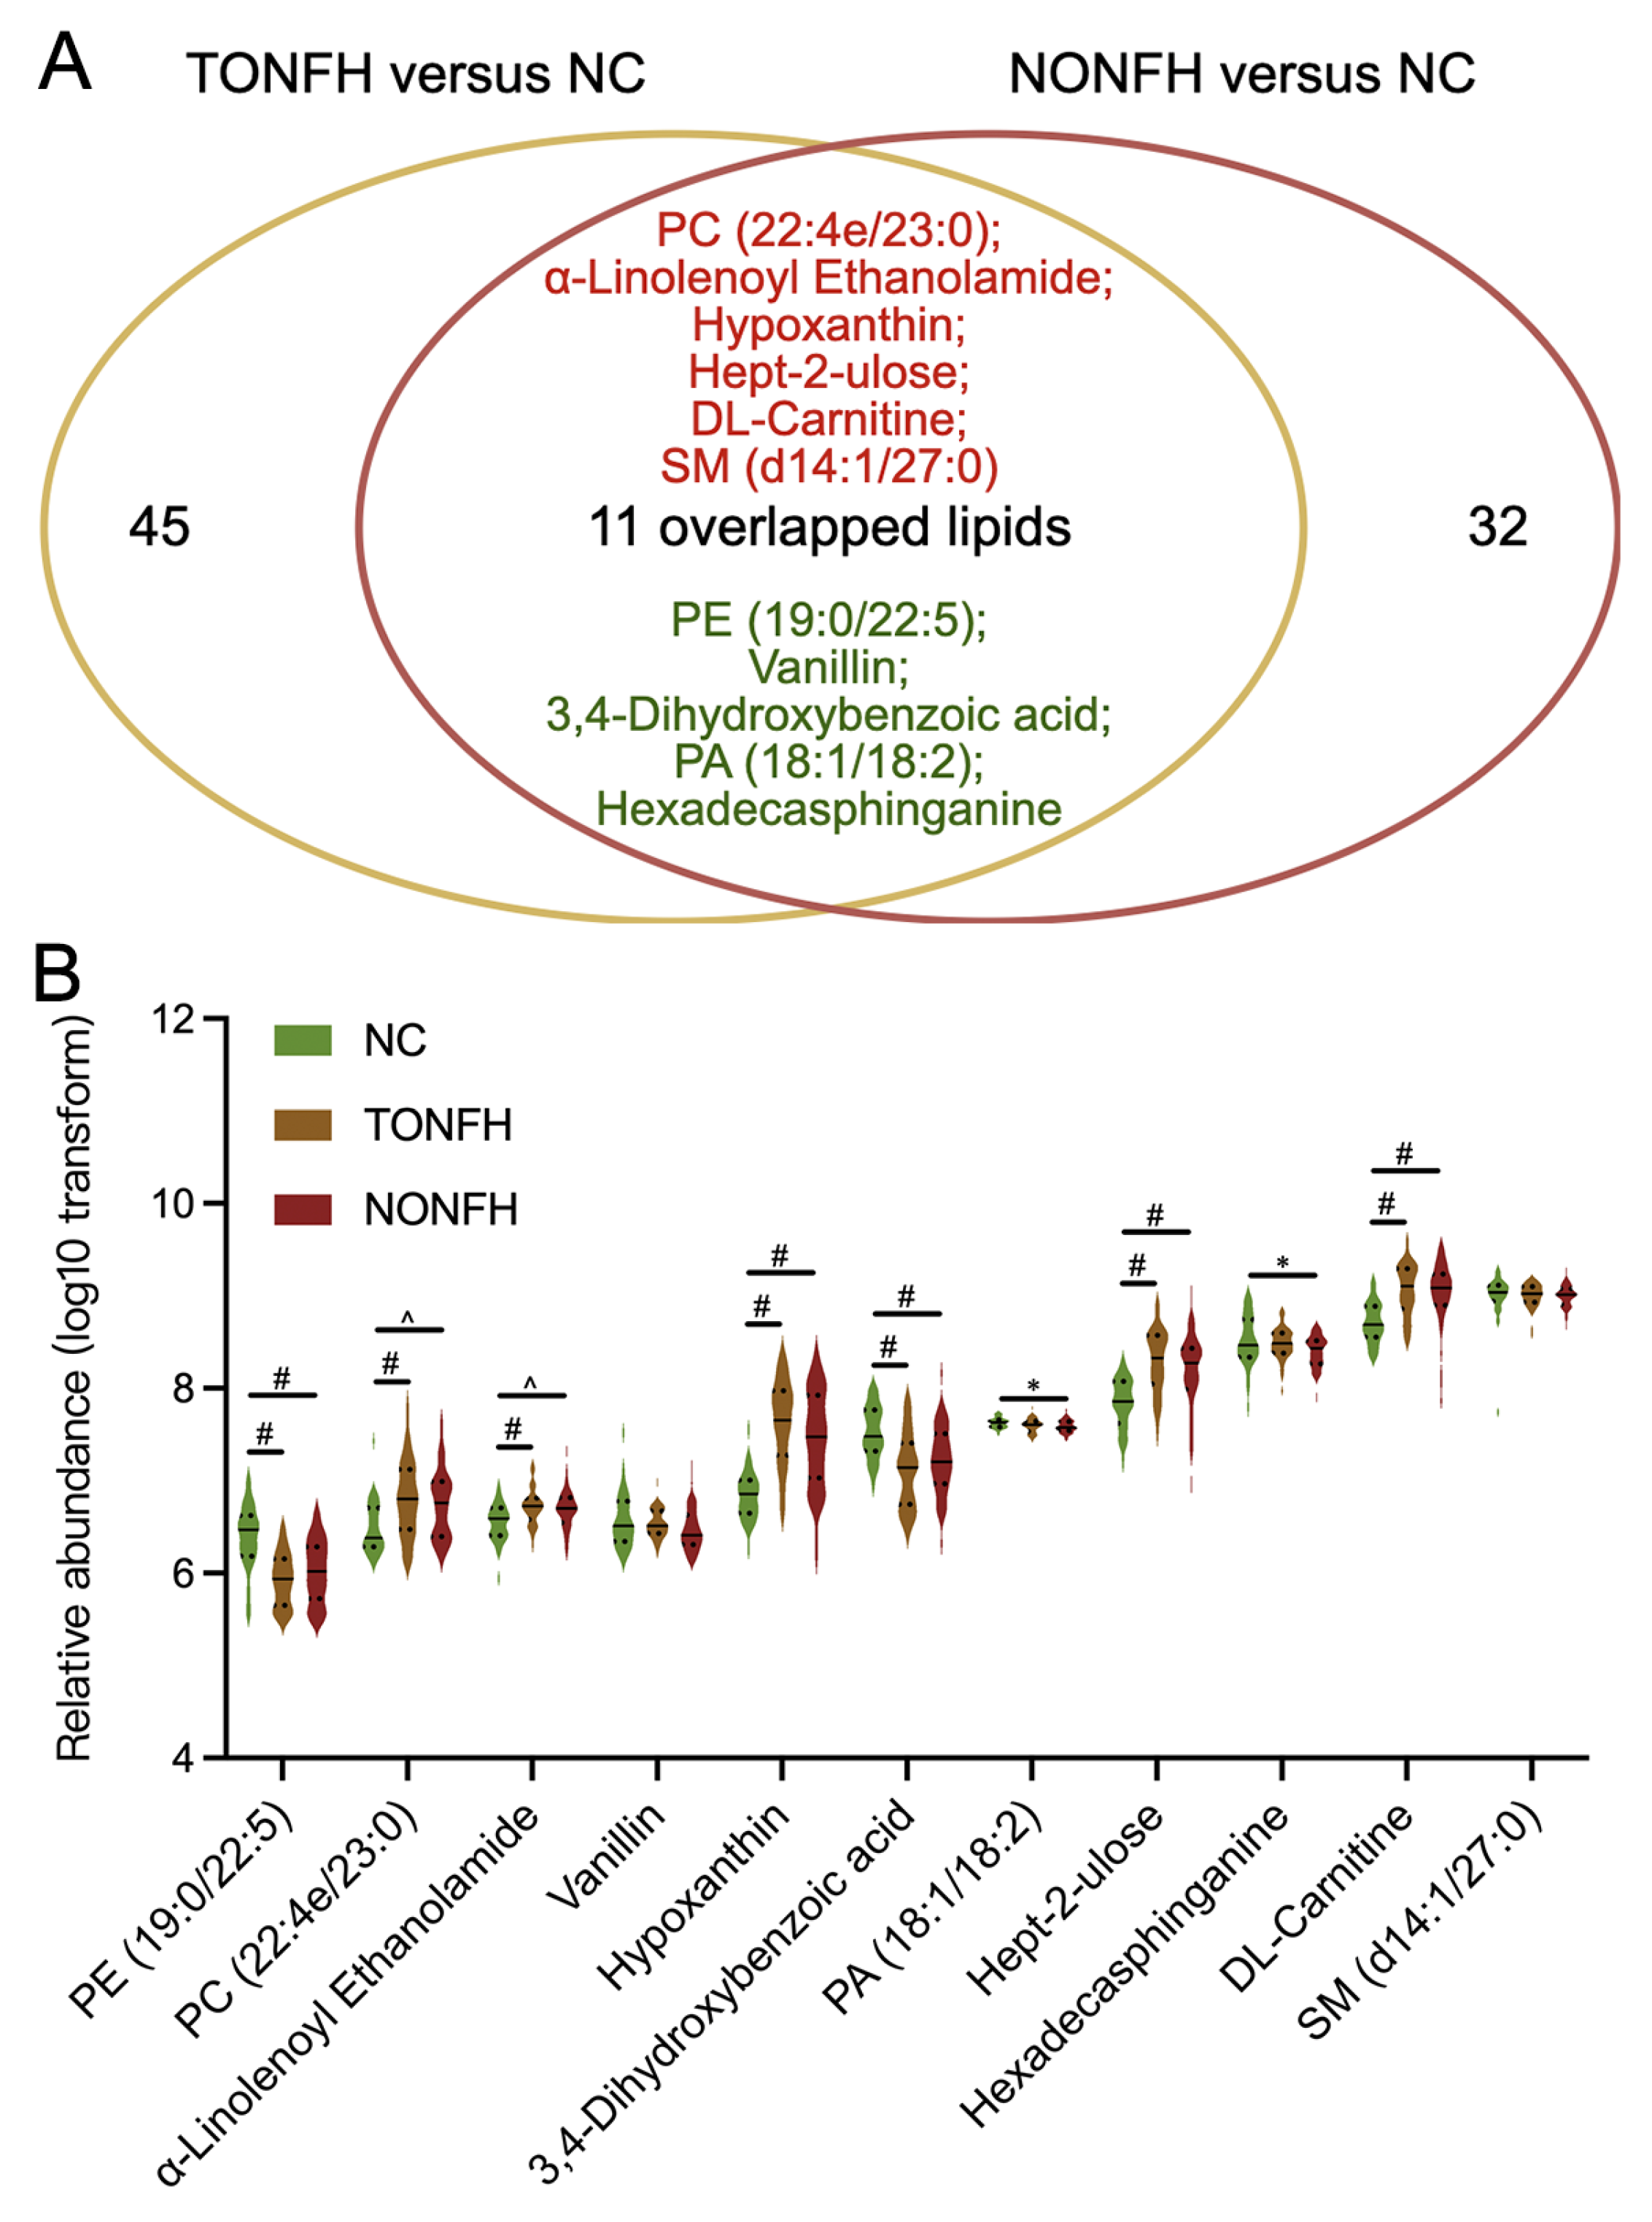
| Lipids | Formula | Molecular Weight | Retention Time [min] | Relative Abundances (log10) | Area Under Curves | |||
|---|---|---|---|---|---|---|---|---|
| NC | TONFH | NONFH | TONFH/NC | NONFH/NC | ||||
| PE (19:0/22:5) | C46H82NO8P | 807.577 | 11.412 | 6.386 | 5.928 # | 6.024 # | 0.845 | 0.775 |
| PC (22:4e/23:0) | C53H100NO7P | 893.717 | 15.368 | 6.492 | 6.813 # | 6.752 ^ | 0.738 | 0.721 |
| α-Linolenoyl Ethanolamide | C20H35NO2 | 321.267 | 3.579 | 6.541 | 6.720 # | 6.689 ^ | 0.735 | 0.689 |
| Vanillin | C8H8O3 | 152.047 | 0.996 | 6.572 | 6.532 | 6.474 | 0.512 | 0.599 |
| Hypoxanthine | C5H4N4O | 136.039 | 0.947 | 6.834 | 7.632 # | 7.439 # | 0.920 | 0.832 |
| 3,4-Dihydroxybenzoic acid | C7H6O4 | 154.026 | 0.965 | 7.524 | 7.107 # | 7.222 # | 0.785 | 0.739 |
| PA (18:1/18:2) | C39H71O8P | 698.488 | 10.837 | 7.625 | 7.597 | 7.589 * | 0.605 | 0.663 |
| Hept-2-ulose | C7H14O7 | 210.073 | 0.966 | 7.836 | 8.285 # | 8.179 # | 0.831 | 0.779 |
| Hexadecasphinganine | C16H35NO2 | 273.267 | 0.947 | 8.506 | 8.480 | 8.395 * | 0.517 | 0.619 |
| DL-Carnitine | C7H15NO3 | 161.105 | 1.232 | 8.710 | 9.065 # | 9.020 # | 0.836 | 0.817 |
| SM (d14:1/27:0) | C46H93N2O6P | 846.682 | 14.445 | 8.991 | 9.001 | 8.995 | 0.542 | 0.567 |
Disclaimer/Publisher’s Note: The statements, opinions and data contained in all publications are solely those of the individual author(s) and contributor(s) and not of MDPI and/or the editor(s). MDPI and/or the editor(s) disclaim responsibility for any injury to people or property resulting from any ideas, methods, instructions or products referred to in the content. |
© 2024 by the authors. Licensee MDPI, Basel, Switzerland. This article is an open access article distributed under the terms and conditions of the Creative Commons Attribution (CC BY) license (https://creativecommons.org/licenses/by/4.0/).
Share and Cite
Yan, Y.; Wang, J.; Wang, Y.; Wu, W.; Chen, W. Research on Lipidomic Profiling and Biomarker Identification for Osteonecrosis of the Femoral Head. Biomedicines 2024, 12, 2827. https://doi.org/10.3390/biomedicines12122827
Yan Y, Wang J, Wang Y, Wu W, Chen W. Research on Lipidomic Profiling and Biomarker Identification for Osteonecrosis of the Femoral Head. Biomedicines. 2024; 12(12):2827. https://doi.org/10.3390/biomedicines12122827
Chicago/Turabian StyleYan, Yuzhu, Jihan Wang, Yangyang Wang, Wenjing Wu, and Wei Chen. 2024. "Research on Lipidomic Profiling and Biomarker Identification for Osteonecrosis of the Femoral Head" Biomedicines 12, no. 12: 2827. https://doi.org/10.3390/biomedicines12122827
APA StyleYan, Y., Wang, J., Wang, Y., Wu, W., & Chen, W. (2024). Research on Lipidomic Profiling and Biomarker Identification for Osteonecrosis of the Femoral Head. Biomedicines, 12(12), 2827. https://doi.org/10.3390/biomedicines12122827