

Reference Interval for Glycated Albumin, 1,5-AG/GA, and GA/HbA1c Ratios and Cut-Off Values for Type 1, Type 2, and Gestational Diabetes: A Cross-Sectional Study
 , , , ,
  , and
, and
Abstract
:
1. Introduction
2. Materials and Methods
2.1. Subjects and People with Diabetes
2.2. Inclusion/Exclusion Criteria
2.3. Biomarker Measurements
2.4. Statistics Analysis
3. Results
3.1. Reference Interval for Glycated Albumin
3.2. Reference Interval for 1,5-Anhydroglucitol to Glycated Albumin Ratio
3.3. Reference Interval for Glycated Albumin to Glycated Hemoglobin (GA/HbA1c)
3.4. Effect of Sex on the Reference Interval in the Biomarkers
3.5. People with Diabetes—Group Characteristics
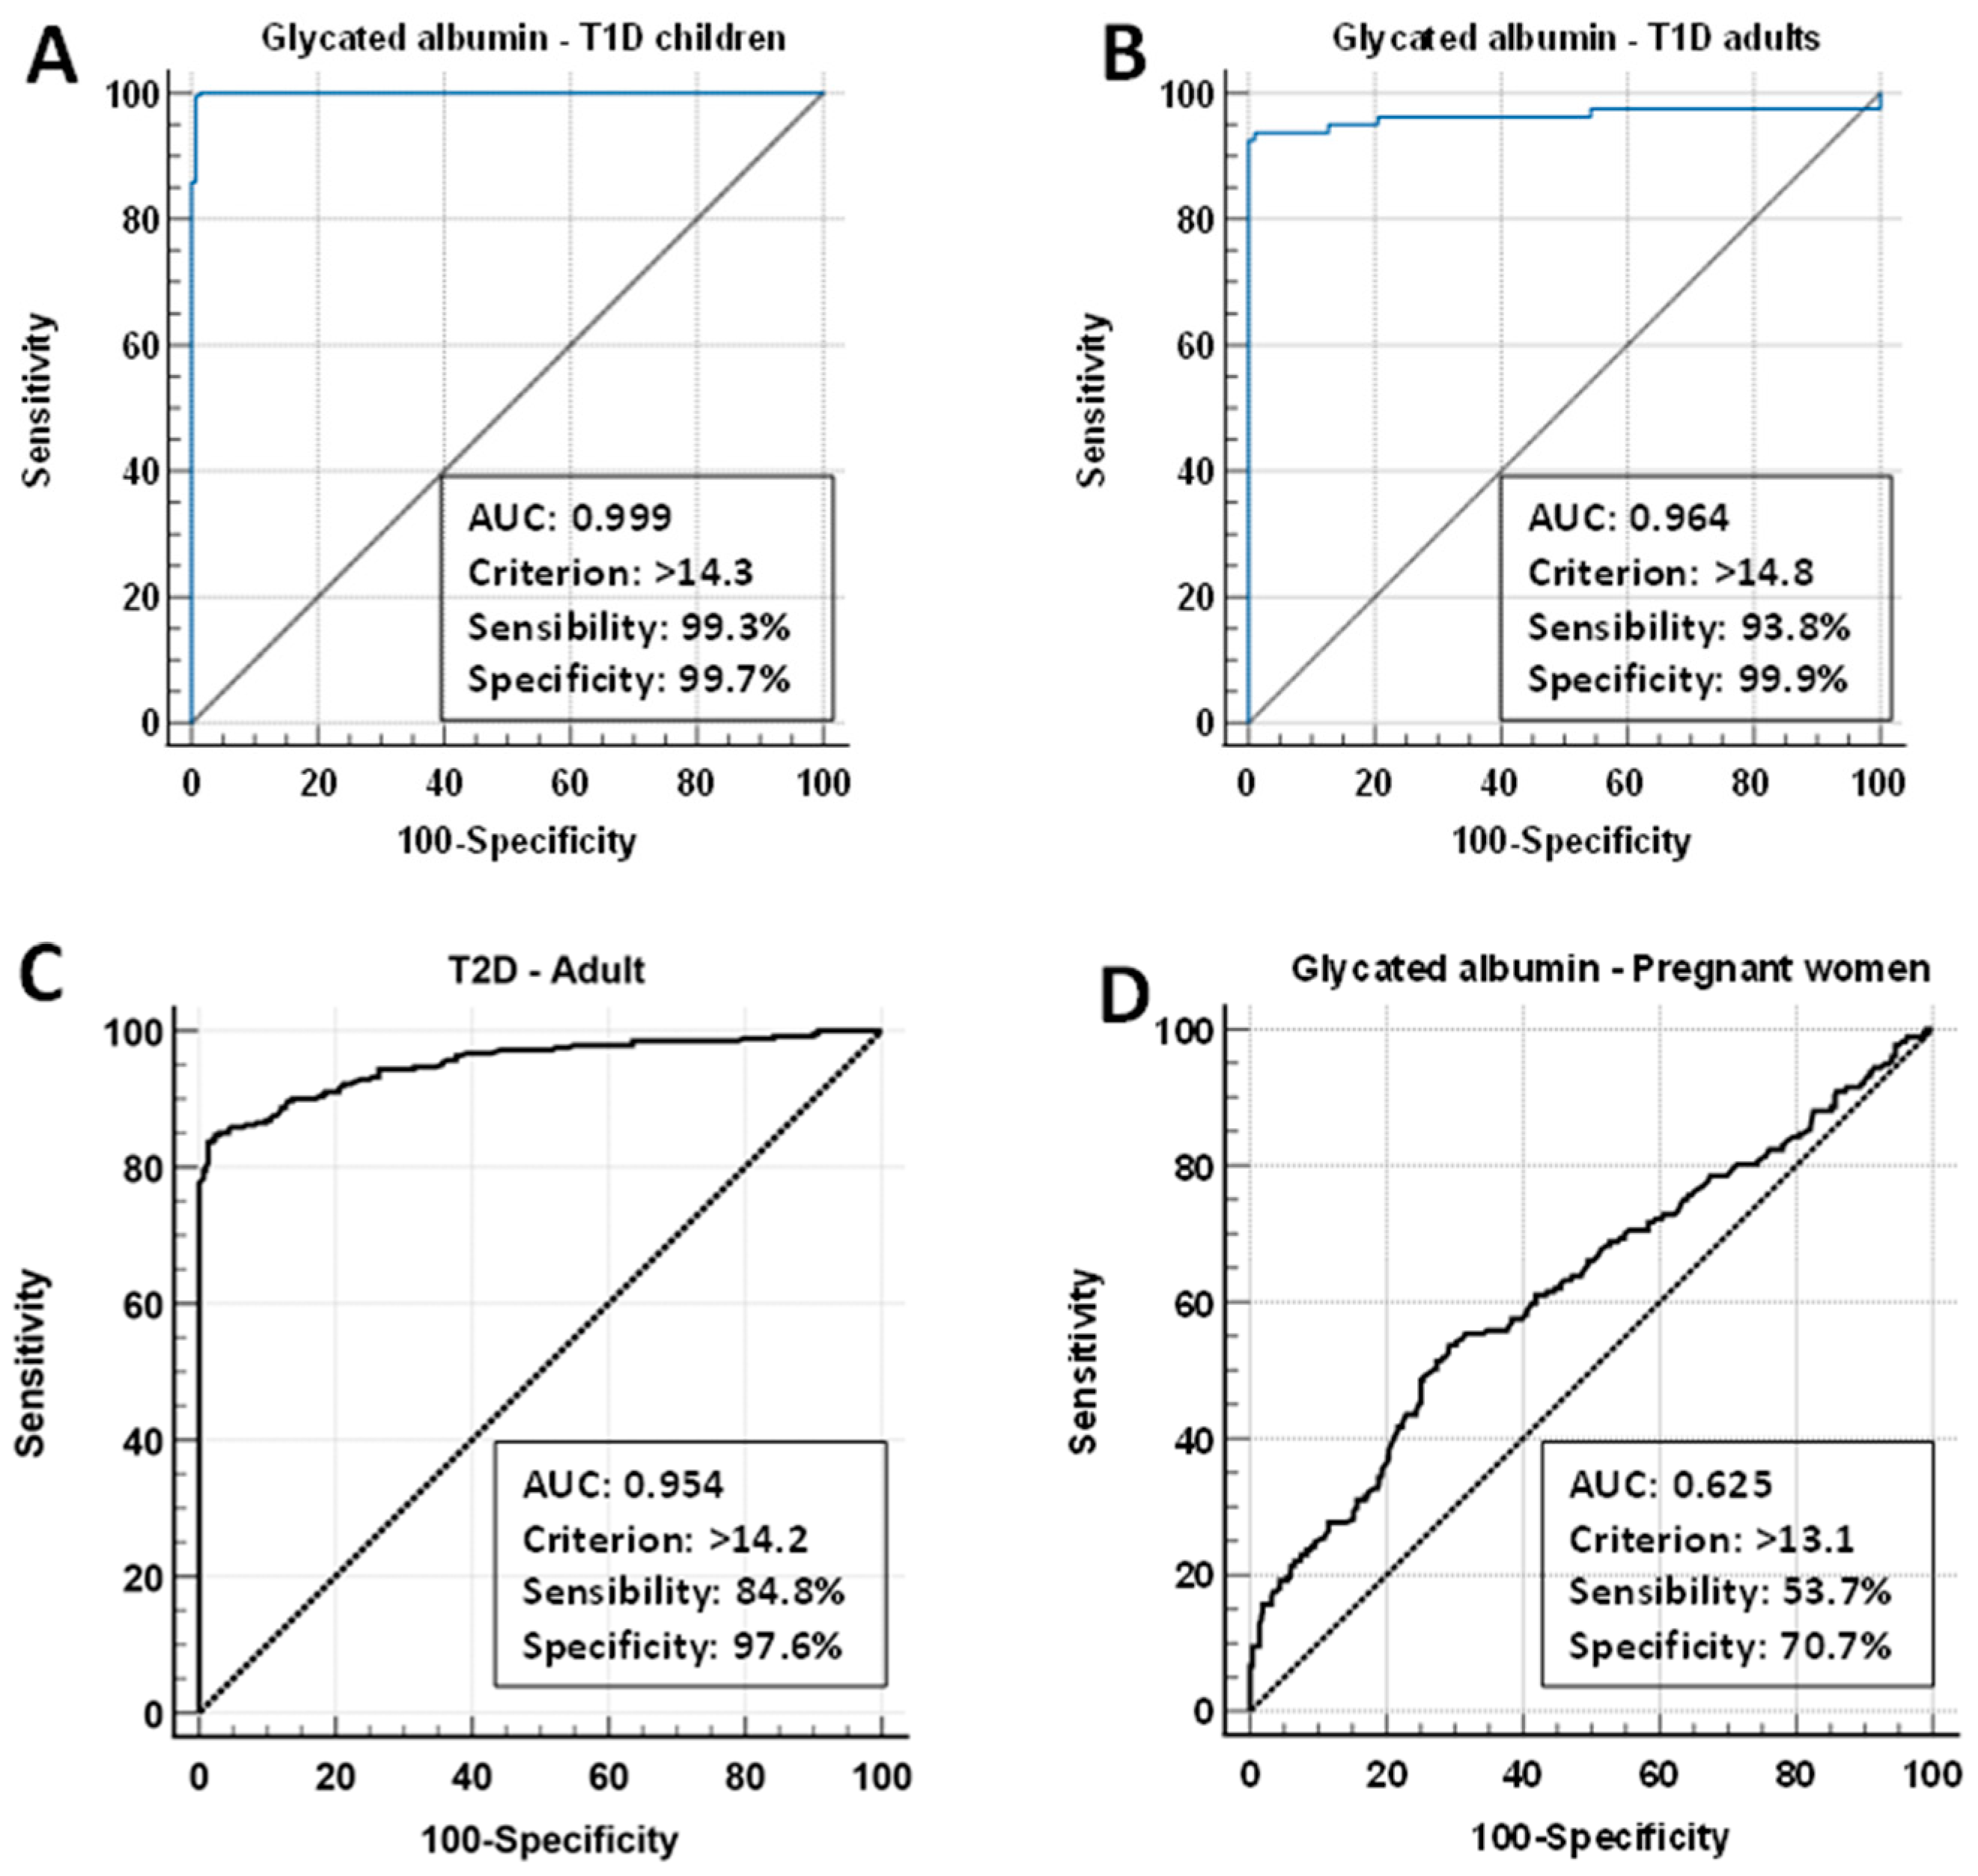
3.6. Cut-Off Values for Diabetes with Glycated Albumin, 1,5-AG/GA, and GA/HbA1c Ratios
3.7. Cut-Off Values for Diabetes with 1,5-AG/GA (AGI) and GA/HbA1c Ratios
4. Discussion
4.1. Glycated Albumin Reference Interval for Pregnant and Non-Pregnant Individuals
4.2. GA and Diabetes Cut-Off Values for Pregnant Women
4.3. Glycated Albumin/Glycated Hemoglobin Ratio for Non-Pregnant Women
5. Study Limitations
6. Conclusions
Supplementary Materials
Author Contributions
Funding
Institutional Review Board Statement
Informed Consent Statement
Data Availability Statement
Acknowledgments
Conflicts of Interest
References
- IDF. IDF DIABETES ATLAS. Available online: www.diabetesatlas.org (accessed on 5 January 2021).
- The Diabetes Control and Complications Trial Research Group. The effect of intensive treatment of diabetes on the development and progression of long-term complications in insulin-dependent diabetes mellitus. New Engl. J. Med. 1993, 329, 977–986. [Google Scholar] [CrossRef] [PubMed]
- The Diabetes Control and Complications Trial Research Group. Effect of intensive therapy on the development and progression of diabetic nephropathy in the Diabetes Control and Complications Trial. Kidney Int. 1995, 47, 1703–1720. [Google Scholar] [CrossRef] [PubMed]
- The Diabetes Control and Complications Trial Research Group. The relationship of glycemic exposure (HbA1c) to the risk of development and progression of retinopathy in the diabetes control and complications trial. Diabetes 1995, 44, 968–983. [Google Scholar] [CrossRef]
- American Diabetes Association Professional Practice Committee; ElSayed, N.A.; Aleppo, G.; Bannuru, R.R.; Bruemmer, D.; Collins, B.S.; Ekhlaspour, L.; Gaglia, J.L.; Hilliard, M.E.; Johnson, E.L.; et al. 3. Prevention or Delay of Diabetes and Associated Comorbidities: Standards of Care in Diabetes-2024. Diabetes Care 2024, 47, S43–S51. [Google Scholar] [CrossRef]
- Sato, A.; Yada, S.; Hosoba, E.; Kanno, H.; Miura, H. Establishment of glycated albumin unit conversion equation from the standardized value (mmol/mol) to the routinely used value (%). Ann. Clin. Biochem. 2019, 56, 204–209. [Google Scholar] [CrossRef]
- Sherwani, S.I.; Khan, H.A.; Ekhzaimy, A.; Masood, A.; Sakharkar, M.K. Significance of HbA1c Test in Diagnosis and Prognosis of Diabetic Patients. Biomark. Insights 2016, 11, 95–104. [Google Scholar] [CrossRef]
- Beyond A1C Writing Group. Need for Regulatory Change to Incorporate Beyond A1C Glycemic Metrics. Diabetes Care 2018, 41, e92–e94. [Google Scholar] [CrossRef]
- Selvin, E.; Francis, L.M.; Ballantyne, C.M.; Hoogeveen, R.C.; Coresh, J.; Brancati, F.L.; Steffes, M.W. Nontraditional markers of glycemia: Associations with microvascular conditions. Diabetes Care 2011, 34, 960–967. [Google Scholar] [CrossRef]
- Juraschek, S.P.; Steffes, M.W.; Selvin, E. Associations of alternative markers of glycemia with hemoglobin A(1c) and fasting glucose. Clin. Chem. 2012, 58, 1648–1655. [Google Scholar] [CrossRef]
- Liu, L.; Wan, X.; Liu, J.; Huang, Z.; Cao, X.; Li, Y. Increased 1,5-anhydroglucitol predicts glycemic remission in patients with newly diagnosed type 2 diabetes treated with short-term intensive insulin therapy. Diabetes Technol. Ther. 2012, 14, 756–761. [Google Scholar] [CrossRef]
- Zemlin, A.E.; Barkhuizen, M.; Kengne, A.P.; Erasmus, R.T.; Matsha, T.E. Performance of glycated albumin for type 2 diabetes and prediabetes diagnosis in a South African population. Clin. Chim. Acta 2019, 488, 122–128. [Google Scholar] [CrossRef] [PubMed]
- Ying, L.; He, X.; Ma, X.; Shen, Y.; Su, H.; Peng, J.; Wang, Y.; Bao, Y.; Zhou, J.; Jia, W. Serum 1,5-anhydroglucitol when used with fasting plasma glucose improves the efficiency of diabetes screening in a Chinese population. Sci. Rep. 2017, 7, 11968. [Google Scholar] [CrossRef] [PubMed]
- Dungan, K.M.; Buse, J.B.; Largay, J.; Kelly, M.M.; Button, E.A.; Kato, S.; Wittlin, S. 1,5-anhydroglucitol and postprandial hyperglycemia as measured by continuous glucose monitoring system in moderately controlled patients with diabetes. Diabetes Care 2006, 29, 1214–1219. [Google Scholar] [CrossRef] [PubMed]
- Koga, M. 1,5-Anhydroglucitol and glycated albumin in glycemia. Adv. Clin. Chem. 2014, 64, 269–301. [Google Scholar] [PubMed]
- Kim, W.J.; Park, C.Y. 1,5-Anhydroglucitol in diabetes mellitus. Endocrine 2013, 43, 33–40. [Google Scholar] [CrossRef]
- Furusyo, N.; Hayashi, J. Glycated albumin and diabetes mellitus. Biochim. Biophys. Acta 2013, 1830, 5509–5514. [Google Scholar] [CrossRef]
- Koga, M.; Kasayama, S. Clinical impact of glycated albumin as another glycemic control marker. Endocr. J. 2010, 57, 751–762. [Google Scholar] [CrossRef]
- Rondeau, P.; Bourdon, E. The glycation of albumin: Structural and functional impacts. Biochimie 2011, 93, 645–658. [Google Scholar] [CrossRef]
- Ciaccio, M. Introduction of glycated albumin in clinical practice. J. Lab. Precis. Med. 2019, 4, 28. [Google Scholar] [CrossRef]
- Qiu, H.Y.; Hou, N.N.; Shi, J.F.; Liu, Y.P.; Kan, C.X.; Han, F.; Sun, X.D. Comprehensive overview of human serum albumin glycation in diabetes mellitus. World J. Diabetes 2021, 12, 1057–1069. [Google Scholar] [CrossRef]
- Tang, M.; Berg, A.H.; Zheng, H.; Rhee, E.P.; Allegretti, A.S.; Nigwekar, S.U.; Karumanchi, S.A.; Lash, J.P.; Kalim, S. Glycated Albumin and Adverse Clinical Outcomes in Patients With CKD: A Prospective Cohort Study. Am. J. Kidney Dis. Off. J. Natl. Kidney Found. 2024, 84, 329–338. [Google Scholar] [CrossRef] [PubMed]
- Wu, W.C.; Ma, W.Y.; Wei, J.N.; Yu, T.Y.; Lin, M.S.; Shih, S.R.; Hua, C.H.; Liao, Y.J.; Chuang, L.M.; Li, H.Y. Serum Glycated Albumin to Guide the Diagnosis of Diabetes Mellitus. PLoS ONE 2016, 11, e0146780. [Google Scholar] [CrossRef] [PubMed]
- Inaba, M.; Okuno, S.; Kumeda, Y.; Yamada, S.; Imanishi, Y.; Tabata, T.; Okamura, M.; Okada, S.; Yamakawa, T.; Ishimura, E.; et al. Glycated albumin is a better glycemic indicator than glycated hemoglobin values in hemodialysis patients with diabetes: Effect of anemia and erythropoietin injection. J. Am. Soc. Nephrol. JASN 2007, 18, 896–903. [Google Scholar] [CrossRef] [PubMed]
- Xu, H.; Pan, J.; Chen, Q. The progress of clinical research on the detection of 1,5-anhydroglucitol in diabetes and its complications. Front. Endocrinol. 2024, 15, 1383483. [Google Scholar] [CrossRef] [PubMed]
- Nathan, D.M.; Steffes, M.W.; Sun, W.; Rynders, G.P.; Lachin, J.M. Determining stability of stored samples retrospectively: The validation of glycated albumin. Clin. Chem. 2011, 57, 286–290. [Google Scholar] [CrossRef]
- Welter, M.; Boritza, K.C.; Anghebem-Oliveira, M.I.; Henneberg, R.; Hauser, A.B.; Rego, F.G.M.; Picheth, G. Reference intervals for serum 1,5-anhydroglucitol in children, adolescents, adults, and pregnant women. Clin. Chim. Acta 2018, 486, 54–58. [Google Scholar] [CrossRef]
- Tseng, K.B. Alternative Biomarkers for Assessing Glycemic Control for the Prognosis and Management of Diabetes. E-Da Med. J. 2023, 10, 1–17. [Google Scholar] [CrossRef]
- Paroni, R.; Ceriotti, F.; Galanello, R.; Battista Leoni, G.; Panico, A.; Scurati, E.; Paleari, R.; Chemello, L.; Quaino, V.; Scaldaferri, L.; et al. Performance characteristics and clinical utility of an enzymatic method for the measurement of glycated albumin in plasma. Clin. Biochem. 2007, 40, 1398–1405. [Google Scholar] [CrossRef]
- Yazdanpanah, S.; Rabiee, M.; Tahriri, M.; Abdolrahim, M.; Rajab, A.; Jazayeri, H.E.; Tayebi, L. Evaluation of glycated albumin (GA) and GA/HbA1c ratio for diagnosis of diabetes and glycemic control: A comprehensive review. Crit. Rev. Clin. Lab. Sci. 2017, 54, 219–232. [Google Scholar] [CrossRef]
- Oğuz, O.; Mercan, H.; Hocaoglu-Emre, F.S. Biological variation of glycated albumin, glucose and albumin in healthy Turkish subjects. Turk. J. Biochem. 2021, 46, 197–203. [Google Scholar] [CrossRef]
- Montagnana, M.; Paleari, R.; Danese, E.; Salvagno, G.L.; Lippi, G.; Guidi, G.C.; Mosca, A. Evaluation of biological variation of glycated albumin (GA) and fructosamine in healthy subjects. Clin. Chim. Acta 2013, 423, 1–4. [Google Scholar] [CrossRef] [PubMed]
- Kohzuma, T.; Yamamoto, T.; Uematsu, Y.; Shihabi, Z.K.; Freedman, B.I. Basic Performance of an Enzymatic Method for Glycated Albumin and Reference Range Determination. J. Diabetes Sci. Technol. 2011, 5, 1455–1462. [Google Scholar] [CrossRef] [PubMed]
- Ying, L.; Ma, X.; Shen, Y.; Lu, J.; Lu, W.; Zhu, W.; Wang, Y.; Bao, Y.; Zhou, J. Serum 1,5-Anhydroglucitol to Glycated Albumin Ratio Can Help Early Distinguish Fulminant Type 1 Diabetes Mellitus from Newly Onset Type 1A Diabetes Mellitus. J. Diabetes Res. 2020, 2020, 1243630. [Google Scholar] [CrossRef] [PubMed]
- Sugawara, D.; Sato, H.; Makita, E.; Kuwata, T.; Takagi, K.; Ichihashi, K. Clinical usefulness of glycated albumin and glycated albumin-to-glycated hemoglobin ratio of gestational diabetes mellitus in late pregnancy for predicting infant complications. Pediatr. Neonatol. 2022, 63, 239–246. [Google Scholar] [CrossRef] [PubMed]
- Huh, J.H.; Kim, K.J.; Lee, B.-W.; Kim, D.W.; Kang, E.S.; Cha, B.S.; Lee, H.C. The Relationship between BMI and Glycated Albumin to Glycated Hemoglobin (GA/A1c) Ratio According to Glucose Tolerance Status. PLoS ONE 2014, 9, e89478. [Google Scholar] [CrossRef]
- Takeuchi, T.; Hirota, Y.; Nakagawa, Y.; Matsuoka, A.; Hamaguchi, T.; Okada, Y.; Sakaguchi, K.; Ogawa, W.; Koga, M. Glycated albumin (GA) and the GA/HbA1c ratio are higher in diabetic patients positive for insulin antibodies with high binding capacity and low affinity. Diabetol. Int. 2022, 13, 226–231. [Google Scholar] [CrossRef]
- Wang, N.; Xu, Z.; Han, P.; Li, T. Glycated albumin and ratio of glycated albumin to glycated hemoglobin are good indicators of diabetic nephropathy in type 2 diabetes mellitus. Diabetes/Metab. Res. Rev. 2017, 33, 1–7. [Google Scholar] [CrossRef]
- American Diabetes Association Professional Practice Committee; ElSayed, N.A.; Aleppo, G.; Bannuru, R.R.; Bruemmer, D.; Collins, B.S.; Ekhlaspour, L.; Gaglia, J.L.; Hilliard, M.E.; Johnson, E.L.; et al. 2. Diagnosis and Classification of Diabetes: Standards of Care in Diabetes-2024. Diabetes Care 2024, 47, S20–S42. [Google Scholar] [CrossRef]
- Bell, C.A. Clinical Guide to Laboratory Tests. 3rd edition. Norbert W. Tietz, ed. Transfusion 1995, 35, 972. [Google Scholar] [CrossRef]
- Hajian-Tilaki, K. Receiver Operating Characteristic (ROC) Curve Analysis for Medical Diagnostic Test Evaluation. Casp. J. Intern. Med. 2013, 4, 627–635. [Google Scholar]
- Koga, M.; Hashimoto, K.; Murai, J.; Saito, H.; Mukai, M.; Ikegame, K.; Ogawa, H.; Kasayama, S. Usefulness of glycated albumin as an indicator of glycemic control status in patients with hemolytic anemia. Clin. Chim. Acta 2011, 412, 253–257. [Google Scholar] [CrossRef] [PubMed]
- Tahara, Y.; Shima, K. Kinetics of HbA1c, glycated albumin, and fructosamine and analysis of their weight functions against preceding plasma glucose level. Diabetes Care 1995, 18, 440–447. [Google Scholar] [CrossRef] [PubMed]
- Freitas, P.A.C.; Ehlert, L.R.; Camargo, J.L. Glycated albumin: A potential biomarker in diabetes. Arch. Endocrinol. Metab. 2017, 61, 296–304. [Google Scholar] [CrossRef] [PubMed]
- Kouzuma, T.; Uemastu, Y.; Usami, T.; Imamura, S. Study of glycated amino acid elimination reaction for an improved enzymatic glycated albumin measurement method. Clin. Chim. Acta 2004, 346, 135–143. [Google Scholar] [CrossRef] [PubMed]
- Kouzuma, T.; Usami, T.; Yamakoshi, M.; Takahashi, M.; Imamura, S. An enzymatic method for the measurement of glycated albumin in biological samples. Clin. Chim. Acta 2002, 324, 61–71. [Google Scholar] [CrossRef]
- Timbrell, N.E. The Role and Limitations of the Reference Interval Within Clinical Chemistry and Its Reliability for Disease Detection. Br. J. Biomed. Sci. 2024, 81, 12339. [Google Scholar] [CrossRef]
- Matsha, T.E.; Korf, M.; Erasmus, R.T.; Hoffmann, M.; Mapfumo, C.; Smit, F.; Zemlin, A.E. Reference interval determination for glycated albumin in defined subgroups of a South African population. Ann. Clin. Biochem. 2019, 56, 480–487. [Google Scholar] [CrossRef]
- Chume, F.C.; Kieling, M.H.; Correa Freitas, P.A.; Cavagnolli, G.; Camargo, J.L. Glycated albumin as a diagnostic tool in diabetes: An alternative or an additional test? PLoS ONE 2019, 14, e0227065. [Google Scholar] [CrossRef]
- Tao, X.; Koguma, R.; Nagai, Y.; Kohzuma, T. Analytical performances of a glycated albumin assay that is traceable to standard reference materials and reference range determination. J. Clin. Lab. Anal. 2022, 36, e24509. [Google Scholar] [CrossRef]
- Selvin, E.; Warren, B.; He, X.; Sacks, D.B.; Saenger, A.K. Establishment of Community-Based Reference Intervals for Fructosamine, Glycated Albumin, and 1,5-Anhydroglucitol. Clin. Chem. 2018, 64, 843–850. [Google Scholar] [CrossRef]
- Bellia, C.; Zaninotto, M.; Cosma, C.; Agnello, L.; Lo Sasso, B.; Bivona, G.; Plebani, M.; Ciaccio, M. Definition of the upper reference limit of glycated albumin in blood donors from Italy. Clin. Chem. Lab. Med. CCLM/FESCC 2017, 56, 120–125. [Google Scholar] [CrossRef] [PubMed]
- Testa, R.; Ceriotti, F.; Guerra, E.; Bonfigli, A.R.; Boemi, M.; Cucchi, M.; Di Gaetano, N.; Santini, G.; Genovese, S.; Ceriello, A. Glycated albumin: Correlation to HbA1c and preliminary reference interval evaluation. Clin. Chem. Lab. Med. CCLM/FESCC 2017, 55, e31–e33. [Google Scholar] [CrossRef] [PubMed]
- Koga, M.; Shimizu, I.; Nakamura, Y.; Yamakado, M. Establishment of a reference interval for glycated albumin based on medical check-up data from multiple medical institutions. Scand. J. Clin. Lab. Investig. 2023, 83, 455–459. [Google Scholar] [CrossRef] [PubMed]
- Furusyo, N.; Koga, T.; Ai, M.; Otokozawa, S.; Kohzuma, T.; Ikezaki, H.; Schaefer, E.J.; Hayashi, J. Utility of glycated albumin for the diagnosis of diabetes mellitus in a Japanese population study: Results from the Kyushu and Okinawa Population Study (KOPS). Diabetologia 2011, 54, 3028–3036. [Google Scholar] [CrossRef]
- Araki, T.; Ishikawa, Y.; Okazaki, H.; Tani, Y.; Toyooka, S.; Satake, M.; Miwa, U.; Tadokoro, K. Introduction of glycated albumin measurement for all blood donors and the prevalence of a high glycated albumin level in Japan. J. Diabetes Investig. 2012, 3, 492–497. [Google Scholar] [CrossRef]
- Hiramatsu, Y.; Shimizu, I.; Omori, Y.; Nakabayashi, M. Determination of reference intervals of glycated albumin and hemoglobin A1c in healthy pregnant Japanese women and analysis of their time courses and influencing factors during pregnancy. Endocr. J. 2012, 59, 145–151. [Google Scholar] [CrossRef]
- Suzuki, S.; Koga, M.; Takahashi, H.; Matsuo, K.; Tanahashi, Y.; Azuma, H. Glycated albumin in patients with neonatal diabetes mellitus is apparently low in relation to glycemia compared with that in patients with type 1 diabetes mellitus. Horm. Res. Paediatr. 2012, 77, 273–276. [Google Scholar] [CrossRef]
- Ha, C.; Oh, J.; Park, H.-D. Evaluation of the Analytical Performance of the Norudia GA Glycoalbumin Test. Lab. Med. Online 2021, 11, 55–59. [Google Scholar] [CrossRef]
- Zhou, Q.; Shi, D.B.; Lv, L.Y. The establishment of biological reference intervals of nontraditional glycemic markers in a Chinese population. J. Clin. Lab. Anal. 2017, 31, e22097. [Google Scholar] [CrossRef]
- Agnello, L.; Lo Sasso, B.; Scazzone, C.; Giglio, R.V.; Gambino, C.M.; Bivona, G.; Pantuso, M.; Ciaccio, A.M.; Venezia, R.; Vidali, M.; et al. Preliminary reference intervals of Glycated Albumin in healthy Caucasian pregnant women. Clin. Chim. Acta 2021, 519, 227–230. [Google Scholar] [CrossRef]
- Paleari, R.; Vidali, M.; Ceriotti, F.; Pintaudi, B.; Luisa De Angelis, M.; Vitacolonna, E.; Cataldo, I.; Torlone, E.; Succurro, E.; Angotti, E.; et al. Reference intervals for glycated albumin during physiological pregnancy of Europid women: Evidences from a prospective observational study. Clin. Chim. Acta 2023, 541, 117246. [Google Scholar] [CrossRef] [PubMed]
- Pang, W.W.; Hinkle, S.N.; Wu, J.; Stallcup, P.; Tsai, M.Y.; Sacks, D.B.; Zhang, C. A Longitudinal Study of Plasma Glycated Albumin across Pregnancy and Associations with Maternal Characteristics and Cardiometabolic Biomarkers. Clin. Chem. 2023, 69, 1420–1428. [Google Scholar] [CrossRef] [PubMed]
- Dong, Y.; Zhai, Y.; Wang, J.; Chen, Y.; Xie, X.; Zhang, C.; Liu, J.; Lu, Y.; Tang, G.; Han, L.; et al. Glycated albumin in pregnancy: Reference intervals establishment and its predictive value in adverse pregnancy outcomes. BMC Pregnancy Childbirth 2020, 20, 12. [Google Scholar] [CrossRef] [PubMed]
- Sako, T.; Mori, A.; Lee, P.; Takahashi, T.; Izawa, T.; Karasawa, S.; Furuuchi, M.; Azakami, D.; Mizukoshi, M.; Mizutani, H.; et al. Diagnostic Significance of Serum Glycated Albumin in Diabetic Dogs. J. Vet. Diagn. Investig. 2008, 20, 634–638. [Google Scholar] [CrossRef]
- Sugawara, D.; Sato, H.; Ichihashi, K.; Nagai, K.; Kawano, A. Glycated albumin level during late pregnancy as a predictive factor for neonatal outcomes of women with diabetes. J. Matern.-Fetal Neonatal Med. 2018, 31, 2007–2012. [Google Scholar] [CrossRef]
- Shimizu, I.; Kohzuma, T.; Koga, M. A proposed glycemic control marker for the future: Glycated albumin. J. Lab. Precis. Med. 2019, 4, 23. [Google Scholar] [CrossRef]
- Chume, F.C.; Freitas, P.A.C.; Schiavenin, L.G.; Pimentel, A.L.; Camargo, J.L. Glycated albumin in diabetes mellitus: A meta-analysis of diagnostic test accuracy. Clin. Chem. Lab. Med. CCLM/FESCC 2022, 60, 961–974. [Google Scholar] [CrossRef]
- Chume, F.C.; Freitas, P.A.C.; Schiavenin, L.G.; Sgarioni, E.; Leitao, C.B.; Camargo, J.L. Glycated albumin in the detection of diabetes during COVID-19 hospitalization. PLoS ONE 2024, 19, e0297952. [Google Scholar] [CrossRef]
- Dozio, E.; Di Gaetano, N.; Findeisen, P.; Corsi Romanelli, M.M. Glycated albumin: From biochemistry and laboratory medicine to clinical practice. Endocrine 2017, 55, 682–690. [Google Scholar] [CrossRef]
- Sugawara, D.; Makita, E.; Matsuura, M.; Sato, H.; Kuwata, T.; Ichihashi, K. Prepregnancy body mass index and glycated albumin in the third trimester may predict infant complications in gestational diabetes mellitus: A retrospective cohort study. Diabetol. Int. 2023, 14, 280–287. [Google Scholar] [CrossRef]
- Song, S.O.; Yun, J.S.; Ko, S.H.; Ahn, Y.B.; Kim, B.Y.; Kim, C.H.; Jeon, J.Y.; Kim, D.J.; Seo, D.H.; Kim, S.H.; et al. Prevalence and clinical characteristics of fulminant type 1 diabetes mellitus in Korean adults: A multi-institutional joint research. J. Diabetes Investig. 2022, 13, 47–53. [Google Scholar] [CrossRef] [PubMed]
- Imagawa, A.; Hanafusa, T.; Uchigata, Y.; Kanatsuka, A.; Kawasaki, E.; Kobayashi, T.; Shimada, A.; Shimizu, I.; Toyoda, T.; Maruyama, T.; et al. Fulminant type 1 diabetes: A nationwide survey in Japan. Diabetes Care 2003, 26, 2345–2352. [Google Scholar] [CrossRef] [PubMed]
- Hwang, Y.-C.; Jung, C.H.; Ahn, H.-Y.; Jeon, W.S.; Jin, S.-M.; Woo, J.-t.; Cha, B.S.; Kim, J.H.; Park, C.-Y.; Lee, B.-W. Optimal glycated albumin cutoff value to diagnose diabetes in Korean adults: A retrospective study based on the oral glucose tolerance test. Clin. Chim. Acta 2014, 437, 1–5. [Google Scholar] [CrossRef] [PubMed]
- Akatsuka, J.; Mochizuki, M.; Musha, I.; Ohtake, A.; Kobayashi, K.; Kikuchi, T.; Kikuchi, N.; Kawamura, T.; Urakami, T.; Sugihara, S.; et al. The ratio of glycated albumin to hemoglobin A1c measured in IFCC units accurately represents the glycation gap. Endocr. J. 2015, 62, 161–172. [Google Scholar] [CrossRef]
- Kim, D.; Kim, K.J.; Huh, J.H.; Lee, B.W.; Kang, E.S.; Cha, B.S.; Lee, H.C. The ratio of glycated albumin to glycated haemoglobin correlates with insulin secretory function. Clin. Endocrinol. 2012, 77, 679–683. [Google Scholar] [CrossRef]
- Koga, M. Glycated albumin; clinical usefulness. Clin. Chim. Acta 2014, 433, 96–104. [Google Scholar] [CrossRef]
- Aihara, M.; Jinnouchi, H.; Yoshida, A.; Ijima, H.; Sakurai, Y.; Hayashi, T.; Koizumi, C.; Kubota, T.; Usami, S.; Yamauchi, T.; et al. Evaluation of glycated albumin levels in tears and saliva as a marker in patients with diabetes mellitus. Diabetes Res. Clin. Pract. 2023, 199, 110637. [Google Scholar] [CrossRef]


| Variables | Glycemia | HbA1c | 1,5-AG | GA |
|---|---|---|---|---|
| Location | Serum/plasma | Erythrocytes | Serum/plasma | Serum/plasma |
| Conventional units | mg/dL | % | µg/mL | % |
| SI units | mmol/L | mmol/mol | µmol/L | mmol/mol |
| Duration of blood glucose reflected | 8–10 h | 2–3 months | 1–2 weeks | 2–3 weeks |
| Fasting required | Yes | No | No | No |
| Analytical variability, % (CVA) between run imprecision | 2.8 | 1.2–1.5 | 2.1 | 1.6–2.8 |
| Biological variability, % (CVI/CVG) | 5.6/7.5 | 1.9/5.7 | – | 5.2/10.3 |
| Advantages | Simple, reproducible, and low-cost quantification | Reflects long-term glycemic control | Assesses short-term blood glucose and postprandial fluctuations | Reflects short- to medium-term blood glucose control |
| Criteria defined for diabetes and high-risk groups for diabetes development | Very stable, and little affected by diet or fasting | |||
| Gold standard for glycemic control | Associated with gestational diabetes and macrosomia | Not affected by the life span of erythrocytes, hemoglobinopathies, or autologous blood donation | ||
| Well established in the literature for identifying risks of complications | Reliable marker of glycemic control in T2D with chronic kidney disease stage 1 to 3 | More accurate assessment of recent glycemic control for treatment modifications in gestational and neonatal diabetes | ||
| Limitations | Requires fasting | Affected by red blood cell lifespan | Affected by diet, sex, race, and changes in renal threshold for glucose | Unreliable under conditions that alter the metabolism of serum proteins and albumin |
| Affected by short-term lifestyle changes (stress, drugs, others) | Affected by hemoglobinopathies, iron deficiency, hemodialysis | Does not identify hypoglycemia | Cannot be used in patients with nephropathy and nephrotic syndrome | |
| Effect of “glycolysis” on the sample | Does not capture glycemic fluctuations in short periods | Limited in patients with chronic kidney disease stage 4 to 5, end-stage renal disease, and in those treated with SGLT–2i or acarbose | Affected by body fat content and thyroid hormones | |
| Inadequate to identify postprandial hyperglycemia | Higher cost in quantification |
| Variable | Children | Adults | Pregnant Women ** | p |
|---|---|---|---|---|
| n | 299 | 290 | 406 | |
| Age, y | 10 (10–11) | 43.5 (41–46) | 26 (24–27) | <0.001 |
| Sex, M/F | 150/149 | 146/144 | – | 0.956 * |
| BMI, kg/m2 | 19.4 ± 4.1 | 27.3 ± 4.2 | 27.7 ± 5.0 | <0.001 |
| * Glycemia, mg/dL | 90.0 (83–97) | 91 (81–105) | 69.0 (59–77) | <0.001 |
| HbA1c, % | 5.2 (5.1–5.4) | 5.4 (5.1–5.6) | 4.5 (4.4–4.7) | <0.001 |
| 1,5–AG, µg/mL | 31.7 ± 8.6 | 28.9 ± 18.8 | 21.4 ± 7.7 | <0.001 |
| Urea, mg/dL | 23.5 ± 6.0 | 26.0 ± 7.7 | 17.4 ± 4.6 | <0.001 |
| Creatinine, mg/dL | 0.56 (0.46–0.64) | 0.64 (0.52–0.76) | 0.66 (0.60–0.72) | 0.956 |
| Hemoglobin, g/dL | 13.4 ± 6.1 | 14.9 ± 6.7 | 12.3 ± 5.9 | <0.001 |
| Total protein, g/L | 79 ± 8 | 69 ± 5 | 83 ± 7 | <0.001 |
| Albumin, gL | 44 ± 3 | 39 ± 2 | 34 ± 3 | <0.001 |
| AST, U/L | 24 (20–27) | 16 (11–21) | 15 (12–19) | <0.001 |
| ALT, U/L | 14 (10–17) | 21 (17–26) | 8 (6–12) | <0.001 |
| Age | M/F | n | RI | 90% Lower | 90% Upper | Mean | Median |
|---|---|---|---|---|---|---|---|
| Children | |||||||
| 6–14 y | 150/149 | 299 | 10.1–13.6 | 9.9–10.2 | 13.4–14.0 | 11.8 | 11.8 |
| Adults | |||||||
| 21–62 y | 146/144 | 290 | 9.9–13.9 | 9.8–10.1 | 13.8–14.2 | 11.9 | 11.9 |
| Non-pregnant individuals | |||||||
| 6–62 y | 296/293 | 589 | 10.0–13.8 | 9.5–10.1 | 13.7–13.9 | 11.9 | 11.9 |
| Pregnant women ** | |||||||
| 14–44 y | – | 406 | 10.6–14.7 | 10.4–10.7 | 14.5–14.8 | 12.6 | 16.6 |
| Age | M/F | N | RI | 90% Lower | 90% Upper | Mean | Median |
|---|---|---|---|---|---|---|---|
| Children | |||||||
| 6–14 y | 150/149 | 299 | 1.2–4.3 | 0.9–1.4 | 4.2–4.8 | 2.45 | 2.59 |
| Adults | |||||||
| 21–62 y | 146/144 | 290 | 0.9–3.6 | 0.6–1.2 | 3.3–4.0 | 1.91 | 2.12 |
| Non-pregnant individuals | |||||||
| 6–62 y | 296/293 | 589 | 1.1–4.0 | 0.8–1.2 | 3.8–4.2 | 2.15 | 2.35 |
| Pregnant women ** | |||||||
| 14–44 y | – | 406 | 10.6–14.7 | 10.4–10.7 | 14.5–14.8 | 12.6 | 16.6 |
| Age | M/F | N | RI | 90% Lower | 90% Upper | Mean | Median |
|---|---|---|---|---|---|---|---|
| Children | |||||||
| 6–14 y | 150/149 | 299 | 1.8–2.6 | 1.8–1.9 | 2.2–2.7 | 2.27 | 2.26 |
| Adults | |||||||
| 21–62 y | 146/144 | 290 | 1.8–2.7 | 1.7–1.9 | 2.6–2.7 | 2.25 | 2.24 |
| Non-pregnant individuals | |||||||
| 6–62 y | 296/293 | 589 | 1.8–2.6 | 1.8–1.9 | 2.6–2.7 | 2.26 | 2.25 |
| Pregnant women ** | |||||||
| 14–44 y | – | 406 | 2.3–3.6 | 2.2–2.3 | 3.3–4.1 | 2.81 | 2.77 |
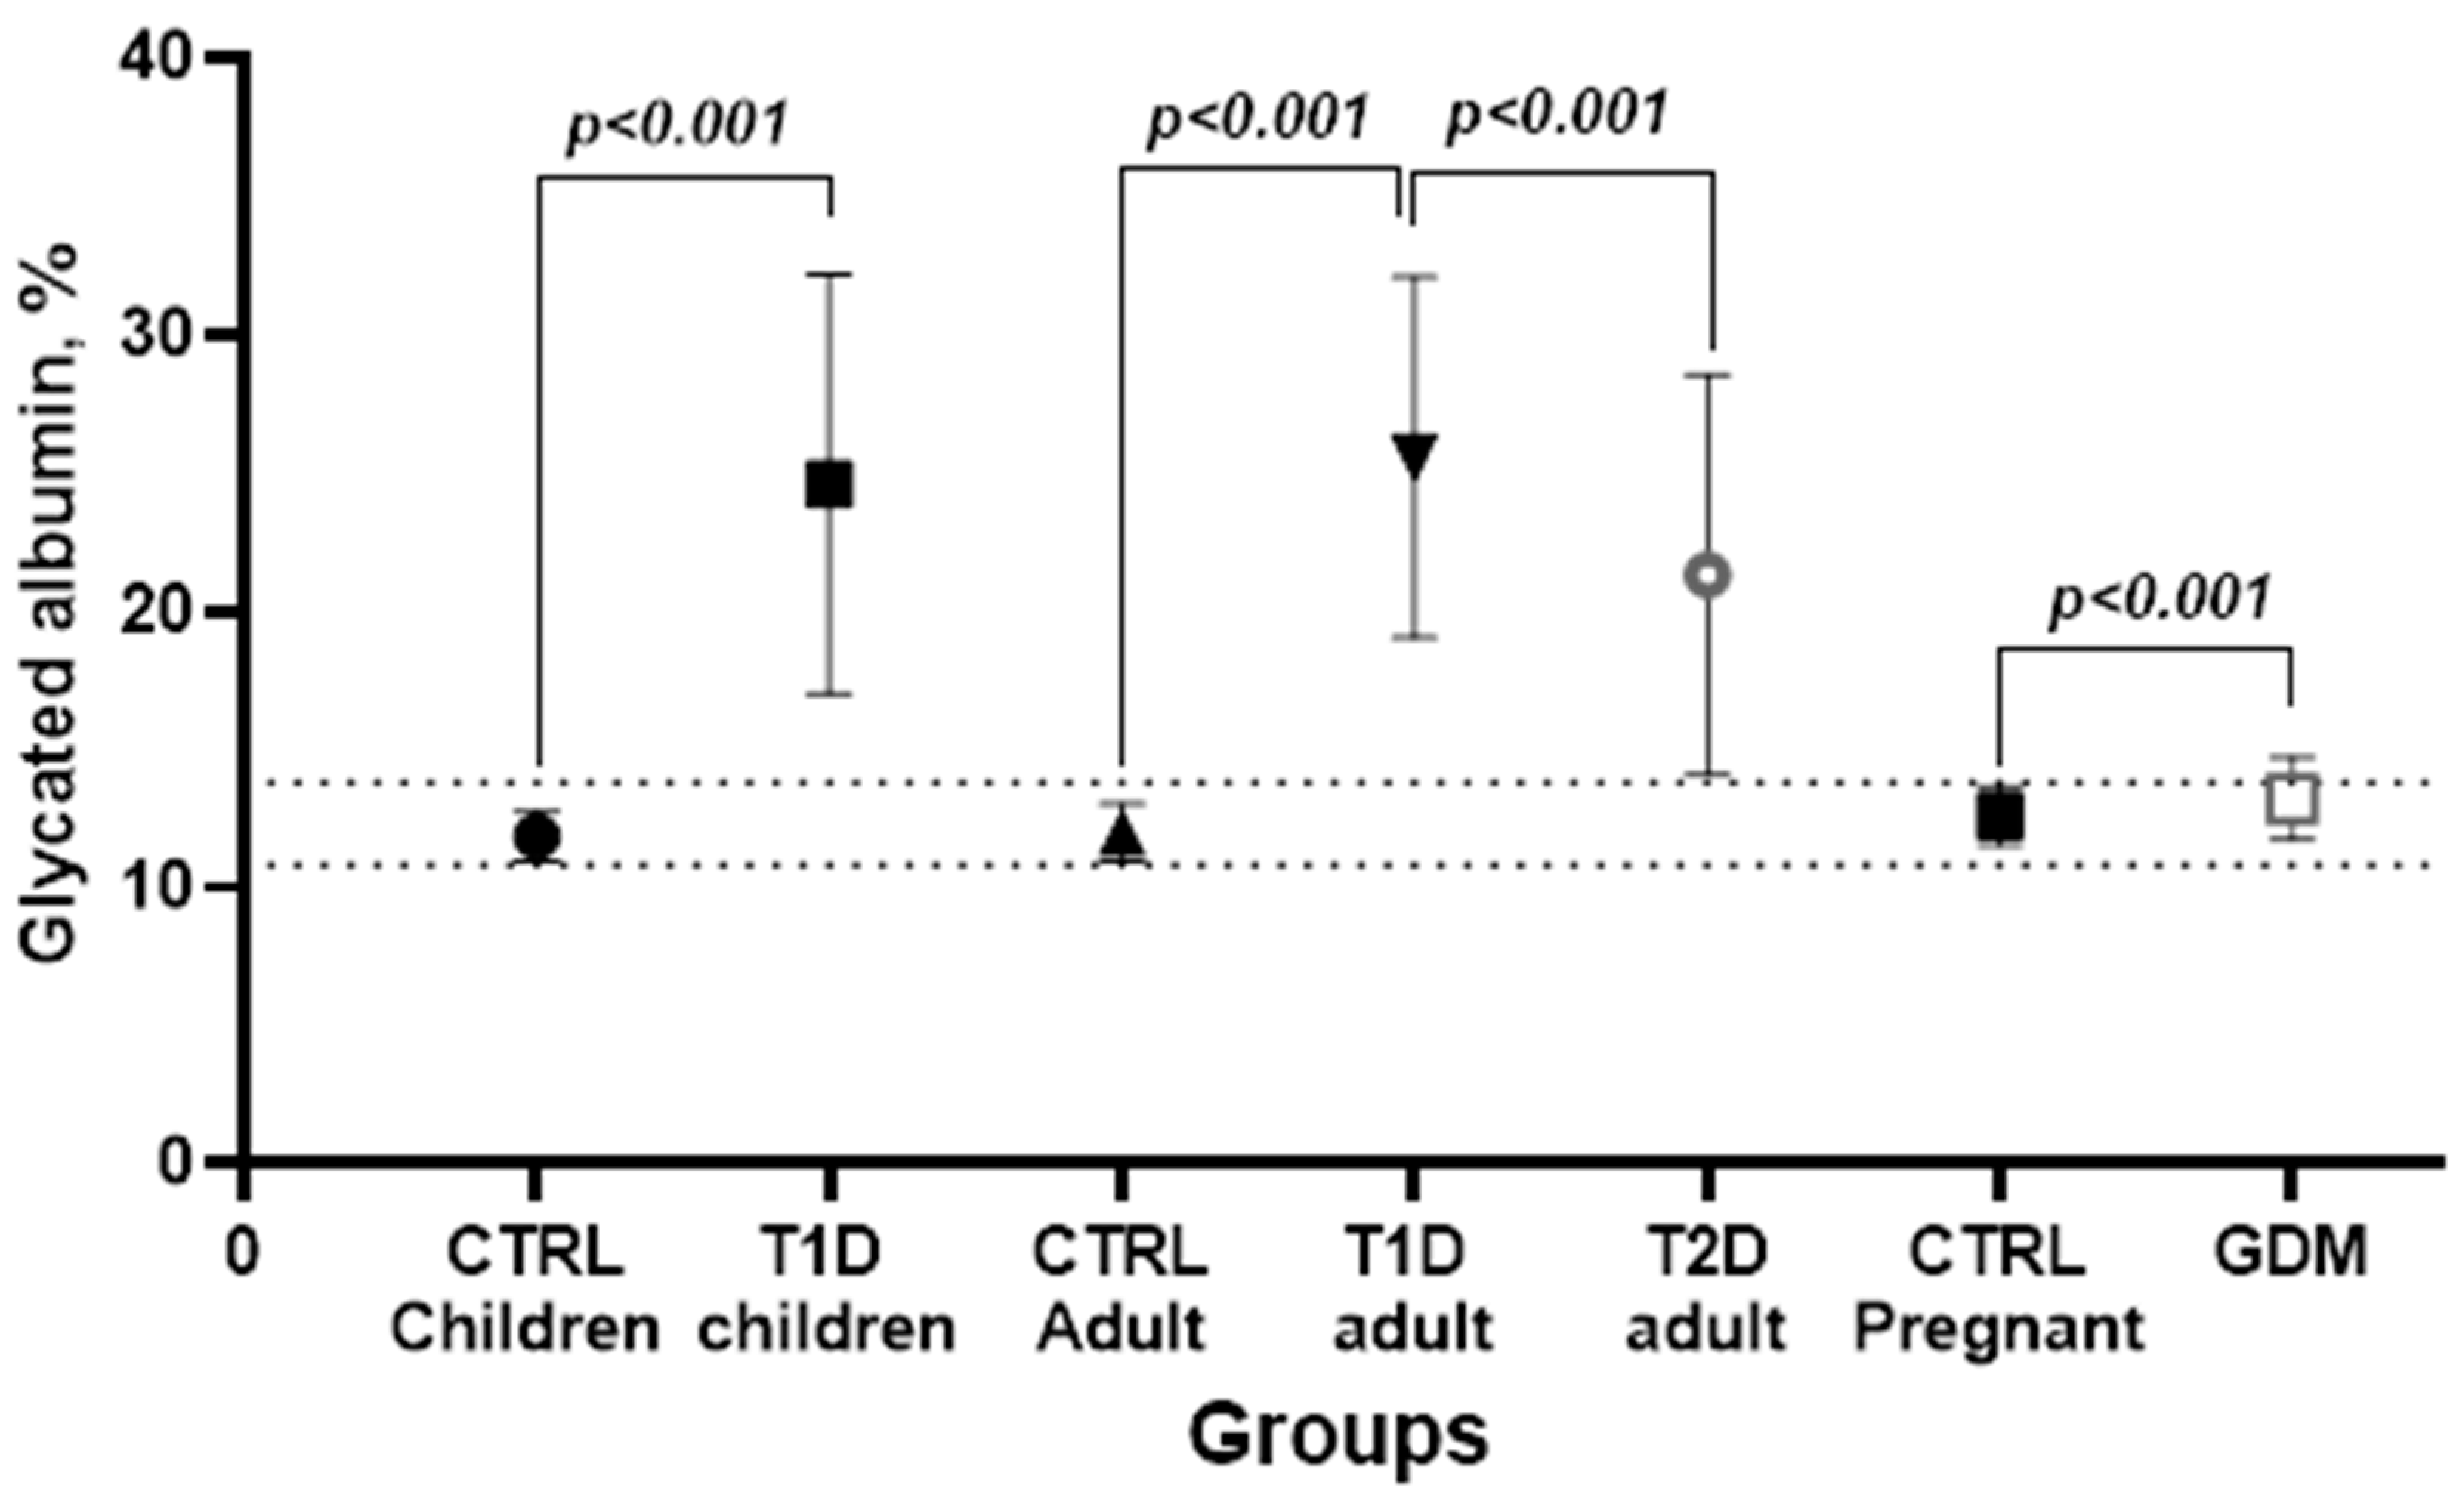
| Variable | T1D Children | T1D Adults | T2D | GDM |
|---|---|---|---|---|
| n | 148 | 81 | 283 | 177 |
| Age, y | 11 (9–13) | 44.5 (37–53) | 60 (52–66) | 31 (26–35) |
| Sex, M/F | 72/76 | 34/47 | 79/204 | – |
| BMI, kg/m2 | 18.8 ± 3.0 | 25.9 ± 4.7 | 29.8 ± 5.6 | 31.1 ± 5.2 |
| Duration of diabetes, y | 4.1 ± 3.1 | 15.2 ± 10.7 | 9.0 ± 6.1 | – |
| Fasting glycemia, mg/dL | 261 (171–349) | 207.5 (137–271) | 144.5 (107–190) | 87 (79–95) |
| HbA1c, % | 9.7 (8.7–11.0) | 8.8 (7.7–9.9) | 8.1 (6.7–9.4) | 5.0 (4.8–5.3) |
| Variable | T1D Children | T1D Adults | T2D | GDM |
|---|---|---|---|---|
| n, Disease/control | 148/299 | 81/290 | 283/290 | 177/406 |
| AUC, 95% CI | 0.999 (0.99–1.00) | 0.964 (0.94–0.98) | 0.954 | 0.625 (0.58–0.66) |
| p | <0.0001 | <0.0001 | <0.0001 | <0.0001 |
| Youden index J | 0.9899 | 0.9280 | 0.824 | 0.2436 |
| Associated criterion, % | >14.3 | >14.8 | >14.2 | >13.1 |
| Sensitivity, % | 99.3 | 93.8 | 84.8 | 53.7 |
| Specificity, % | 99.7 | 99.9 | 97.6 | 70.7 |
| Variable | T1D Children | T1D Adults | T2D | GDM |
|---|---|---|---|---|
| n, Disease/control | 148/299 | 81/290 | 283/290 | 177/406 |
| AUC, 95% CI | 1.000 (0.99–1.00) | 0.993 (0.97–0.99) | 0.993 (0.97–0.99) | 0.705 (0.66–0.74) |
| p | <0.0001 | <0.0001 | <0.0001 | <0.0001 |
| Youden index J | 0.993 | 0.993 | 0.939 | 0.351 |
| Associated criterion, % | ≤0.797 | ≤0.901 | ≤1.08 | ≤1.39 |
| Sensitivity, % | 99.3 | 97.4 | 96.3 | 63.1 |
| Specificity, % | 100.0 | 97.6 | 97.6 | 72.0 |
| Variable | T1D Children | T1D Adults | T2D | GDM |
|---|---|---|---|---|
| n, Disease/control | 148/299 | 81/290 | 283/290 | 177/406 |
| AUC, 95% CI | 0.939 (0.91–0.96) | 0.867 (0.83–0.90) | 0.733 (0.69–0.77) | 0.677 (0.64–0.71) |
| p | <0.0001 | <0.0001 | <0.0001 | <0.0001 |
| Youden index J | 0.768 | 0.687 | 0.432 | 0.340 |
| Associated criterion, % | >2.50 | >2.56 | >2.42 | ≤2.66 |
| Sensitivity, % | 87.2 | 76.2 | 61.2 | 62.2 |
| Specificity, % | 89.6 | 92.4 | 81.1 | 68.2 |
| Populations | Methods | n | Reference Interval, % | ΔRI | Reference |
|---|---|---|---|---|---|
| Euro-Brazilians Children and adults | Lucica GA-L | 589 | 10.0–13.8 | 3.8 | This study |
| 1 Brazilians | GlycoGap | 165 | 10.8–18.0 | 7.2 | Chume et al. [49] |
| US Americans | Lucica GA-L | 262 | 9.9–14.2 | 4.3 | Tao et al. [50] |
| Hispanic or Latino individuals | 24 | 10.1–14.2 | 4.1 | ||
| Non–Hispanic or non–Latino individuals | 238 | 9.9–14.3 | 4.4 | ||
| Black US Americans | 43 | 10.6–14.8 | 4.2 | ||
| Asians | 41 | 10.6–14.8 | 4.2 | ||
| Caucasians | 172 | 9.9–14.2 | 4.3 | ||
| US Americans | Lucica GA-L | Selvin et al. [51] | |||
| Total | 1799 | 10.7–15.1 | 4.4 | ||
| Black individuals | 261 | 10.9–15.5 | 4.6 | ||
| Caucasians | 1538 | 10.7–14.9 | 4.2 | ||
| South Africans | QuantILab | 663 | 10.7–15.2 | 4.5 | Matsha et al. [48] |
| Italians | QuantILab | 1334 | Upper 12.0 Male | – | Bellia et al. [52] |
| Upper 12.2 Female | |||||
| Italians | Lucica GA-L | 32 | 11.7–16.9 | 5.2 | Paroni et al. [29] |
| Europeans | QuantILab | 252 | 9.0–16 | 7.0 | Testa et al. [53] |
| Japanese | Norudia GA | 1843 | 12.1–17.1 | 5.0 | Koga et al. [54] |
| Japanese | Lucica GA-L | 1575 | 12.2–16.5 | 4.3 | Furusyo et al. [55] |
| 2 Japanese blood donors | Lucica GA-L | 3,142,794 | 10.4–17.2 | 6.8 | Araki et al. [56] |
| Non-pregnant women | Lucica GA-L | 32 | 12.0–16.2 | 4.2 | Hiramatsu et al. [57] |
| 3 Japanese neonates | Lucica GA-L | 18 | 7.4–13.0 | 5.6 | Suzuki et al. [58] |
| South Koreans | Norundia GA | 120 | 11.2–17.5 | 6.3 | Ha et al. [59] |
| Chinese | Lucica GA-L | 458 | 20–59 y 10.4–13.9 | 3.5 | Zhou et al. [60] |
| 60–79 y 10.2–14.8 | 4.6 | ||||
| Total (min-max) | Enzymatic | – | 9.0–18.0 | 3.8–7.2 | – |
| Pregnant women | |||||
| Euro-Brazilians Pregnant women (16–37 weeks) | Lucica GA–L | 406 | 10.6–14.7 | 4.1 | This study |
| Caucasians | QuantLab | 183 | (1st T) 10.1–15.7 | 5.6 | Agnello et al. [61] |
| (2nd T) 10.5–15.5 | 5.0 | ||||
| (3rd T) 9.8–14.6 | 4.8 | ||||
| Caucasians | Lucica GA-L | 45 | (6–10 w) 11.1–14.8 | 3.7 | Paleari et al. [62] |
| (16–18 w) 10.9–15.6 | 4.7 | ||||
| (24–28 w) 10.6–14.1 | 3.5 | ||||
| (>28 w) 10.7–14.3 | 3.6 | ||||
| US Americans | Lucica GA-L | 214 | (10–14 w) 7.8–18.5 | 10.7 | Pang et al. [63] |
| (15–26 w) 8.5–38.4 | 29.9 | ||||
| (23–31 w) 8.7–19.8 | 11.1 | ||||
| (33–39 w) 7.7–18.0 | 10.3 | ||||
| Japanese | Lucica GA-L | 574 | (1st T) 12.2–16.6 | 4.4 | Hiramatsu et al. [57] |
| (2nd T) 11.8–16.6 | 4.8 | ||||
| (3rd T) 11.3–15.3 | 4.0 | ||||
| Chinese | GA Beijing | 421 | (1st T) 11.3–15.1 | 3.8 | Dong et al. [64] |
| (2nd T) 10.1–13.5 | 3.4 | ||||
| (3rd T) 9.8–13.1 | 3.3 | ||||
| * Total (min-max) | Enzymatic | – | 9.8–16.6 | 3.5–5.6 | – |
Disclaimer/Publisher’s Note: The statements, opinions and data contained in all publications are solely those of the individual author(s) and contributor(s) and not of MDPI and/or the editor(s). MDPI and/or the editor(s) disclaim responsibility for any injury to people or property resulting from any ideas, methods, instructions or products referred to in the content. |
© 2024 by the authors. Licensee MDPI, Basel, Switzerland. This article is an open access article distributed under the terms and conditions of the Creative Commons Attribution (CC BY) license (https://creativecommons.org/licenses/by/4.0/).
Share and Cite
Al-Lahham, Y.; Volanski, W.; Signorini, L.; Prado, A.L.d.; Valdameri, G.; Moure, V.R.; Welter, M.; Alves, A.C.; Sari, M.H.M.; Rego, F.G.d.M.; et al. Reference Interval for Glycated Albumin, 1,5-AG/GA, and GA/HbA1c Ratios and Cut-Off Values for Type 1, Type 2, and Gestational Diabetes: A Cross-Sectional Study. Biomedicines 2024, 12, 2651. https://doi.org/10.3390/biomedicines12122651
Al-Lahham Y, Volanski W, Signorini L, Prado ALd, Valdameri G, Moure VR, Welter M, Alves AC, Sari MHM, Rego FGdM, et al. Reference Interval for Glycated Albumin, 1,5-AG/GA, and GA/HbA1c Ratios and Cut-Off Values for Type 1, Type 2, and Gestational Diabetes: A Cross-Sectional Study. Biomedicines. 2024; 12(12):2651. https://doi.org/10.3390/biomedicines12122651
Chicago/Turabian StyleAl-Lahham, Yusra, Waldemar Volanski, Liana Signorini, Ademir Luiz do Prado, Glaucio Valdameri, Vivian Rotuno Moure, Marciane Welter, Alexessander C. Alves, Marcel Henrique Marcondes Sari, Fabiane Gomes de Moraes Rego, and et al. 2024. "Reference Interval for Glycated Albumin, 1,5-AG/GA, and GA/HbA1c Ratios and Cut-Off Values for Type 1, Type 2, and Gestational Diabetes: A Cross-Sectional Study" Biomedicines 12, no. 12: 2651. https://doi.org/10.3390/biomedicines12122651
APA StyleAl-Lahham, Y., Volanski, W., Signorini, L., Prado, A. L. d., Valdameri, G., Moure, V. R., Welter, M., Alves, A. C., Sari, M. H. M., Rego, F. G. d. M., & Picheth, G. (2024). Reference Interval for Glycated Albumin, 1,5-AG/GA, and GA/HbA1c Ratios and Cut-Off Values for Type 1, Type 2, and Gestational Diabetes: A Cross-Sectional Study. Biomedicines, 12(12), 2651. https://doi.org/10.3390/biomedicines12122651