
Cell-Free Genic Extrachromosomal Circular DNA Profiles of DNase Knockouts Associated with Systemic Lupus Erythematosus and Relation with Common Fragile Sites

 ,
,
Abstract
:
1. Introduction
2. Methods
2.1. Samples and Data
2.2. Mapping of eccDNA and Quantification of Produced per Gene Circles/eccDNAs (PpGCs)
2.3. Identification of Differentially Produced per Gene eccDNAs (DPpGCs)
2.4. Calculation of the Chromosome Enrichment of DPpGCs
2.5. Finding Common Genes between up-DPpGCs in Plasma from Dnase1l3−/− Mice and SLE Patients with DNASE1L3 Deficiency
2.6. Finding Common DPpGCs with Chromosomal Fragile Site (CFS) Genes
2.7. Finding Common DPpGCs with GWAS for ‘Systemic Lupus Erythematosus’
3. Results
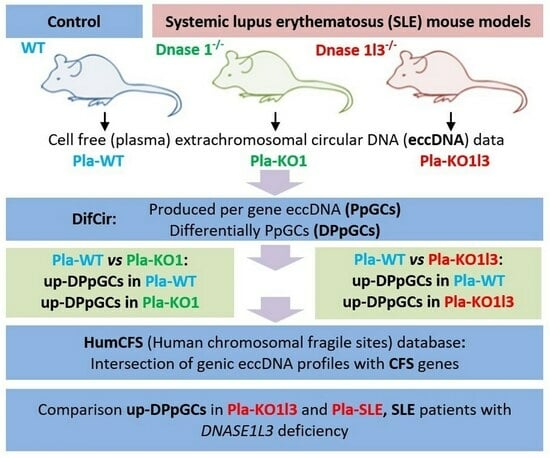
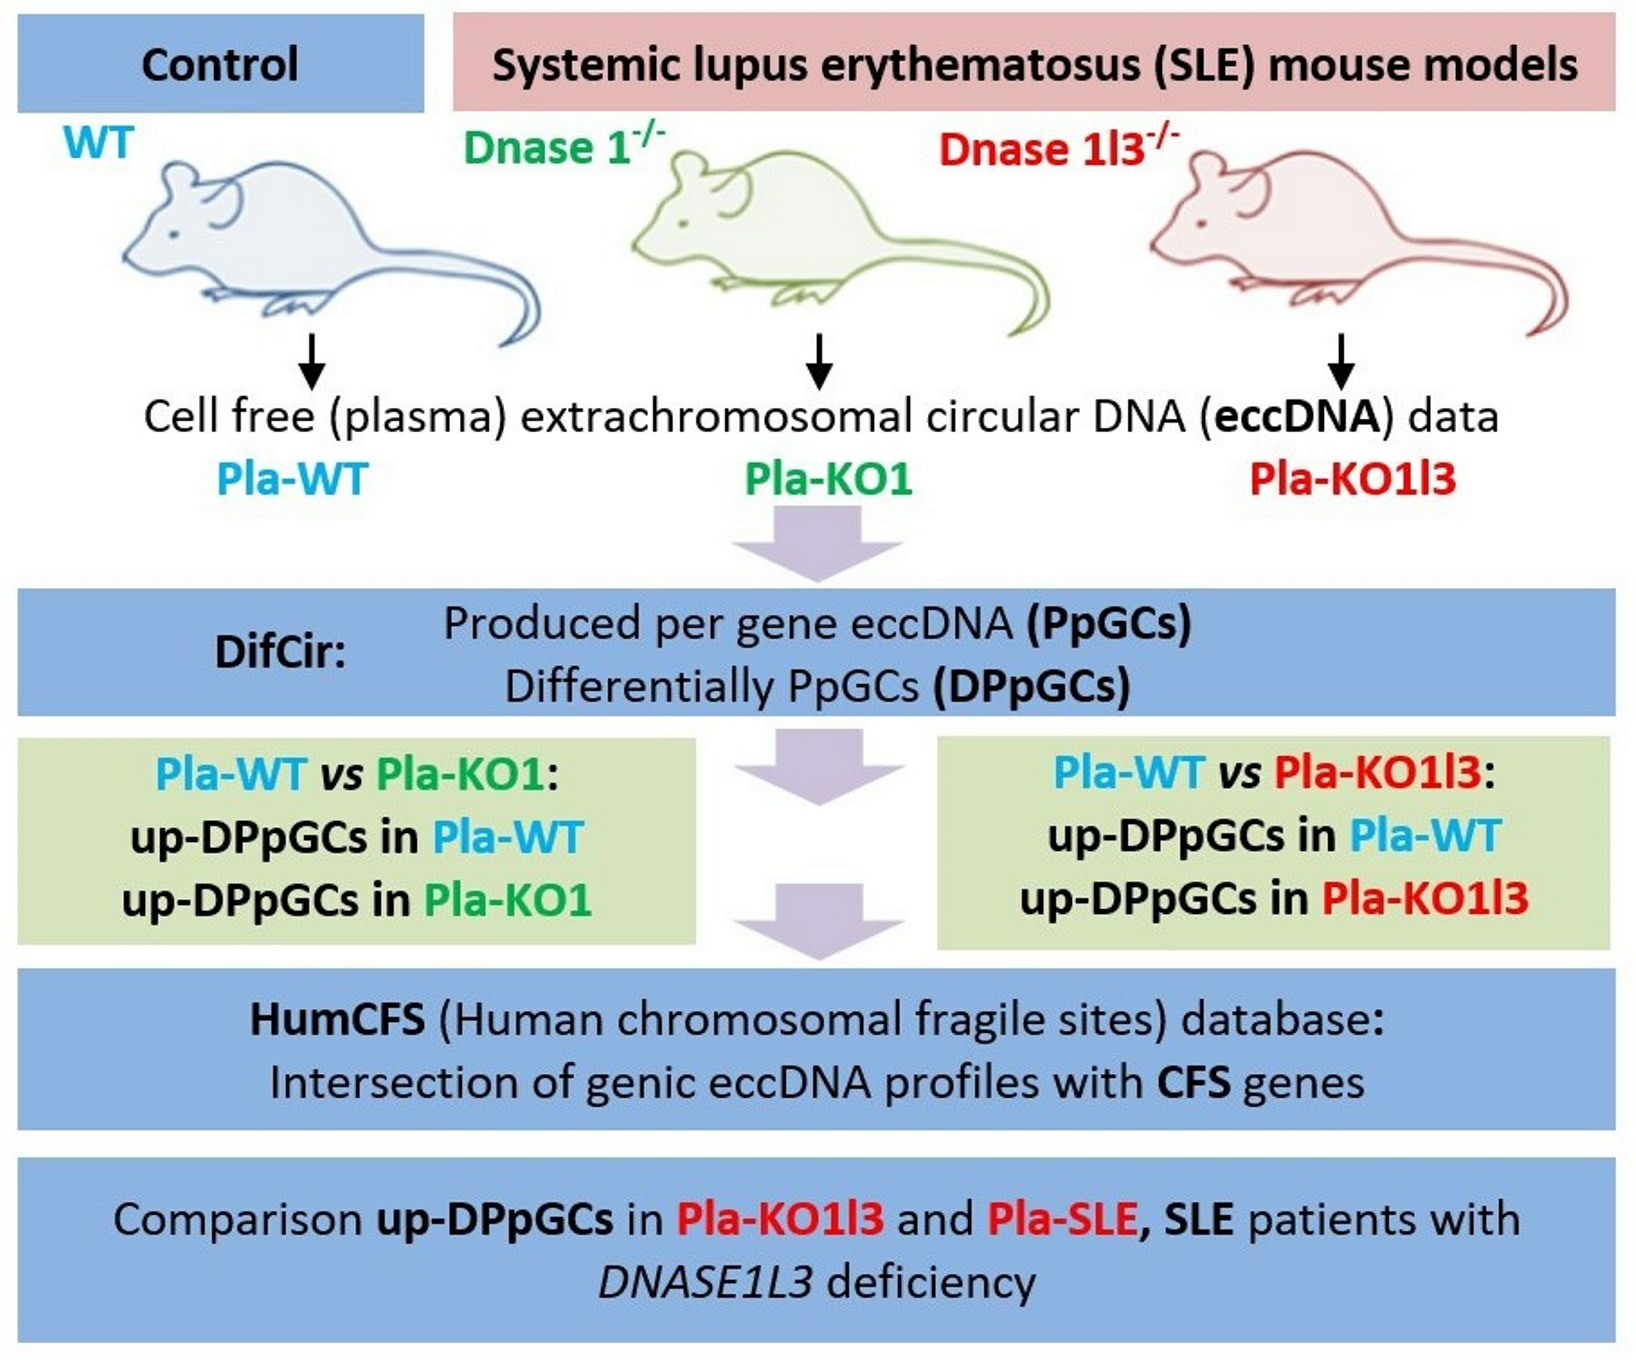
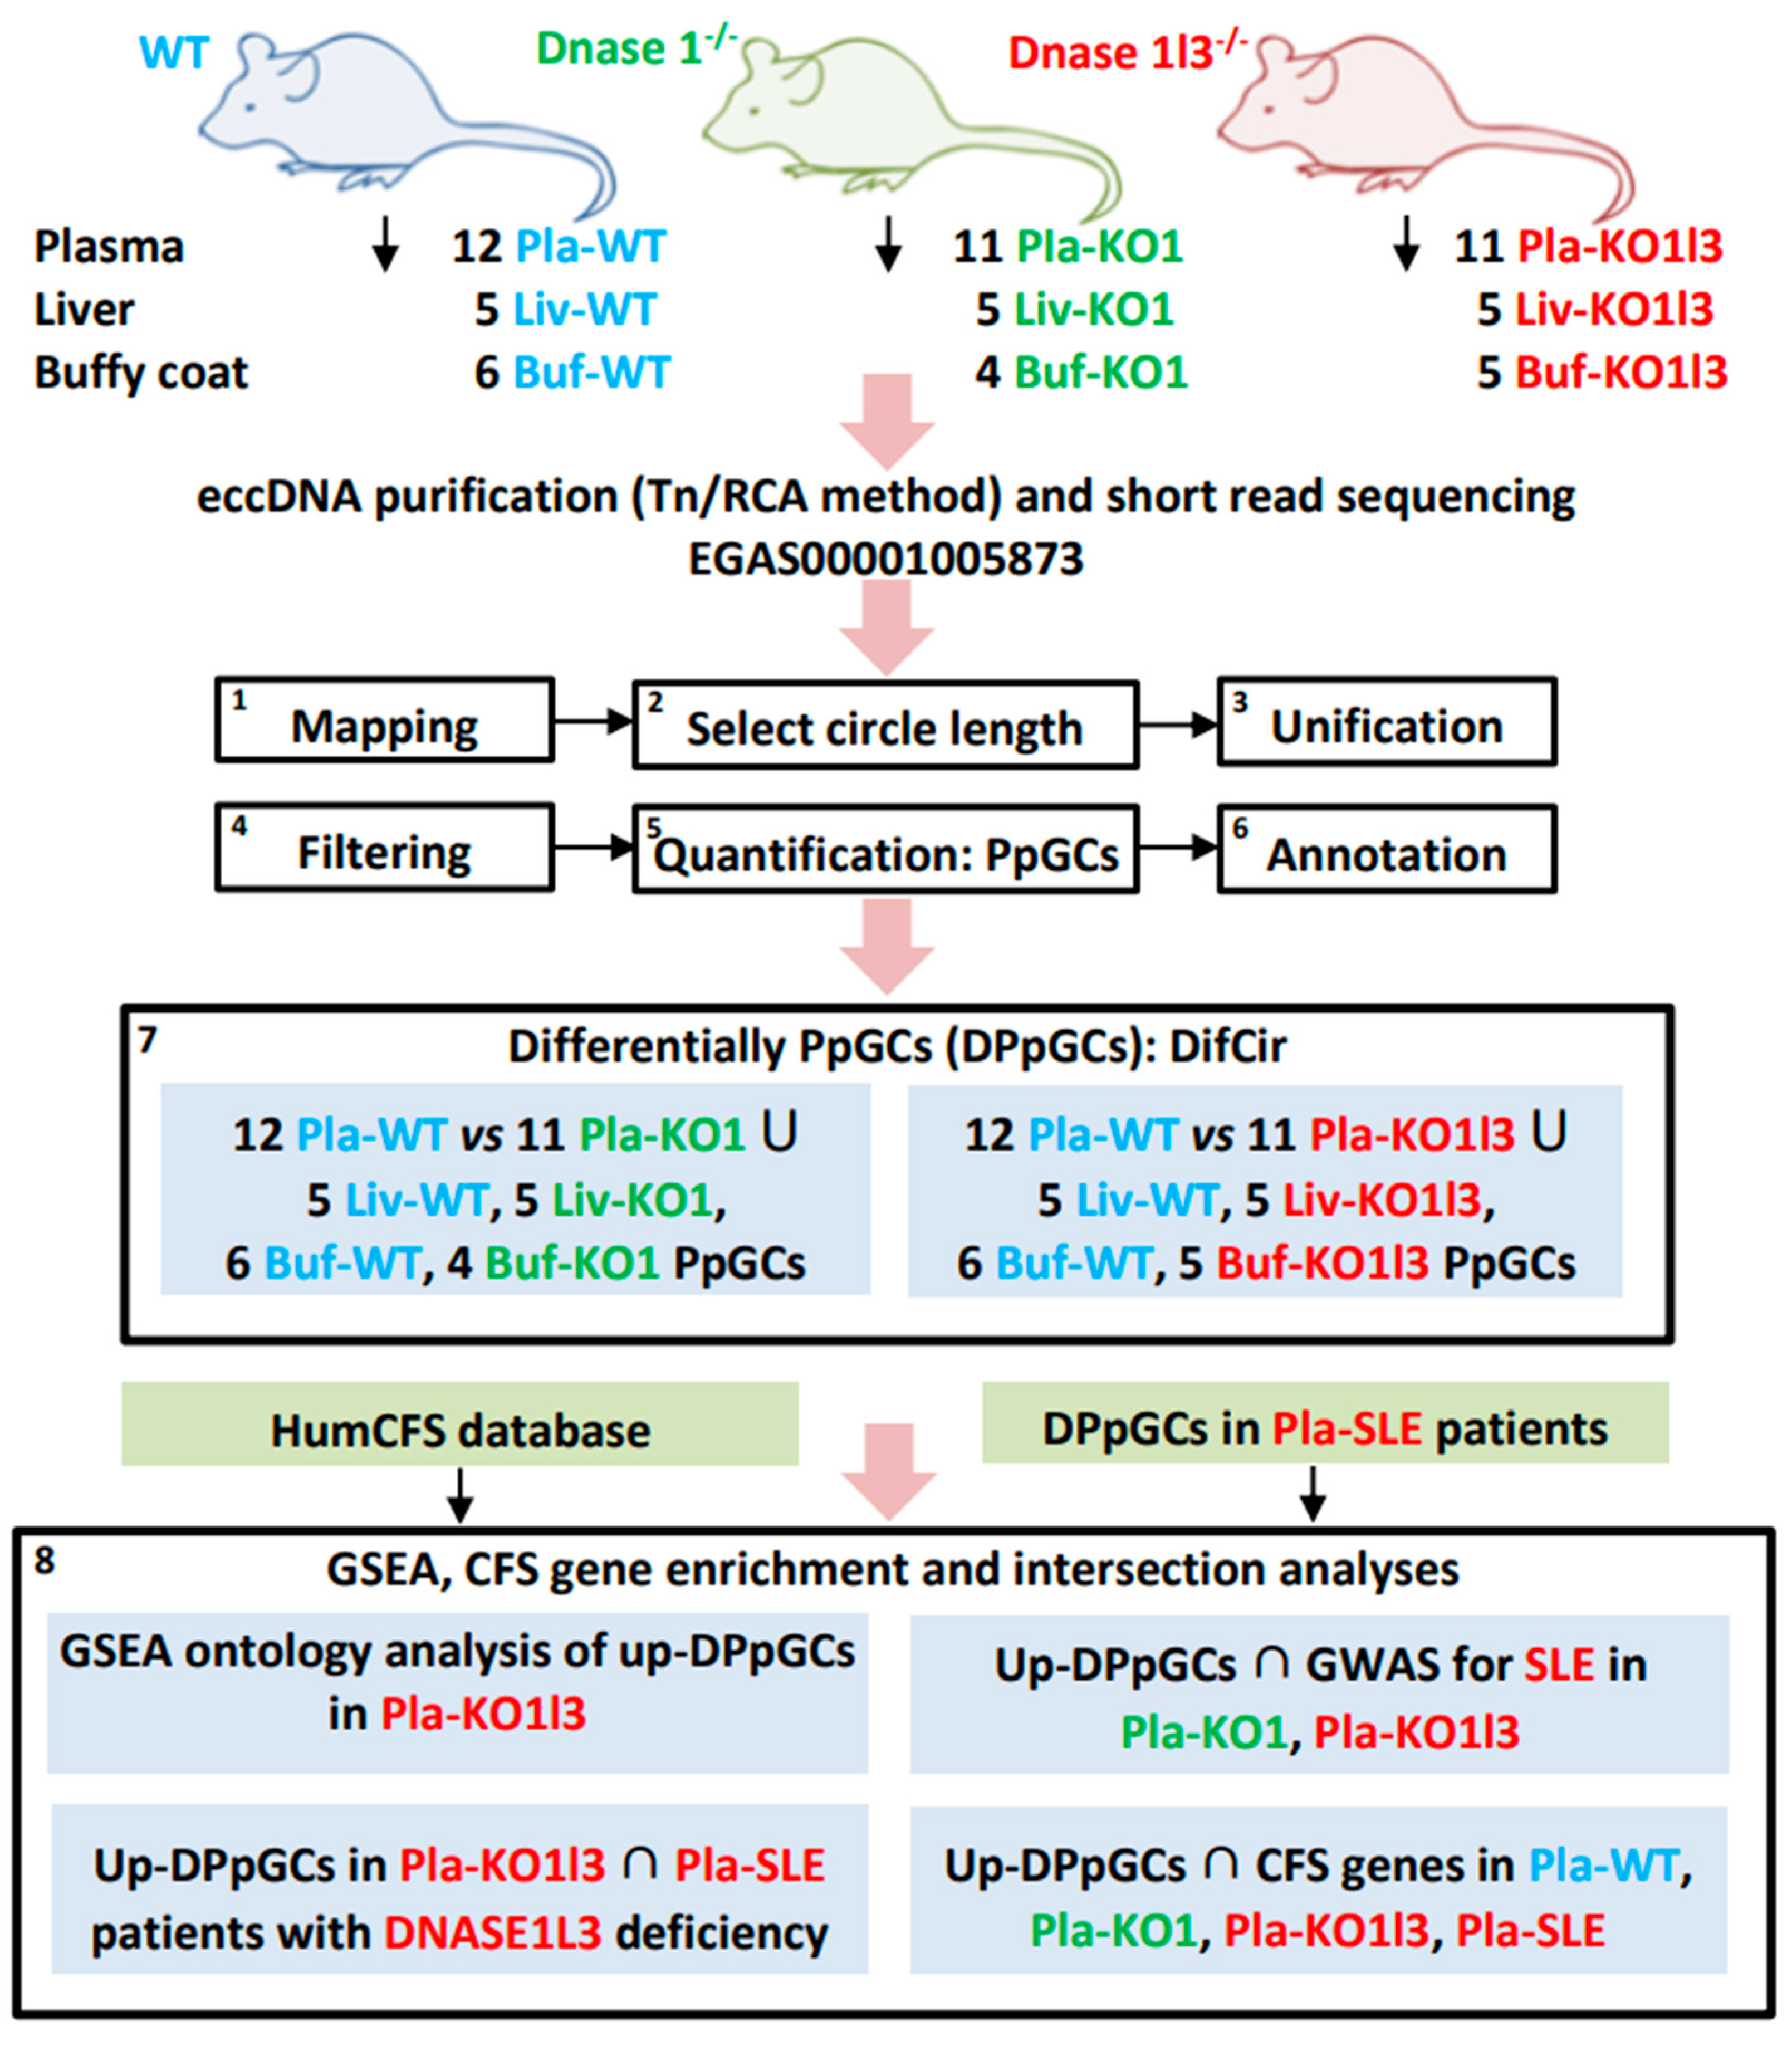
3.1. Workflow
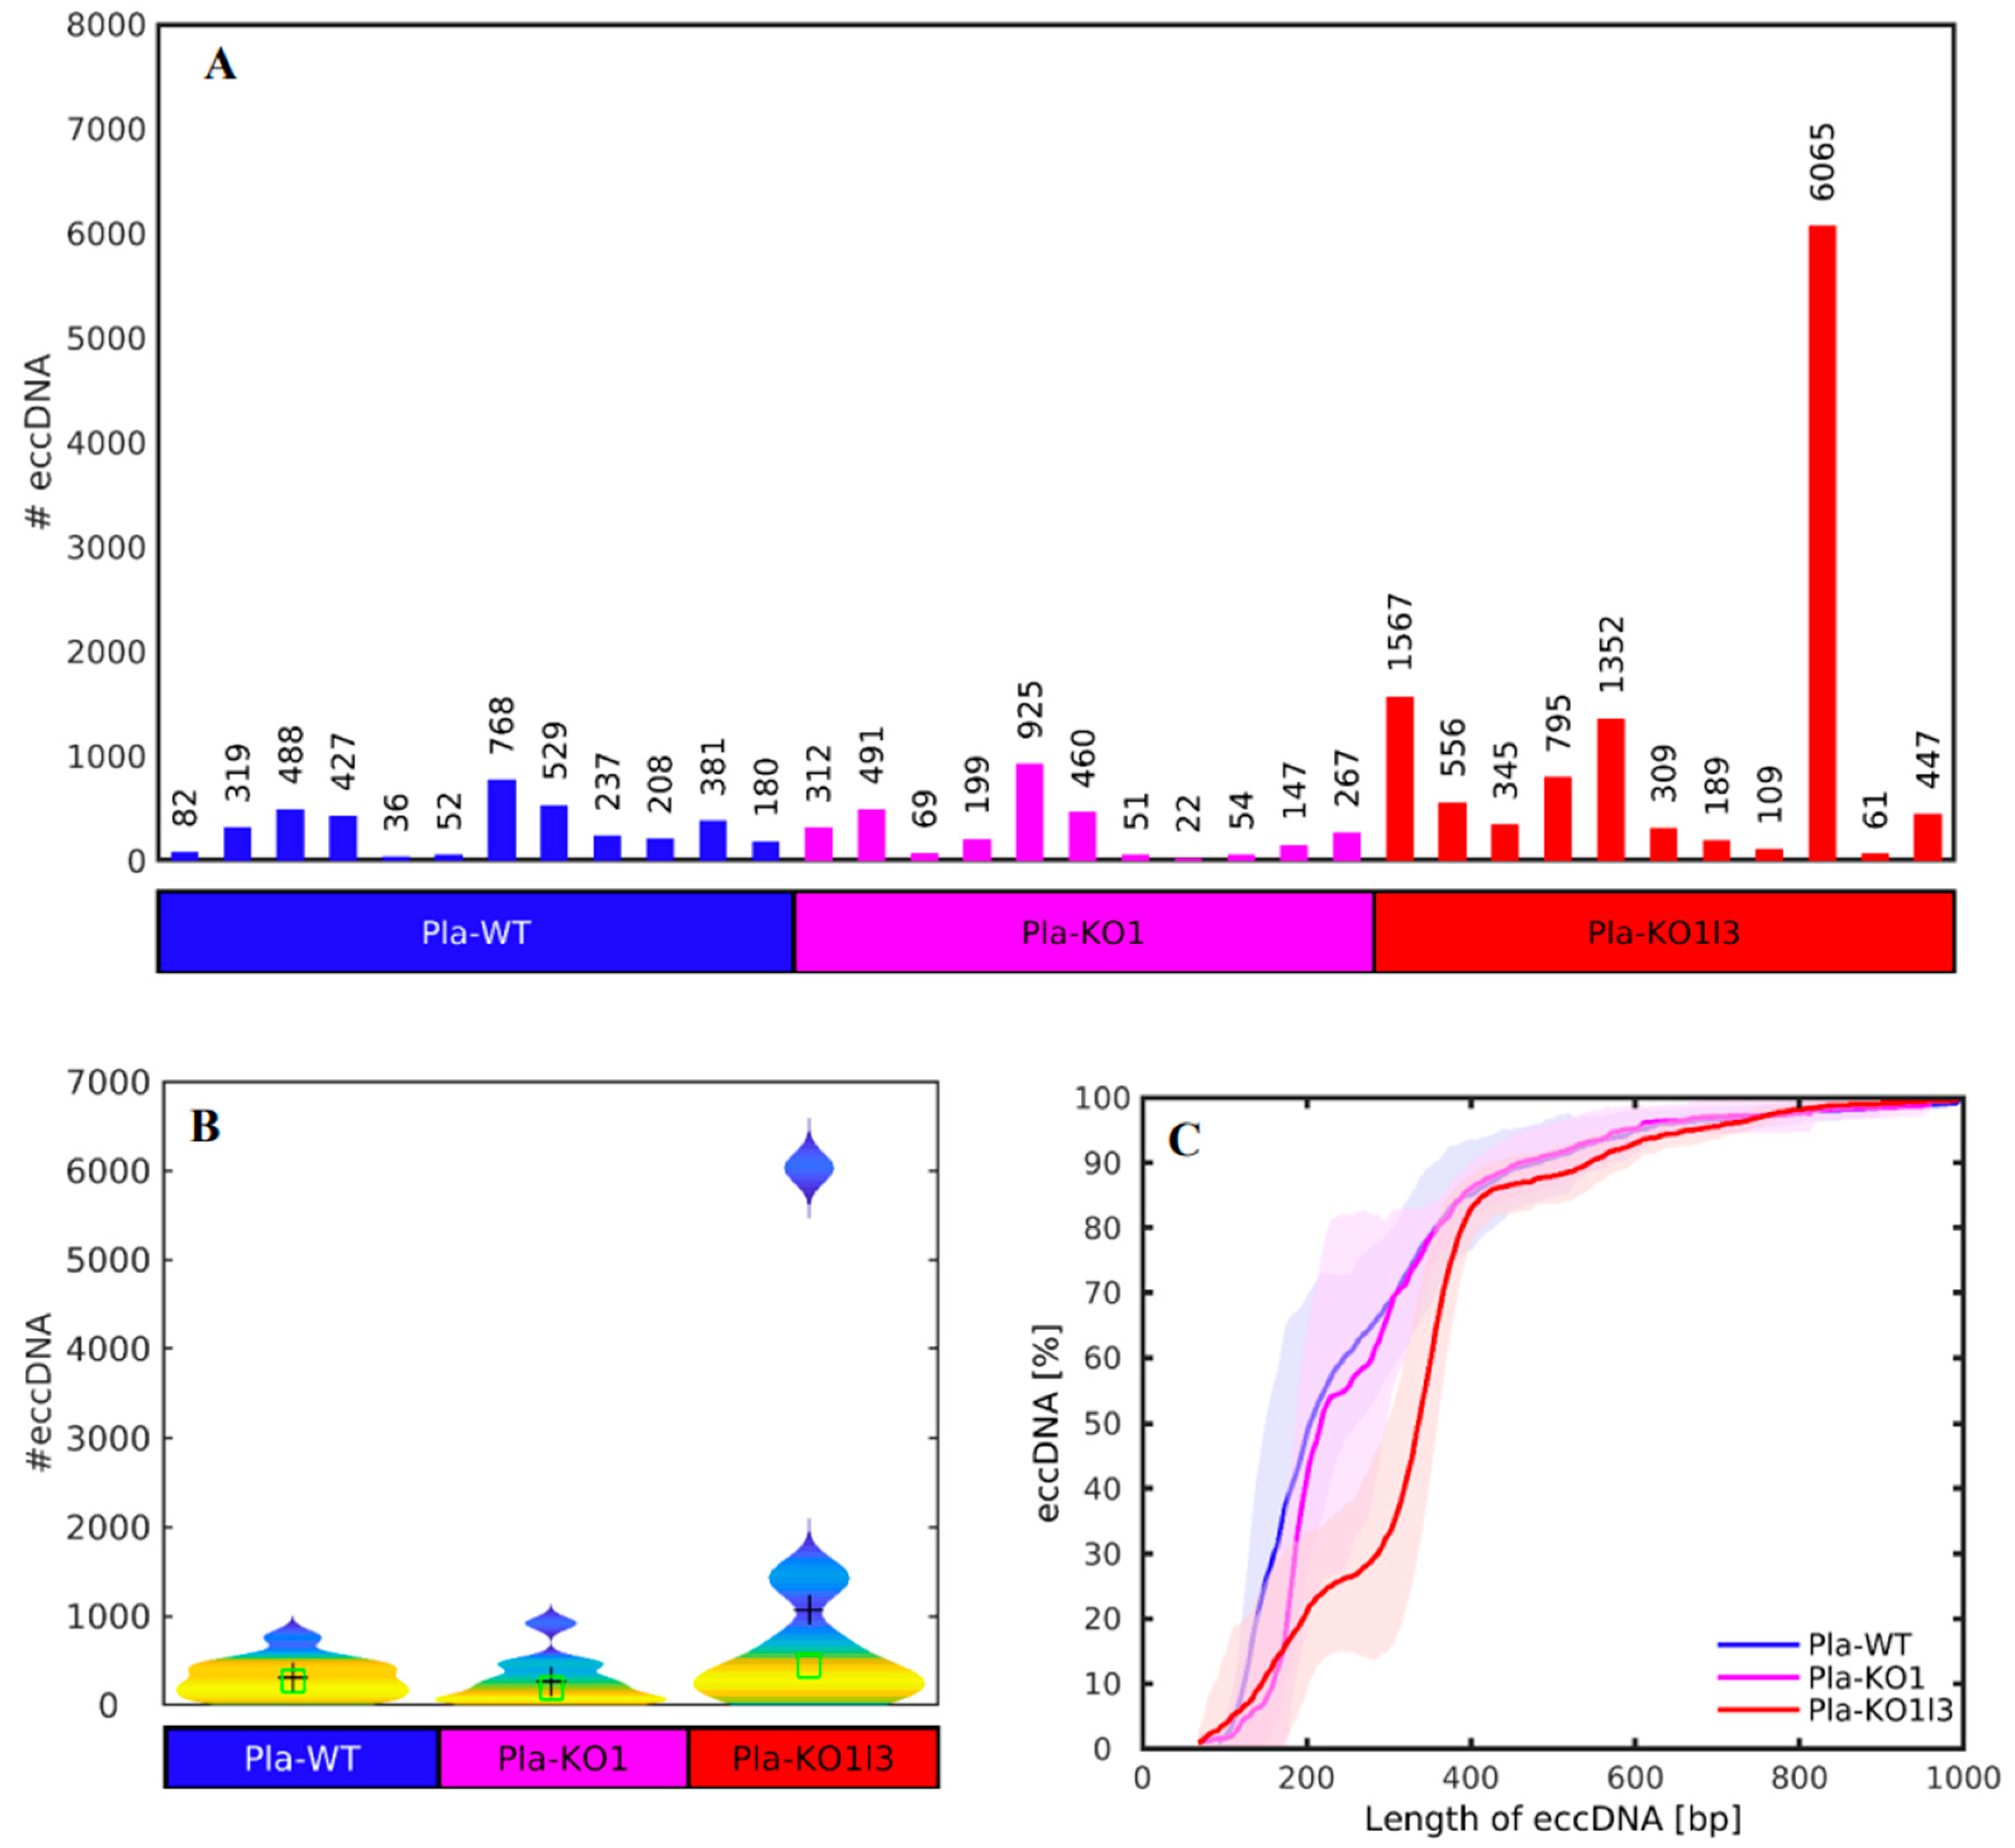
3.2. The Number of cf-eccDNAs Does Not Discriminate between the DNase KOs and WT
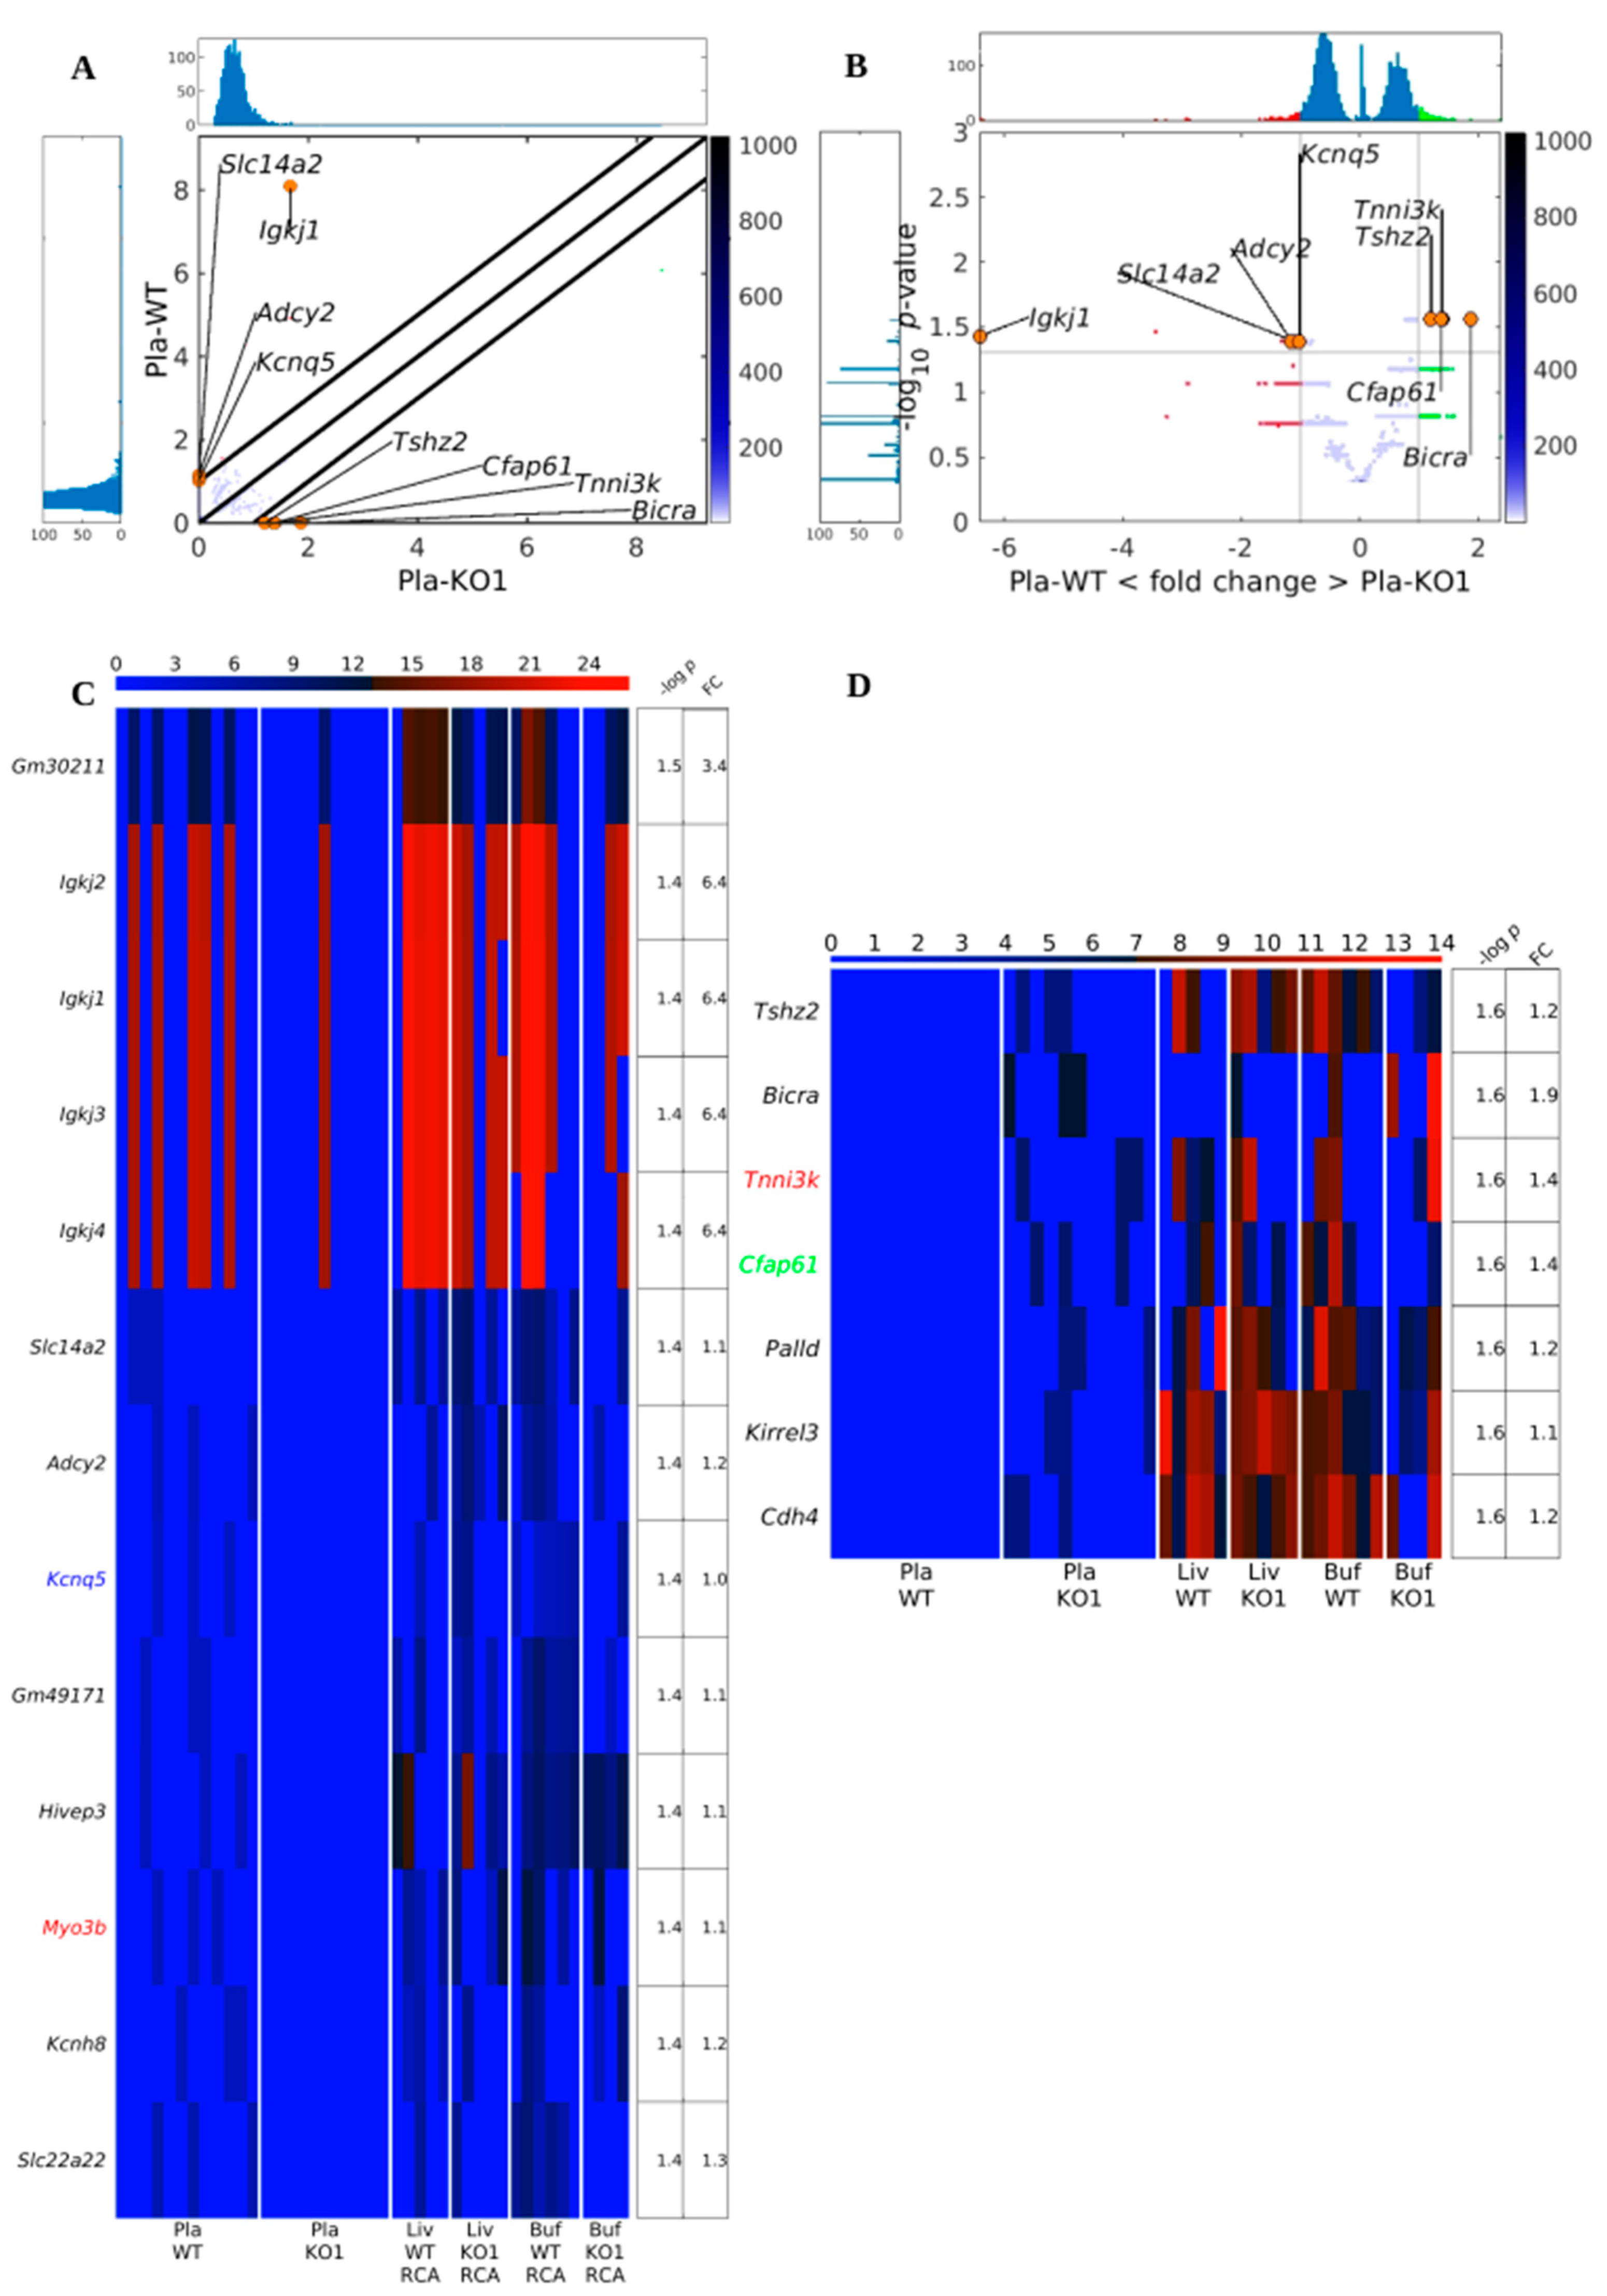
3.3. Existing but Scarce Genic cf-eccDNA Differences between Dnase1 KO and WT
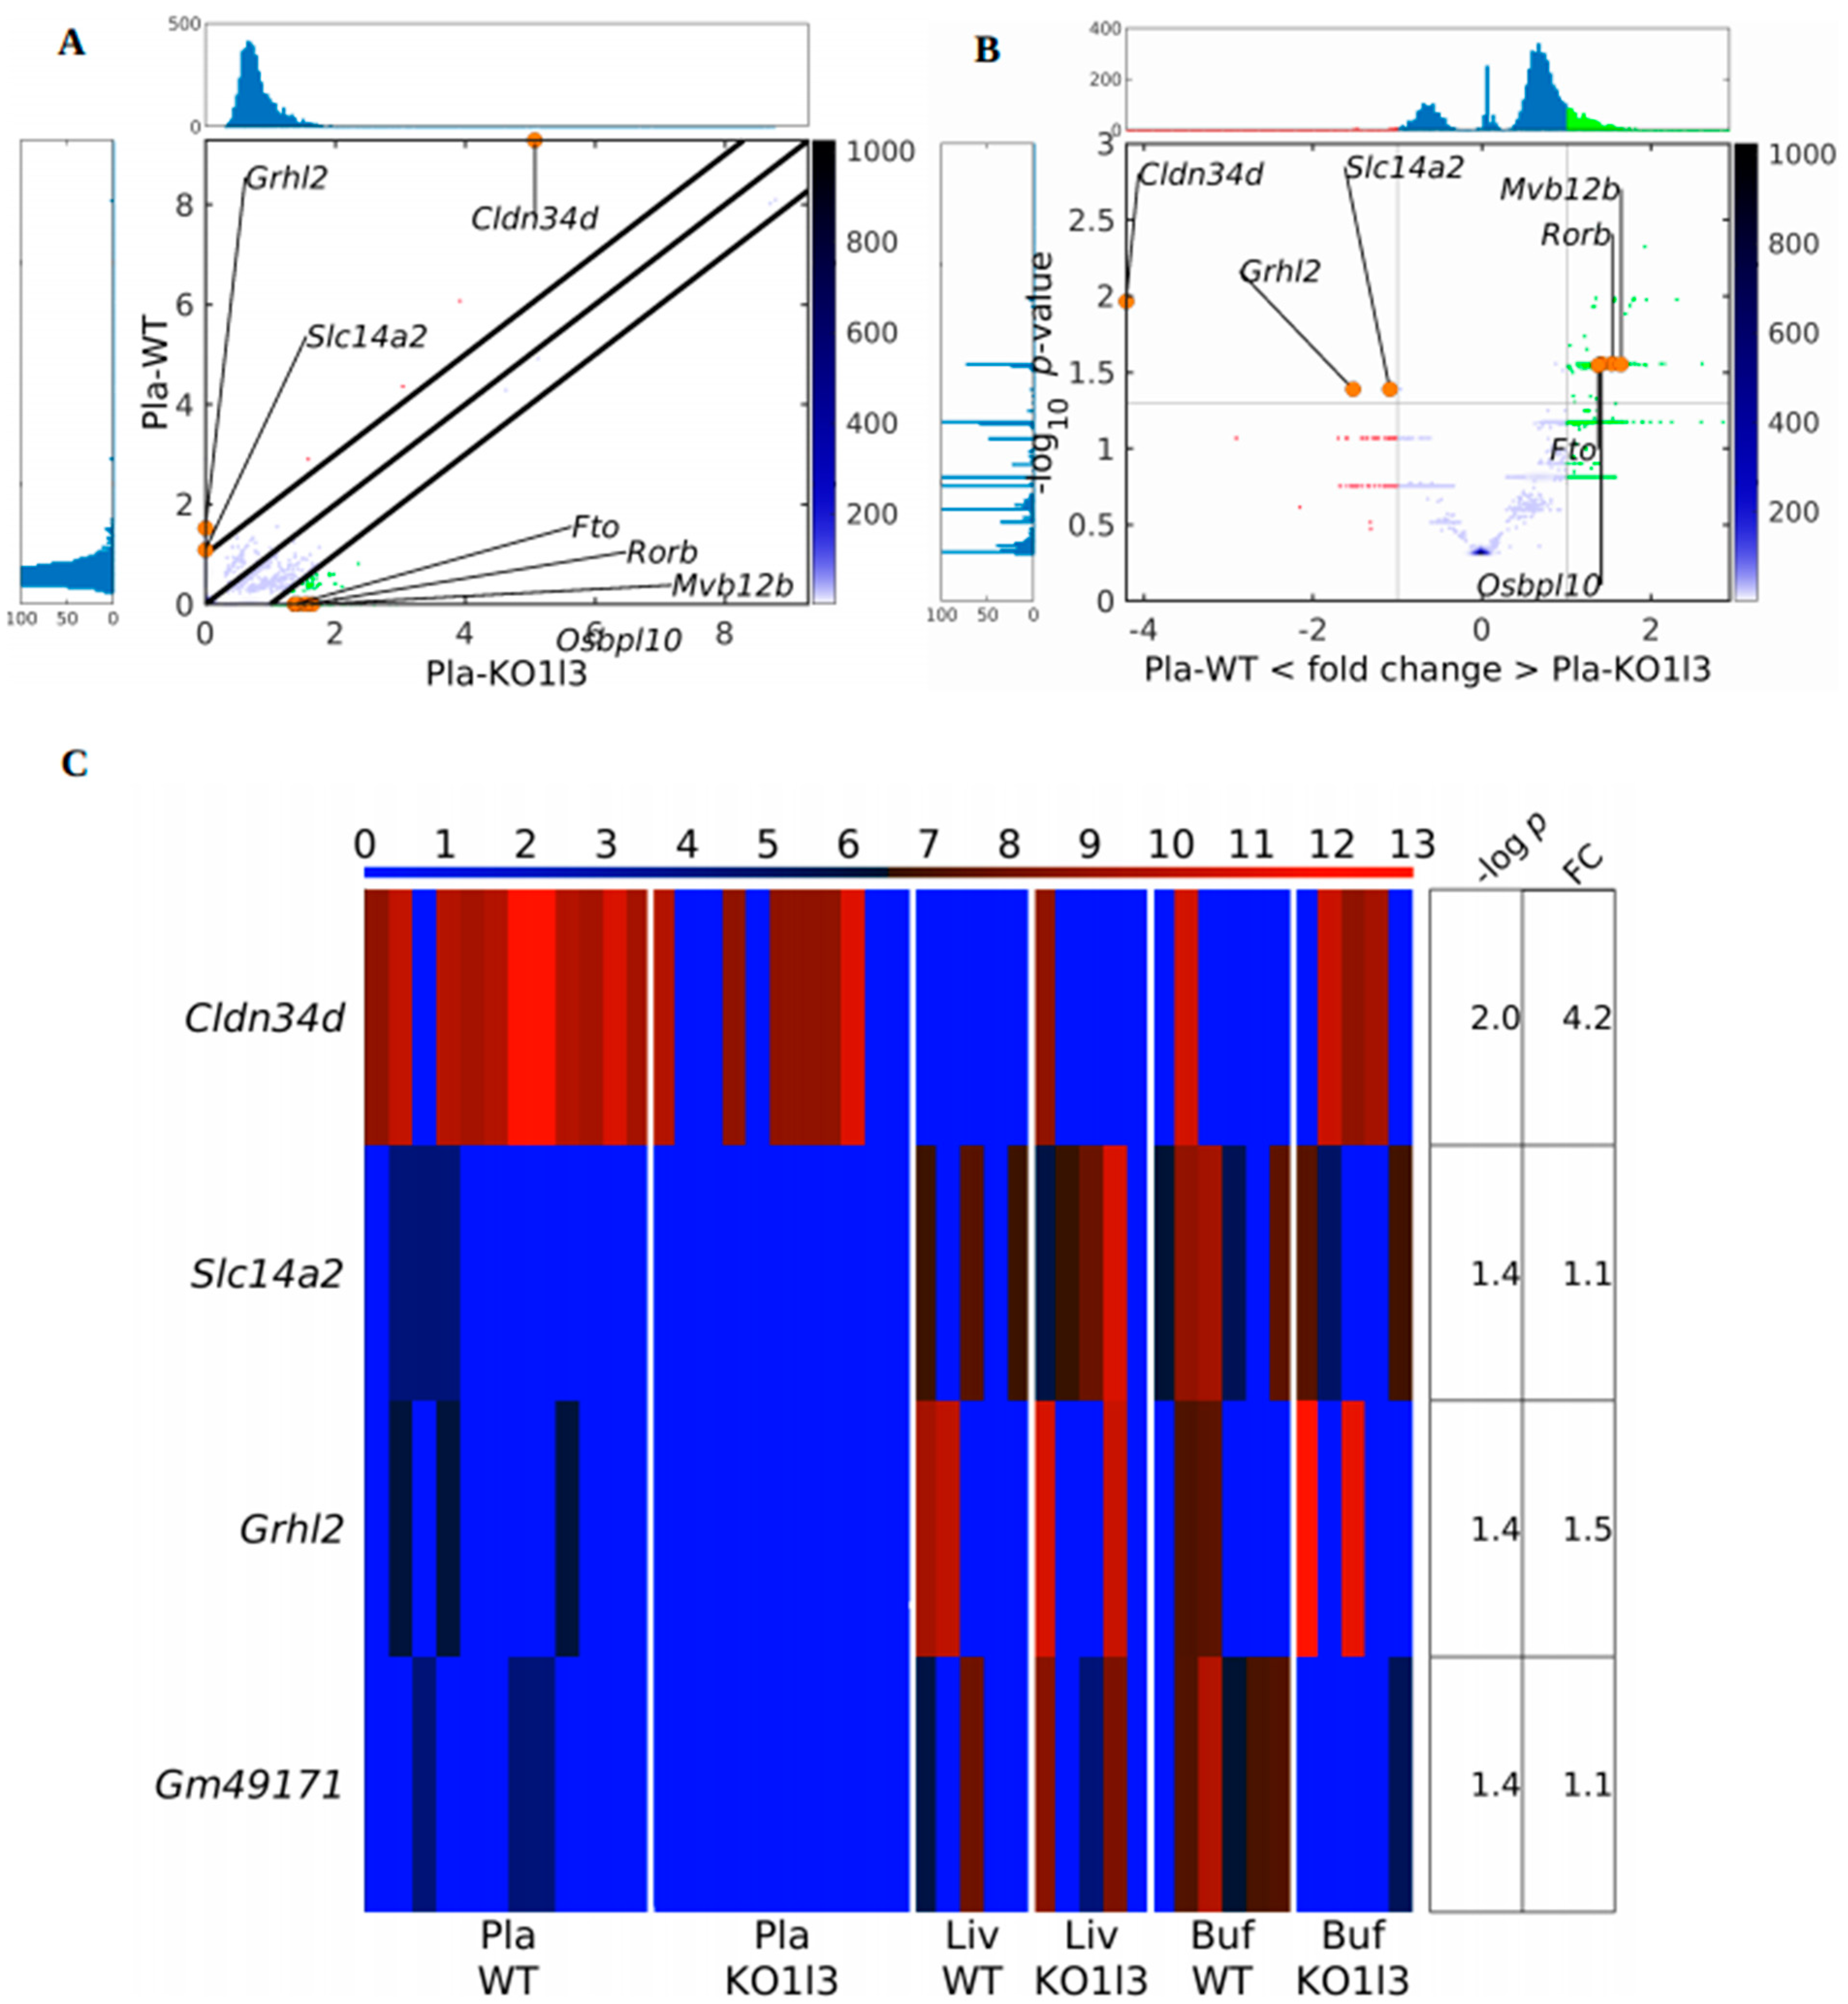
3.4. Distinctive and Specific Genic cf-eccDNA Profile of Dnase1l3 KO Compared to WT
3.5. Association of up-DPpGCs in Pla-KO1l3 with CFSs
3.6. Association of up-DPpGCs in Pla-KO1l3 with SLE in the GWAS catalog
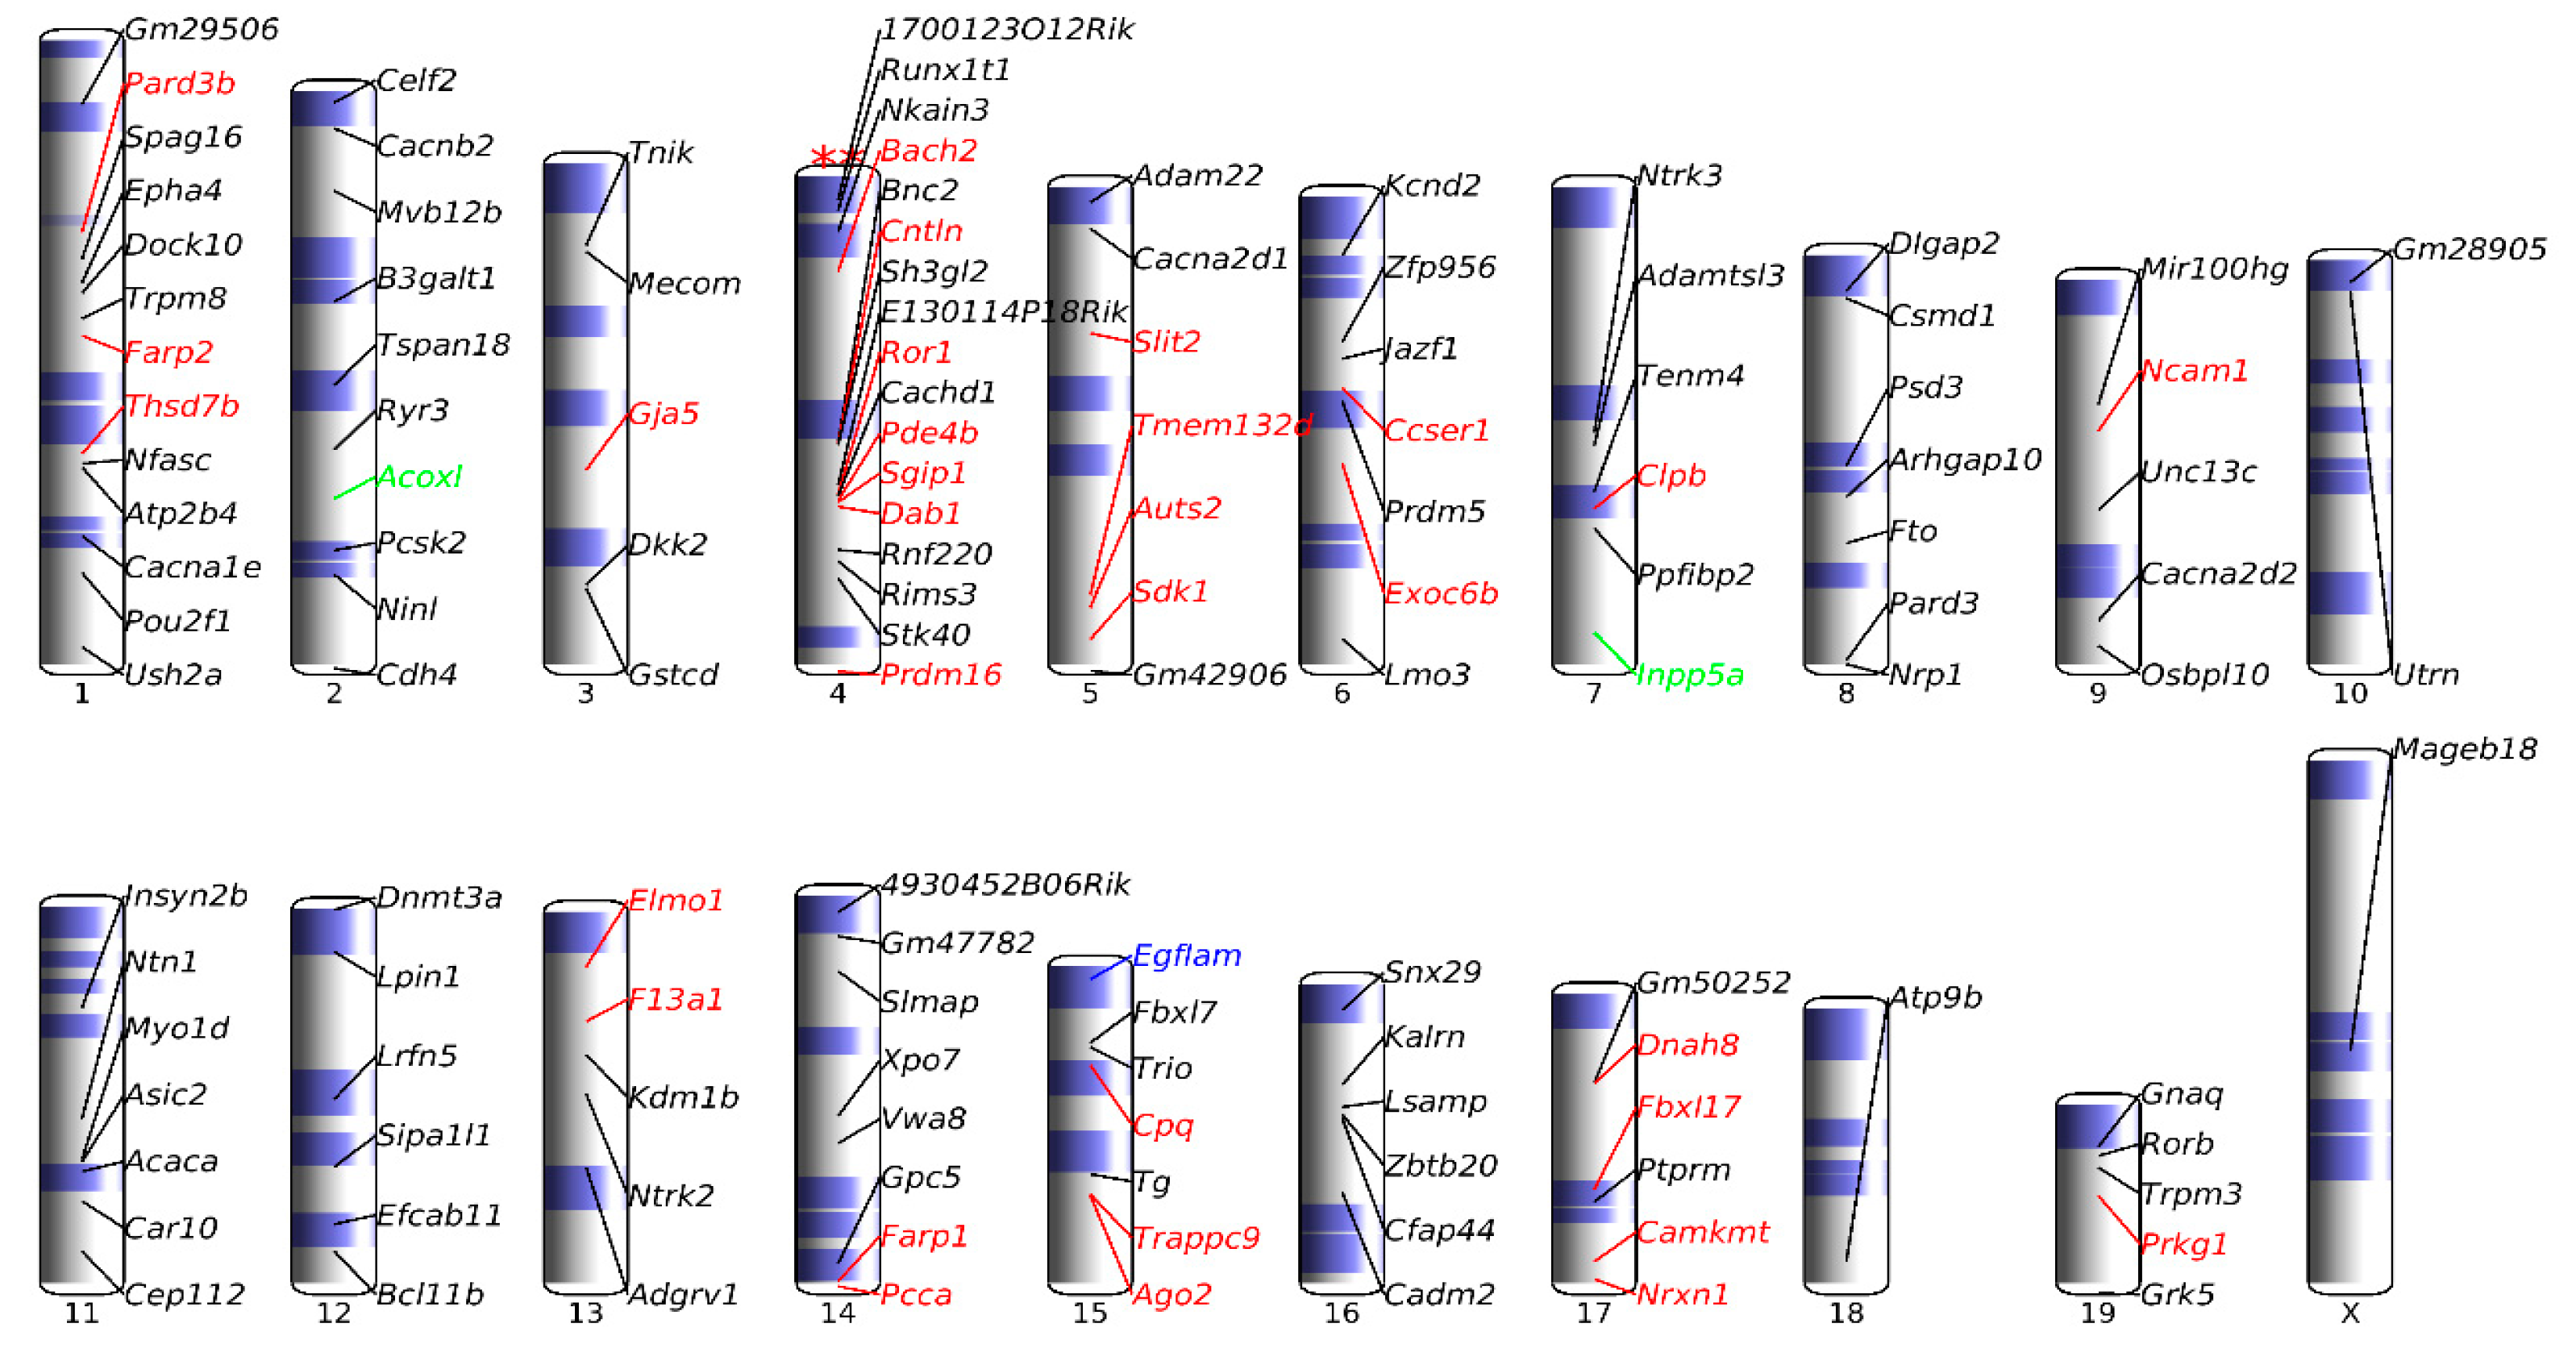
3.7. Chromosomal Landscaping of up-DPpGCs in Pla-KO1l3 Compared to Pla-WT
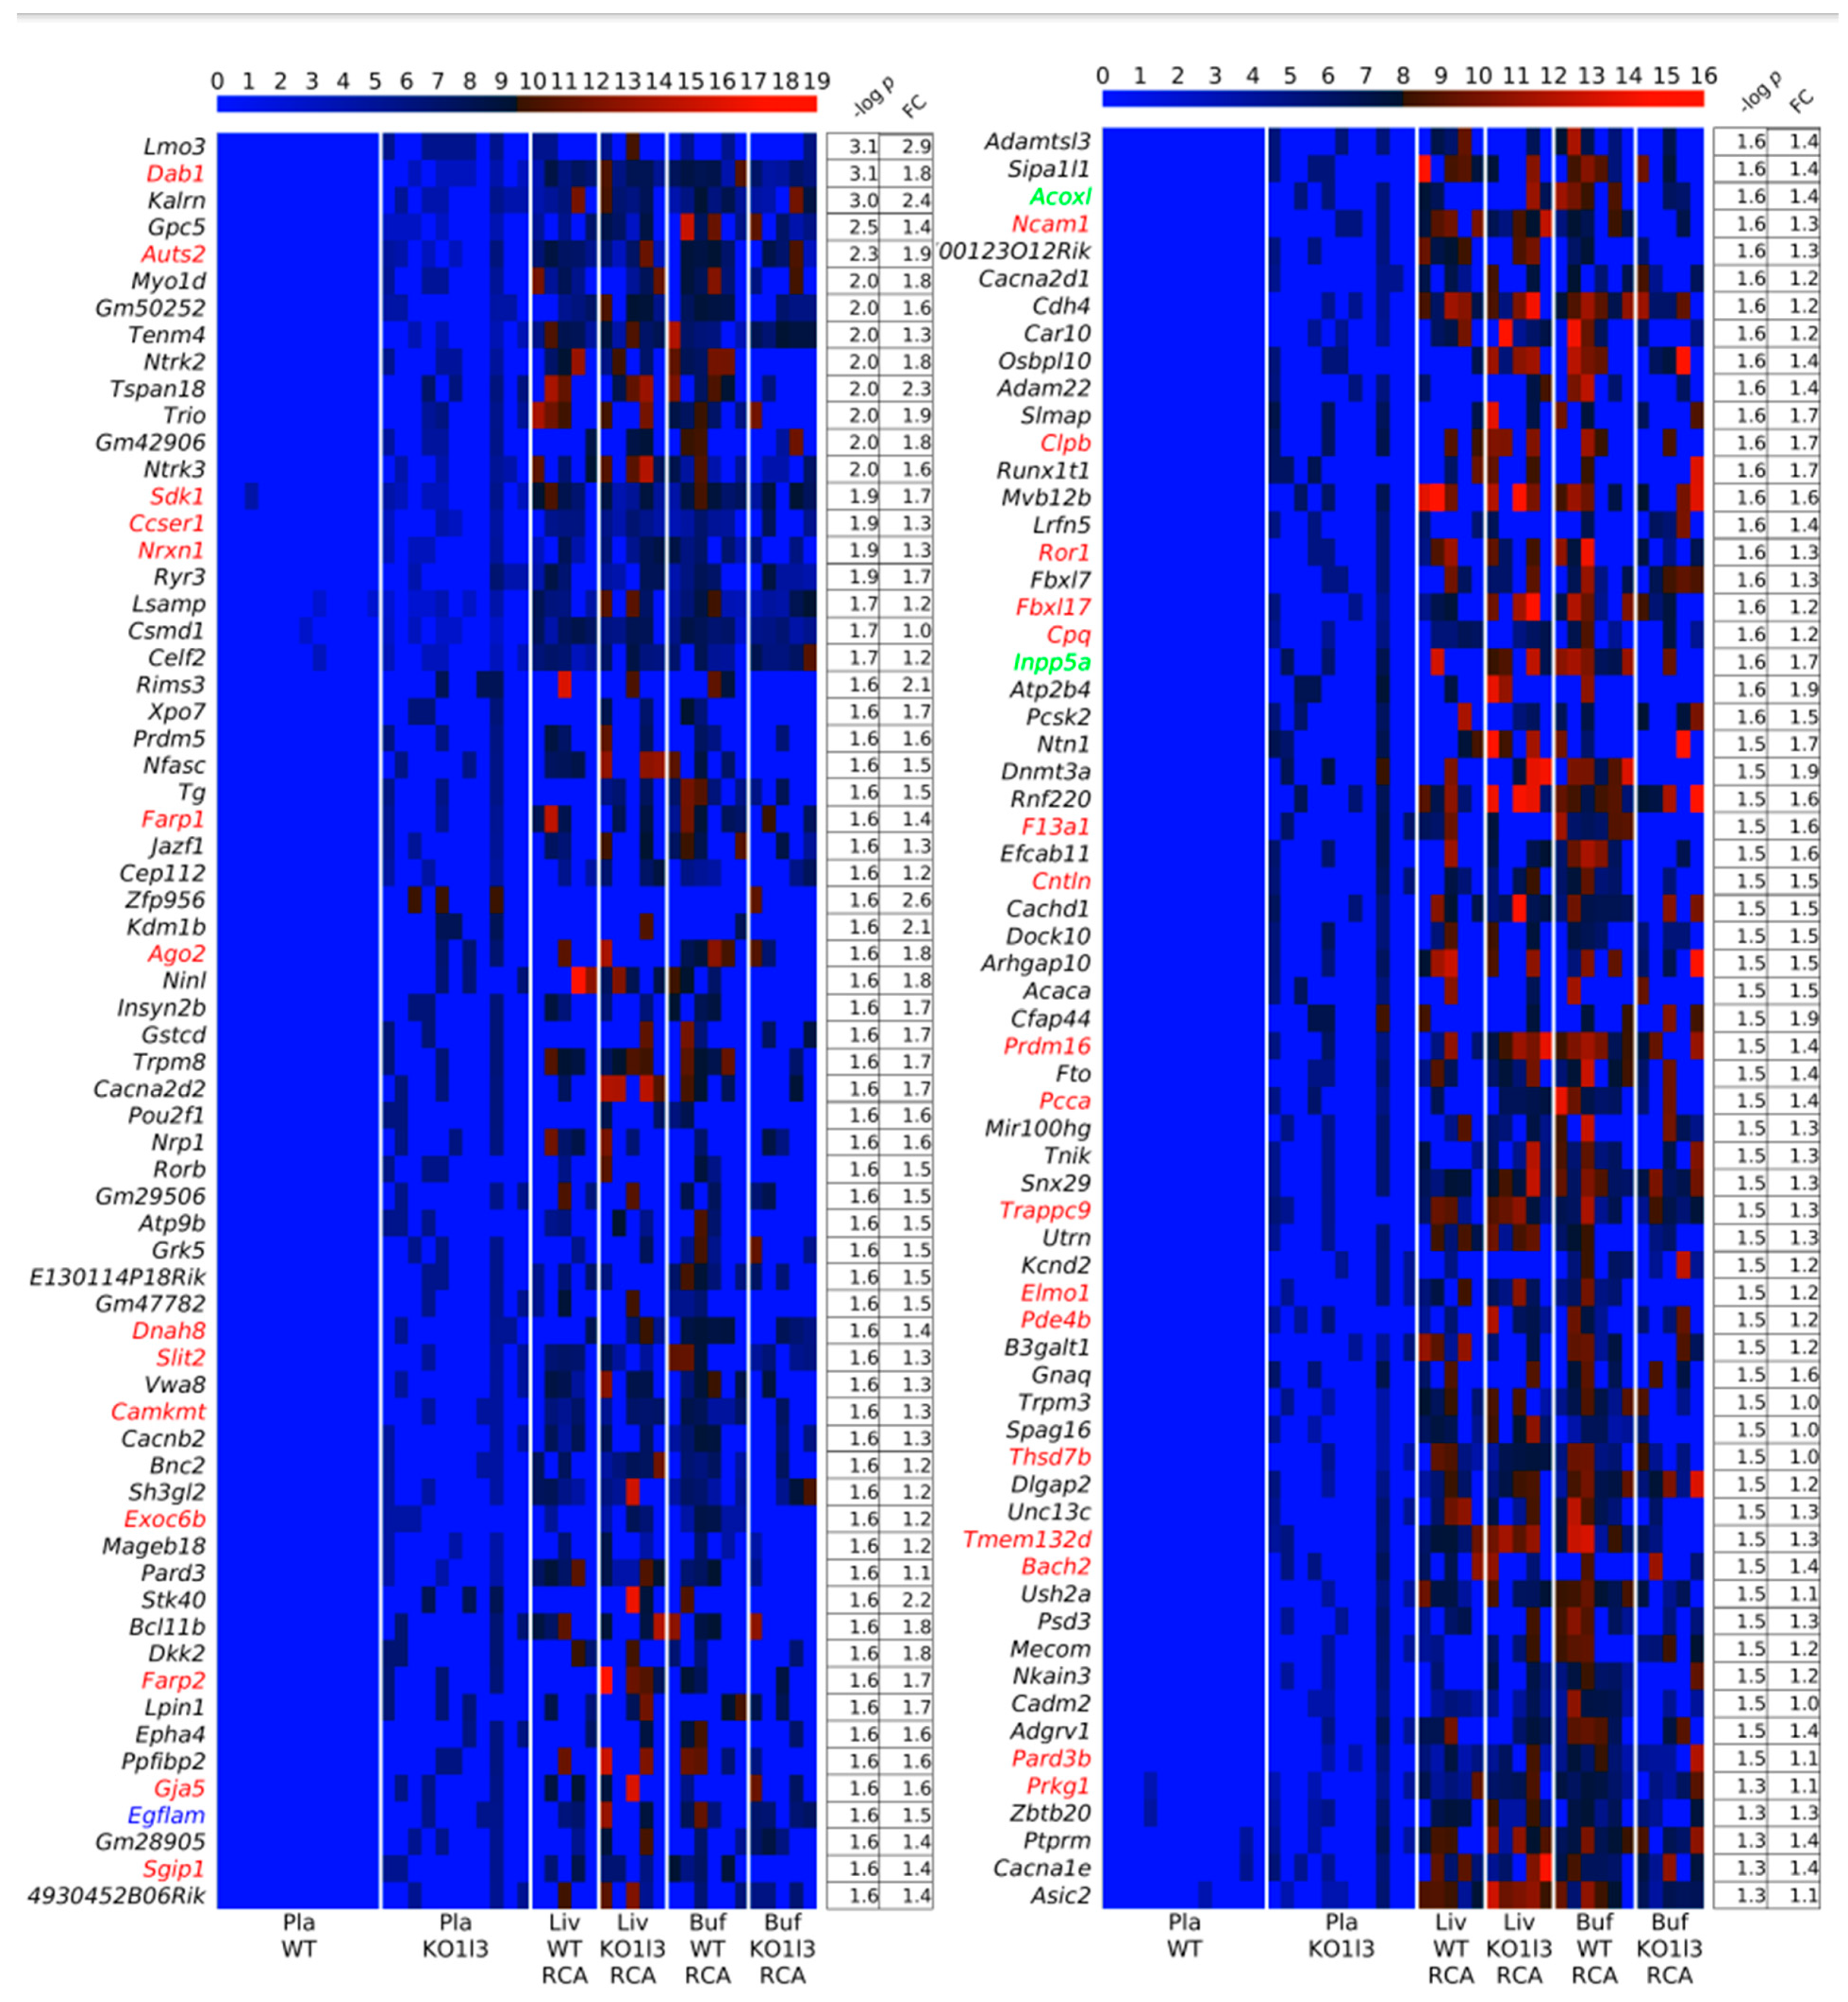
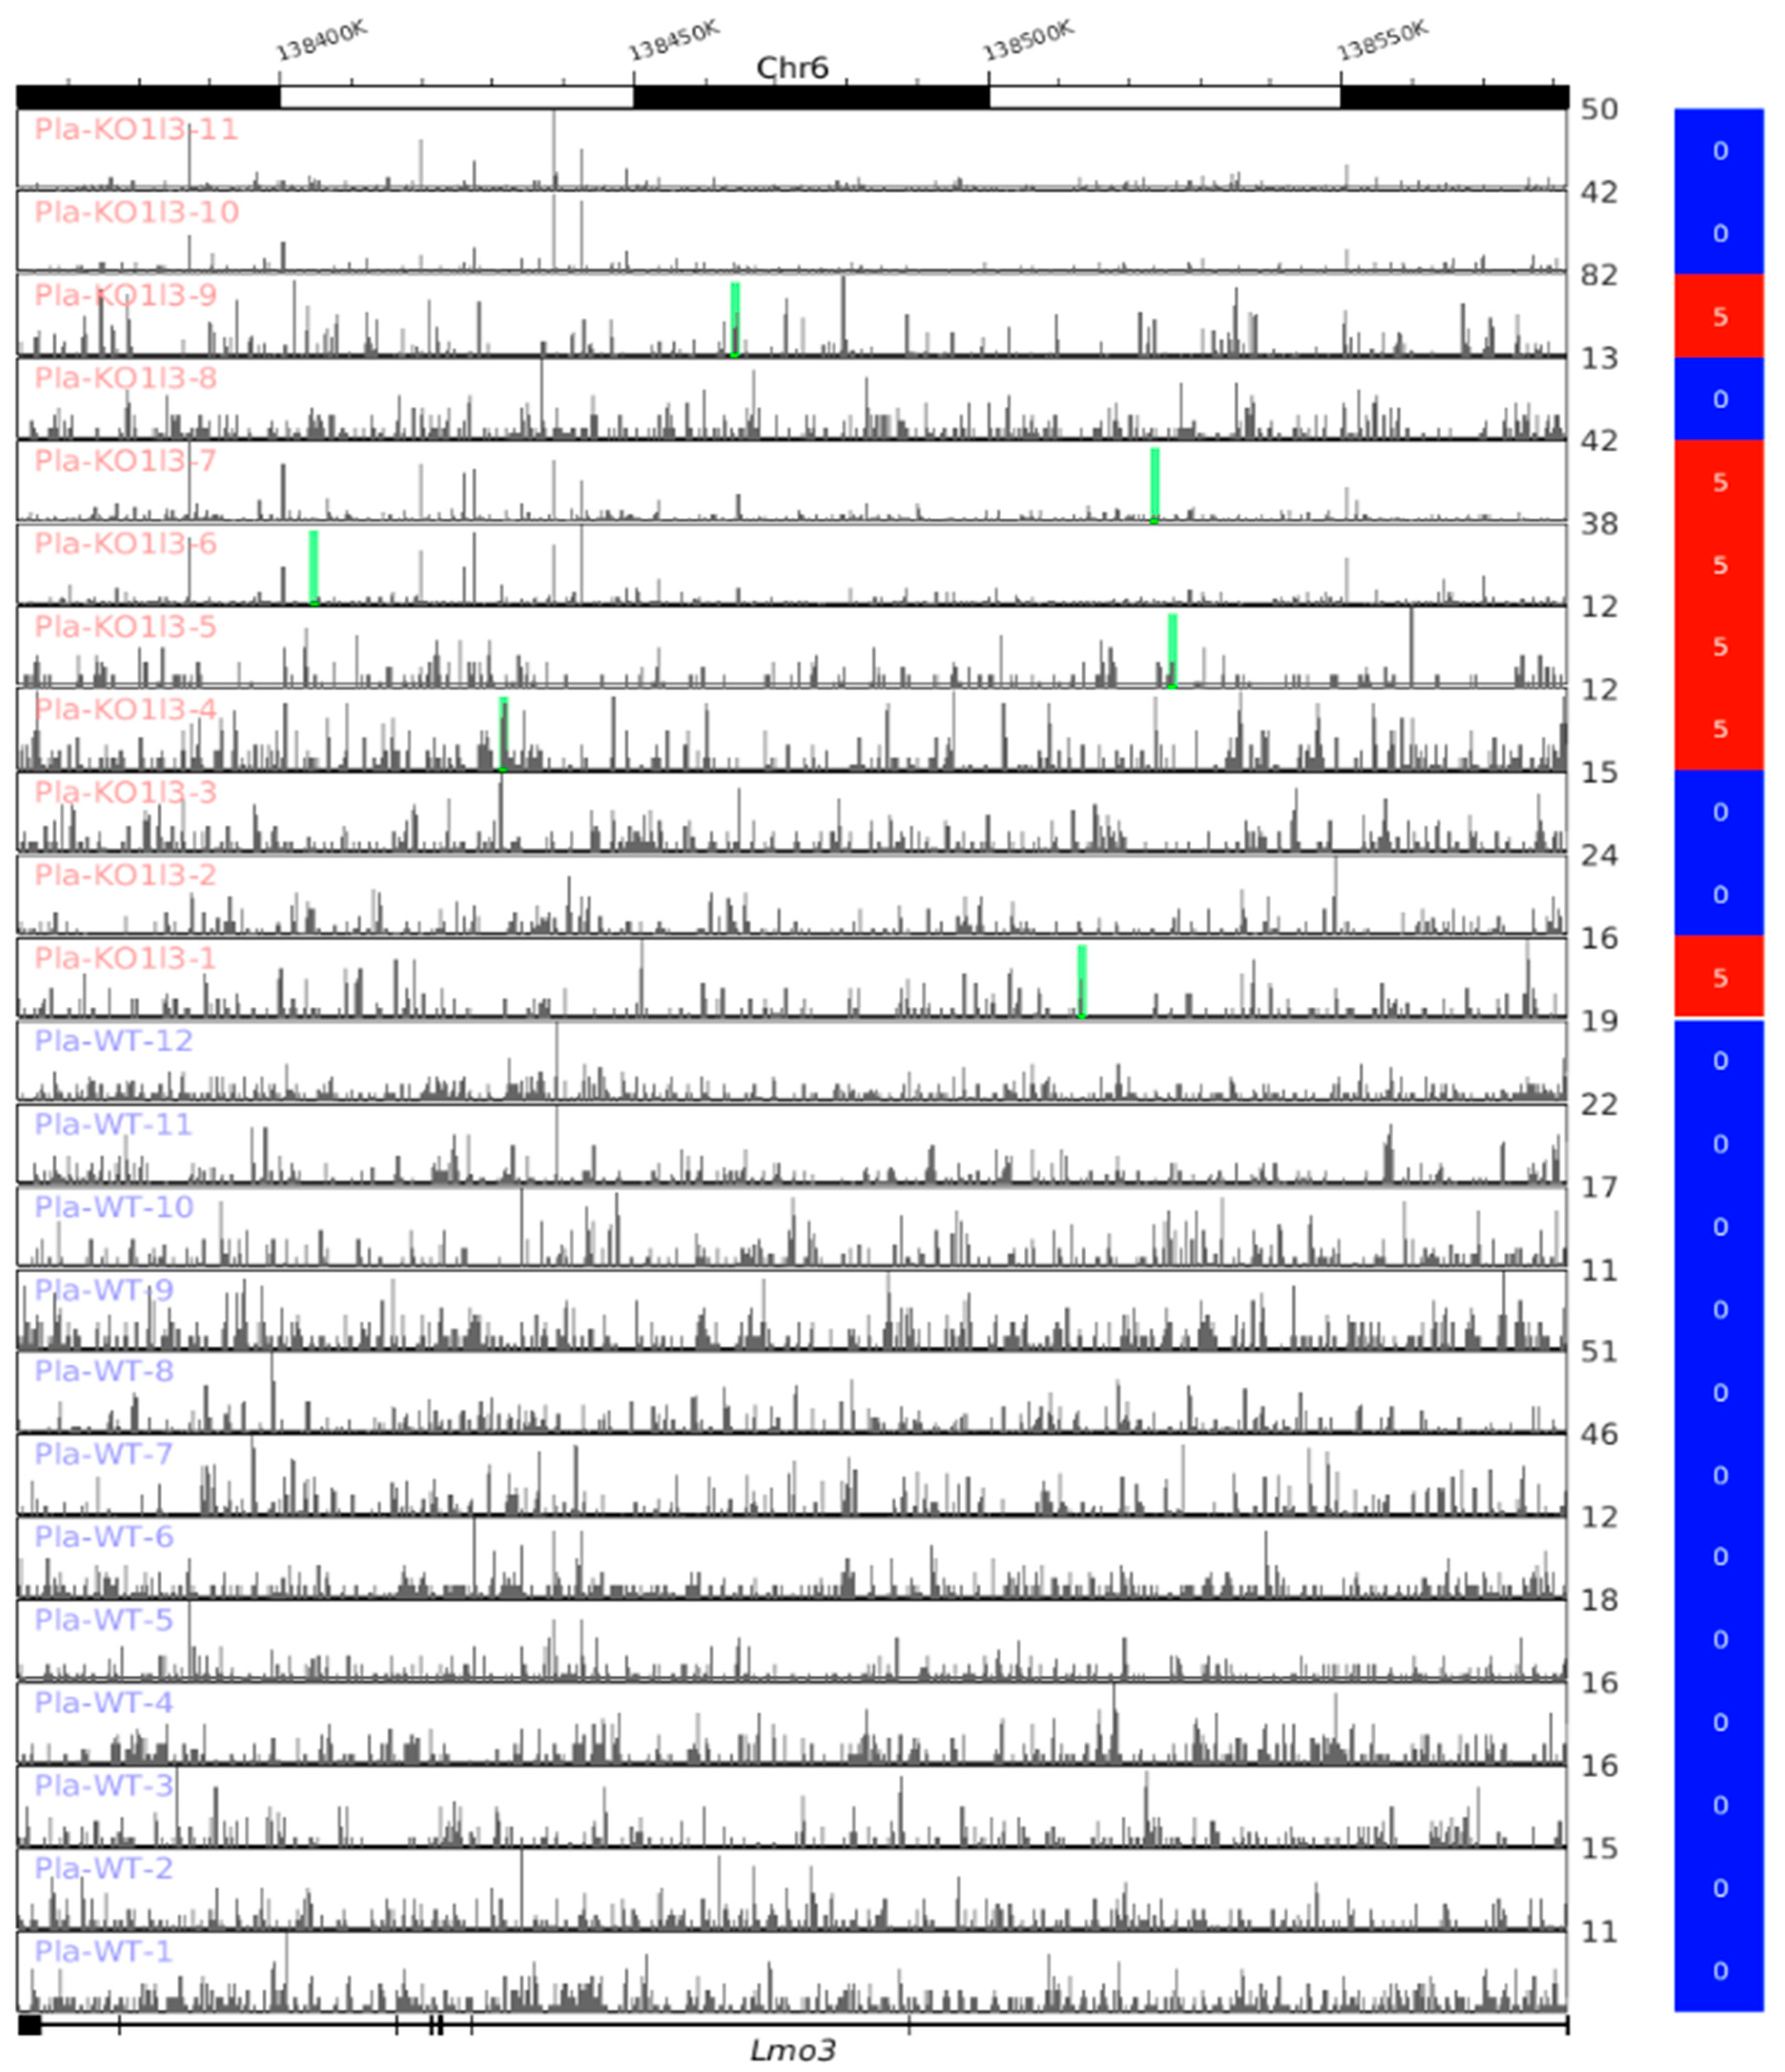
3.8. Visualization of up-DPpGCs in Pla-KO1l3, eccDNA Excising Loci and Coverage in All Plasma Samples
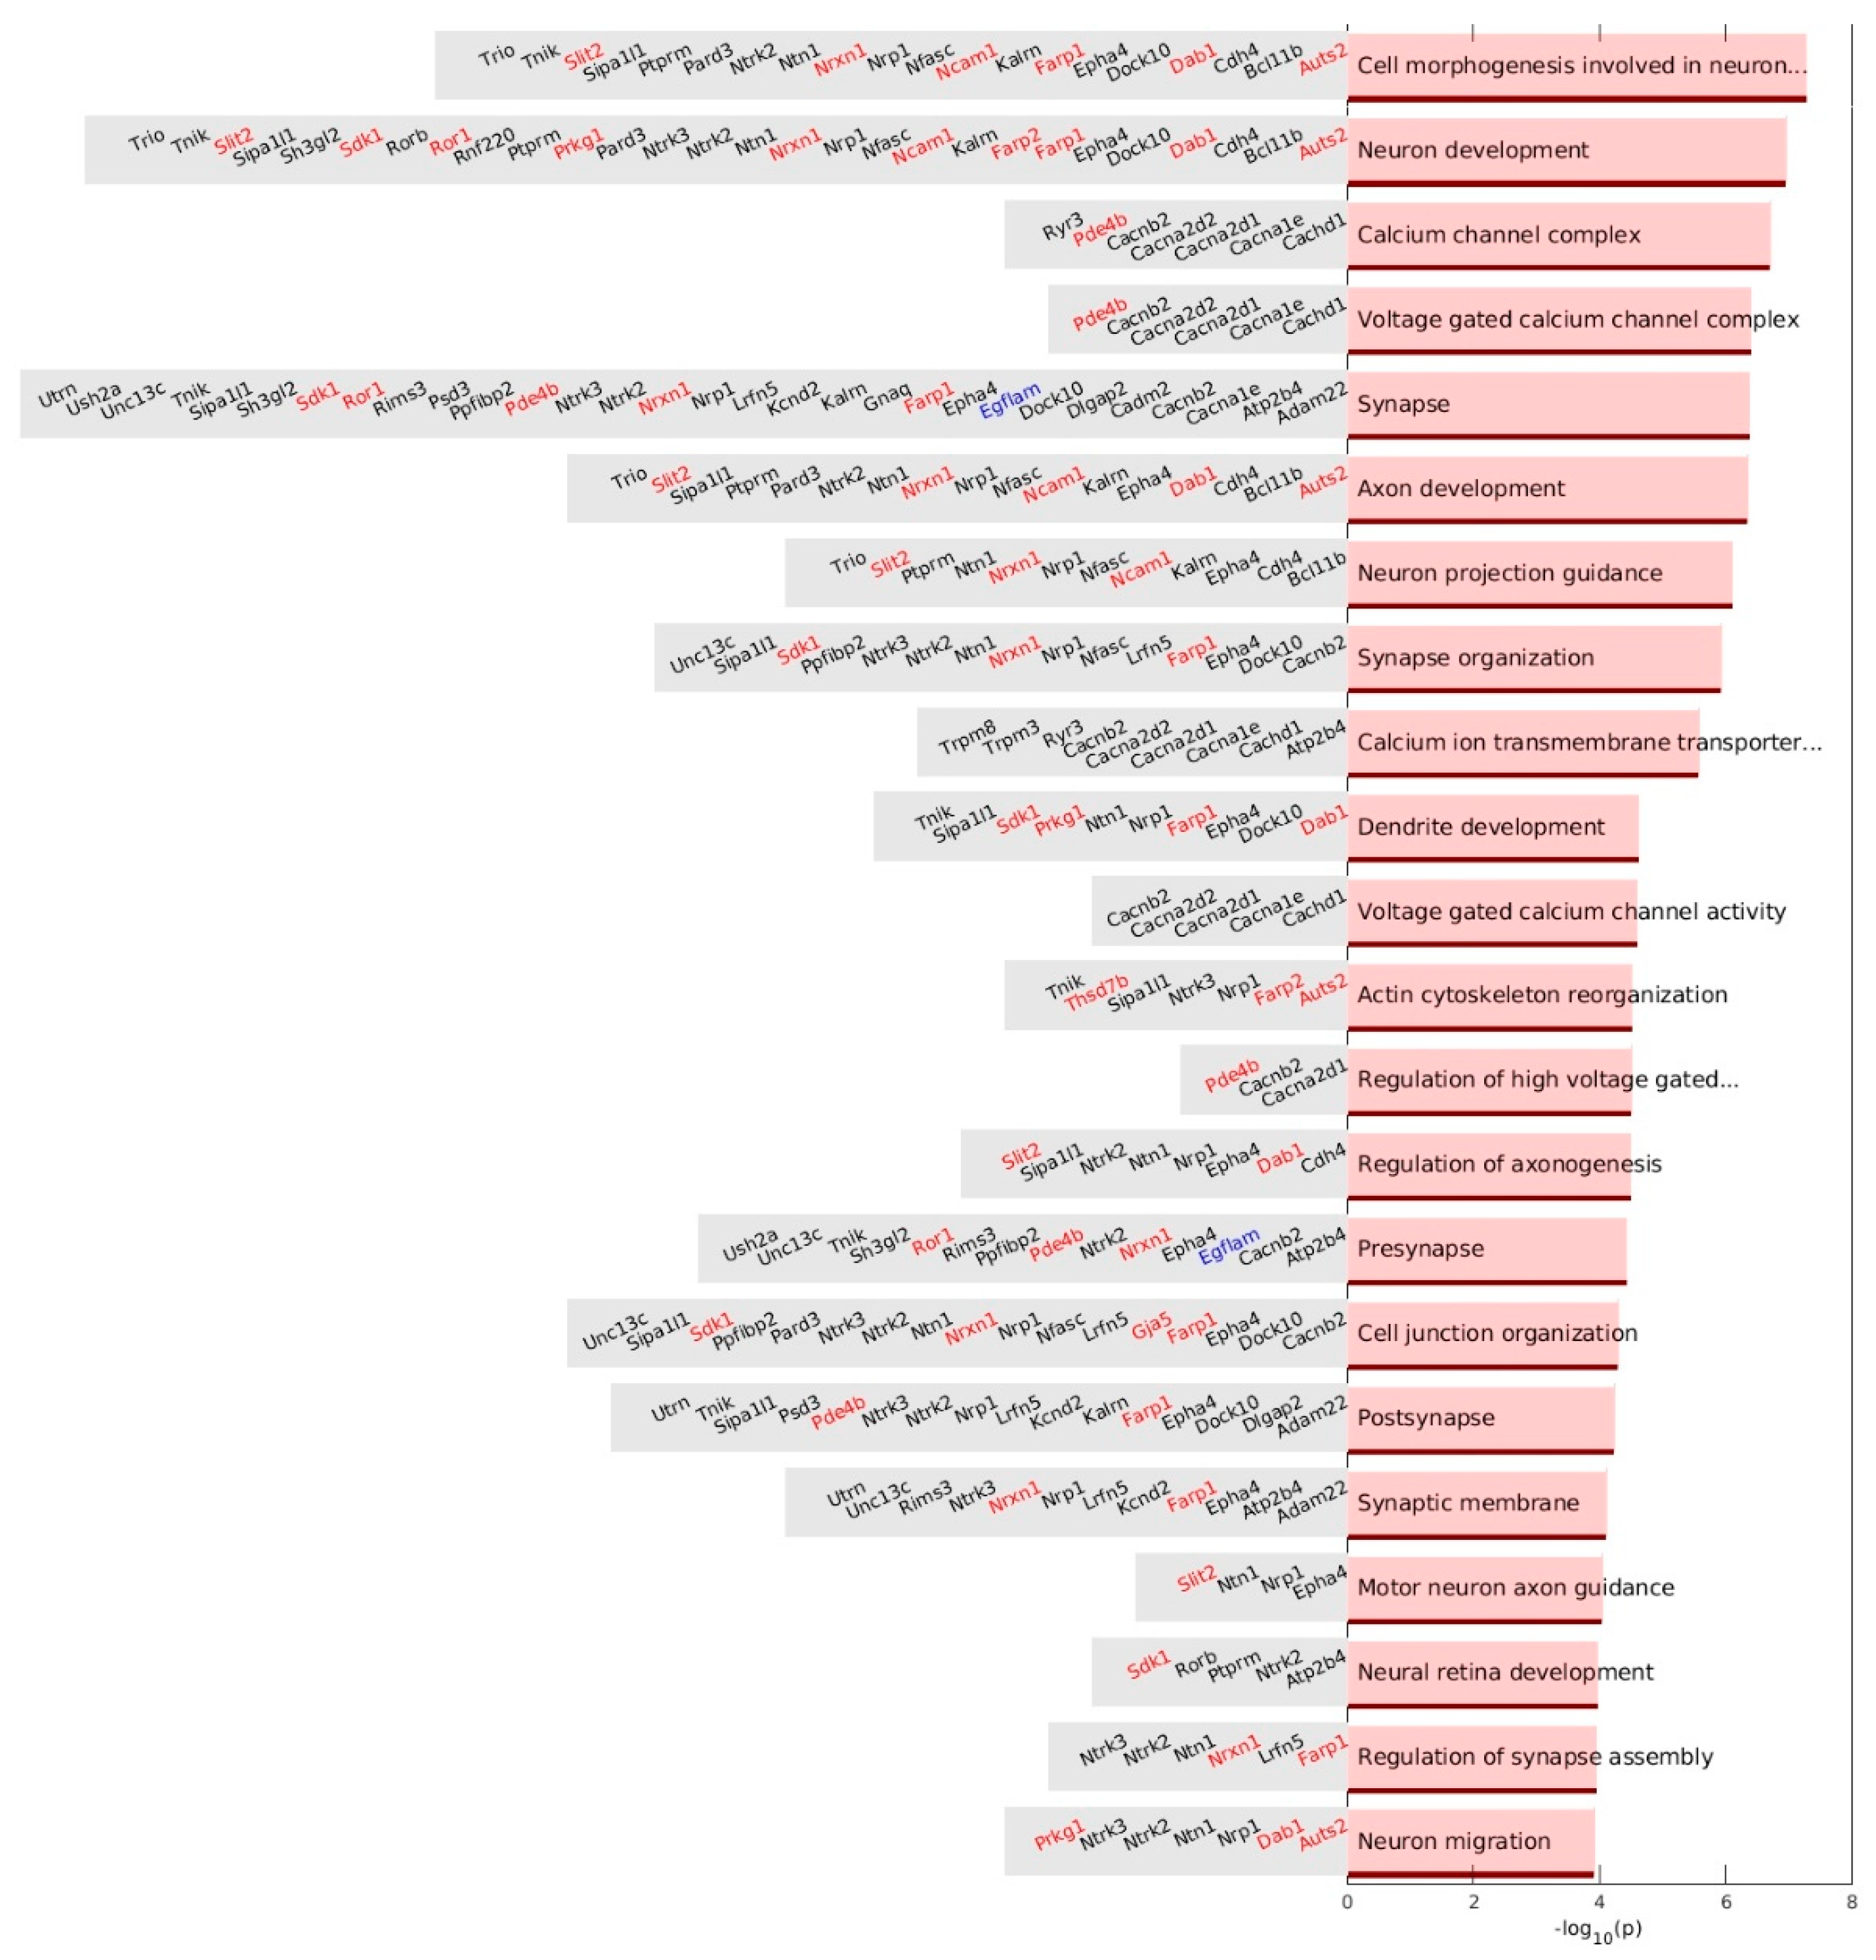
3.9. Gene Set Enrichment Analysis of up-DPpGCs in Pla-KO1l3
3.10. Common up-DPpGCs in Pla-KO1l3 and Pla-SLE Patients
3.11. Associations of up-DPpGCs in Pla-SLE with CFSs
4. Discussion and Conclusions
Supplementary Materials
Author Contributions
Funding
Institutional Review Board Statement
Informed Consent Statement
Data Availability Statement
Conflicts of Interest
References
- Keyel, P.A. Dnases in health and disease. Dev. Biol. 2017, 429, 1–11. [Google Scholar] [CrossRef] [PubMed]
- Luo, X.; Zhang, L.; Cui, J.; An, Q.; Li, H.; Zhang, Z.; Sun, G.; Huang, W.; Li, Y.; Li, C.; et al. Small extrachromosomal circular DNAs as biomarkers for multi-cancer diagnosis and monitoring. Clin. Transl. Med. 2023, 13, e1393. [Google Scholar] [CrossRef] [PubMed]
- Xu, Z.; He, J.; Han, P.; Dai, P.; Lv, W.; Liu, N.; Liu, L.; Liu, L.; Pan, X.; Xiang, X.; et al. Plasma extrachromosomal circular DNA is a pathophysiological hallmark of short-term intensive insulin therapy for type 2 diabetes. Clin. Transl. Med. 2023, 13, e1437. [Google Scholar] [CrossRef] [PubMed]
- Di Vincenzo, F.; Yadid, Y.; Petito, V.; Emoli, V.; Masi, L.; Gerovska, D.; Araúzo-Bravo, M.J.; Gasbarrini, A.; Regenberg, B.; Scaldaferri, F. Circular and Circulating DNA in Inflammatory Bowel Disease: From Pathogenesis to Potential Molecular Therapies. Cells 2023, 12, 1953. [Google Scholar] [CrossRef] [PubMed]
- Gerovska, D.; Noer, J.B.; Qin, Y.; Ain, Q.; Januzi, D.; Schwab, M.; Witte, O.W.; Araúzo-Bravo, M.J.; Kretz, A. A distinct circular DNA profile intersects with proteome changes in the genotoxic stress-related hSOD1G93A model of ALS. Cell Biosci. 2023, 13, 170. [Google Scholar] [CrossRef] [PubMed]
- Yang, L.; Wang, M.; Hu, X.; Yuan, L.; Chen, S.; Peng, S.; Yang, P.; Yang, Z.; Bao, G.; He, X. EccDNA-oriented ITGB7 expression in breast cancer. Ann. Transl. Med. 2022, 10, 1344. [Google Scholar] [CrossRef] [PubMed]
- Sun, Z.; Ji, N.; Zhao, R.; Liang, J.; Jiang, J.; Tian, H. Extrachromosomal circular DNAs are common and functional in esophageal squamous cell carcinoma. Ann. Transl. Med. 2021, 9, 1464. [Google Scholar] [CrossRef]
- Sin, S.T.; Deng, J.; Ji, L.; Yukawa, M.; Chan, R.W.; Volpi, S.; Vaglio, A.; Fenaroli, P.; Bocca, P.; Cheng, S.H.; et al. Effects of nucleases on cell-free extrachromosomal circular DNA. JCI Insight 2022, 7, e156070. [Google Scholar] [CrossRef]
- Benitez, A.; Sebald, M.; Kanagaraj, R.; Rodrigo-Brenni, M.C.; Chan, Y.W.; Liang, C.C.; West, S.C. GEN1 promotes common fragile site expression. Cell Rep. 2023, 42, 112062. [Google Scholar] [CrossRef]
- Smith, D.I.; Zhu, Y.; McAvoy, S.; Kuhn, R. Common fragile sites, extremely large genes, neural development and cancer. Cancer Lett. 2006, 232, 48–57. [Google Scholar] [CrossRef]
- Helmrich, A.; Stout-Weider, K.; Hermann, K.; Schrock, E.; Heiden, T. Common fragile sites are conserved features of human and mouse chromosomes and relate to large active genes. Genome Res. 2006, 16, 1222–1230. [Google Scholar] [CrossRef]
- Georgakilas, A.G.; Tsantoulis, P.; Kotsinas, A.; Michalopoulos, I.; Townsend, P.; Gorgoulis, V.G. Are common fragile sites merely structural domains or highly organized "functional" units susceptible to oncogenic stress? Cell. Mol. Life Sci. 2014, 71, 4519–4544. [Google Scholar] [CrossRef] [PubMed]
- Ji, F.; Zhu, X.; Liao, H.; Ouyang, L.; Huang, Y.; Syeda, M.Z.; Ying, S. New Era of Mapping and Understanding Common Fragile Sites: An Updated Review on Origin of Chromosome Fragility. Front. Genet. 2022, 13, 906957. [Google Scholar] [CrossRef] [PubMed]
- Gerovska, D.; Araúzo-Bravo, M.J. Systemic Lupus Erythematosus Patients with DNASE1L3·Deficiency Have a Distinctive and Specific Genic Circular DNA Profile in Plasma. Cells 2023, 12, 1061. [Google Scholar] [CrossRef] [PubMed]
- Gerovska, D.; Araúzo-Bravo, M.J. Skeletal Muscles of Sedentary and Physically Active Aged People Have Distinctive Genic Extrachromosomal Circular DNA Profiles. Int. J. Mol. Sci. 2023, 24, 2736. [Google Scholar] [CrossRef] [PubMed]
- Sin, S.T.K.; Jiang, P.; Deng, J.; Ji, L.; Cheng, S.H.; Dutta, A.; Leung, T.Y.; Chan, K.C.A.; Chiu, R.W.K.; Lo, Y.M.D. Identification and characterization of extrachromosomal circular DNA in maternal plasma. Proc. Natl. Acad. Sci. USA 2020, 117, 1658–1665. [Google Scholar] [CrossRef] [PubMed]
- Shibata, Y.; Kumar, P.; Layer, R.; Willcox, S.; Gagan, J.R.; Griffith, J.D.; Dutta, A. Extrachromosomal microDNAs and chromosomal microdeletions in normal tissues. Science 2012, 336, 82–86. [Google Scholar] [CrossRef]
- Kumar, P.; Kiran, S.; Saha, S.; Su, Z.; Paulsen, T.; Chatrath, A.; Shibata, Y.; Shibata, E.; Dutta, A. ATAC-seq identifies thousands of extrachromosomal circular DNA in cancer and cell lines. Sci. Adv. 2020, 6, eaba2489. [Google Scholar] [CrossRef]
- Kumar, R.; Nagpal, G.; Kumar, V.; Usmani, S.S.; Agrawal, P.; Raghava, G.P.S. HumCFS: A database of fragile sites in human chromosomes. BMC Genom. 2019, 19 (Suppl. S9), 985. [Google Scholar] [CrossRef]
- Uribe, M.L.; Dahlhoff, M.; Batra, R.N.; Nataraj, N.B.; Haga, Y.; Drago-Garcia, D.; Marrocco, I.; Sekar, A.; Ghosh, S.; Vaknin, I.; et al. TSHZ2 is an EGF-regulated tumor suppressor that binds to the cytokinesis regulator PRC1 and inhibits metastasis. Sci. Signal. 2021, 14, eabe6156. [Google Scholar] [CrossRef]
- McAvoy, S.; Zhu, Y.; Perez, D.S.; James, C.D.; Smith, D.I. Disabled-1 is a large common fragile site gene, inactivated in multiple cancers. Genes. Chromosomes Cancer 2008, 47, 165–174. [Google Scholar] [CrossRef]
- Bosco, N.; Pelliccia, F.; Rocchi, A. Characterization of FRA7B, a human common fragile site mapped at the 7p chromosome terminal region. Cancer Genet. Cytogenet. 2010, 202, 47–52. [Google Scholar] [CrossRef] [PubMed]
- Gateva, V.; Sandling, J.K.; Hom, G.; Taylor, K.E.; Chung, S.A.; Sun, X.; Ortmann, W.; Kosoy, R.; Ferreira, R.C.; Nordmark, G.; et al. A large-scale replication study identifies TNIP1, PRDM1, JAZF1, UHRF1BP1 and IL10 as risk loci for systemic lupus erythematosus. Nat. Genet. 2009, 41, 1228–1233. [Google Scholar] [CrossRef] [PubMed]
- Elghzaly, A.A.; Sun, C.; Looger, L.L.; Hirose, M.; Salama, M.; Khalil, N.M.; Behiry, M.E.; Hegazy, M.T.; Hussein, M.A.; Salem, M.N.; et al. Genome-wide association study for systemic lupus erythematosus in an egyptian population. Front. Genet. 2022, 13, 948505. [Google Scholar] [CrossRef] [PubMed]
- Sheng, Y.; Zhang, J.; Li, K.; Wang, H.; Wang, W.; Wen, L.; Gao, J.; Tang, X.; Tang, H.; Huang, H.; et al. Bach2 overexpression represses Th9 cell differentiation by suppressing IRF4 expression in systemic lupus erythematosus. FEBS Open Bio. 2021, 11, 395–403. [Google Scholar] [CrossRef] [PubMed]
- Reedquist, K.A.; Tak, P.P. Signal transduction pathways in chronic inflammatory autoimmune disease: Small GTPases. Open Rheumatol. J. 2012, 6, 259–272. [Google Scholar] [CrossRef] [PubMed]
- Fernandez Ruiz, R.; Shum, J.; Van Buren, K.; Niewold, T. Functional Effects of a Lupus-associated PRKG1 Variant on the RhoA-ROCK Pathway and Response to Type I Interferon [abstract]. Arthritis Rheumatol. 2021, 73 (Suppl. S9), 1494. Available online: https://acrabstracts.org/abstract/functional-effects-of-a-lupus-associated-prkg1-variant-on-the-rhoa-rock-pathway-and-response-to-type-i-interferon/ (accessed on 21 November 2023).
- Zhang, Y.; Hu, L.; Li, X.; Chen, L.; Yang, X. Slit2 is a potential biomarker for renal impairment in systemic lupus erythematosus. Clin. Exp. Med. 2021, 21, 63–71. [Google Scholar] [CrossRef]
- Nicolaou, S.A.; Neumeier, L.; Takimoto, K.; Lee, S.M.; Duncan, H.J.; Kant, S.K.; Mongey, A.B.; Filipovich, A.H.; Conforti, L. Differential calcium signaling and Kv1.3 trafficking to the immunological synapse in systemic lupus erythematosus. Cell Calcium 2010, 47, 19–28. [Google Scholar] [CrossRef]
- Nandakumar, R.; Tschismarov, R.; Meissner, F.; Prabakaran, T.; Krissanaprasit, A.; Farahani, E.; Zhang, B.C.; Assil, S.; Martin, A.; Bertrams, W.; et al. Intracellular bacteria engage a STING-TBK1-MVB12b pathway to enable paracrine cGAS-STING signalling. Nat. Microbiol. 2019, 4, 701–713. [Google Scholar] [CrossRef]
- Torres-Ayuso, P.; An, E.; Nyswaner, K.M.; Bensen, R.C.; Ritt, D.A.; Specht, S.I.; Das, S.; Andresson, T.; Cachau, R.E.; Liang, R.J.; et al. TNIK Is a Therapeutic Target in Lung Squamous Cell Carcinoma and Regulates FAK Activation through Merlin. Cancer Discov. 2021, 11, 1411–1423. [Google Scholar] [CrossRef] [PubMed]
- Yu, L.; Zhao, Y.; Quan, C.; Ji, W.; Zhu, J.; Huang, Y.; Guan, R.; Sun, D.; Jin, Y.; Meng, X.; et al. Gemcitabine eliminates double minute chromosomes from human ovarian cancer cells. PLoS ONE 2013, 8, e71988. [Google Scholar] [CrossRef] [PubMed]


| Species | DNase Mutation | Control | Up-DPpGC | Percentage | p-Value |
|---|---|---|---|---|---|
| Mouse | KO1 | WT | WT | 15.38% | 0.2189 |
| Mouse | KO1 | WT | KO1 | 28.57% | 0.0730 |
| Mouse | KO1l3 | WT | WT | 0% | 0.6578 |
| Mouse | KO1l3 | WT | KO1l3 | 25.95% | 8.1695·10−9 |
| Human | DNASE1L3 | HC | KO1l3 | 20.97% | 5.298·10−11 |
| Gene | Rank of DPpGC | CFS | Mouse Chromosome |
|---|---|---|---|
| DAB1 | 2 | FRA1B | 4 |
| AUTS2 | 5 | FRA7J | 5 |
| SDK1 | 14 | FRA7B | 5 |
| CCSER1 | 15 | FRA4E | 6 |
| NRXN1 | 16 | FRA2D | 17 |
| FARP1 | 26 | FRA13D | 14 |
| AGO | 31 | FRA8D | 15 |
| DNAH | 45 | FRA6H | 17 |
| SLIT2 | 46 | FRA4D | 5 |
| CAMKMT | 48 | FRA2S | 17 |
| EXOC6B | 52 | FRA2E | 6 |
| FARP2 | 58 | FRA2J | 1 |
| GJA5 | 62 | FRA1F | 3 |
| EGFLAM | 63 | FRA5A | 15 |
| SGIP1 | 65 | FRA1L | 4 |
| ACOXL | 69 | FRA2B | 2 |
| NCAM1 | 70 | FRA11G | 9 |
| CLPB | 78 | FRA11H | 7 |
| ROR1 | 82 | FRA1L | 4 |
| FBXL17 | 84 | FRA5F | 17 |
| CPQ | 85 | FRA8B | 15 |
| INPP5A | 86 | FRA10A | 7 |
| F13A1 | 92 | FRA6B | 13 |
| CNTLN | 94 | FRA9G | 4 |
| PRDM16 | 100 | FRA1A | 4 |
| PCCA | 102 | FRA13D | 14 |
| TRAPPC9 | 106 | FRA8D | 15 |
| ELMO1 | 109 | FRA7C | 13 |
| PDE4B | 110 | FRA1L | 4 |
| THSD7B | 115 | FRA2F | 1 |
| TMEM132D | 118 | FRA12E | 5 |
| BACH2 | 119 | FRA6G | 4 |
| PARD3B | 126 | FRA21 | 1 |
| PRKG1 | 127 | FRA10C | 19 |
Disclaimer/Publisher’s Note: The statements, opinions and data contained in all publications are solely those of the individual author(s) and contributor(s) and not of MDPI and/or the editor(s). MDPI and/or the editor(s) disclaim responsibility for any injury to people or property resulting from any ideas, methods, instructions or products referred to in the content. |
© 2023 by the authors. Licensee MDPI, Basel, Switzerland. This article is an open access article distributed under the terms and conditions of the Creative Commons Attribution (CC BY) license (https://creativecommons.org/licenses/by/4.0/).
Share and Cite
Gerovska, D.; Fernández Moreno, P.; Zabala, A.; Araúzo-Bravo, M.J. Cell-Free Genic Extrachromosomal Circular DNA Profiles of DNase Knockouts Associated with Systemic Lupus Erythematosus and Relation with Common Fragile Sites. Biomedicines 2024, 12, 80. https://doi.org/10.3390/biomedicines12010080
Gerovska D, Fernández Moreno P, Zabala A, Araúzo-Bravo MJ. Cell-Free Genic Extrachromosomal Circular DNA Profiles of DNase Knockouts Associated with Systemic Lupus Erythematosus and Relation with Common Fragile Sites. Biomedicines. 2024; 12(1):80. https://doi.org/10.3390/biomedicines12010080
Chicago/Turabian StyleGerovska, Daniela, Patricia Fernández Moreno, Aitor Zabala, and Marcos J. Araúzo-Bravo. 2024. "Cell-Free Genic Extrachromosomal Circular DNA Profiles of DNase Knockouts Associated with Systemic Lupus Erythematosus and Relation with Common Fragile Sites" Biomedicines 12, no. 1: 80. https://doi.org/10.3390/biomedicines12010080
APA StyleGerovska, D., Fernández Moreno, P., Zabala, A., & Araúzo-Bravo, M. J. (2024). Cell-Free Genic Extrachromosomal Circular DNA Profiles of DNase Knockouts Associated with Systemic Lupus Erythematosus and Relation with Common Fragile Sites. Biomedicines, 12(1), 80. https://doi.org/10.3390/biomedicines12010080