
Amino Acid Profiling Identifies Disease-Specific Signatures in IgE-Mediated and Non-IgE-Mediated Food Allergy in Pediatric Patients with Atopic Dermatitis

 , , , , , ,
Abstract
1. Introduction
2. Materials and Methods
2.1. Patients and Sample Collection
2.2. Diagnosis of IgE-Mediated Food Allergy
2.3. Diagnosis of Non-IgE-Mediated Food Allergy
2.4. Sample Preparation for LC-MS/MS
2.5. LC-MS/MS
2.6. Data Analysis
3. Results
4. Discussion
5. Conclusions
Supplementary Materials
Author Contributions
Funding
Institutional Review Board Statement
Informed Consent Statement
Data Availability Statement
Acknowledgments
Conflicts of Interest
References
- Muraro, A. EAACI Food Allergy and Anaphylaxis Guidelines: Diagnosis and Management of food allergy. Allergy 2014, 69, 1008–1025. Available online: https://onlinelibrary.wiley.com/doi/full/10.1111/all.12429 (accessed on 8 March 2023). [CrossRef]
- Eigenmann, P.A.; Akdis, C.; Bousquet, J.; Grattan, C.E.; Hoffmann-Sommergruber, K.; Hellings, P.W.; Agache, I. Highlights and recent developments in food and drug allergy, and anaphylaxis in EAACI Journals (2017). Pediatr. Allergy Immunol. 2018, 29, 801–807. [Google Scholar] [CrossRef] [PubMed]
- Halken, S.; Muraro, A.; de Silva, D.; Khaleva, E.; Angier, E.; Arasi, S.; Arshad, H.; Bahnson, H.T.; Beyer, K.; Boyle, R.; et al. EAACI guideline: Preventing the development of food allergy in infants and young children (2020 update). Pediatr. Allergy Immunol. 2021, 32, 843–858. [Google Scholar] [CrossRef] [PubMed]
- Matricardi, P.M.; Kleine-Tebbe, J.; Hoffmann, H.J.; Valenta, R.; Hilger, C.; Hofmaier, S.; Aalberse, R.C.; Agache, I.; Asero, R.; Ballmer-Weber, B.; et al. EAACI Molecular Allergology User’s Guide. Pediatr. Allergy Immunol. 2016, 27 (Suppl. S23), 1–250. [Google Scholar] [CrossRef]
- Grimshaw, K.E.C.; Roberts, G.; Selby, A.; Reich, A.; Butiene, I.; Clausen, M.; Dubakiene, R.; Fiandor, A.; Fiocchi, A.; Grabenhenrich, L.B.; et al. Risk Factors for Hen’s Egg Allergy in Europe: EuroPrevall Birth Cohort. J. Allergy Clin. Immunol. Pract. 2020, 8, 1341–1348.e5. [Google Scholar] [CrossRef]
- Cartledge, N.; Chan, S. Atopic Dermatitis and Food Allergy: A Paediatric Approach. Curr. Pediatr. Rev. 2018, 14, 171–179. [Google Scholar] [CrossRef]
- Sicherer, S.H.; Sampson, H.A. Food allergy: A review and update on epidemiology, pathogenesis, diagnosis, prevention, and management. J. Allergy Clin. Immunol. 2018, 141, 41–58. [Google Scholar] [CrossRef]
- Packi, K.; Matysiak, J.; Klimczak, S.; Matuszewska, E.; Bręborowicz, A.; Pietkiewicz, D.; Matysiak, J. Analysis of the Serum Profile of Cytokines Involved in the T-Helper Cell Type 17 Immune Response Pathway in Atopic Children with Food Allergy. Int. J. Environ. Res. Public Health 2022, 19, 7877. [Google Scholar] [CrossRef]
- Sampson, H.A. Utility of food-specific IgE concentrations in predicting symptomatic food allergy. J. Allergy Clin. Immunol. 2001, 107, 891–896. [Google Scholar] [CrossRef]
- Szeinbach, S.L.; Barnes, J.H.; Sullivan, T.J.; Williams, P.B. Precision and accuracy of commercial laboratories’ ability to classify positive and/or negative allergen-specific IgE results. Ann. Allergy Asthma Immunol. 2001, 86, 373–381. [Google Scholar] [CrossRef] [PubMed]
- Meng, S.; Tan, Y.; Chang, S.; Li, J.; Maleki, S.; Puppala, N. Peanut allergen reduction and functional property improvement by means of enzymatic hydrolysis and transglutaminase crosslinking. Food Chem. 2020, 302, 125186. [Google Scholar] [CrossRef]
- Sampson, H.A.; Albergo, R. Comparison of Results of Skin Tests, RAST, and Double-Blind, Placebo-Controlled Food Challenges in Children with Atopic Dermatitis. J. Allergy Clin. Immunol. 1984, 74, 26–33. [Google Scholar] [CrossRef] [PubMed]
- LaHood, N.A.; Patil, S.U. Food Allergy Testing. Clin. Lab. Med. 2019, 39, 625–642. [Google Scholar] [CrossRef] [PubMed]
- Ito, K.; Urisu, A. Diagnosis of Food Allergy Based on Oral Food Challenge Test. Allergol. Int. 2009, 58, 467–474. [Google Scholar] [CrossRef] [PubMed]
- Calamelli, E.; Liotti, L.; Beghetti, I.; Piccinno, V.; Serra, L.; Bottau, P. Component-Resolved Diagnosis in Food Allergies. Medicina 2019, 55, 498. [Google Scholar] [CrossRef]
- Lidholm, J.; Ballmer-Weber, B.K.; Mari, A.; Vieths, S. Component-resolved diagnostics in food allergy. Curr. Opin. Allergy Clin. Immunol. 2006, 6, 234–240. [Google Scholar] [CrossRef]
- Valenta, R.; Lidholm, J.; Niederberger, V.; Hayek, B.; Kraft, D.; Grönlund, H. The recombinant allergen-based concept of component-resolved diagnostics and immunotherapy (CRD and CRIT). Clin. Exp. Allergy 1999, 29, 896–904. [Google Scholar] [CrossRef]
- Martelli, A.; Calvani, M.; Foiadelli, T.; Tosca, M.; Pingitore, G.; Licari, A.; Marseglia, A.; Ciprandi, G.; Caffarelli, C. Component resolved diagnosis and risk assessment in food allergy. Acta Biomed. 2021, 92, e2021528. [Google Scholar] [CrossRef]
- Diéguez, M.C.; Cerecedo, I.; Muriel, A.; Zamora, J.; Abraira, V.; Camacho, E.; Antón, M.; de la Hoz, B. Utility of Diagnostic Tests in the Follow-Up of Egg-Allergic Children. Clin. Exp. Allergy 2009, 39, 1575–1584. [Google Scholar] [CrossRef]
- Amarasekera, M. Immunoglobulin E in health and disease. Asia Pac. Allergy 2011, 1, 12. [Google Scholar] [CrossRef]
- Matysiak, J.; Klupczynska, A.; Packi, K.; Mackowiak-Jakubowska, A.; Bręborowicz, A.; Pawlicka, O.; Olejniczak, K.; Kokot, Z.J.; Matysiak, J. Alterations in Serum-Free Amino Acid Profiles in Childhood Asthma. Int. J. Environ. Res. Public Health 2020, 17, 4758. [Google Scholar] [CrossRef] [PubMed]
- Matysiak, J.; Dereziński, P.; Klupczyńska, A.; Matysiak, J.; Kaczmarek, E.; Kokot, Z.J. Effects of a Honeybee Sting on the Serum Free Amino Acid Profile in Humans. PLoS ONE 2014, 9, e103533. [Google Scholar] [CrossRef] [PubMed]
- Dettmer, K.; Hammock, B. Metabolomics—A new exciting field within the “omics” sciences. Environ. Health Perspect. 2004, 112, A396–A397. [Google Scholar] [CrossRef] [PubMed]
- Schuhmacher, R.; Krska, R.; Weckwerth, W.; Goodacre, R. Metabolomics and metabolite profiling. Anal. Bioanal. Chem. 2013, 405, 5003–5004. [Google Scholar] [CrossRef] [PubMed]
- Sun, J.; Charron, C.S.; Novotny, J.A.; Peng, B.; Yu, L.; Chen, P. Profiling glucosinolate metabolites in human urine and plasma after broccoli consumption using non-targeted and targeted metabolomic analyses. Food Chem. 2020, 309, 125660. [Google Scholar] [CrossRef]
- Massey, K.A.; Blakeslee, C.H.; Pitkow, H.S. A Review of Physiological and Metabolic Effects of Essential Amino Acids. Amino Acids 1998, 14, 271–300. [Google Scholar] [CrossRef]
- Budhathoki, S.; Iwasaki, M.; Yamaji, T.; Yamamoto, H.; Kato, Y.; Tsugane, S. Association of plasma concentrations of branched-chain amino acids with risk of colorectal adenoma in a large Japanese population. Ann. Oncol. 2017, 28, 818–823. [Google Scholar] [CrossRef]
- Hasim, A.; Aili, A.; Maimaiti, A.; Mamtimin, B.; Abudula, A.; Upur, H. Plasma-free amino acid profiling of cervical cancer and cervical intraepithelial neoplasia patients and its application for early detection. Mol. Biol. Rep. 2013, 40, 5853–5859. [Google Scholar] [CrossRef]
- Amino Acid Metabolism is Altered in Adolescents with Nonalcoholic Fatty Liver Disease—An Untargeted, High Resolution Metabolomics Study—Abstract—Europe PMC. Available online: https://europepmc.org/article/med/26858195 (accessed on 3 January 2020).
- Takashina, C.; Tsujino, I.; Watanabe, T.; Sakaue, S.; Ikeda, D.; Yamada, A.; Sato, T.; Ohira, H.; Otsuka, Y.; Oyama-Manabe, N.; et al. Associations among the plasma amino acid profile, obesity, and glucose metabolism in Japanese adults with normal glucose tolerance. Nutr. Metab. 2016, 13, 5. [Google Scholar] [CrossRef]
- Gao, X.; Zhang, W.; Wang, Y.; Pedram, P.; Cahill, F.; Zhai, G.; Randell, E.; Gulliver, W.; Sun, G. Serum metabolic biomarkers distinguish metabolically healthy peripherally obese from unhealthy centrally obese individuals. Nutr. Metab. 2016, 13, 33. [Google Scholar] [CrossRef]
- Sawy, M.E.; Zaki, M.M.; EL-Hakim, I.Z.; Mowafy, M.E.; Al-Abd, H.S. Serum amino acid abnormalities in pediatric patients with chronic renal failure with and without history of thromboembolic manifestations. Egypt. J. Med. Hum. Genet. 2012, 13, 73–80. [Google Scholar] [CrossRef]
- Fadel, F.I.; Elshamaa, M.F.; Essam, R.G.; Elghoroury, E.A.; El-Saeed, G.S.M.; El-Toukhy, S.E.; Ibrahim, M.H. Some Amino Acids Levels: Glutamine, Glutamate, and Homocysteine, in Plasma of Children with Chronic Kidney Disease. Int. J. Biomed. Sci. 2014, 10, 36–42. [Google Scholar] [PubMed]
- Cheng, F.; Wang, Z.; Huang, Y.; Duan, Y.; Wang, X. Investigation of salivary free amino acid profile for early diagnosis of breast cancer with ultra performance liquid chromatography-mass spectrometry. Clin. Chim. Acta 2015, 447, 23–31. [Google Scholar] [CrossRef] [PubMed]
- Klupczynska, A.; Swiatly, A.; Hajduk, J.; Matysiak, J.; Dyszkiewicz, W.; Pawlak, K.; Kokot, Z.J. Identification of Serum Peptidome Signatures of Non-Small Cell Lung Cancer. Int. J. Mol. Sci. 2016, 17, 410. [Google Scholar] [CrossRef] [PubMed]
- Matysiak, J.; Dereziński, P.; Klupczyńska, A.; Hajduk, J.P.; Swiatly, A.; Plewa, S.; Horała, A.; Jaźwiński, P.; Banach, P.; Nowak-Markwitz, E.; et al. Proteomic and metabolomic strategy of searching for biomarkers of genital cancer diseases using mass spectrometry methods. J. Med. Sci. 2016, 85, 330–333. [Google Scholar] [CrossRef]
- Mendonça, R.B.; Franco, J.M.; Cocco, R.R.; Suano de Souza, F.I.; Lopes de Oliveira, L.C.; Saccardo Sarni, R.O.; Solé, D. Open oral food challenge in the confirmation of cow’s milk allergy mediated by immunoglobulin E. Allergol. Immunopathol. 2012, 40, 25–30. [Google Scholar] [CrossRef]
- Work Group Report: Oral Food Challenge Testing—Of Allergy and Clinical Immunology. Available online: https://www.jacionline.org/article/S0091-6749(09)00562-4/fulltext (accessed on 13 April 2023).
- Bindslev-Jensen, C. Standardization of food challenges in patients with immediate reactions to foods—Position paper from the European Academy of Allergology and Clinical Immunology. Allergy 2004, 59, 690–697. Available online: https://onlinelibrary.wiley.com/doi/10.1111/j.1398-9995.2004.00466.x (accessed on 13 April 2023). [CrossRef]
- Calvani, M.; Bianchi, A.; Reginelli, C.; Peresso, M.; Testa, A. Oral Food Challenge. Medicina 2019, 55, 651. [Google Scholar] [CrossRef]
- Held, P.K.; White, L.; Pasquali, M. Quantitative urine amino acid analysis using liquid chromatography tandem mass spectrometry and aTRAQ reagents. J. Chromatogr. B Anal. Technol. Biomed. Life Sci. 2011, 879, 2695–2703. [Google Scholar] [CrossRef]
- Filee, R.; Schoos, R.; Boemer, F. Evaluation of physiological amino acids profiling by tandem mass spectrometry. JIMD Rep. 2014, 13, 119–128. [Google Scholar] [CrossRef]
- Morris, C.R.; Poljakovic, M.; Lavrisha, L.; Machado, L.; Kuypers, F.A.; Morris, S.M. Decreased arginine bioavailability and increased serum arginase activity in asthma. Am. J. Respir. Crit. Care Med. 2004, 170, 148–153. [Google Scholar] [CrossRef]
- Simon, A.K.; Hollander, G.A.; McMichael, A. Evolution of the Immune System in Humans from Infancy to Old Age. Proc. Biol. Sci. 2015, 282, 20143085. [Google Scholar] [CrossRef] [PubMed]
- Morris, C.R. Arginine and asthma. Nestle Nutr. Inst. Workshop Ser. 2013, 77, 1–15. [Google Scholar] [CrossRef] [PubMed]
- Kelly, R.S.; McGeachie, M.J.; Lee-Sarwar, K.A.; Kachroo, P.; Chu, S.H.; Virkud, Y.V.; Huang, M.; Litonjua, A.A.; Weiss, S.T.; Lasky-Su, J. Partial Least Squares Discriminant Analysis and Bayesian Networks for Metabolomic Prediction of Childhood Asthma. Metabolites 2018, 8, 68. [Google Scholar] [CrossRef] [PubMed]
- Mostad, A.; Natarajan, S. Crystal and Molecular Structure of Sarcosine. Acta Chem. Scand. 1989, 43, 1004–1006. [Google Scholar] [CrossRef]
- Pietzke, M.; Meiser, J.; Vazquez, A. Formate Metabolism in Health and Disease. Mol. Metab. 2020, 33, 23–37. [Google Scholar] [CrossRef]
- Sreekumar, A.; Poisson, L.M.; Rajendiran, T.M.; Khan, A.P.; Cao, Q.; Yu, J.; Laxman, B.; Mehra, R.; Lonigro, R.J.; Li, Y.; et al. Metabolomic profiles delineate potential role for sarcosine in prostate cancer progression. Nature 2009, 457, 910–914. [Google Scholar] [CrossRef]
- Rothenberg, M.E.; Spergel, J.M.; Sherrill, J.D.; Annaiah, K.; Martin, L.J.; Cianferoni, A.; Gober, L.; Kim, C.; Glessner, J.; Frackelton, E.; et al. Common variants at 5q22 associate with pediatric eosinophilic esophagitis. Nat. Genet. 2010, 42, 289–291. [Google Scholar] [CrossRef]
- O’Shea, K.M.; Aceves, S.S.; Dellon, E.S.; Gupta, S.K.; Spergel, J.M.; Furuta, G.T.; Rothenberg, M.E. Pathophysiology of Eosinophilic Esophagitis. Gastroenterology 2018, 154, 333–345. [Google Scholar] [CrossRef]
- Spergel, J.M. An allergist’s perspective to the evaluation of Eosinophilic Esophagitis. Best Pract. Res. Clin. Gastroenterol. 2015, 29, 771–781. [Google Scholar] [CrossRef]
- Chung, S.-Y.; Reed, S. Effect of D-Amino Acids On IgE Binding to Peanut Allergens. J. Allergy Clin. Immunol. 2013, 131, AB20. [Google Scholar] [CrossRef]
- Deus-de-Oliveira, N.; Felix, S.P.; Carrielo-Gama, C.; Fernandes, K.V.; DaMatta, R.A.; Machado, O.L.T. Identification of Critical Amino Acids in the IgE Epitopes of Ric c 1 and Ric c 3 and the Application of Glutamic Acid as an IgE Blocker. PLoS ONE 2011, 6, e21455. [Google Scholar] [CrossRef] [PubMed]
- Jaisson, S.; Gorisse, L.; Pietrement, C.; Gillery, P. Quantification of Plasma Homocitrulline Using Hydrophilic Interaction Liquid Chromatography (HILIC) Coupled to Tandem Mass Spectrometry. Anal. Bioanal. Chem. 2012, 402, 1635–1641. [Google Scholar] [CrossRef]
- Jaisson, S.; Desmons, A.; Doué, M.; Gorisse, L.; Pietrement, C.; Gillery, P. Measurement of Homocitrulline, A Carbamylation-derived Product, in Serum and Tissues by LC-MS/MS. Curr. Protoc. Protein Sci. 2018, 92, e56. [Google Scholar] [CrossRef] [PubMed]
- Desmons, A.; Jaisson, S.; Pietrement, C.; Rieu, P.; Wynckel, A.; Gillery, P. Homocitrulline: A new marker for differentiating acute from chronic renal failure. Clin. Chem. Lab. Med. CCLM/FESCC 2015, 54, 73–79. [Google Scholar] [CrossRef] [PubMed]
- Eklundh, T.; Eriksson, M.; Sjöberg, S.; Nordin, C. Monoamine precursors, transmitters and metabolites in cerebrospinal fluid: A prospective study in healthy male subjects. J. Psychiatr. Res. 1996, 30, 201–208. [Google Scholar] [CrossRef] [PubMed]
- La, C. Plasma amino acid levels with a note on membrane transport: Characteristics, regulation, and metabolic significance. Nutrition 2002, 18, 761–766. [Google Scholar] [CrossRef]
- Lj, G.; Cs, R.; Jk, R.; Na, T. Tyrosine Phosphorylation as a Widespread Regulatory Mechanism in Prokaryotes. J. Bacteriol. 2019, 201, e00205-19. [Google Scholar] [CrossRef]
- Sun, Y.; Yang, Y.; Zhao, Y.; Li, X.; Zhang, Y.; Liu, Z. The Role of the Tyrosine Kinase Lyn in Allergy and Cancer. Mol. Immunol. 2021, 131, 121–126. [Google Scholar] [CrossRef]
- Qian, F.; Zhang, L.; Lu, S.; Mao, G.; Guo, F.; Liu, P.; Xu, J.; Li, Y. Scrodentoid A Inhibits Mast Cell–Mediated Allergic Response by Blocking the Lyn–FcεRIβ Interaction. Front. Immunol. 2019, 10, 1103. Available online: https://www.frontiersin.org/articles/10.3389/fimmu.2019.01103 (accessed on 19 March 2023). [CrossRef]
- Bugajev, V.; Bambousková, M.; Dráberová, L.; Dráber, P. What precedes the initial tyrosine phosphorylation of the high affinity IgE receptor in antigen-activated mast cell? FEBS Lett. 2010, 584, 4949–4955. [Google Scholar] [CrossRef] [PubMed]
- Odom, S.; Gomez, G.; Kovarova, M.; Furumoto, Y.; Ryan, J.J.; Wright, H.V.; Gonzalez-Espinosa, C.; Hibbs, M.L.; Harder, K.W.; Rivera, J. Negative Regulation of Immunoglobulin E–dependent Allergic Responses by Lyn Kinase. J. Exp. Med. 2004, 199, 1491–1502. [Google Scholar] [CrossRef] [PubMed]
- Zhu, Y.; Bertics, P.J. Chemoattractant-Induced Signaling via the Ras-ERK and PI3K-Akt Networks, along with Leukotriene C4 Release, Is Dependent on the Tyrosine Kinase Lyn in IL-5- and IL-3-Primed Human Blood Eosinophils. J. Immunol. 2011, 186, 516–526. [Google Scholar] [CrossRef] [PubMed]
- Lyn Regulates Mucus Secretion and MUC5AC via the STAT6 Signaling Pathway during Allergic Airway Inflammation|Scientific Reports. Available online: https://www.nature.com/articles/srep42675 (accessed on 20 March 2023).
- Wypych, T.P.; Pattaroni, C.; Perdijk, O.; Yap, C.; Trompette, A.; Anderson, D.; Creek, D.J.; Harris, N.L.; Marsland, B.J. Microbial metabolism of l-tyrosine protects against allergic airway inflammation. Nat. Immunol. 2021, 22, 279–286. [Google Scholar] [CrossRef] [PubMed]
- Baldrick, P.; Richardson, D.; Wheeler, A.W. Review of L-tyrosine confirming its safe human use as an adjuvant. J. Appl. Toxicol. 2002, 22, 333–344. [Google Scholar] [CrossRef]
- Wheeler, A.W.; Moran, D.M.; Robins, B.E.; Driscoll, A. l-Tyrosine as an immunological adjuvant. Int. Arch. Allergy Appl. Immunol. 1982, 69, 113–119. [Google Scholar] [CrossRef]
- Breiteneder, H. Biomarkers for Diagnosis and Prediction of Therapy Responses in Allergic Diseases and Asthma. Allergy 2020, 75, 3039–3068. Available online: https://onlinelibrary.wiley.com/doi/full/10.1111/all.14582 (accessed on 22 March 2023). [CrossRef]
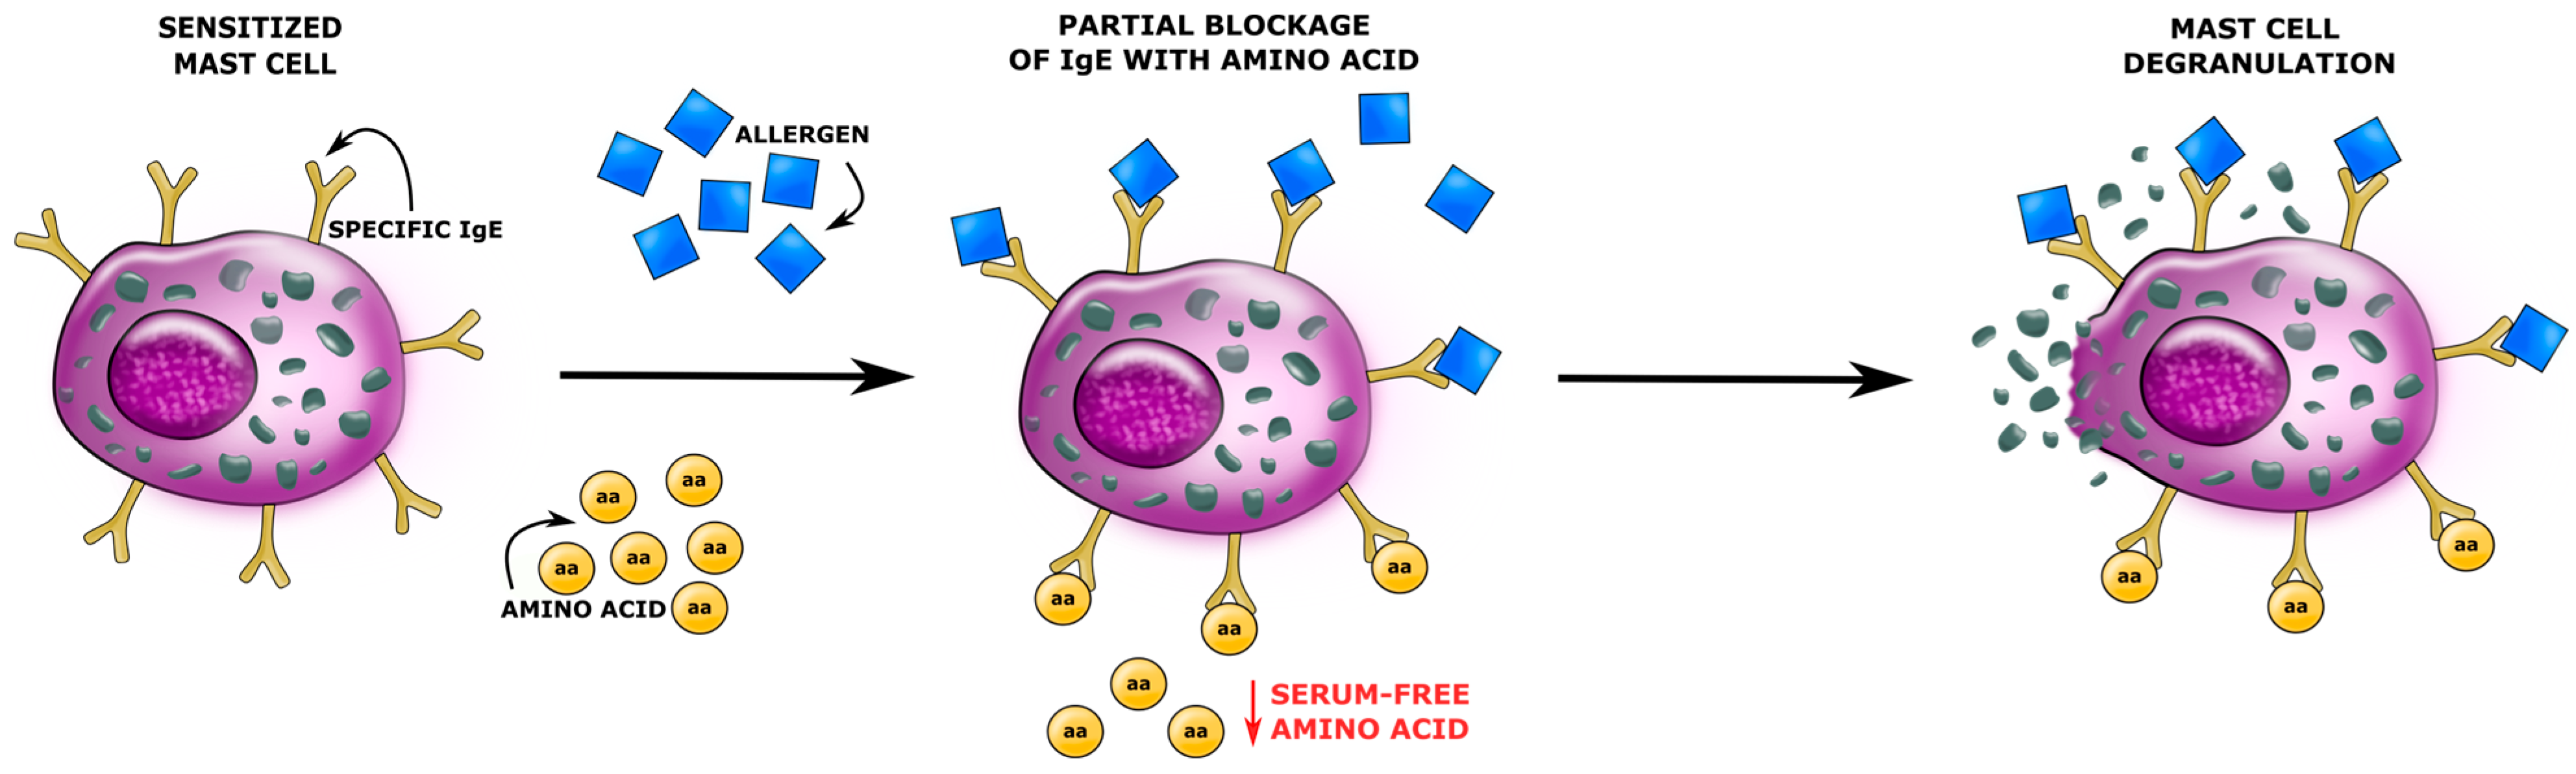
- Mendoza, R.P.; Anderson, C.C.; Fudge, D.H.; Roede, J.R.; Brown, J.M. Metabolic Consequences of IgE- and Non-IgE–Mediated Mast Cell Degranulation. J. Immunol. 2021, 207, 2637–2648. [Google Scholar] [CrossRef]
- Kumar, M.; Duraisamy, K.; Chow, B.-K.-C. Unlocking the Non-IgE-Mediated Pseudo-Allergic Reaction Puzzle with Mas-Related G-Protein Coupled Receptor Member X2 (MRGPRX2). Cells 2021, 10, 1033. [Google Scholar] [CrossRef]
- Babina, M.; Guhl, S.; Artuc, M.; Zuberbier, T. Allergic FcεRI- and Pseudo-Allergic MRGPRX2-Triggered Mast Cell Activation Routes are Independent and Inversely Regulated by SCF. Allergy 2018, 73, 256–260. [Google Scholar] [CrossRef]
- Redegeld, F.A.; Yu, Y.; Kumari, S.; Charles, N.; Blank, U. Non-IgE mediated mast cell activation. Immunol. Rev. 2018, 282, 87–113. [Google Scholar] [CrossRef] [PubMed]
- Yuan, F.; Zhang, C.; Sun, M.; Wu, D.; Cheng, L.; Pan, B.; Li, T.; Che, D. MRGPRX2 mediates immediate-type pseudo-allergic reactions induced by iodine-containing iohexol. Biomed. Pharmacother. 2021, 137, 111323. [Google Scholar] [CrossRef] [PubMed]


| Characteristics of Participants | IgE-Mediated Food Allergy | Non-IgE-Mediated Food Allergy | Control Group Lack of Food Allergy |
|---|---|---|---|
| No. of subjects | 36 | 15 | 25 |
| Sex | |||
| Male | 19 | 11 | 14 |
| Female | 17 | 4 | 11 |
| Age (months) | |||
| Median | 23.5 | 12 | 20.5 |
| Mean | 25.81 | 13.2 | 26.6 |
| Range | 6–60 | 6–36 | 2–60 |
| Eczema (for the last 1.5 months or more) | 36 | 15 | 25 |
| Patient age on the onset of eczema (months) | |||
| Median | 3 | 3 | 4 |
| Mean | 4.4 | 3.73 | 8.9 |
| Range | 1–24 | 1–10 | 2–36 |
| Atopic dermatitis (L20) | 36 | 15 | 25 |
| Allergic urticaria (L50) | 8 | 0 | 2 |
| Angiodema (T78.3) | 5 | 0 | 0 |
| Anaphylactic shock (T78.0) | 5 | 0 | 0 |
| Chronic symptoms of the digestive system | Abdominal pain, abdominal gas, diarrhea, Constipation, mucus in the stool | Colic, abdominal pain, abdominal gas, vomiting, downpouring, diarrhea, constipation, mucus in the stool | Diarrhea |
| Early childhood asthma | 5 | 2 | 1 |
| Allergic rhinitis | 13 | 4 | 3 |
| Amino Acid | Abbreviation | LOQ (µM) | IgE-Mediated Allergy Group | Non-IgE-Mediated Allergy Group | Control Group | ||||||
|---|---|---|---|---|---|---|---|---|---|---|---|
| Median | Mean | SD | Median | Mean | SD | Median | Mean | SD | |||
| 1-Methyl-L-histidine | 1MHis | 0.2 | 9.46 | 13.5 | 11.61 | 12.26 | 14.00 | 6.10 | 12.04 | 18.36 | 14.62 |
| 3-Methyl-L-histidine | 3MHis | 0.2 | 3.18 | 6.02 | 10.05 | 3.25 | 5.60 | 5.64 | 3.82 | 9.18 | 11.83 |
| L-α-Aminoadipic acid | Aad | 0.2 | 1.49 | 1.56 | 0.79 | 1.89 | 1.94 | 0.67 | 1.50 | 1.83 | 1.16 |
| L-α-Amino-n-butyric acid | Abu | 0.5 | 23.24 | 23.96 | 10.58 | 26.24 | 28.41 | 12.54 | 27.93 | 26.87 | 11.26 |
| L-Alanine | Ala | 0.2 | 487.33 | 497.88 | 120.79 | 476.24 | 484.16 | 67.99 | 497.42 | 507.48 | 116.11 |
| L-Arginine | Arg | 0.5 | 157.53 | 154.46 | 45.08 | 136.8 | 153.96 | 73.77 | 155.37 | 162.25 | 53.65 |
| L-Asparagine | Asn | 0.5 | 86.22 | 101.36 | 38.85 | 88.53 | 91.12 | 23.65 | 101.24 | 101.98 | 35.99 |
| L-Aspartic acid | Asp | 0.1 | 40.36 | 40.82 | 13.01 | 34.26 | 33.43 | 9.54 | 31.55 | 34.53 | 10.39 |
| D,L-β-Aminoisobutyric acid | bAib | 0.2 | 2.60 | 3.23 | 2.14 | 2.24 | 2.80 | 1.48 | 3.00 | 3.16 | 1.26 |
| β-Alanine | bAla | 0.5 | 13.85 | 21.16 | 28.11 | 14.97 | 16.38 | 5.96 | 15.42 | 19.41 | 9.10 |
| L-Citrulline | Cit | 0.5 | 26.31 | 25.30 | 8.18 | 23.82 | 25.68 | 10.12 | 27.17 | 28.24 | 6.69 |
| Ethanolamine | EtN | 0.5 | 12.67 | 13.38 | 3.92 | 13.04 | 13.70 | 3.51 | 11.34 | 11.55 | 2.73 |
| ƴ-Amino-n-butyric acid | GABA | 0.05 | 5.45 | 5.56 | 3.75 | 0.79 | 4.00 | 5.33 | 5.40 | 4.43 | 2.85 |
| L-Glutamine | Gln | 0.5 | 823.58 | 819.94 | 171.82 | 735.97 | 770.05 | 133.73 | 836.35 | 803.581 | 117.63 |
| L-Glutamic acid | Glu | 0.5 | 112.96 | 117.53 | 43.51 | 123.11 | 133.74 | 33.99 | 109.08 | 110.42 | 37.23 |
| Glycine | Gly | 1 | 277.38 | 276.23 | 57.56 | 265.30 | 272.11 | 45.32 | 277.75 | 279.73 | 63.14 |
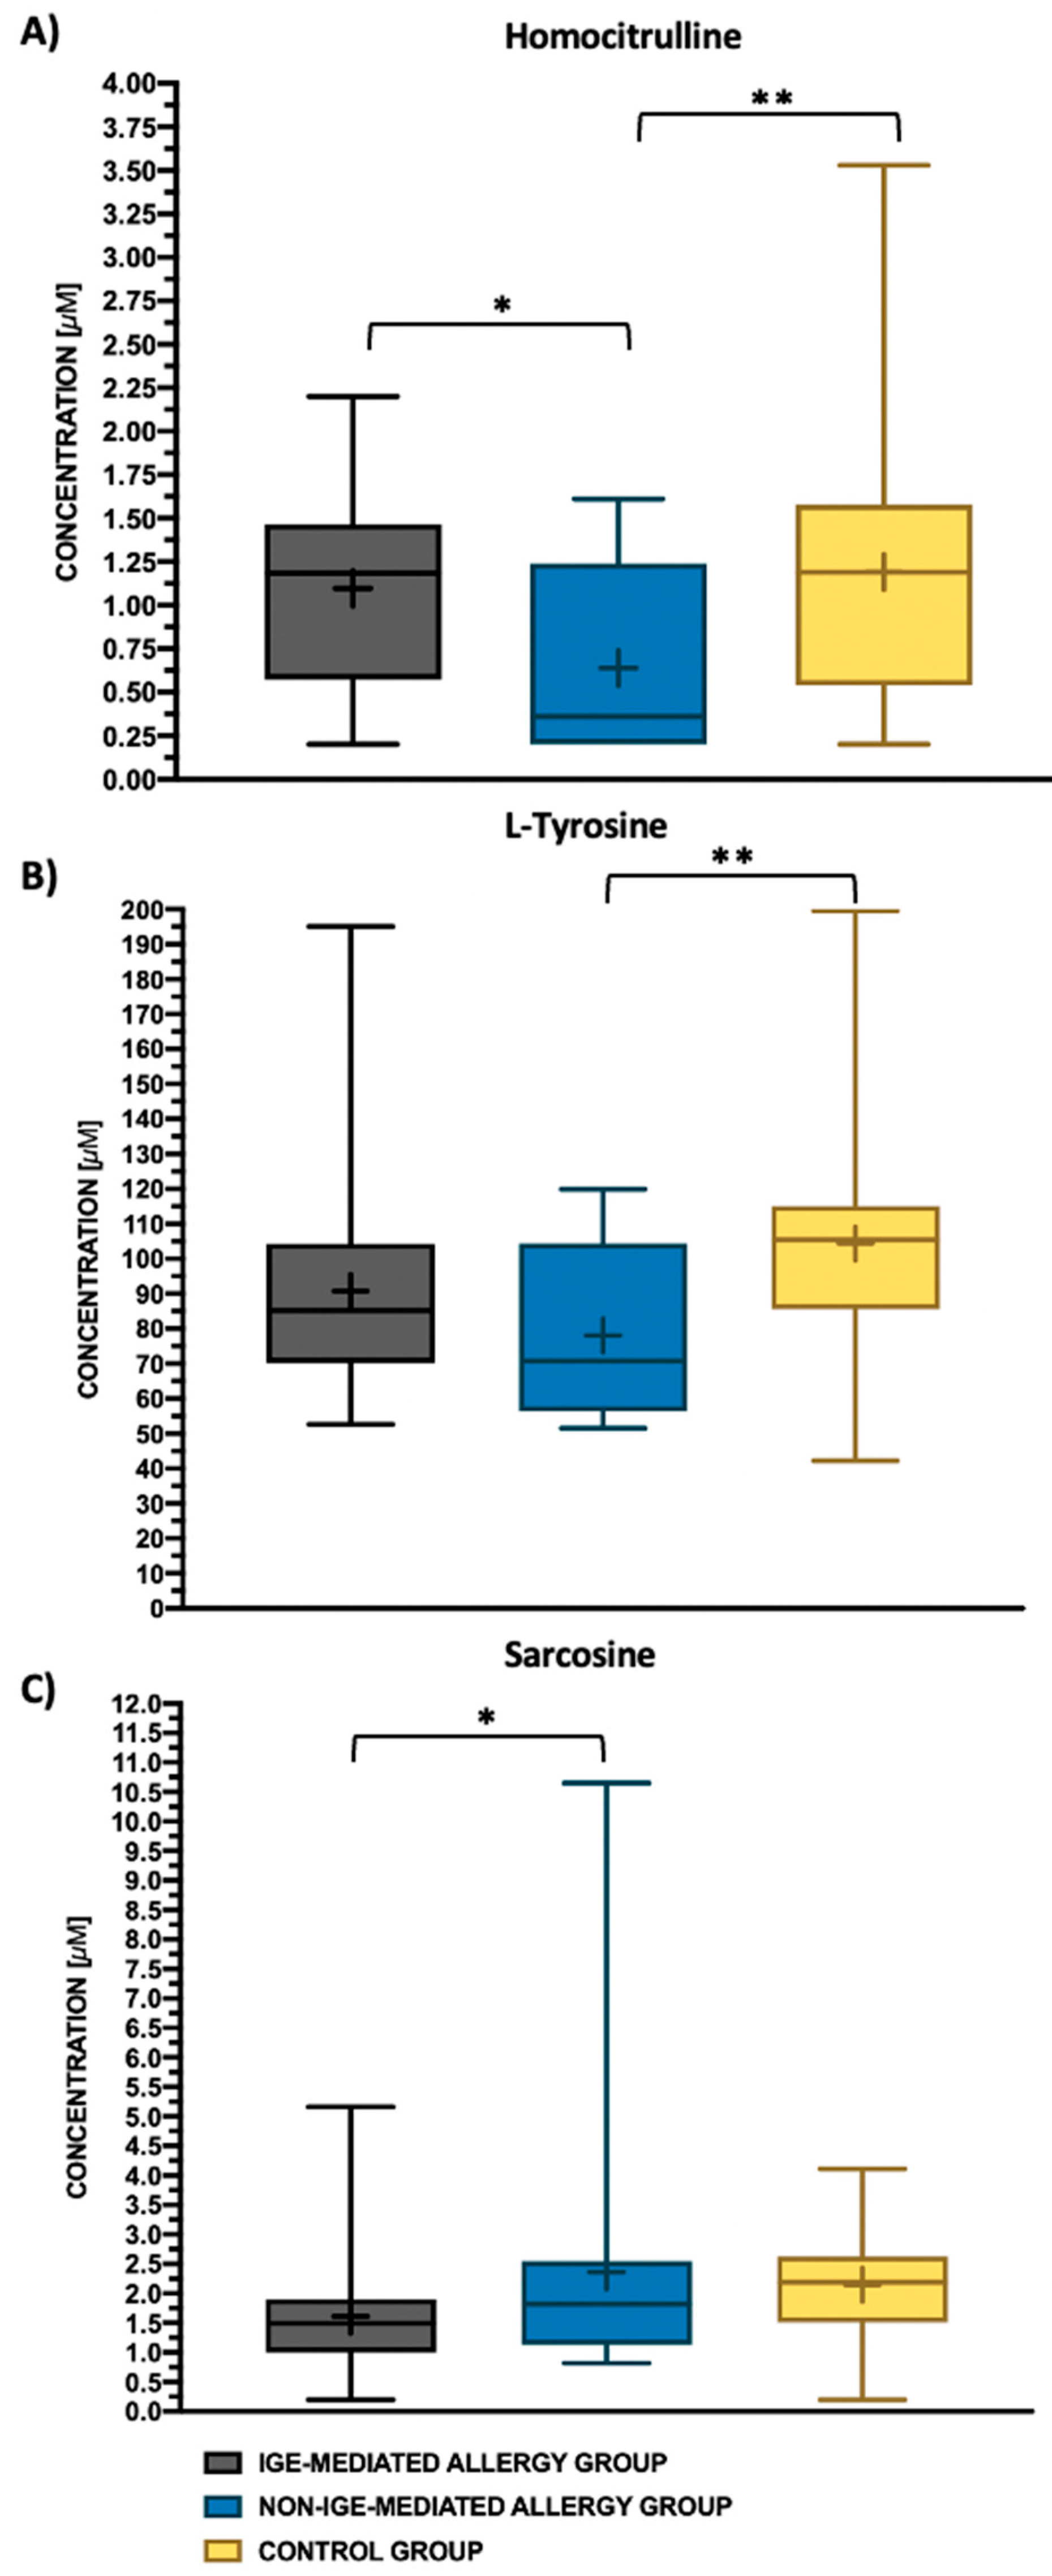
| Homocitrulline | Hcit | 0.2 | 1.19 | 1.1 | 0.53 | 0.36 | 0.64 | 0.53 | 1.19 | 1.19 | 0.77 |
| L-Histidine | His | 0.5 | 96.55 | 106.09 | 40.76 | 94.54 | 94.33 | 17.55 | 105.72 | 103.56 | 16.48 |
| Hydroxylysine | Hyl | 0.5 | 0.96 | 1.15 | 0.70 | 1.09 | 1.13 | 0.46 | 0.92 | 1.29 | 1.18 |
| Hydroxy-L-proline | Hyp | 0.2 | 25.45 | 26.40 | 10.04 | 25.62 | 26.69 | 7.39 | 22.19 | 24.15 | 9.52 |
| L-Isoleucine | Ile | 0.5 | 102.42 | 110.53 | 42.02 | 127.557 | 118.11 | 41.52 | 122.50 | 125.71 | 40.37 |
| L-Leucine | Leu | 0.5 | 198.07 | 199.62 | 59.31 | 214.98 | 210.65 | 66.75 | 220.49 | 216.18 | 65.80 |
| L-Lysine | Lys | 0.5 | 208.09 | 218.25 | 70.54 | 234.984 | 217.26 | 53.03 | 235.83 | 224.13 | 61.29 |
| L-Methionine | Met | 0.1 | 34.51 | 37.48 | 16.79 | 31.86 | 37.72 | 15.53 | 44.99 | 44.68 | 13.73 |
| L-Ornithine | Orn | 0.5 | 114.21 | 119.10 | 35.27 | 102.20 | 118.19 | 39.01 | 124.23 | 123.74 | 32.020 |
| L-Phenylanalanine | Phe | 0.2 | 91.55 | 99.06 | 27.31 | 83.36 | 93.78 | 35.79 | 101.94 | 101.26 | 22.16 |
| L-Proline | Pro | 0.1 | 246.17 | 252.72 | 69.94 | 227.47 | 235.48 | 89.611 | 259.45 | 287.29 | 110.31 |
| Sarcosine | Sar | 0.2 | 1.49 | 1.61 | 0.96 | 1.82 | 2.36 | 2.4 | 2.19 | 2.15 | 0.91 |
| L-Serine | Ser | 0.5 | 250.01 | 252.10 | 52.2 | 237.09 | 235.39 | 36.63 | 238.32 | 245.41 | 47.09 |
| Taurine | Tau | 0.5 | 141.24 | 152.48 | 41.63 | 164.857 | 160.52 | 37.57 | 145.79 | 140.60 | 37.55 |
| L-Threonine | Thr | 0.2 | 134.50 | 150.37 | 55.3 | 175.23 | 166.32 | 46.35 | 157.40 | 157.43 | 44.36 |
| L-Tryptophan | Trp | 0.1 | 56.80 | 63.70 | 18.40 | 69.25 | 68.24 | 13.39 | 64.28 | 66.37 | 15.30 |
| L-Tyrosine | Tyr | 0.5 | 85.24 | 90.78 | 29.16 | 70.75 | 78.09 | 23.87 | 105.38 | 104.34 | 34.49 |
| L-Valine | Val | 0.2 | 285.72 | 293.78 | 88.58 | 289.63 | 307.93 | 92.19 | 308.02 | 327.97 | 86.57 |
| Amino Acid | Abbreviation | p-Value | |
|---|---|---|---|
| ANOVA Kruskal–Wallis Test | ANOVA Test | ||
| 1-Methyl-L-histidine | 1MHis | 0.160 | |
| 3-Methyl-L-histidine | 3MHis | 0.159 | |
| L-α-Aminoadipic acid | Aad | 0.125 | |
| L-α-Amino-n-butyric acid | Abu | 0.503 | |
| L-Alanine | Ala | 0.885 | |
| L-Arginine | Arg | 0.615 | |
| L-Asparagine | Asn | 0.746 | |
| L-Aspartic acid | Asp | 0.108 | |
| D,L-β-Aminoisobutyric acid | bAib | 0.564 | |
| β-Alanine | bAla | 0.417 | |
| L-Citrulline | Cit | 0.232 | |
| Ethanolamine | EtN | 0.061 | |
| ƴ-Amino-n-butyric acid | GABA | 0.232 | |
| L-Glutamine | Gln | 0.534 | |
| L-Glutamic acid | Glu | 0.156 | |
| Glycine | Gly | 0.967 | |
| Homocitrulline | Hcit | 0.026 | |
| L-Histidine | His | 0.303 | |
| Hydroxylysine | Hyl | 0.647 | |
| Hydroxy-L-proline | Hyp | 0.331 | |
| L-Isoleucine | Ile | 0.262 | |
| L-Leucine | Leu | 0.565 | |
| L-Lysine | Lys | 0.727 | |
| L-Methionine | Met | 0.05 | |
| L-Ornithine | Orn | 0.634 | |
| L-Phenylanalanine | Phe | 0.402 | |
| L-Proline | Pro | 0.277 | |
| Sarcosine | Sar | 0.024 | |
| L-Serine | Ser | 0.618 | |
| Taurine | Tau | 0.200 | |
| L-Threonine | Thr | 0.326 | |
| L-Tryptophan | Trp | 0.330 | |
| L-Tyrosine | Tyr | 0.018 | |
| L-Valine | Val | 0.246 | |
| Amino Acid | IgE-Mediated Food Allergy | Non-IgE-Mediated Food Allergy | ||
|---|---|---|---|---|
| AUC (95%CI) | p-Value | AUC (95%CI) | p-Value | |
| Sarcosine | 0.67 | 0.01 | 0.53 | 0.73 |
| Homocitrulline | 0.58 | 0.26 | 0.73 | 0.01 |
| L-tyrosine | 0.54 | 0.53 | 0.68 | 0.03 |
Disclaimer/Publisher’s Note: The statements, opinions and data contained in all publications are solely those of the individual author(s) and contributor(s) and not of MDPI and/or the editor(s). MDPI and/or the editor(s) disclaim responsibility for any injury to people or property resulting from any ideas, methods, instructions or products referred to in the content. |
© 2023 by the authors. Licensee MDPI, Basel, Switzerland. This article is an open access article distributed under the terms and conditions of the Creative Commons Attribution (CC BY) license (https://creativecommons.org/licenses/by/4.0/).
Share and Cite
Packi, K.; Matysiak, J.; Plewa, S.; Klupczyńska-Gabryszak, A.; Matuszewska, E.; Rzetecka, N.; Bręborowicz, A.; Matysiak, J. Amino Acid Profiling Identifies Disease-Specific Signatures in IgE-Mediated and Non-IgE-Mediated Food Allergy in Pediatric Patients with Atopic Dermatitis. Biomedicines 2023, 11, 1919. https://doi.org/10.3390/biomedicines11071919
Packi K, Matysiak J, Plewa S, Klupczyńska-Gabryszak A, Matuszewska E, Rzetecka N, Bręborowicz A, Matysiak J. Amino Acid Profiling Identifies Disease-Specific Signatures in IgE-Mediated and Non-IgE-Mediated Food Allergy in Pediatric Patients with Atopic Dermatitis. Biomedicines. 2023; 11(7):1919. https://doi.org/10.3390/biomedicines11071919
Chicago/Turabian StylePacki, Kacper, Joanna Matysiak, Szymon Plewa, Agnieszka Klupczyńska-Gabryszak, Eliza Matuszewska, Natalia Rzetecka, Anna Bręborowicz, and Jan Matysiak. 2023. "Amino Acid Profiling Identifies Disease-Specific Signatures in IgE-Mediated and Non-IgE-Mediated Food Allergy in Pediatric Patients with Atopic Dermatitis" Biomedicines 11, no. 7: 1919. https://doi.org/10.3390/biomedicines11071919
APA StylePacki, K., Matysiak, J., Plewa, S., Klupczyńska-Gabryszak, A., Matuszewska, E., Rzetecka, N., Bręborowicz, A., & Matysiak, J. (2023). Amino Acid Profiling Identifies Disease-Specific Signatures in IgE-Mediated and Non-IgE-Mediated Food Allergy in Pediatric Patients with Atopic Dermatitis. Biomedicines, 11(7), 1919. https://doi.org/10.3390/biomedicines11071919