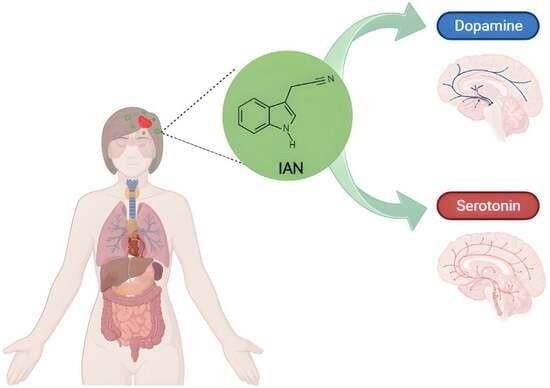
Scheme 1.
Chemical structure of IAN (indole-3-acetonitrile).
Scheme 1.
Chemical structure of IAN (indole-3-acetonitrile).
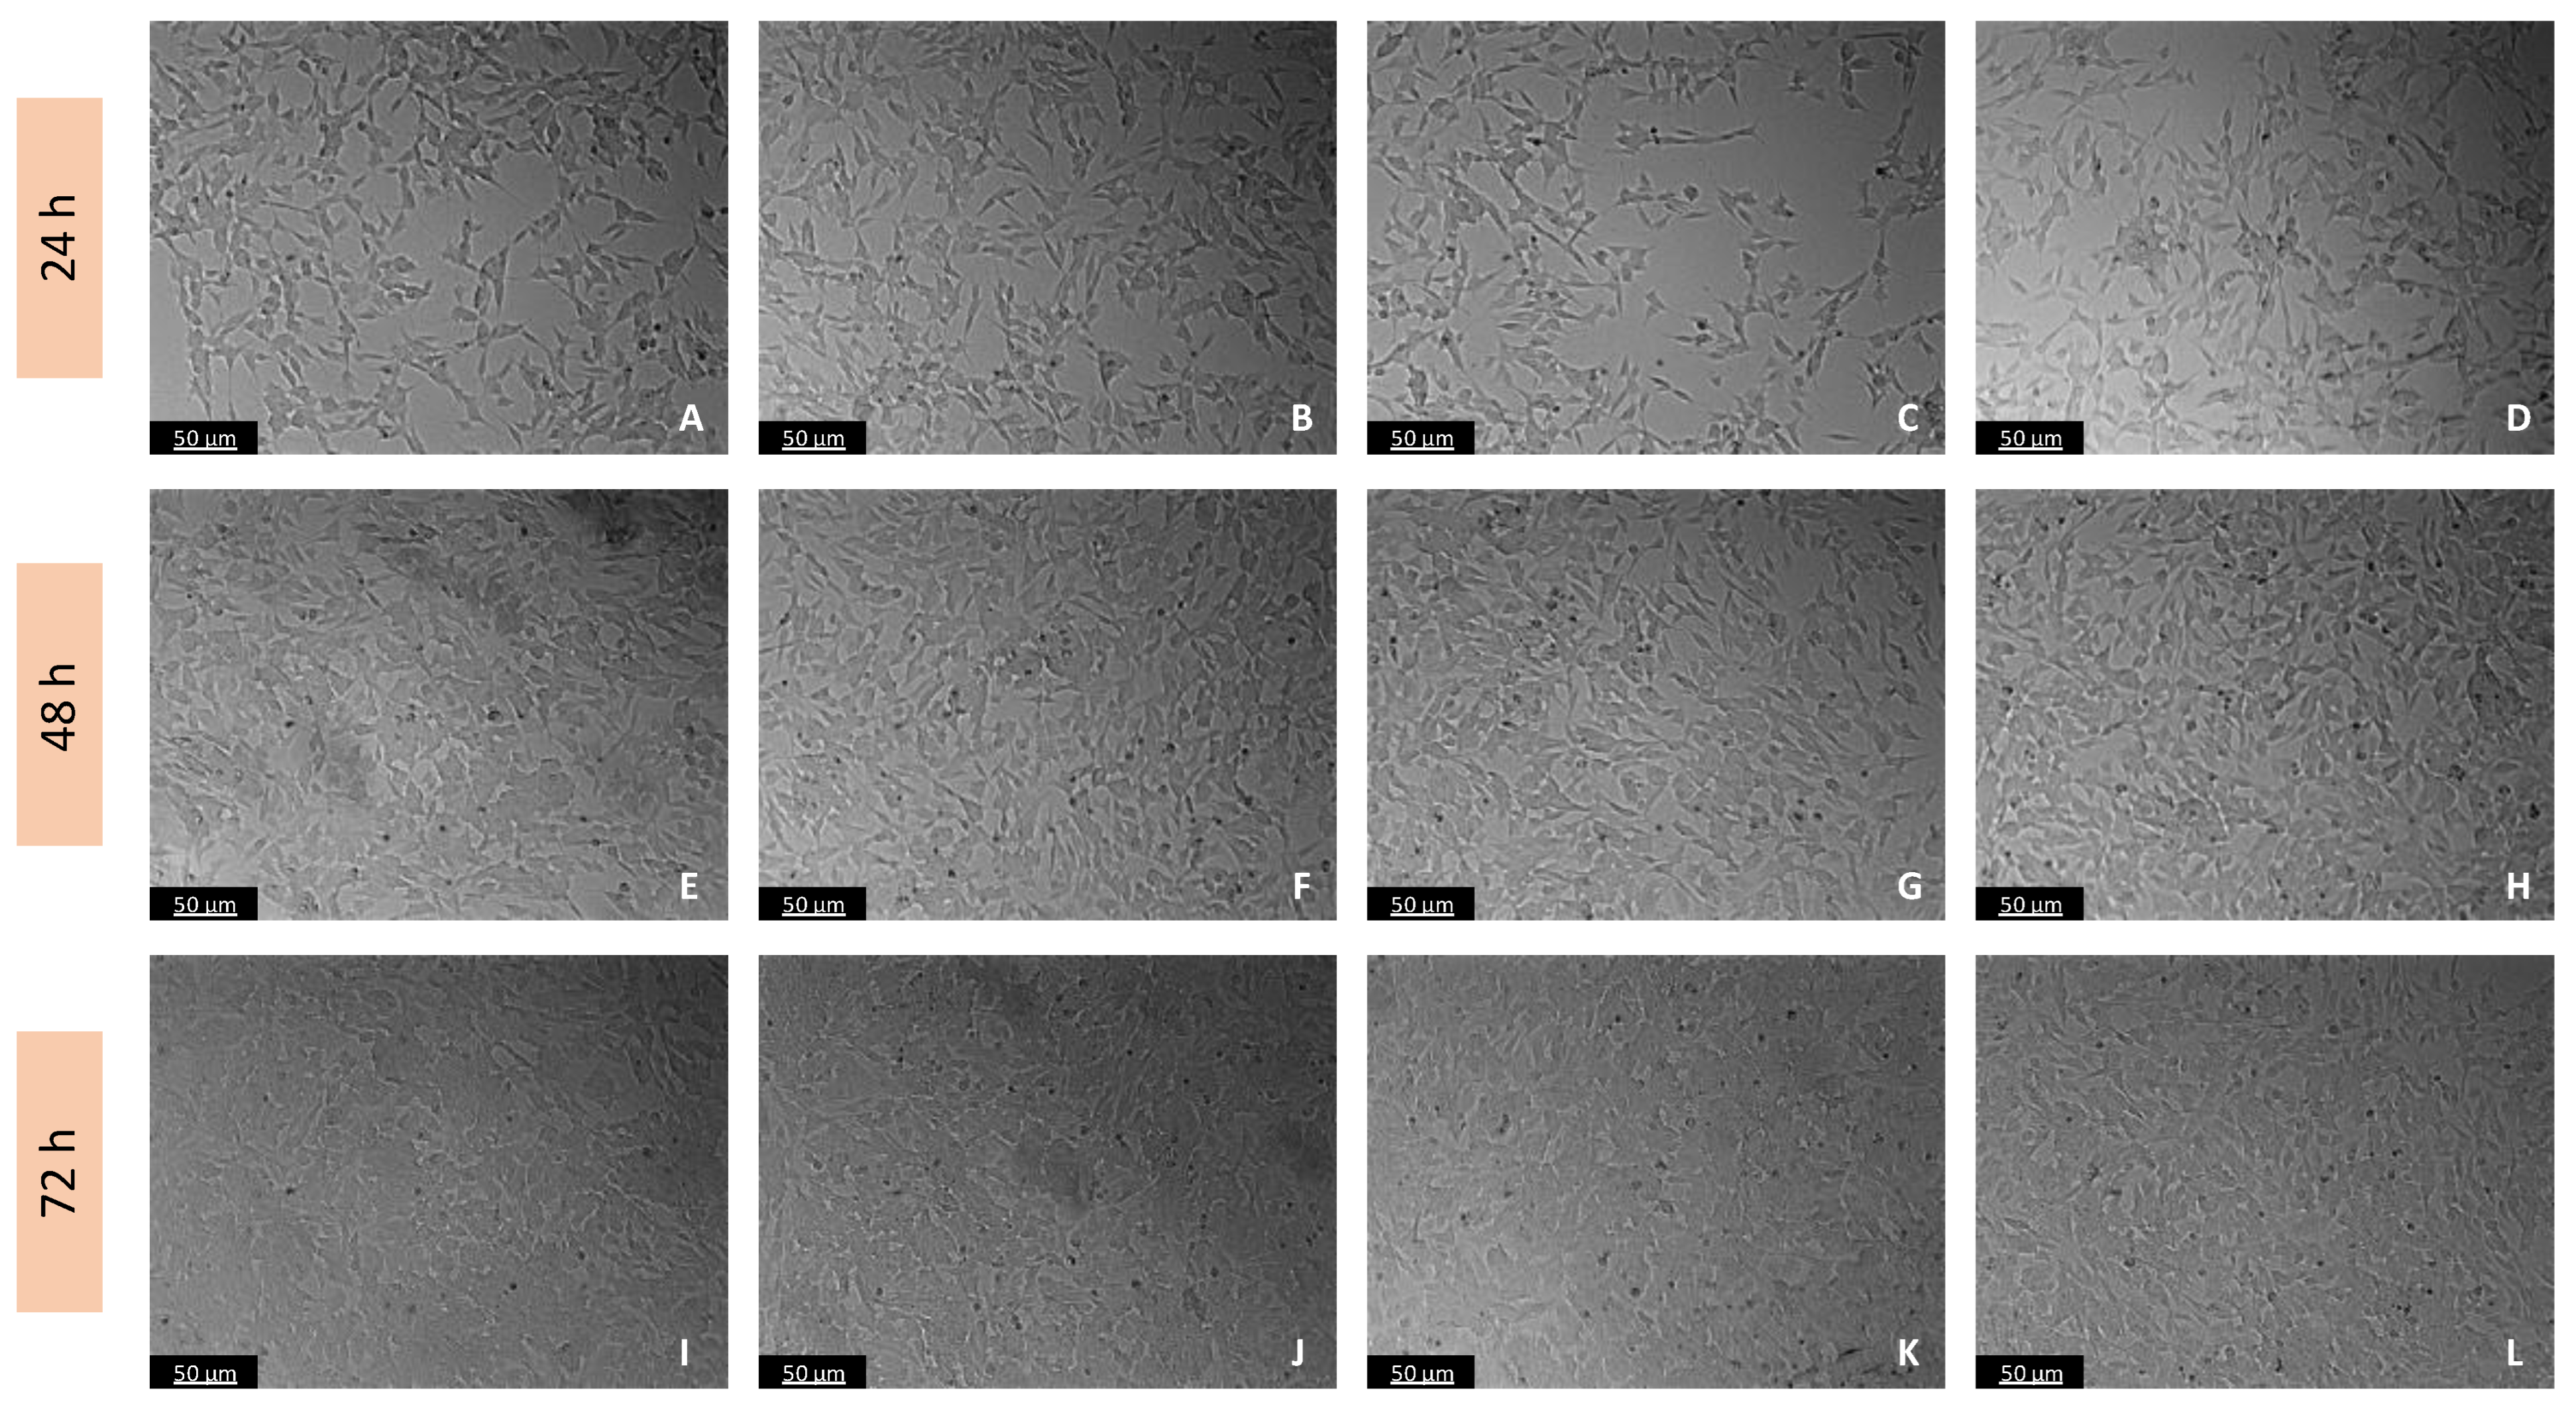
Figure 1.
Microscopic visualization of the effects of Tyr on the morphology of SH-SY5Y cells over 24, 48, and 72 h. Cells were treated with (A,E,I) 1% water (vehicle), (B,F,J) 100 µM, (C,G,K) 300 µM, and (D,H,L) 500 µM of Tyr. Representative images were obtained with 100× total magnification from three independent experiments. Scale bar: 50 µM.
Figure 2.
Microscopic visualization of the effects of Trp on the morphology of SH-SY5Y cells over 24, 48, and 72 h. Cells were treated with (A,E,I) 1% water (vehicle), (B,F,J) 100 µM, (C,G,K) 300 µM, and (D,H,L) 500 µM of Trp. Representative images were obtained with 100× total magnification from three independent experiments. Scale bar: 50 µM.
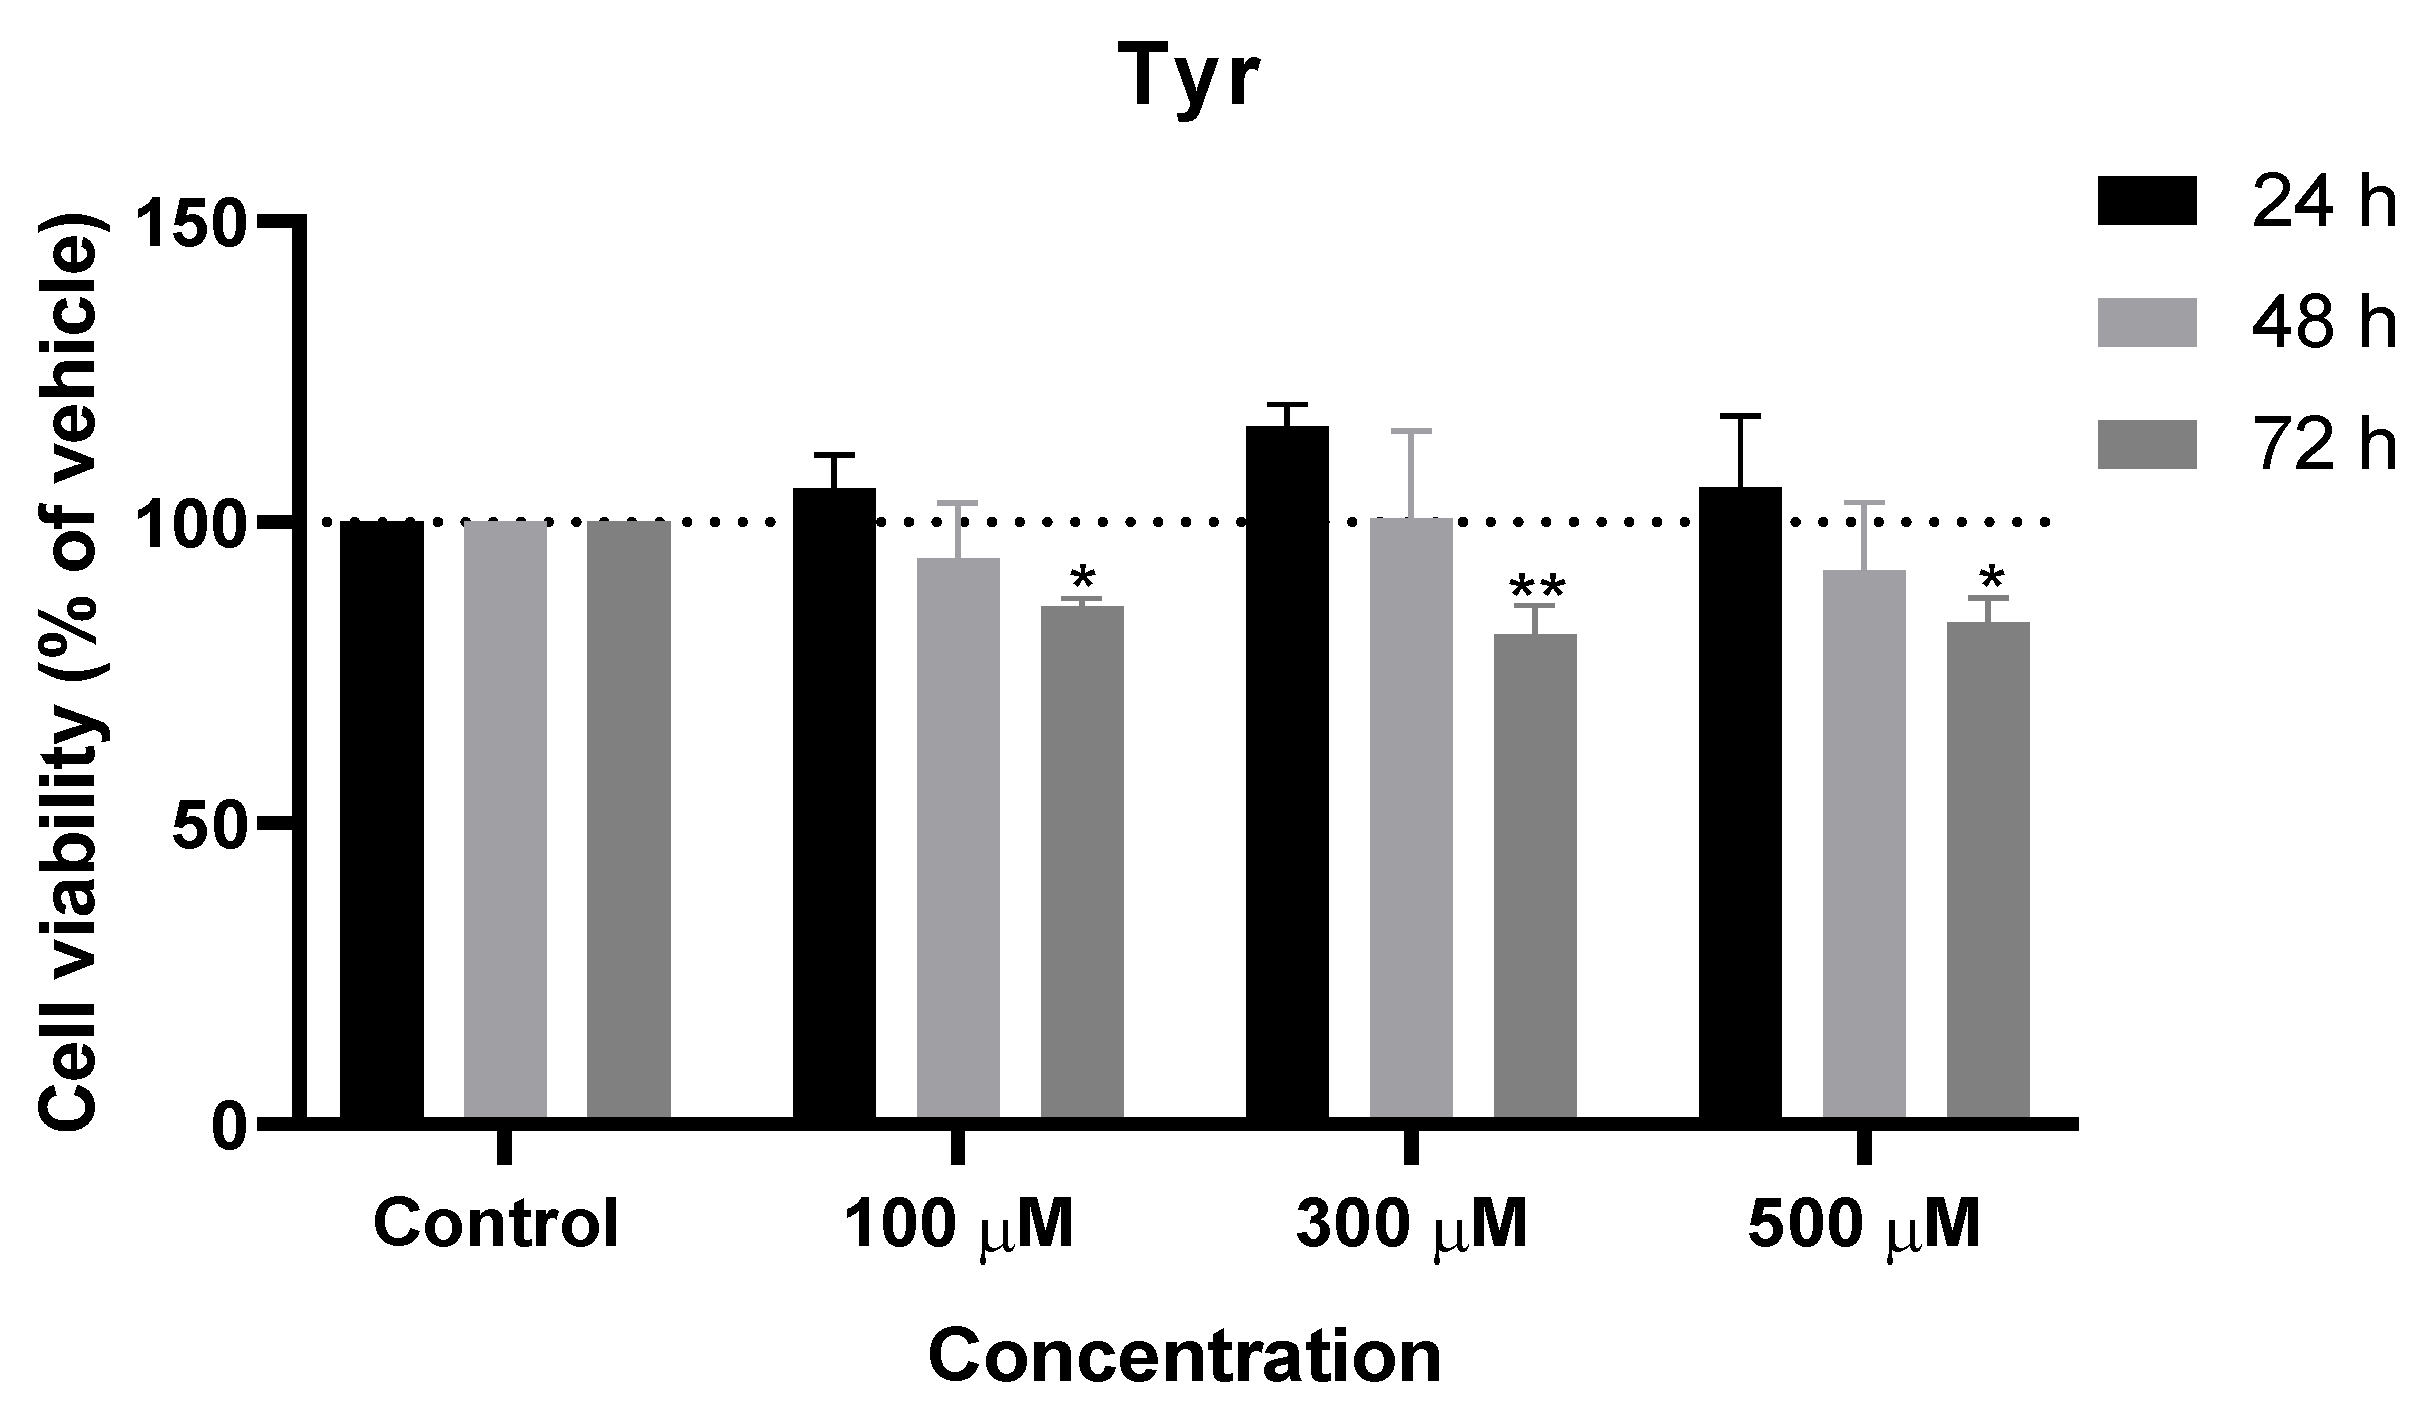
Figure 3.
Effect of Tyr on the viability of SH-SY5Y cells. The cells were cultured in the presence of increasing concentrations of Tyr and treated with Tyr for 24, 48, and 72 h. Then, cell viability was determined using the MTT assay. Results are expressed as a percentage of the vehicle-treated control ± SEM of three separate experiments. * Statistically significant vs. control at p < 0.05. ** Statistically significant vs. control at p < 0.01.
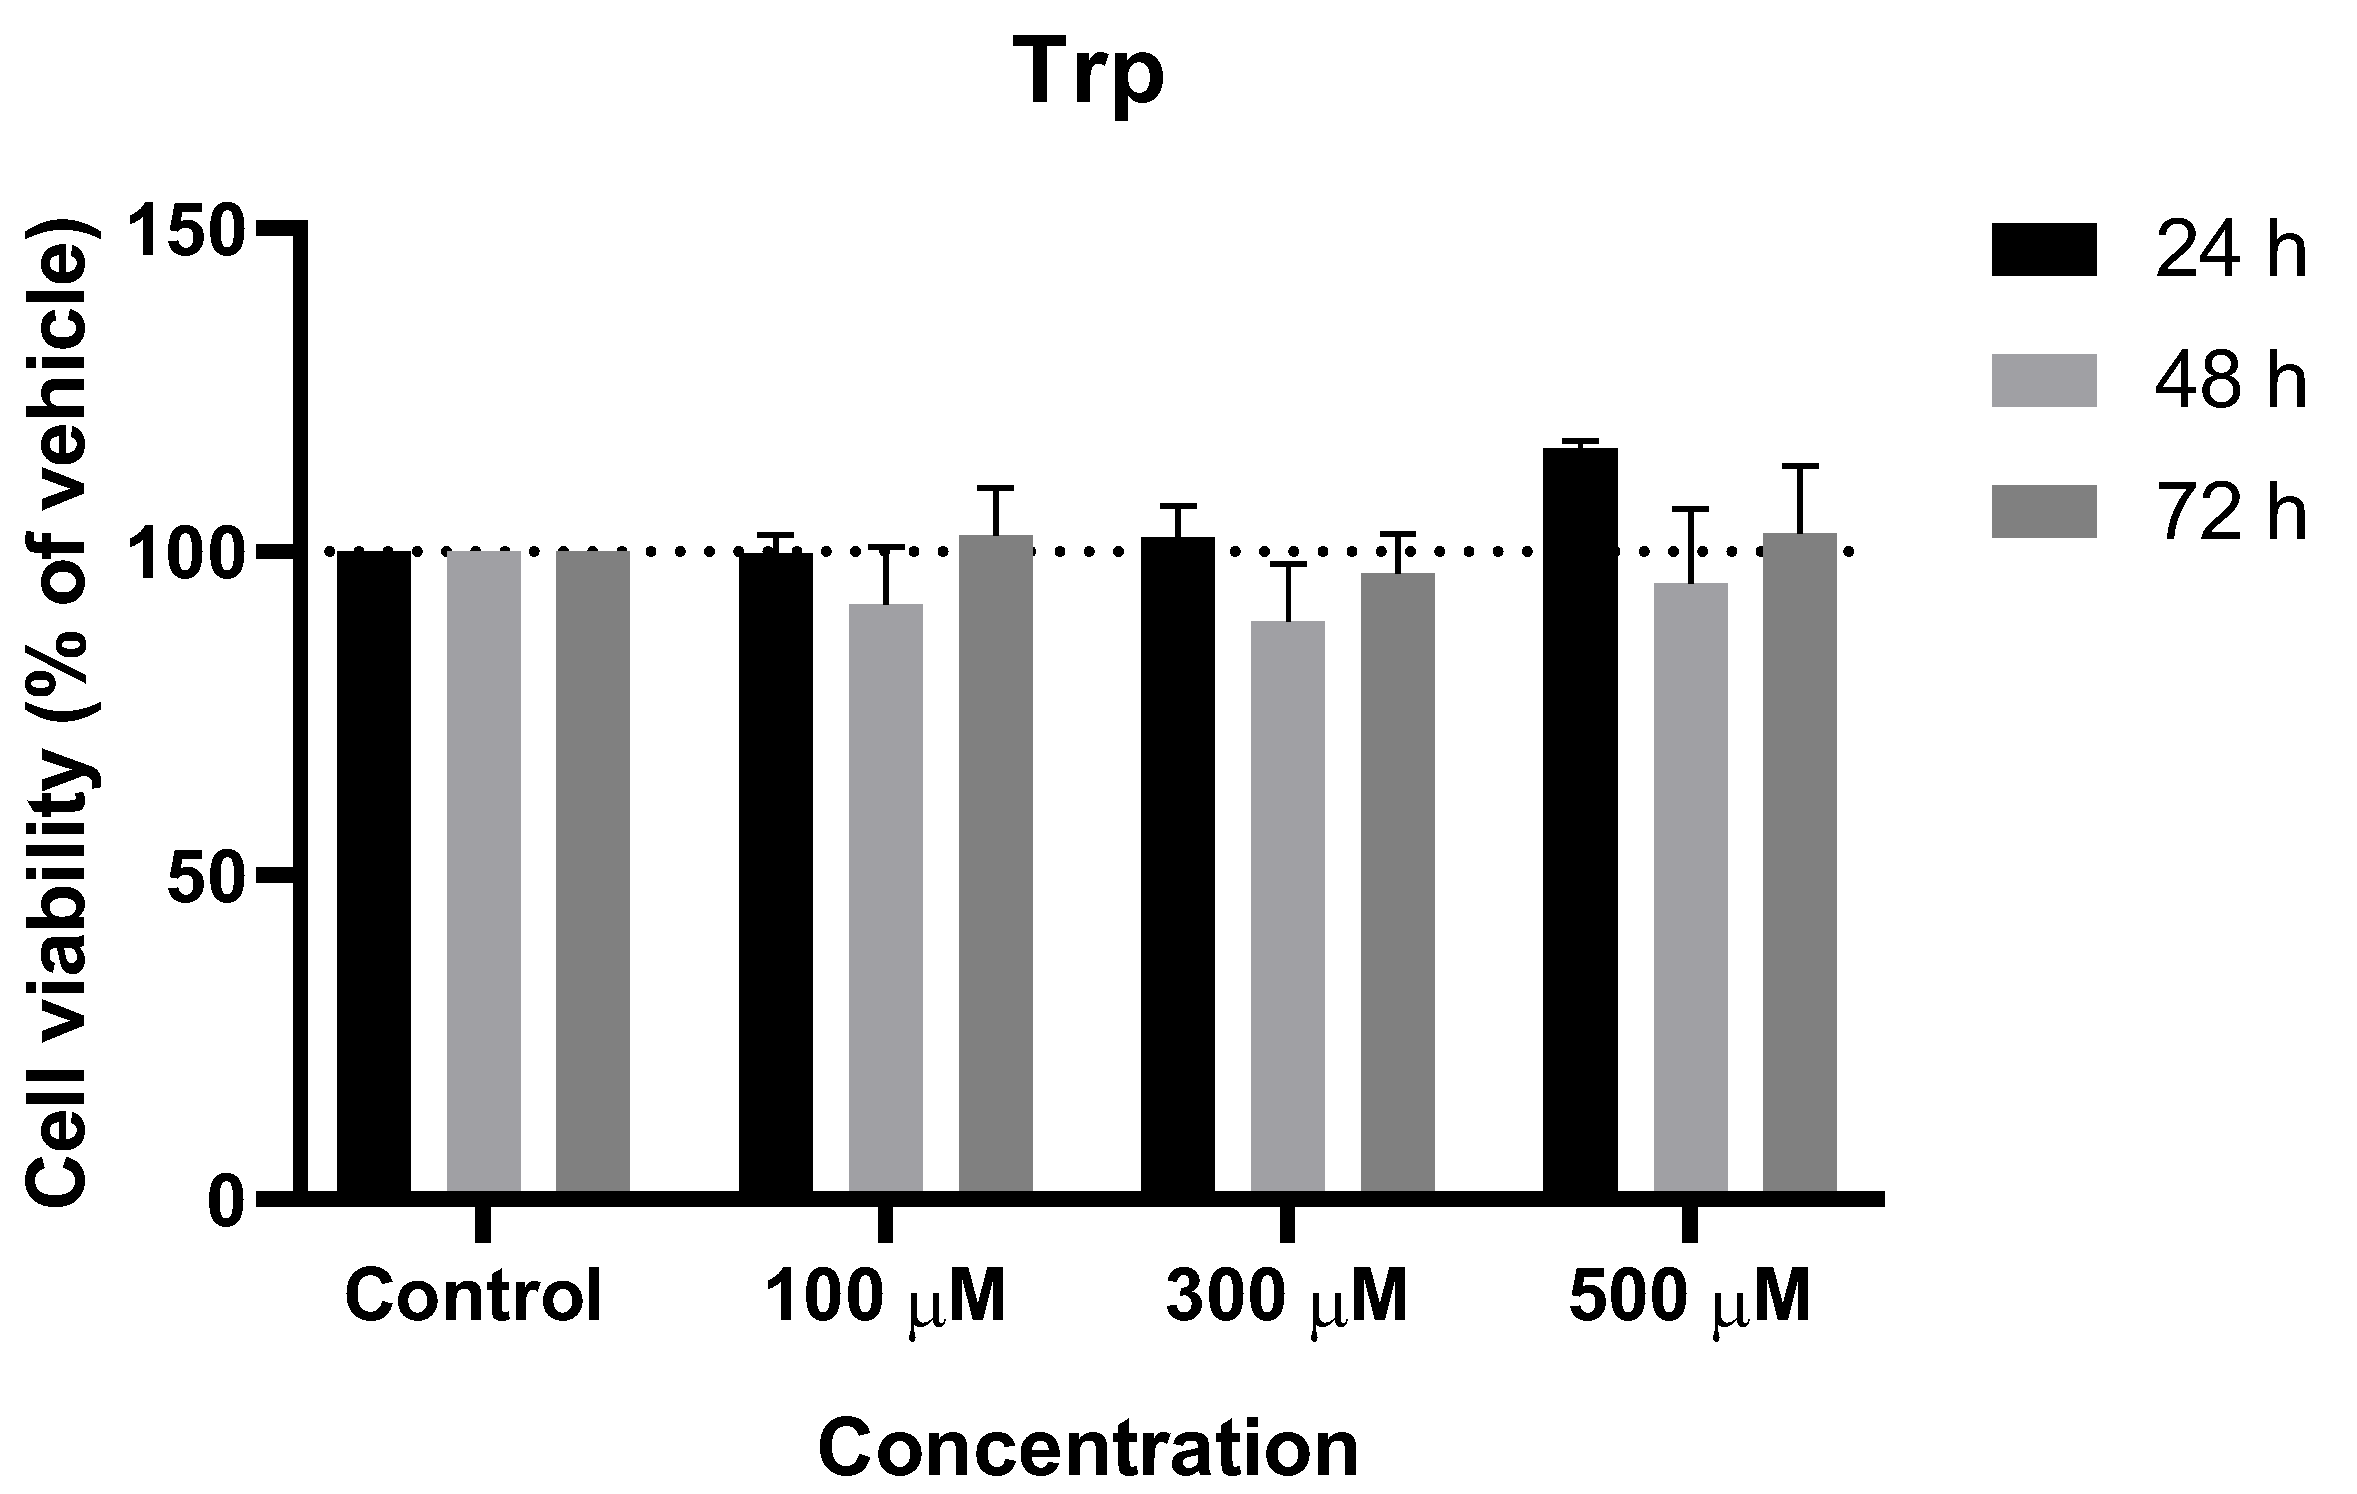
Figure 4.
Effect of Trp on the viability of SH-SY5Y cells. The cells were cultured in the presence of increasing concentrations of Trp and treated with Trp for 24, 48, and 72 h. Then, cell viability was determined using the MTT assay. Results are expressed as a percentage of the vehicle-treated control ± SEM of three separate experiments.
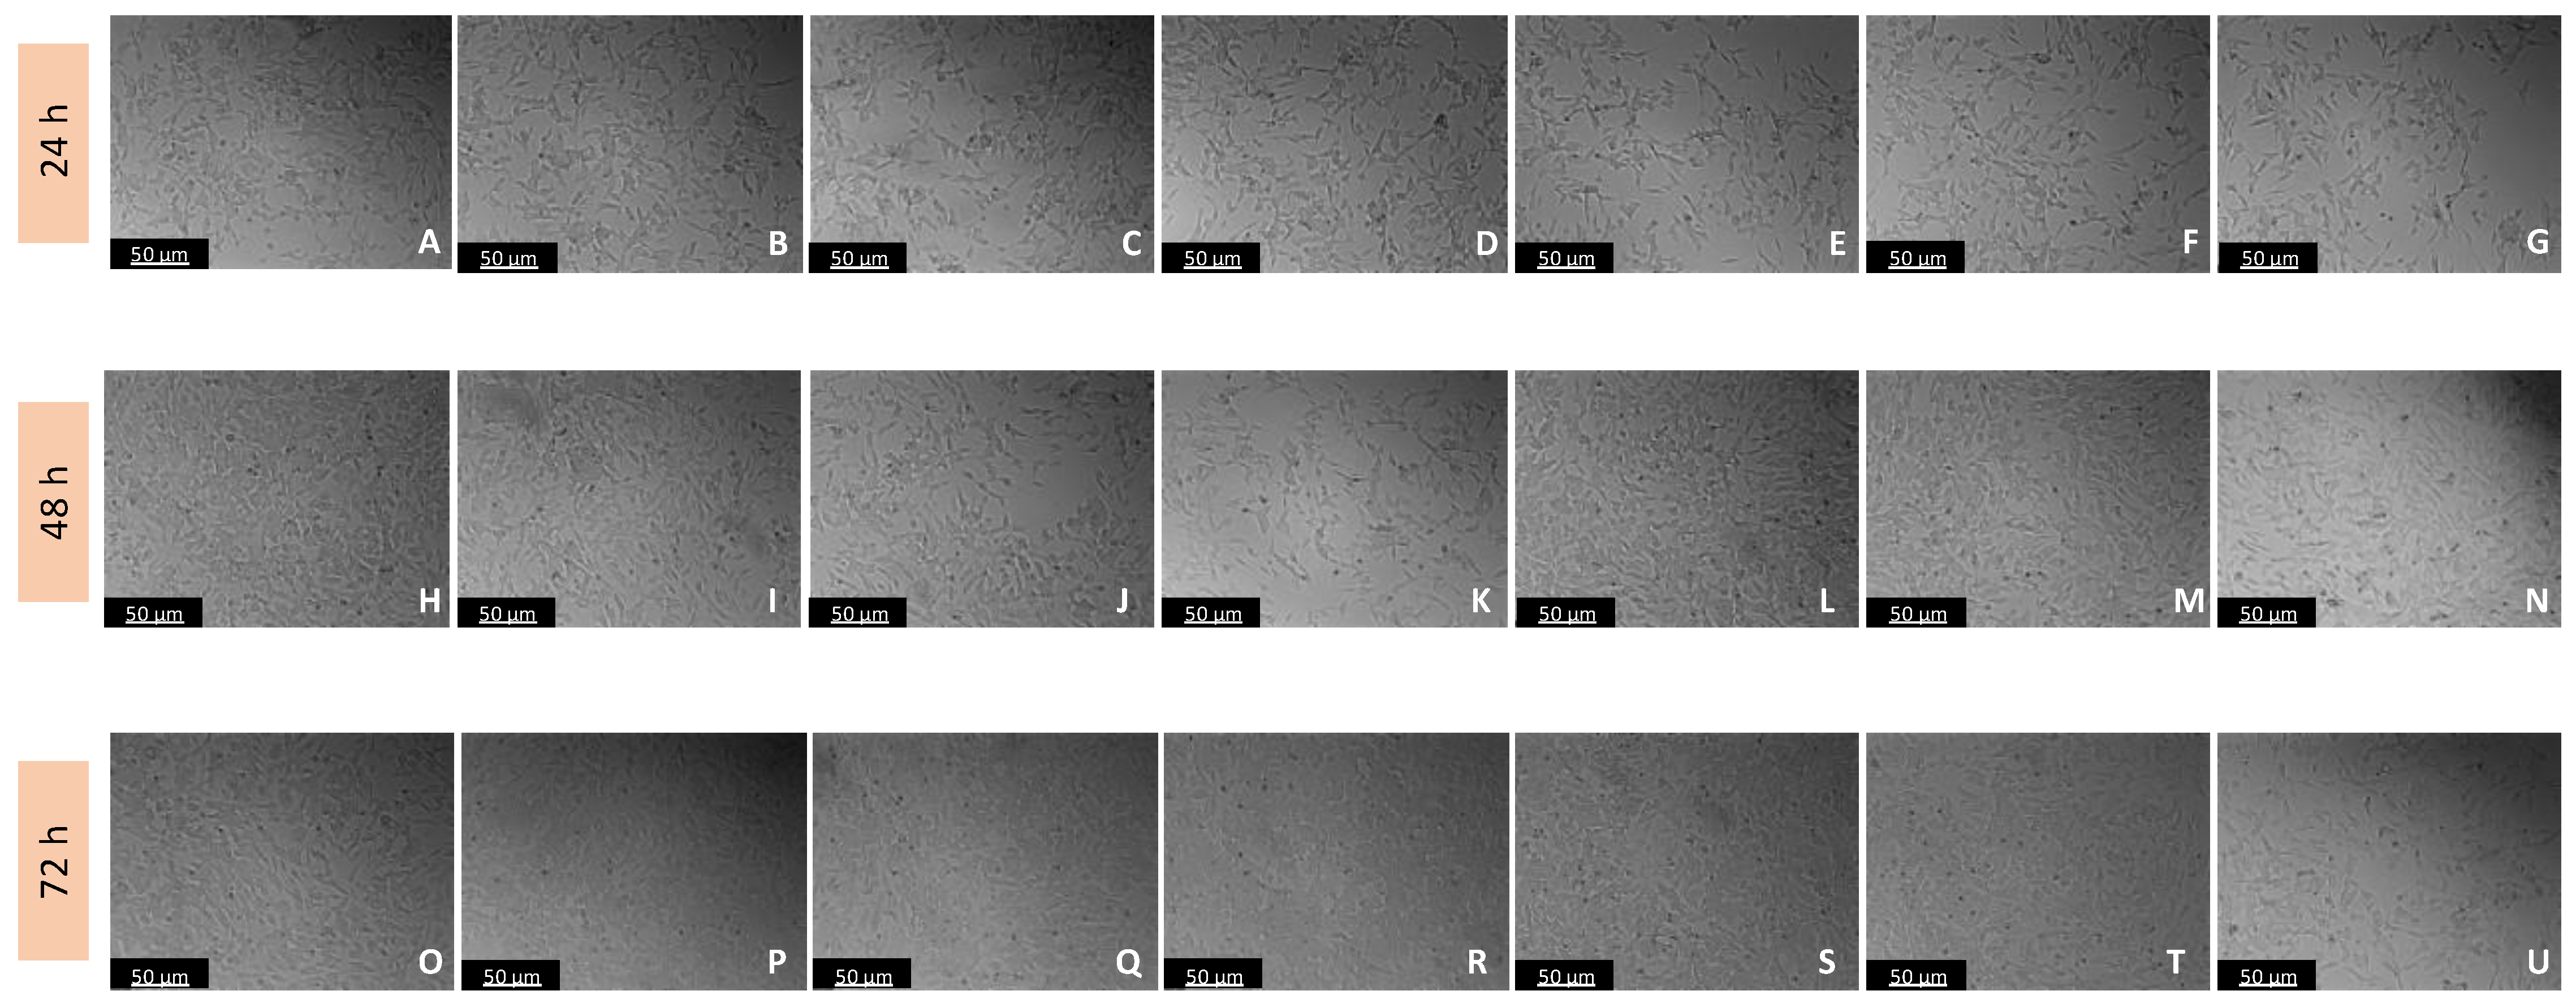
Figure 5.
Microscopic visualization of the effects of IAN on the morphology of SH-SY5Y cells over 24, 48, and 72 h. Cells were treated with (A,H,O) 0.1% DMSO (vehicle), (B,I,P) 0.01 µM, (C,J,Q) 0.1 µM, (D,K,R) 1 µM, (E,L,S) 10 µM, (F,M,T) 50 µM, and (G,N,U) 100 µM of IAN. Representative images were obtained with 100× total magnification from three independent experiments. Scale bar: 50 µM.
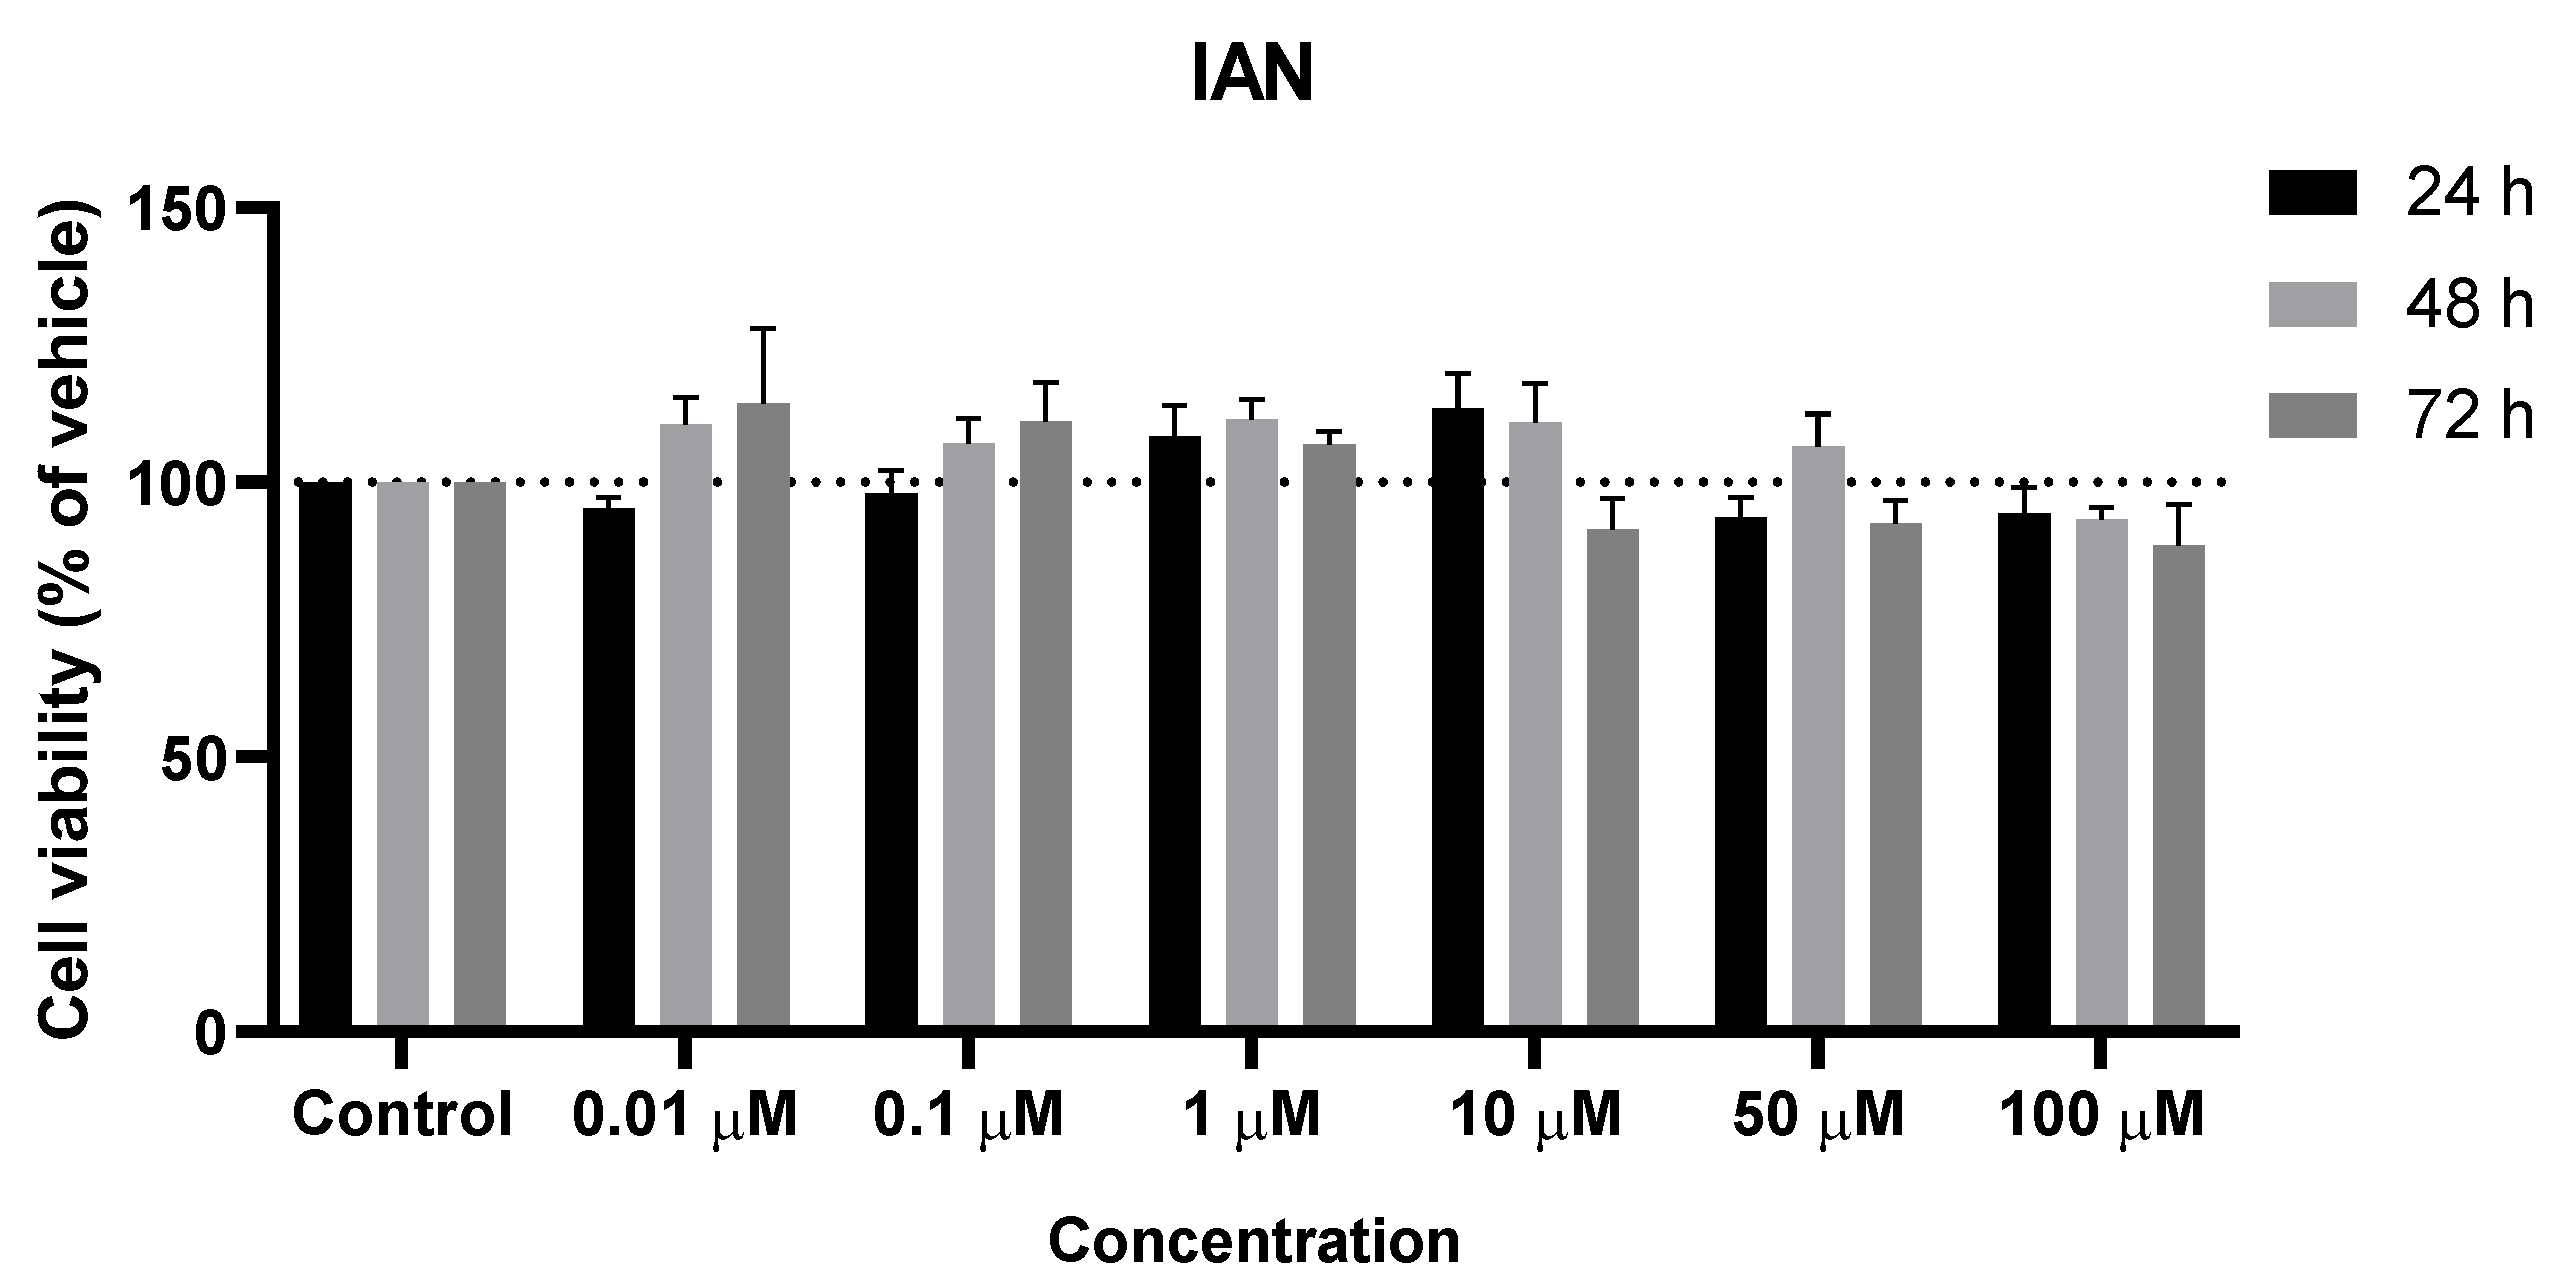
Figure 6.
Effect of IAN on the viability of SH-SY5Y cells. The cells were cultured in the presence of increasing concentrations of IAN and treated with IAN for 24, 48, and 72 h. Then, cell viability was determined using the MTT assay. Results are expressed as a percentage of the vehicle-treated control ± SEM of three separate experiments.
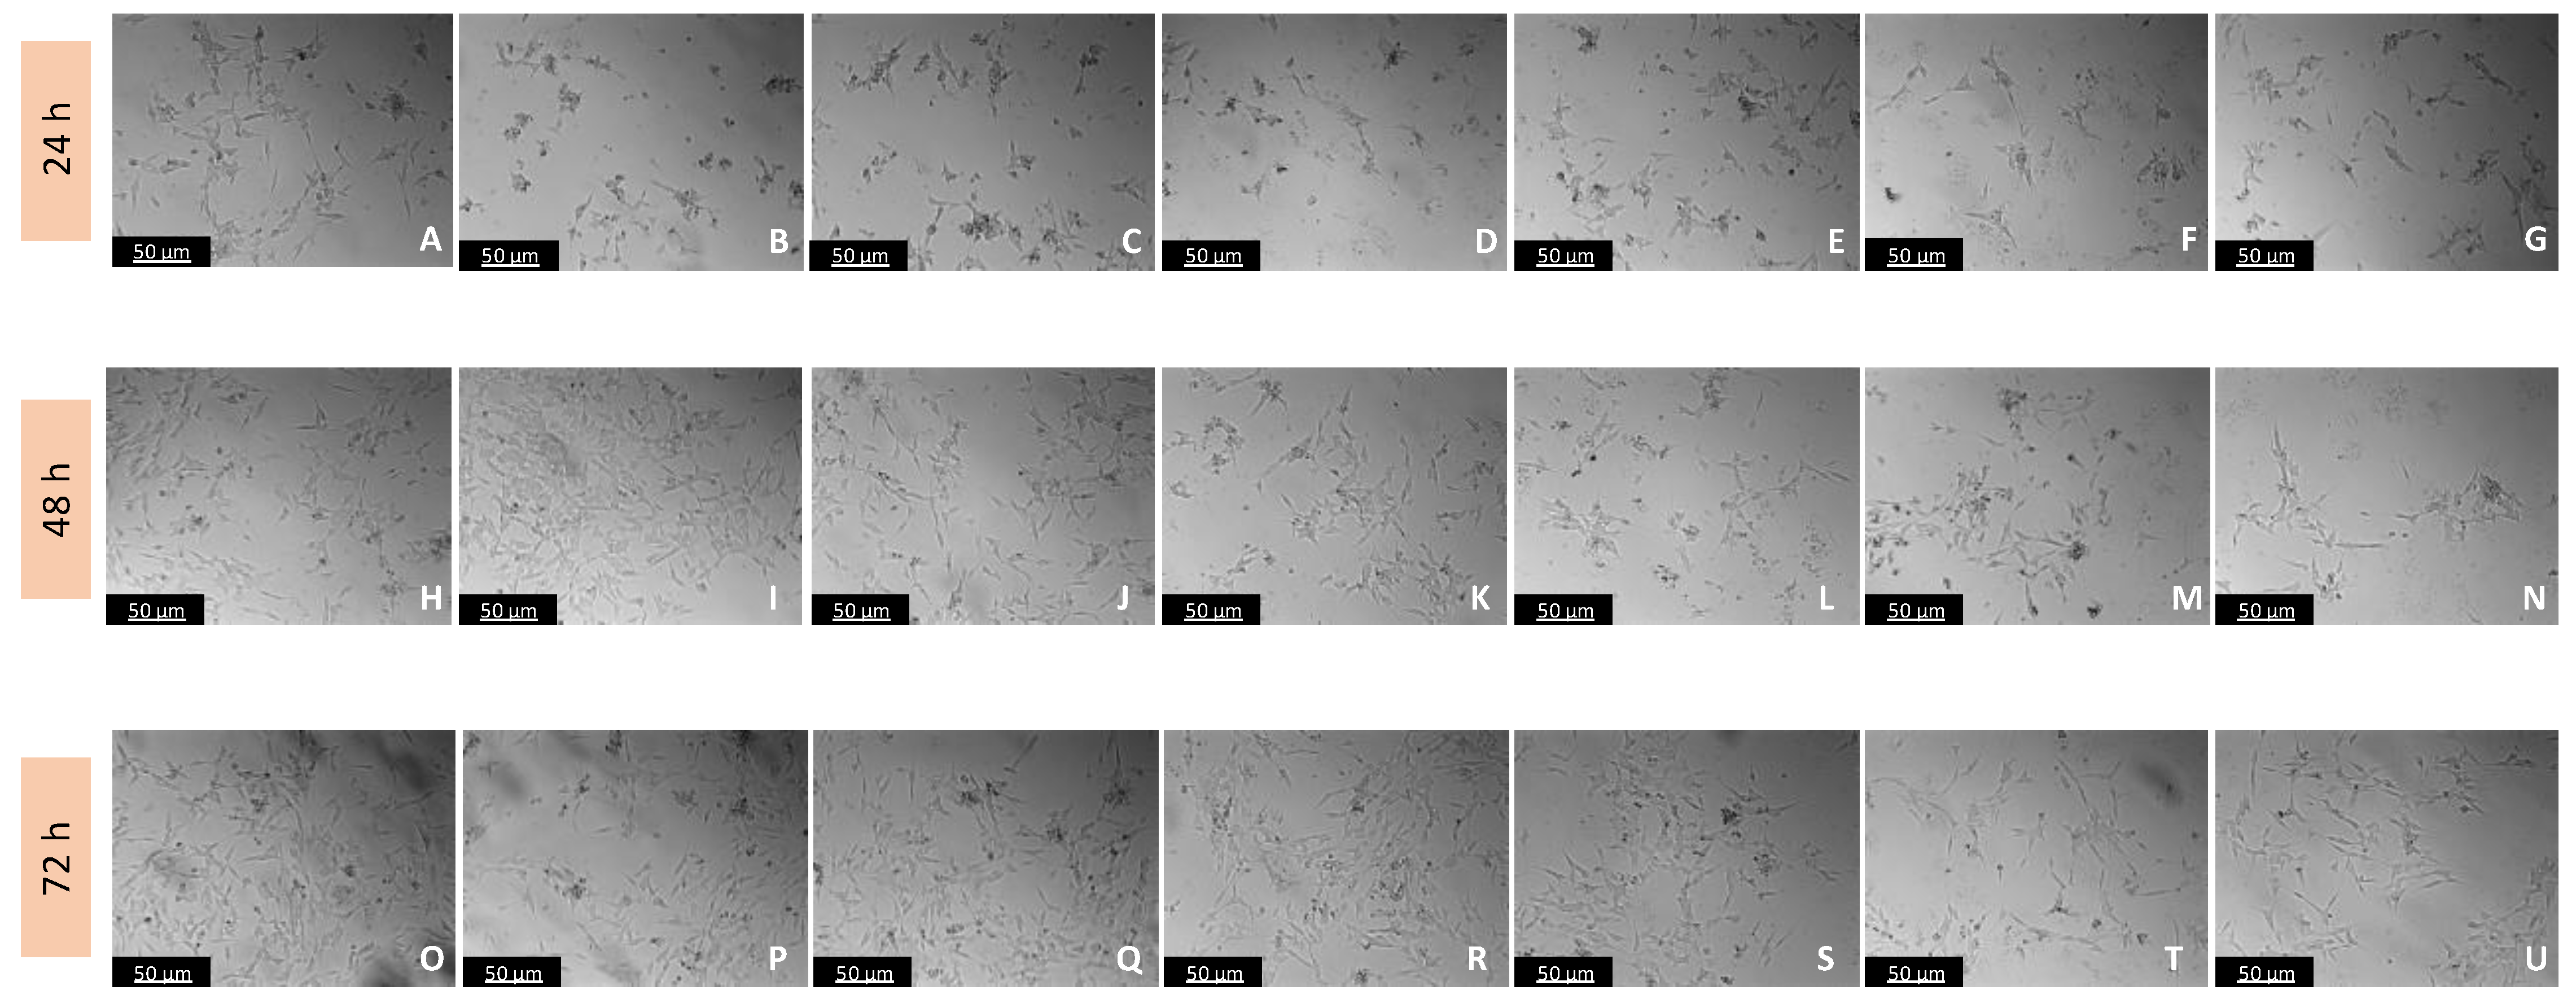
Figure 7.
Microscopic visualization of the effects of IAN combined with Tyr on the morphology of SH-SY5Y cells over 24, 48, and 72 h. Cells were treated with (A,H,O) 0.2% DMSO (vehicle), (B,I,P) IAN 0.01 µM + Tyr 500 µM, (C,J,Q) IAN 0.1 µM + Tyr 500 µM, (D,K,R) IAN 1 µM + Tyr 500 µM, (E,L,S) IAN 10 µM + Tyr 500 µM, (F,M,T) IAN 50 µM + Tyr 500 µM, and (G,N,U) IAN 100 µM + Tyr 500 µM. Representative images were obtained with 100× total magnification from three independent experiments. Scale bar: 50 µM.
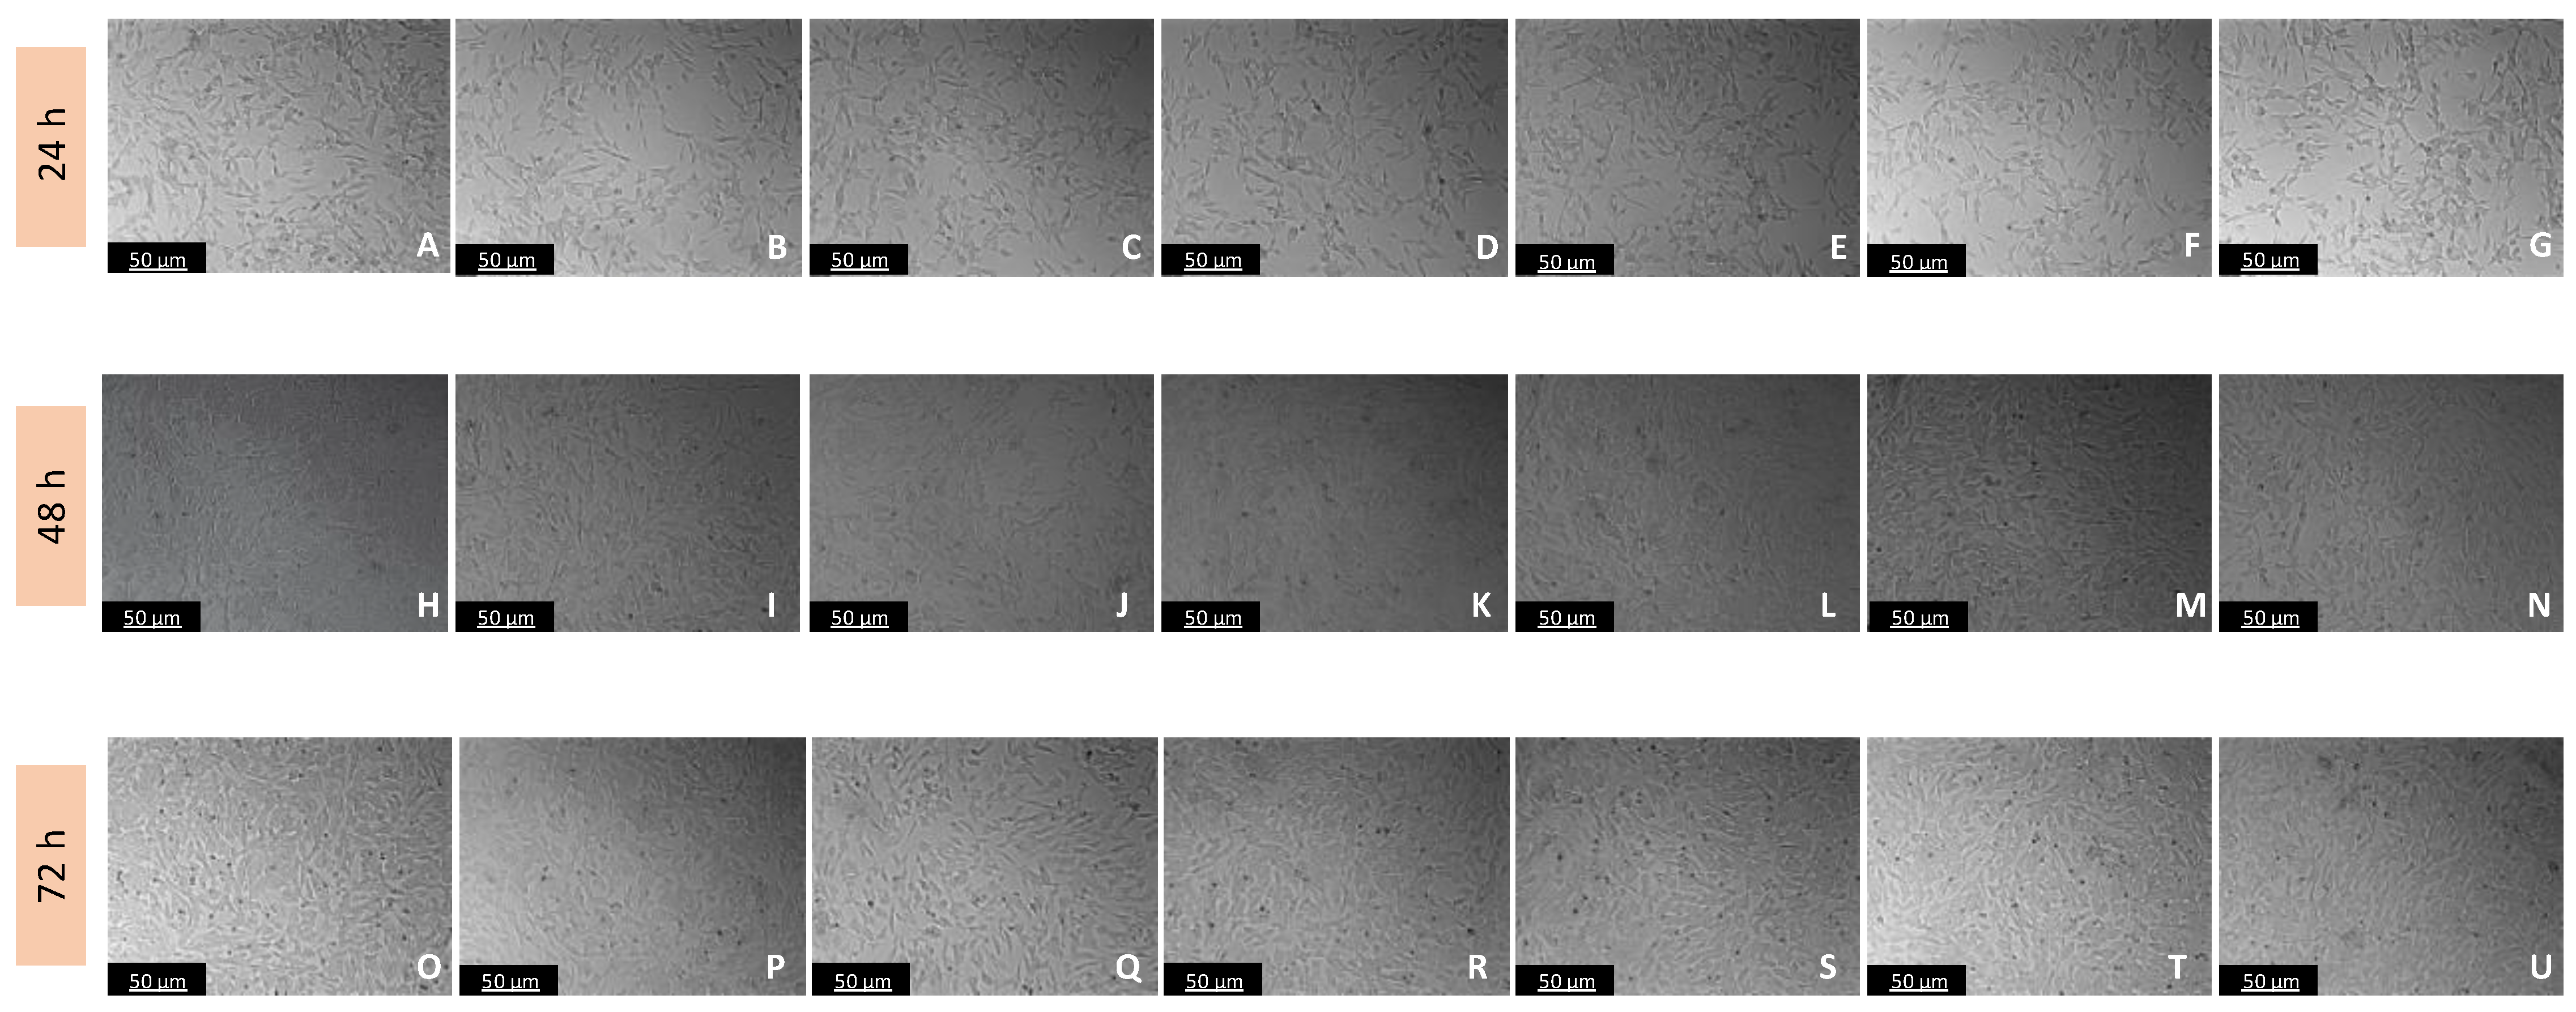
Figure 8.
Microscopic visualization of the effects of IAN combined with Trp on the morphology of SH-SY5Y cells over 24, 48, and 72 h. Cells were treated with (A,H,O) 0.2% DMSO (vehicle), (B,I,P) IAN 0.01 µM + Trp 500 µM, (C,J,Q) IAN 0.1 µM + Trp 500 µM, (D,K,R) IAN 1 µM + Trp 500 µM, (E,L,S) IAN 10 µM + Trp 500 µM, (F,M,T) IAN 50 µM + Trp 500 µM, and (G,N,U) IAN 100 µM + Trp 500 µM. Representative images were obtained with 100× total magnification from three independent experiments. Scale bar: 50 µM.
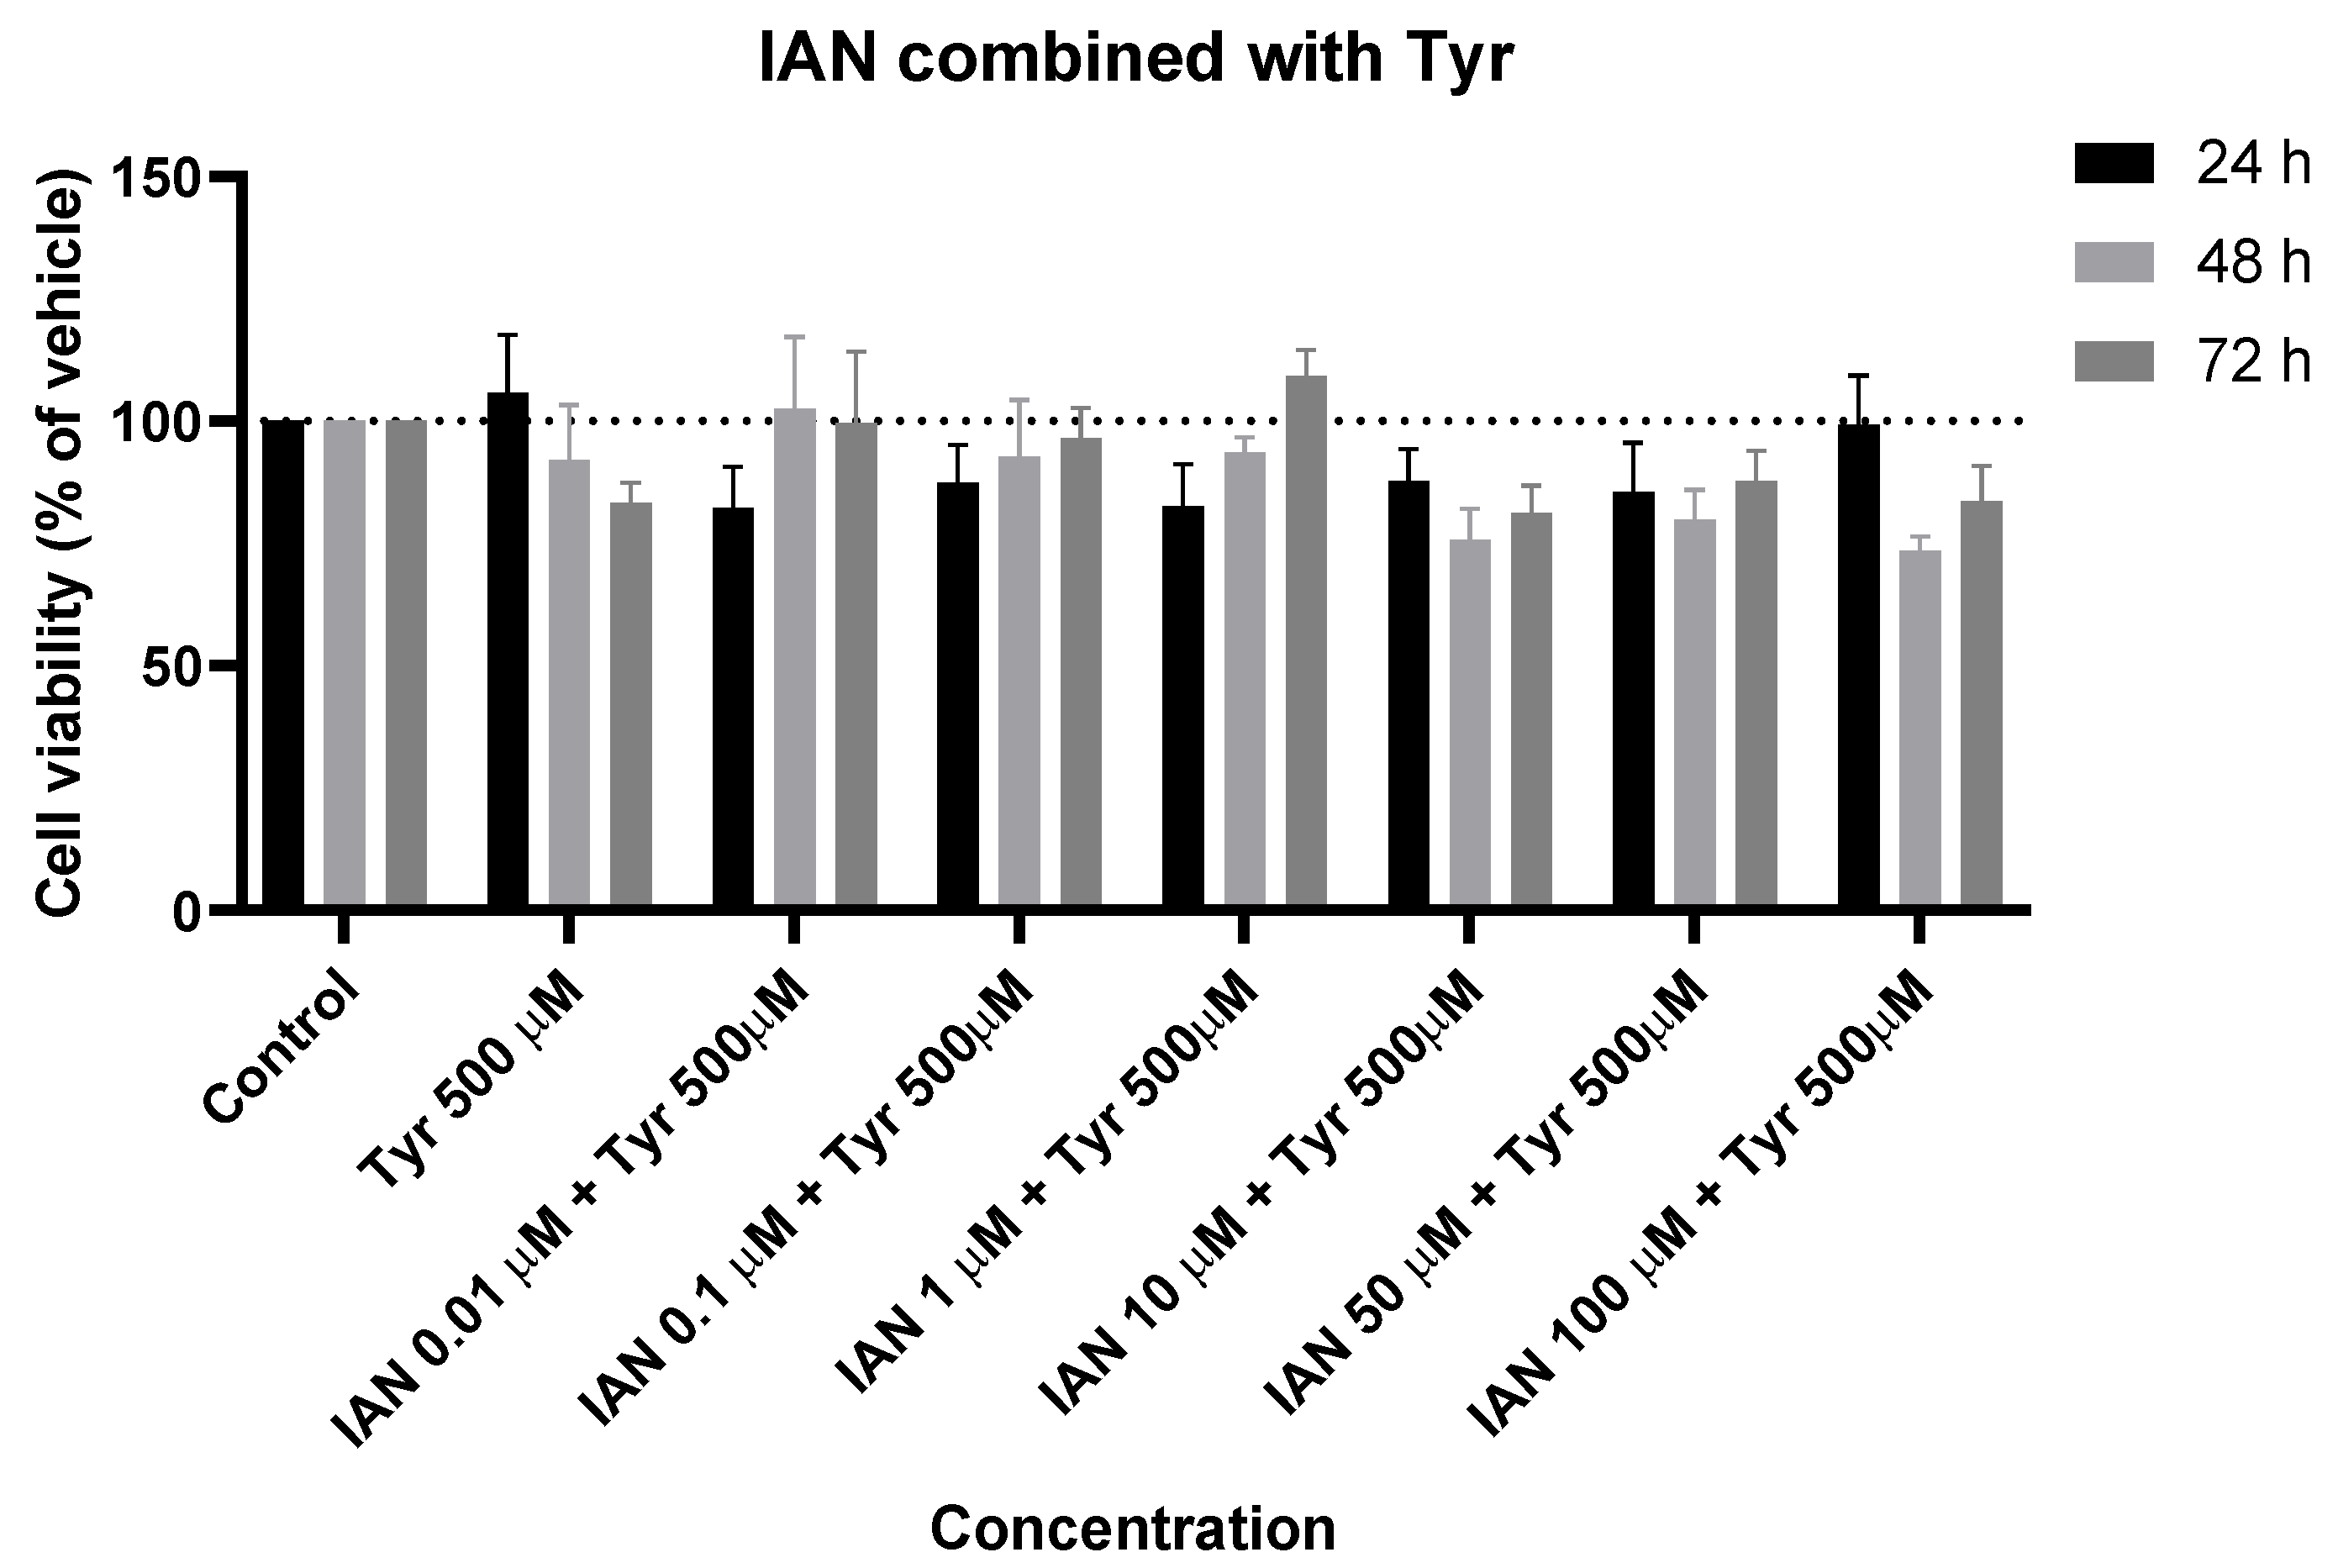
Figure 9.
Effect of IAN combined with tyrosine on the viability of SH-SY5Y cells. The cells were cultured in the presence of increasing concentrations of IAN and with a unique concentration of 500 µM of Tyr and treated for 24, 48, and 72 h. Then, cell viability was determined using the MTT assay. Results are expressed as a percentage of the vehicle-treated control ± SEM of three separate experiments.
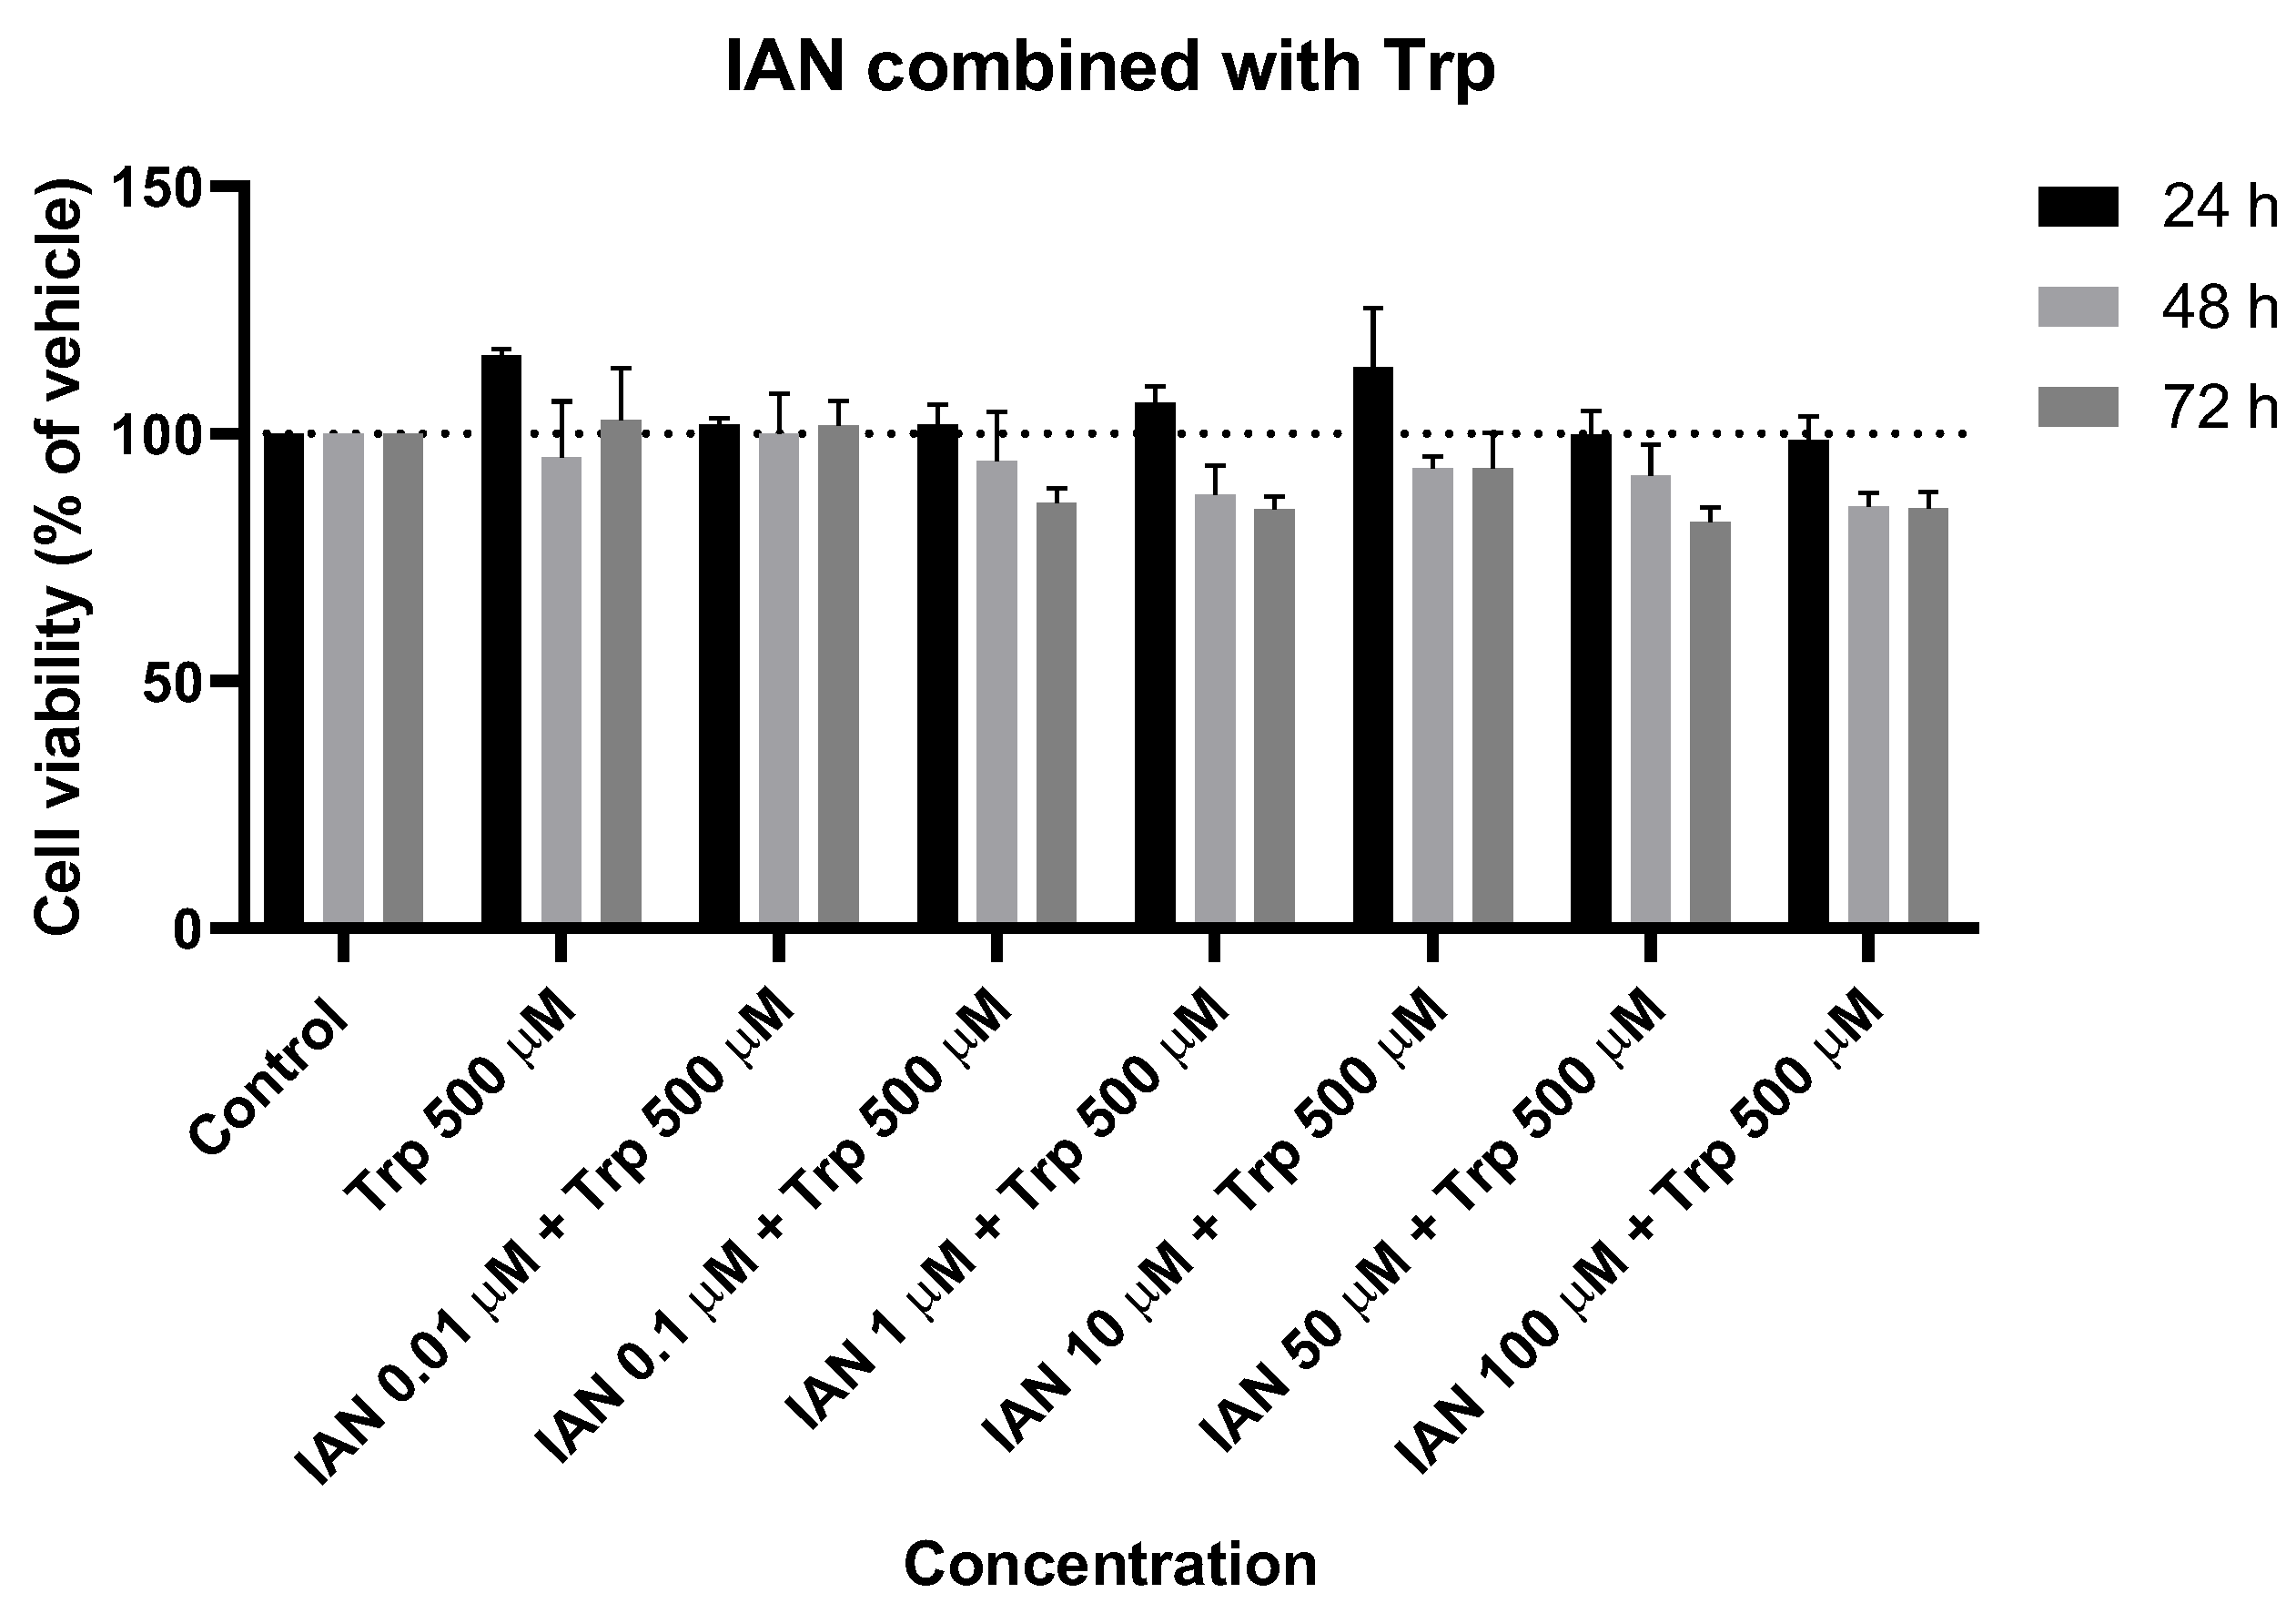
Figure 10.
Effect of IAN combined with Trp on the viability of SH-SY5Y cells. The cells were cultured in the presence of increasing concentrations of IAN and with a unique concentration of 500 µM of Trp and treated for 24, 48, and 72 h. Then, cell viability was determined using the MTT assay. Results are expressed as a percentage of the vehicle-treated control ± SEM of three separate experiments.
Figure 11.
Microscopic visualization of the effects of Tyr combined with H2O2 on the morphology of SH-SY5Y cells over 24, 48, and 72 h. Cells were treated with (A,F,K) 0.2% DMSO (vehicle), (B,G,L) H2O2 132 µM, (C,H,M) Tyr 100 µM + H2O2 132 µM, (D,I,N) Tyr 300 µM + H2O2 132 µM, and (E,J,O) Tyr 500 µM + H2O2 132 µM. Representative images were obtained with 100× total magnification from three independent experiments. Scale bar: 50 µM.
Figure 12.
Microscopic visualization of the effects of Trp combined with H2O2 on the morphology of SH-SY5Y cells over 24, 48, and 72 h. Cells were treated with (A,F,K) 0.2% DMSO (vehicle), (B,G,L) H2O2 132 µM, (C,H,M) Tyr 100 µM + H2O2 132 µM, (D,I,N) Tyr 300 µM + H2O2 132 µM, and (E,J,O) Tyr 500 µM + H2O2 132 µM. Representative images were obtained with 100× total magnification from three independent experiments. Scale bar: 50 µM.
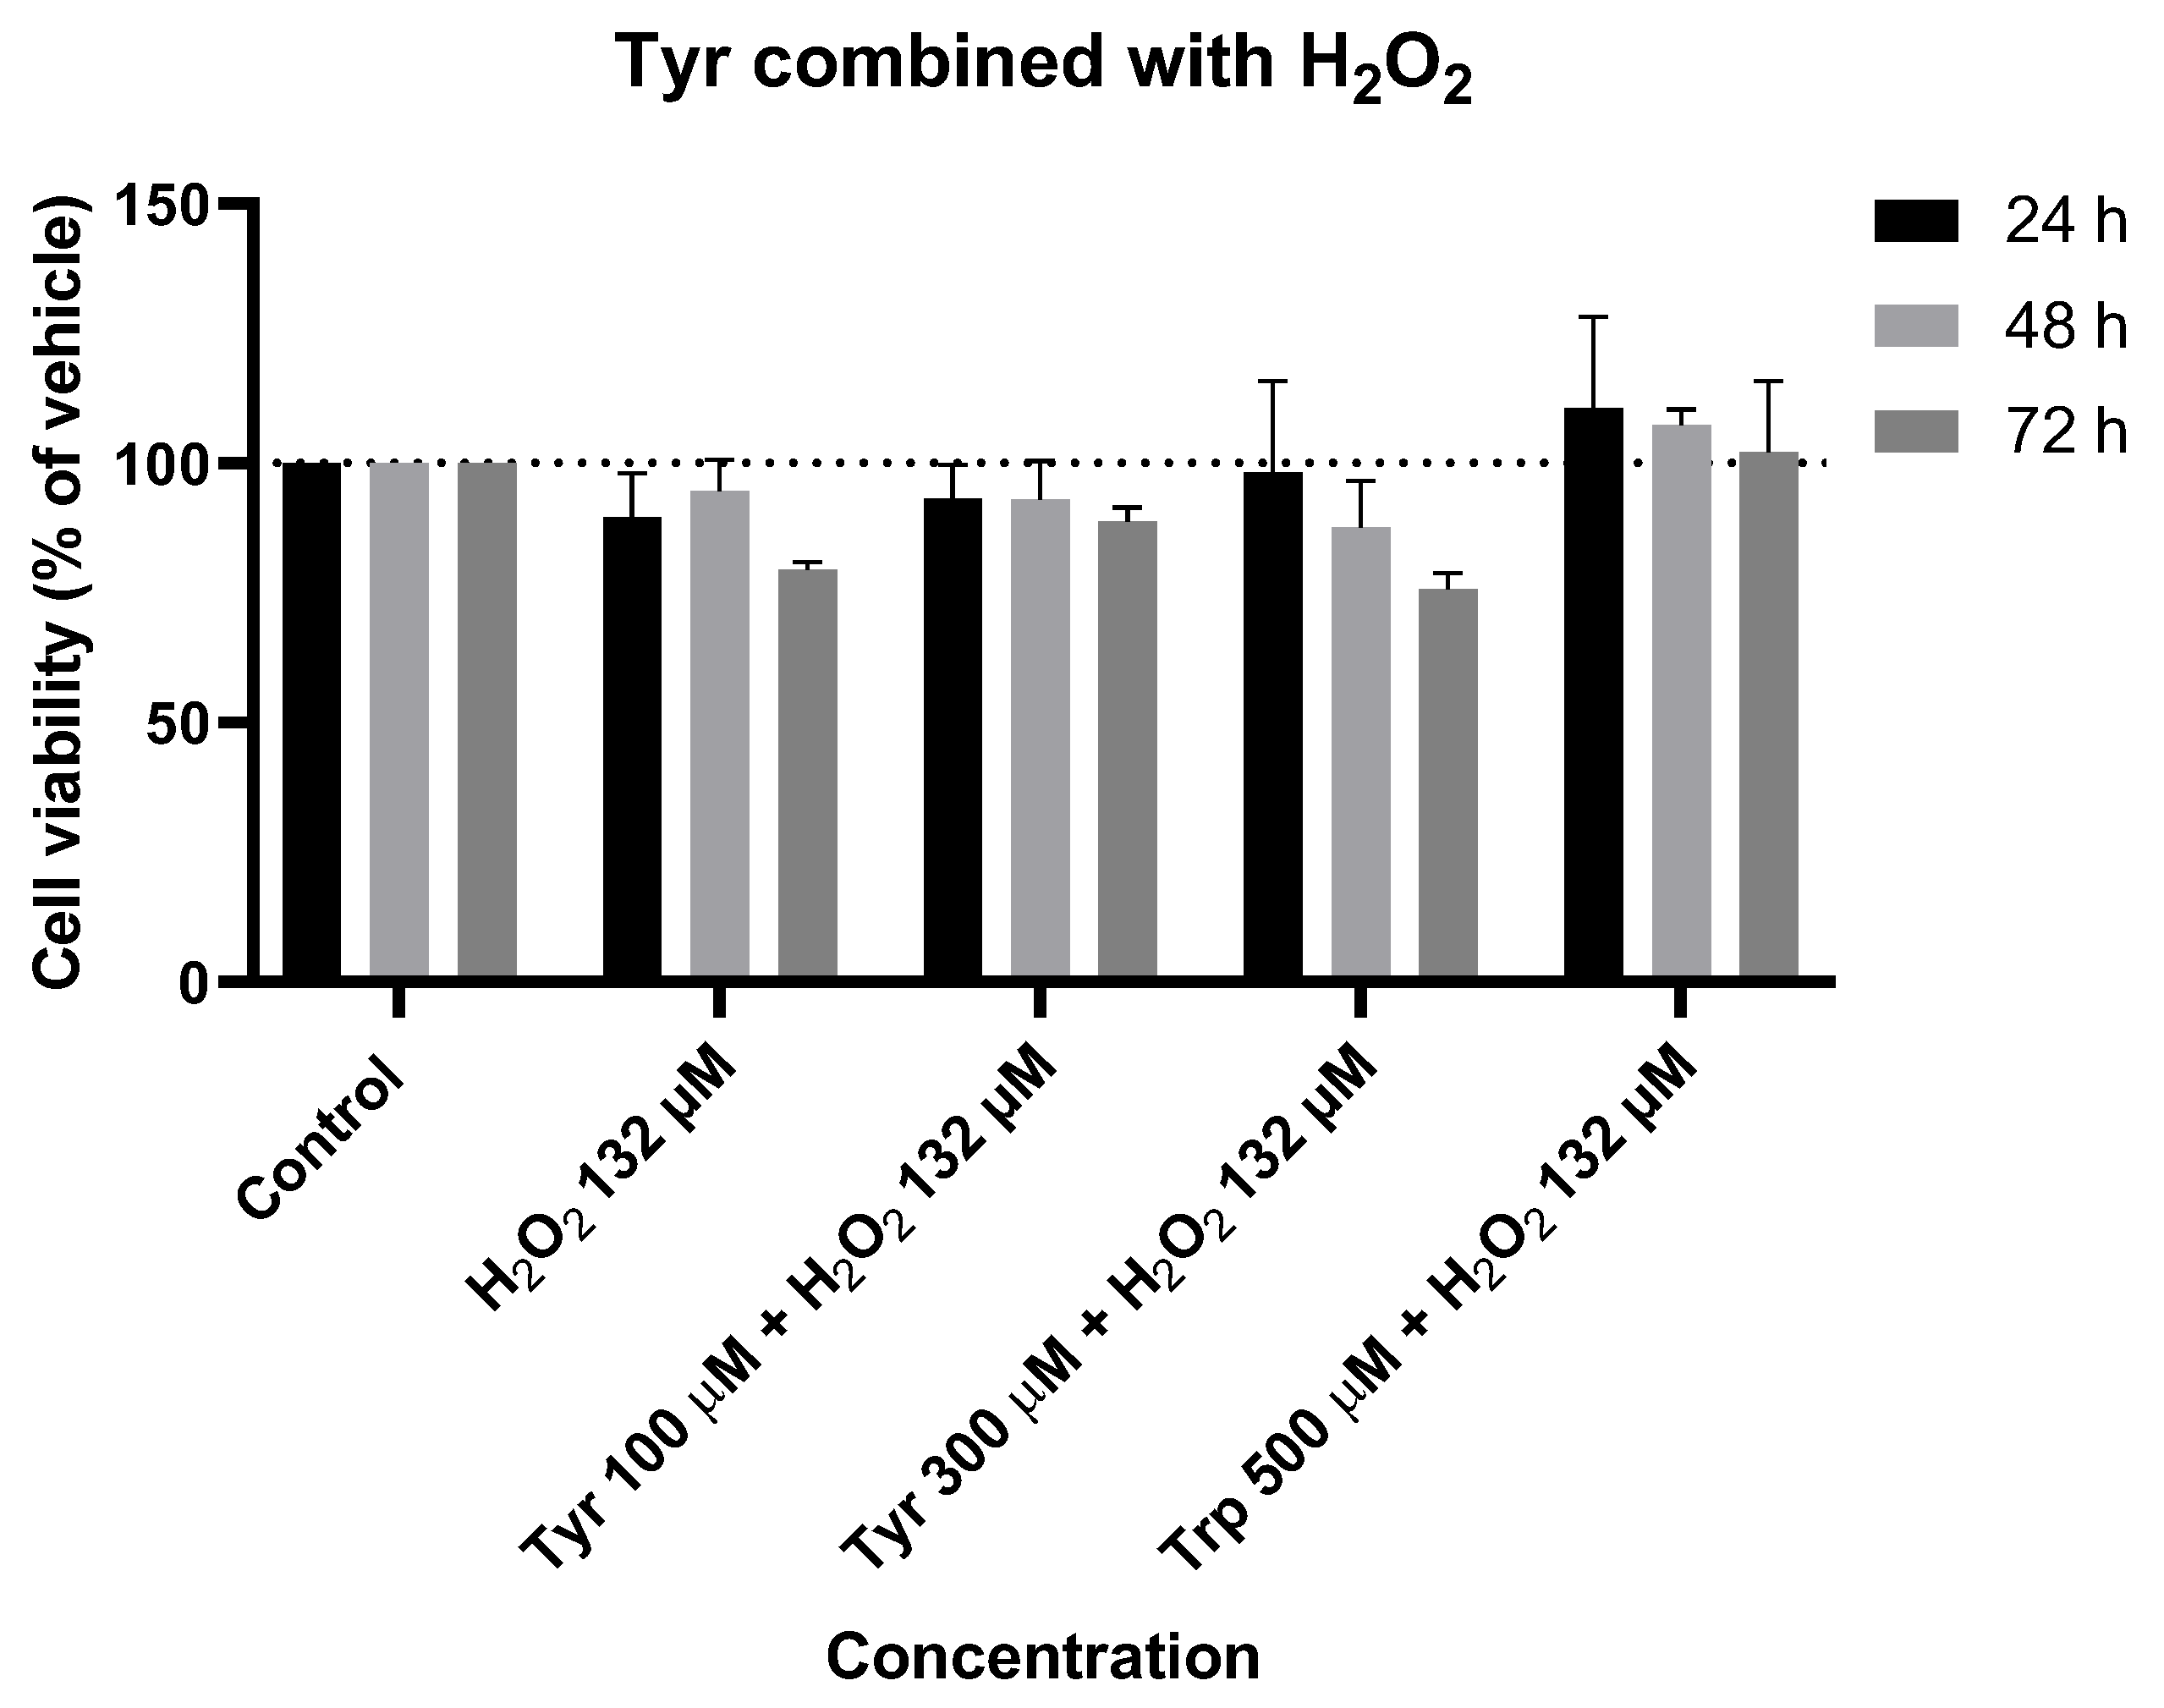
Figure 13.
Effect of Tyr combined with H2O2 on the viability of SH-SY5Y cells. The cells were cultured in the presence of increasing concentrations of IAN, exposed to a constant Trp concentration of 500 µM, and treated for 24, 48, and 72 h. Then, cell viability was determined using the MTT assay. Results are expressed as a percentage of the vehicle-treated control ± SEM of three separate experiments.
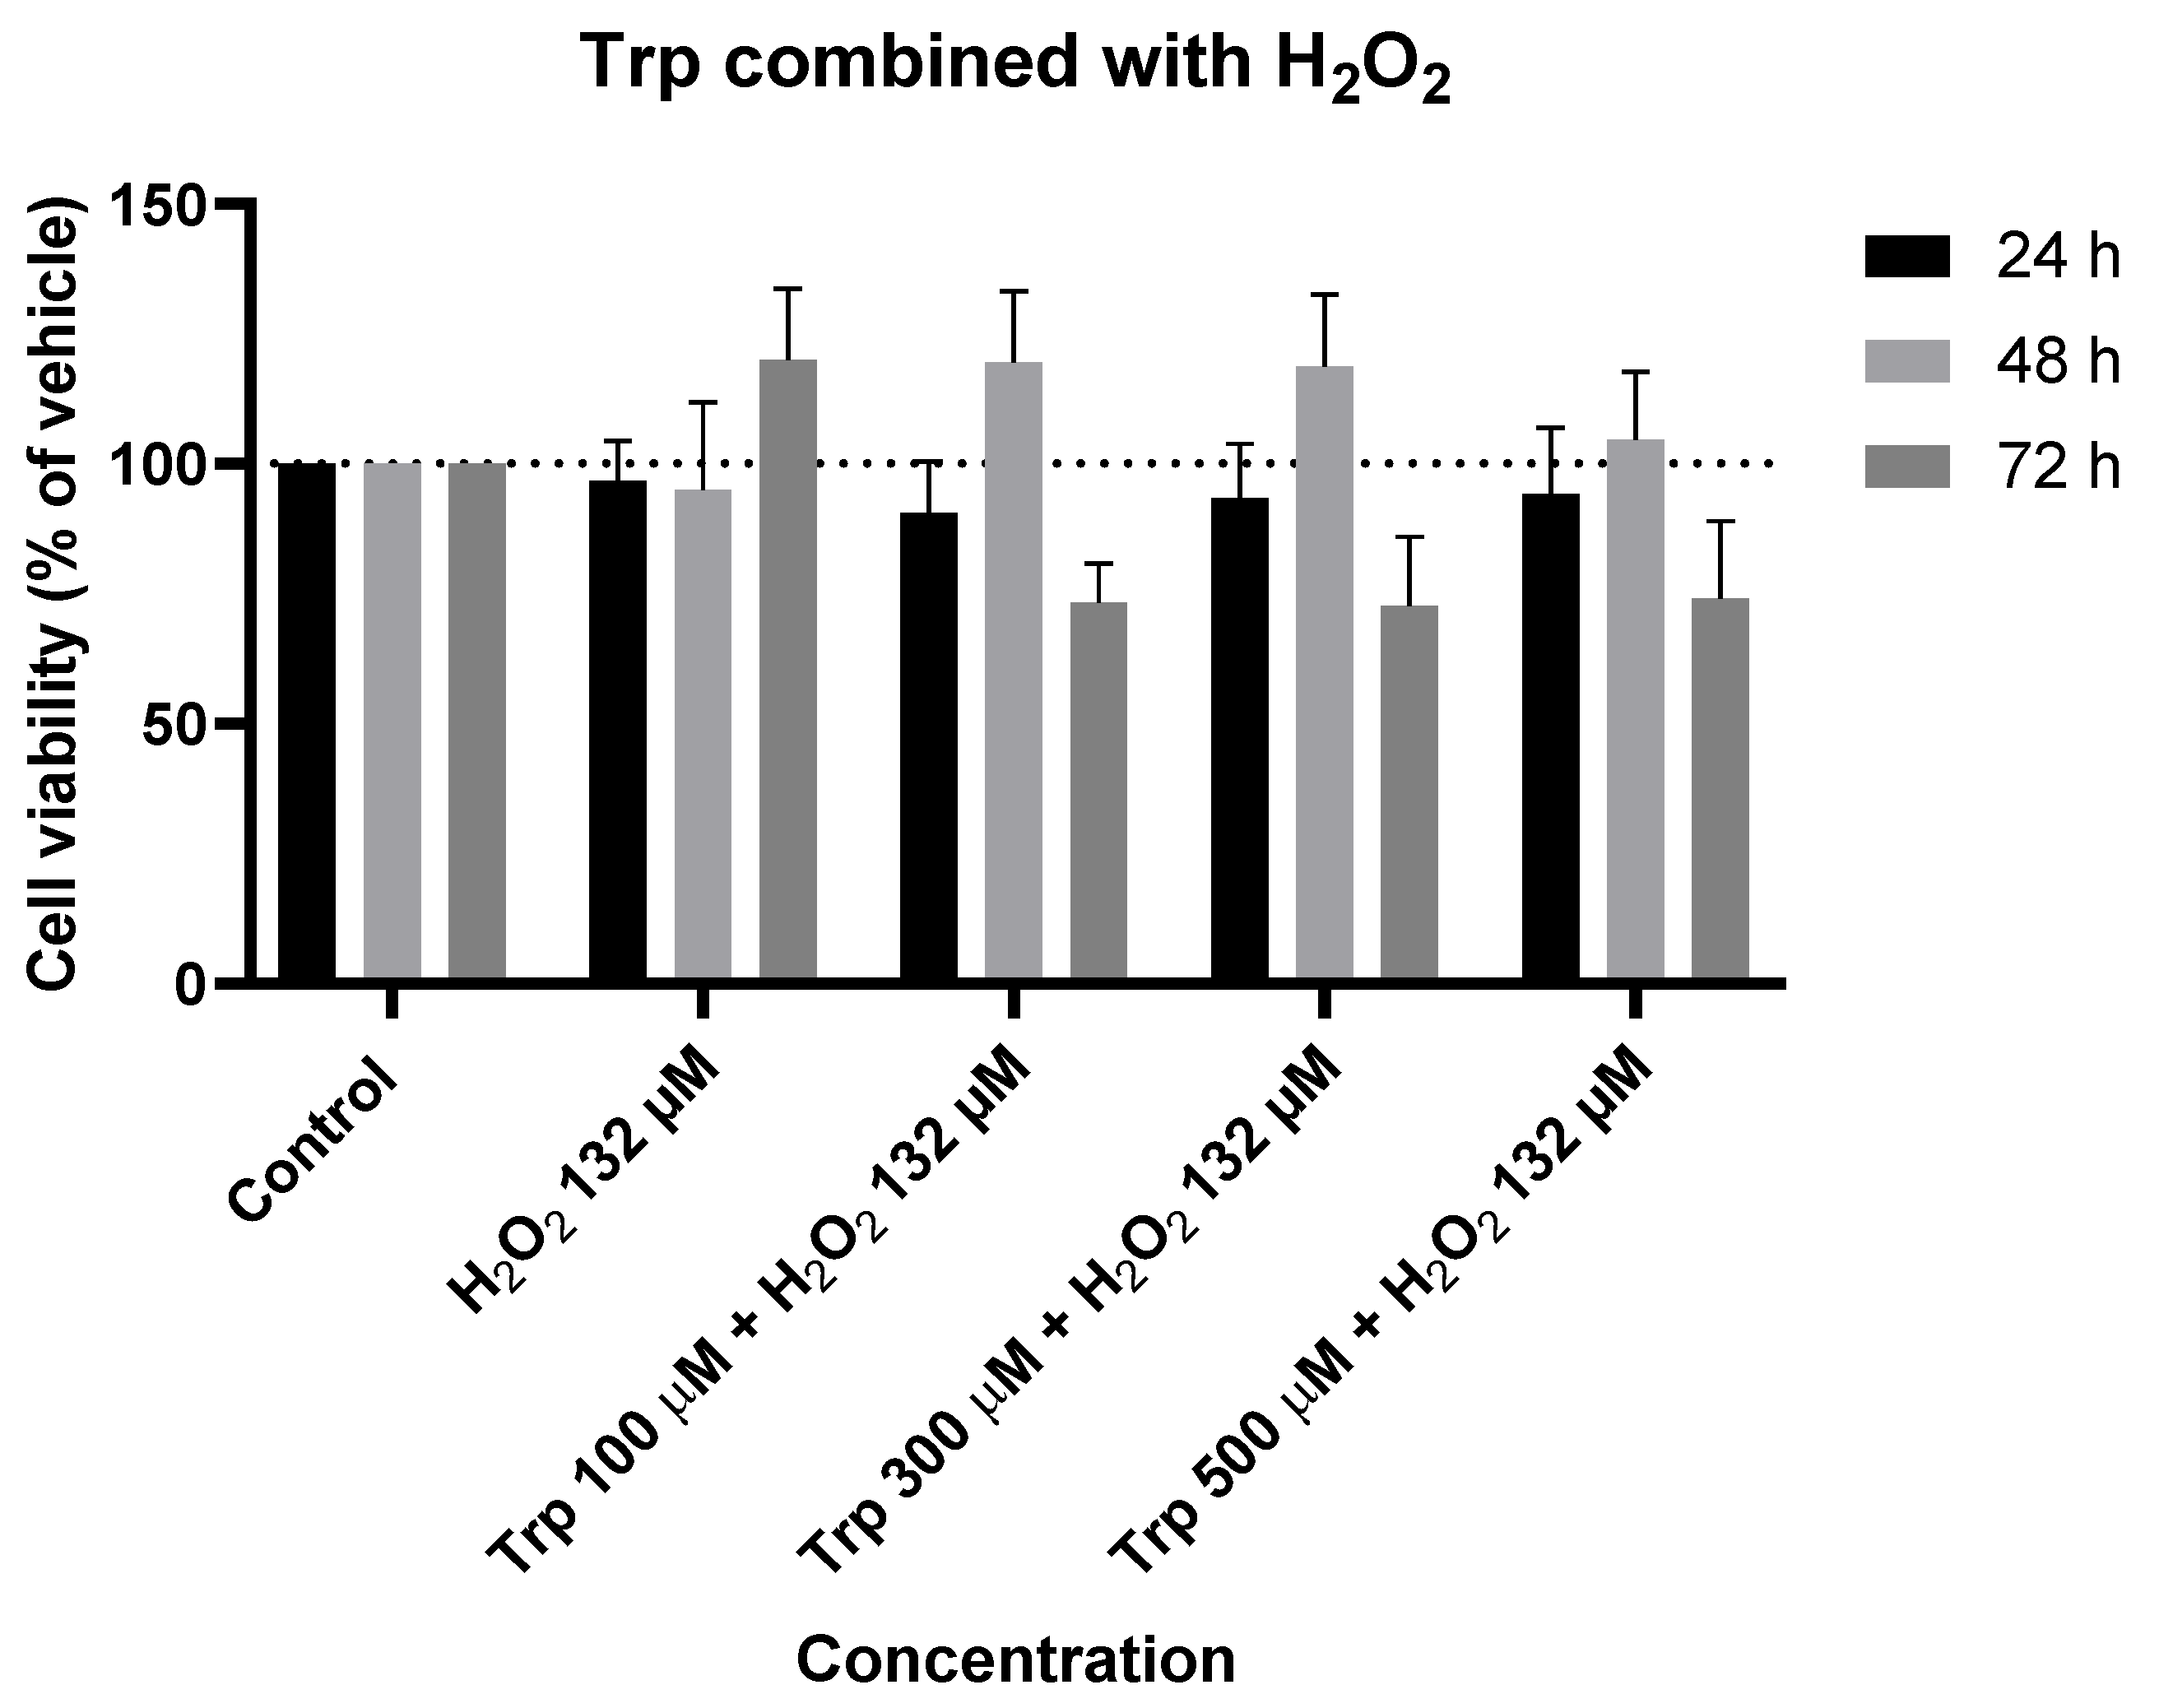
Figure 14.
Effect of Trp combined with H2O2 on the viability of SH-SY5Y cells. The cells were cultured in the presence of increasing concentrations of IAN, exposed to a constant Trp concentration of 500 µM, and treated for 24, 48, and 72 h. Then, cell viability was determined using the MTT assay. Results are expressed as a percentage of the vehicle-treated control ± SEM of three separate experiments.
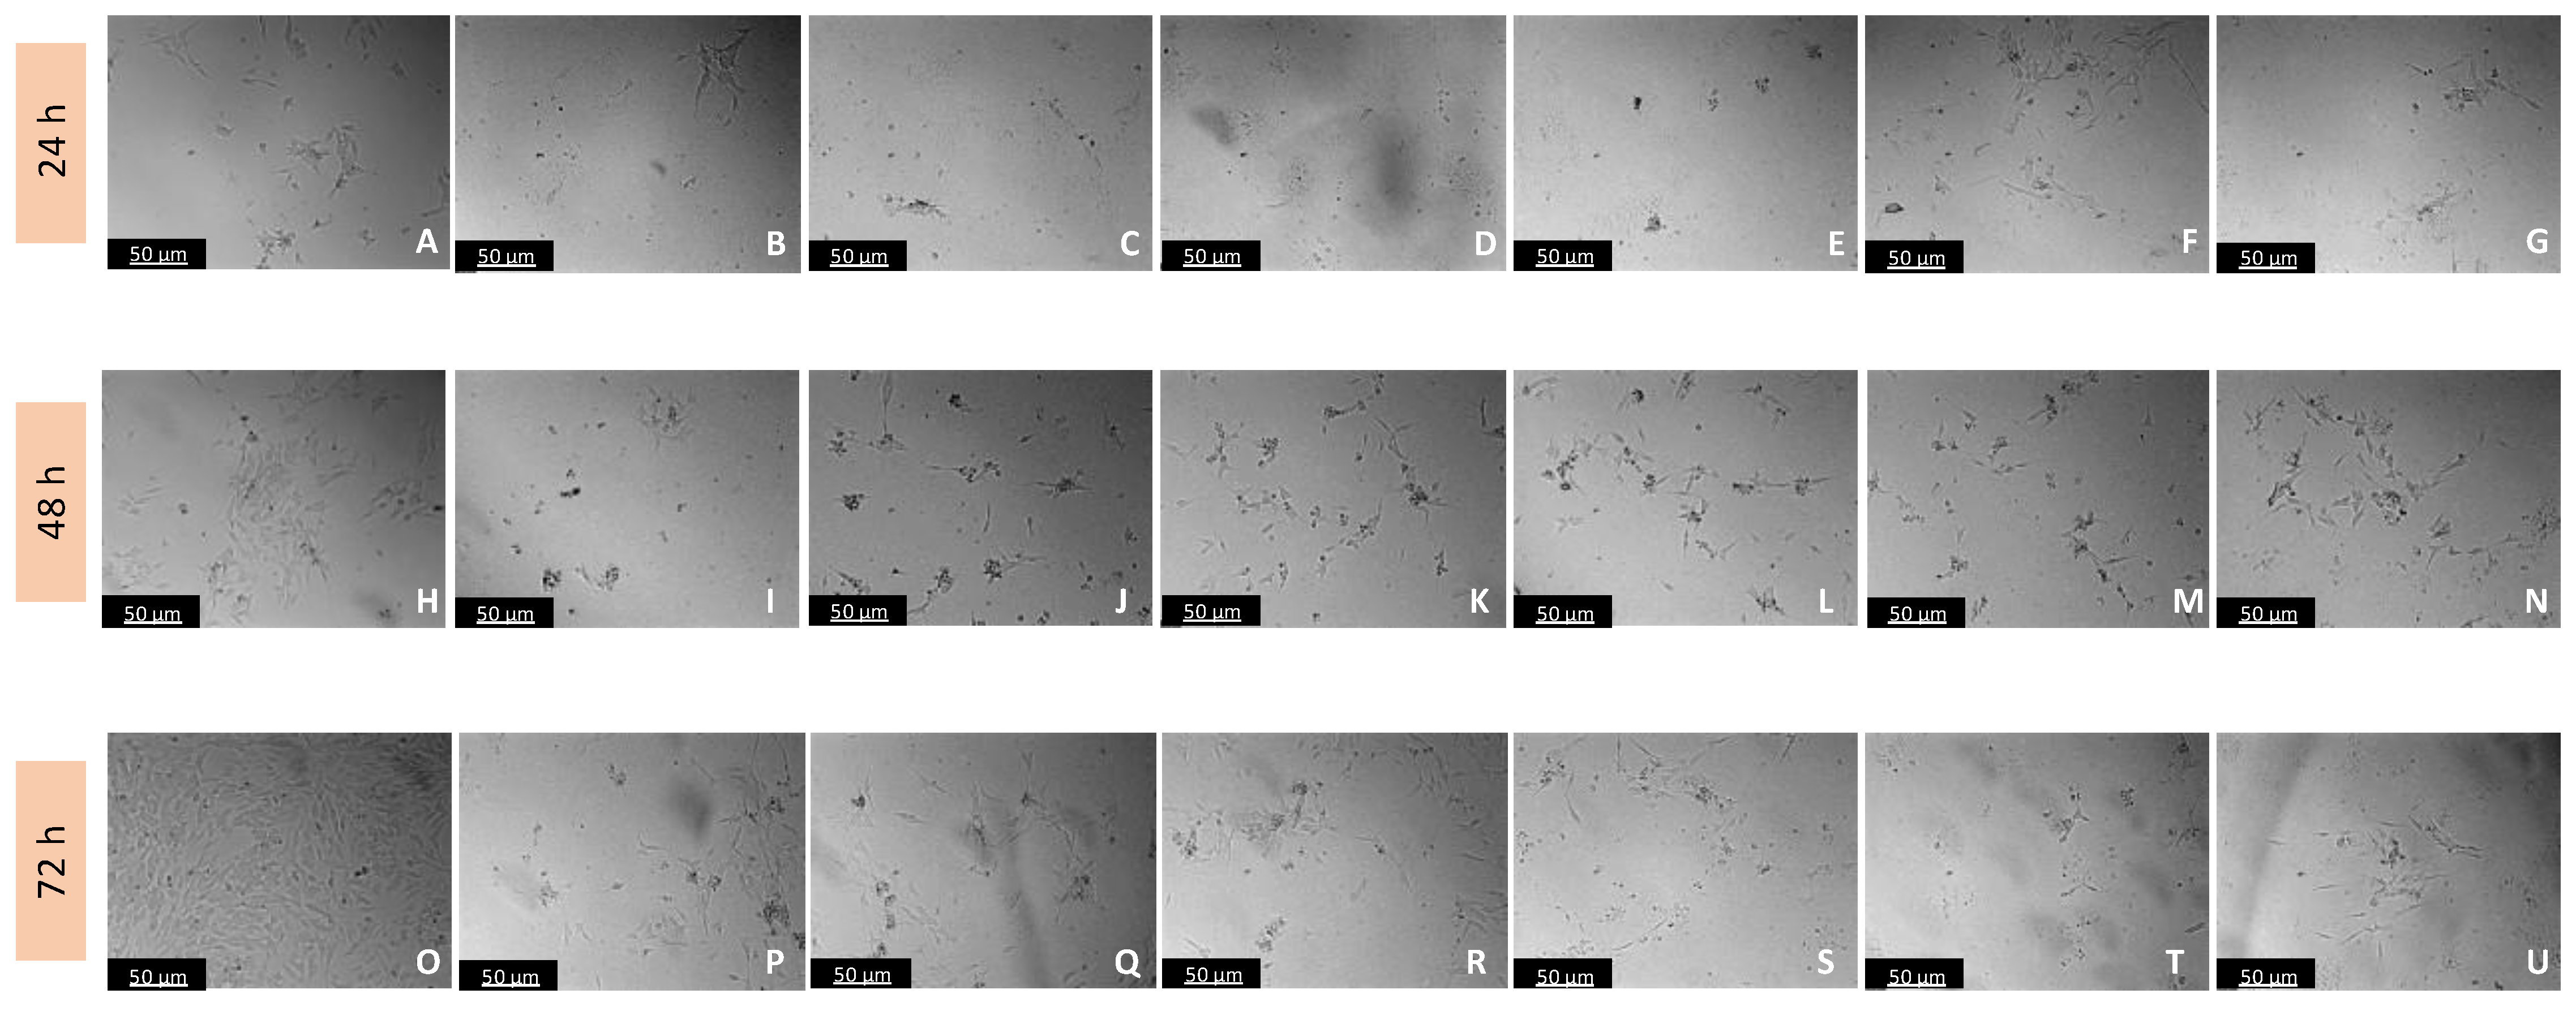
Figure 15.
Microscopic visualization of the effects of IAN combined with H2O2 on the morphology of SH-SY5Y cells over 24, 48, and 72 h. Cells were treated with (A,H,O) 0.2% DMSO (vehicle), (B,I,P) IAN 0.01 µM + H2O2 132 µM, (C,J,Q) IAN 0.1 µM + H2O2 132 µM, (D,K,R) IAN 1 µM + H2O2 132 µM, (E,L,S) IAN 10 µM + H2O2 132 µM, (F,M,T) IAN 50 µM + H2O2 132 µM, and (G,N,U) IAN 100 µM + H2O2 132 µM. Representative images were obtained with 100× total magnification from three independent experiments. Scale bar: 50 µM.
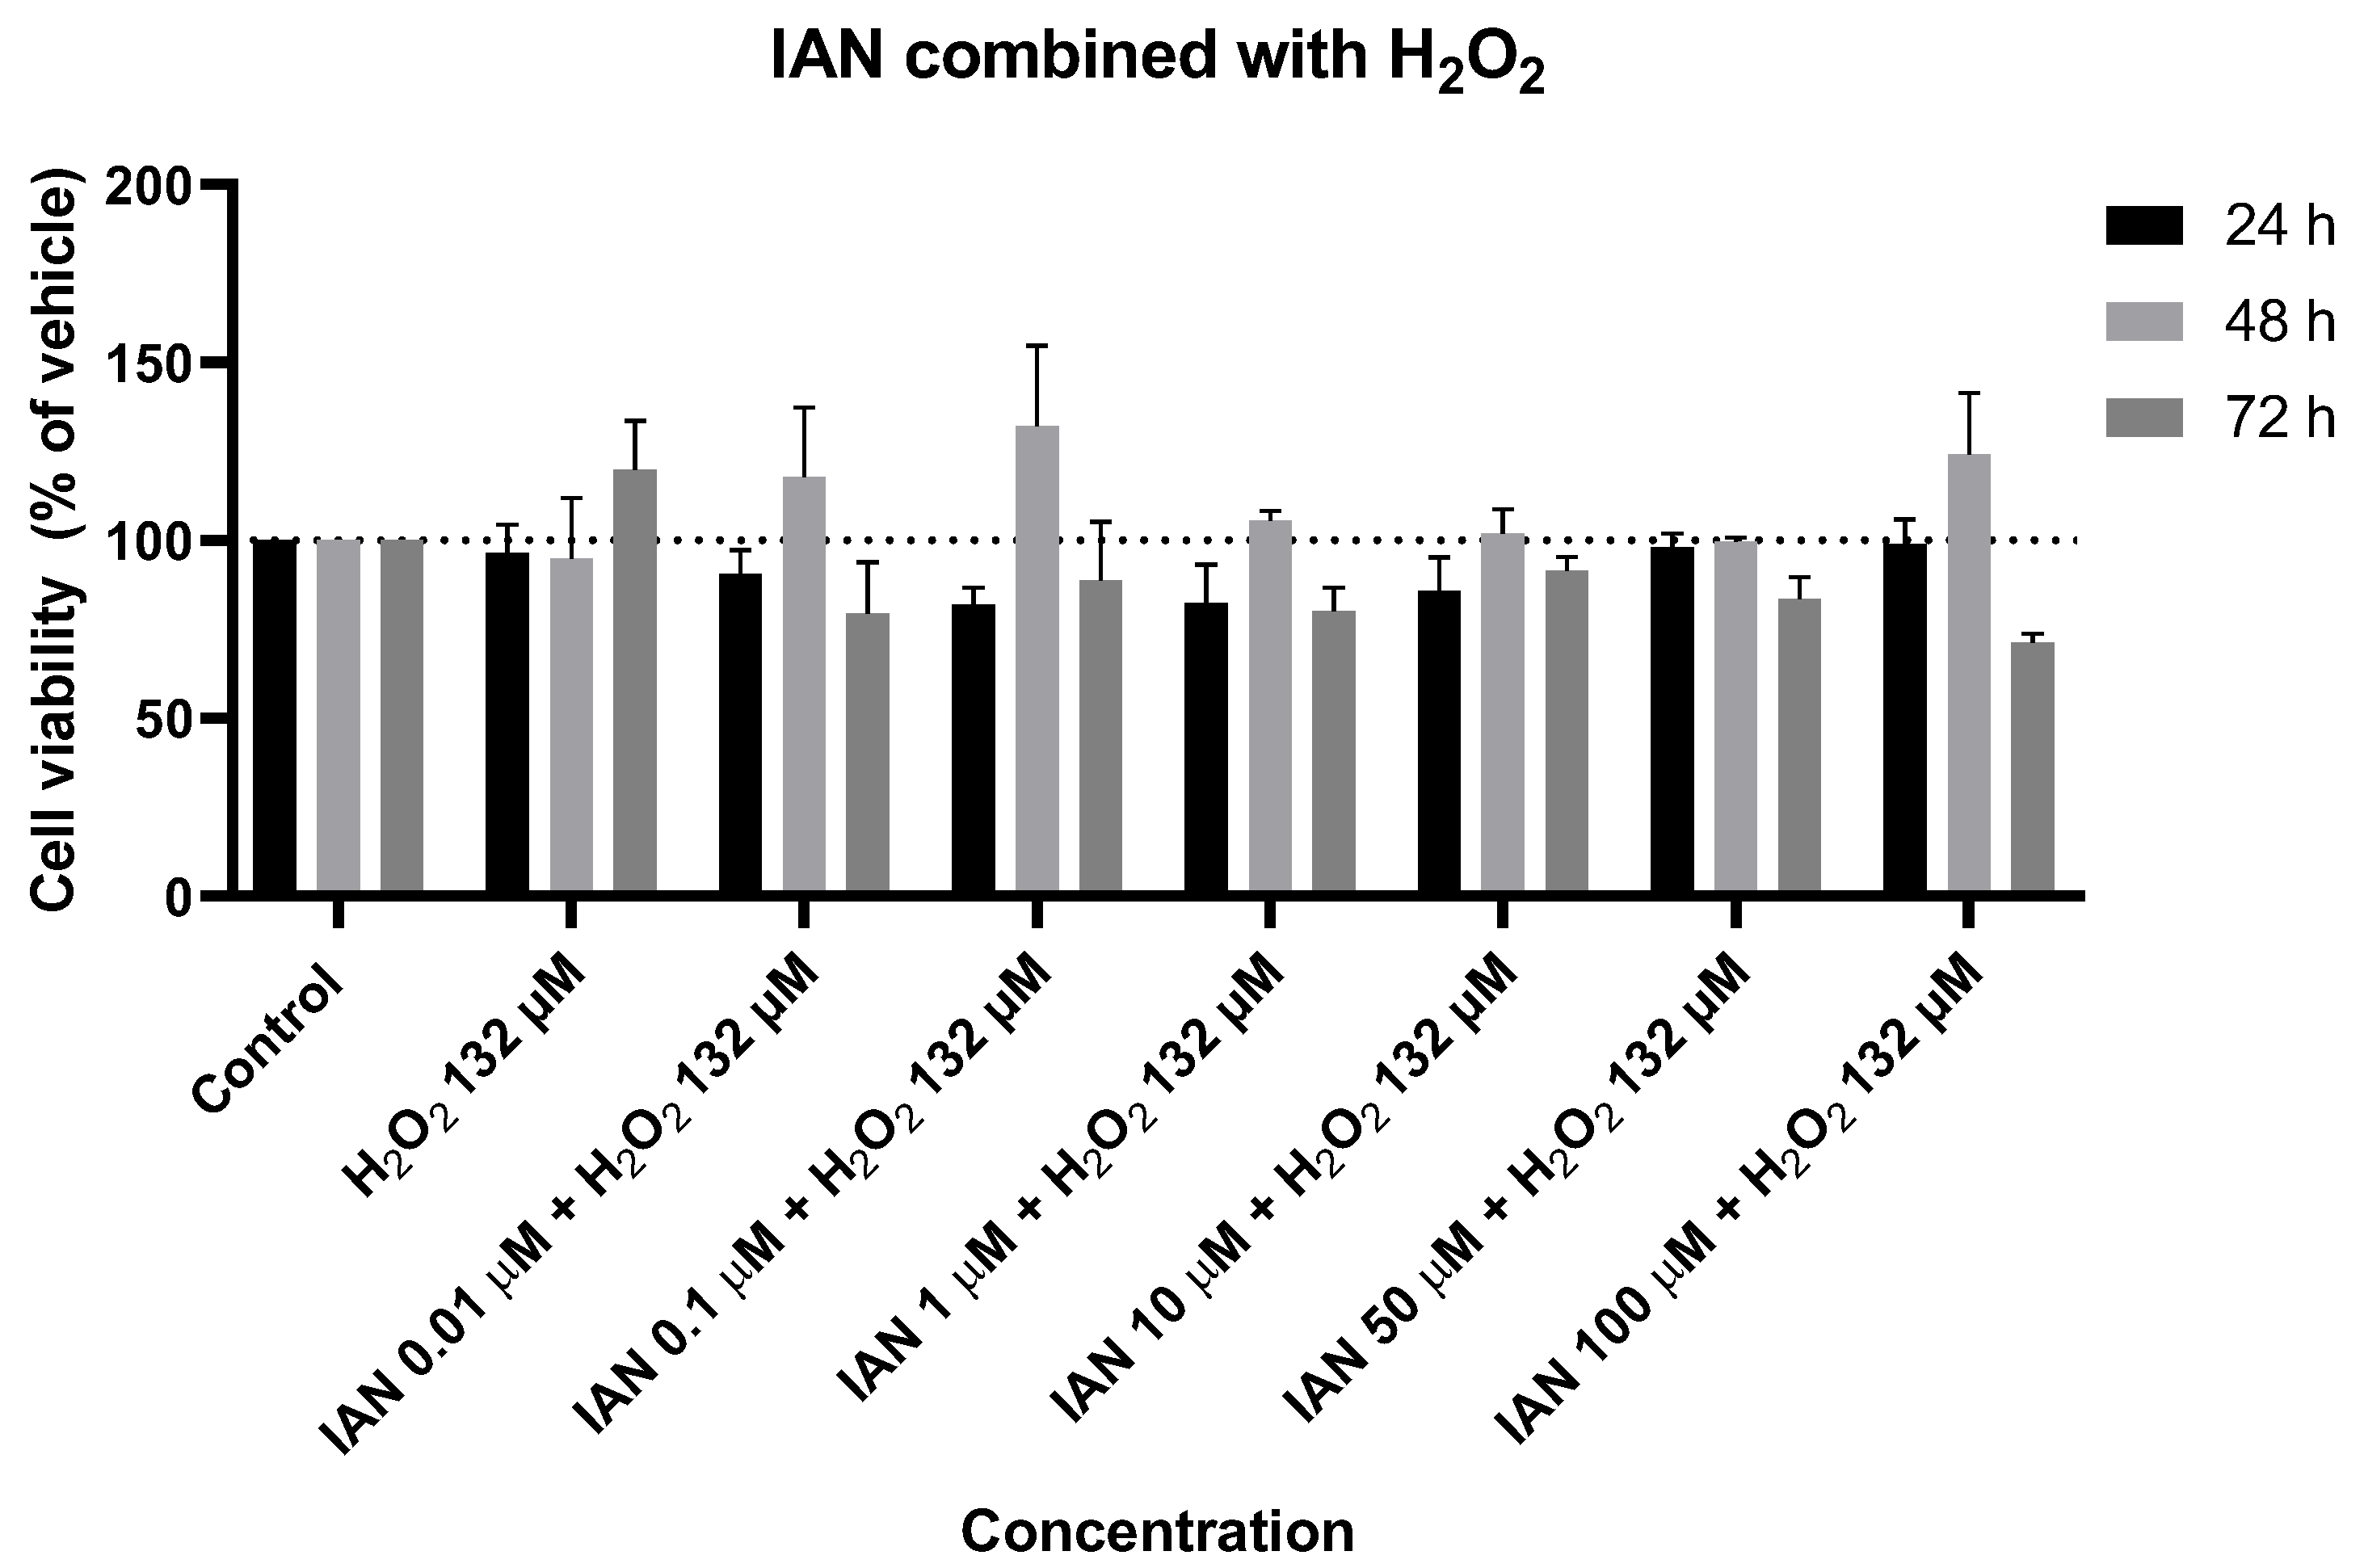
Figure 16.
Effect of IAN combined with H2O2 on the viability of SH-SY5Y cells. The cells were cultured in the presence of increasing concentrations of IAN, exposed to a constant H2O2 concentration of 132 µM, and treated for 24, 48, and 72 h. Then, cell viability was determined using the MTT assay. Results are expressed as a percentage of the vehicle-treated control ± SEM of three separate experiments.
Figure 17.
Microscopic visualization of the effects of IAN combined with Tyr and with H2O2 on the morphology of SH-SY5Y cells over 24, 48, and 72 h. Cells were treated with (A,H,O) 0.3% DMSO (vehicle), (B,I,P) IAN 0.01 µM + Tyr 500 µM + H2O2 132 µM, (C,J,Q) IAN 0.1 µM + Tyr 500 µM + H2O2 132 µM, (D,K,R) IAN 1 µM + Tyr 500 µM + H2O2 132 µM, (E,L,S) IAN 10 µM + Tyr 500 µM + H2O2 132 µM, (F,M,T) IAN 50 µM + Tyr 500 µM + H2O2 132 µM, and (G,N,U) IAN 100 µM + Tyr 500 µM + H2O2 132 µM. The presence of black lines in the images is attributed to the precipitation of Tyr in the medium when added at its maximum concentration. Representative images were obtained with 100× total magnification from three independent experiments. Scale bar: 50 µM.
Figure 18.
Microscopic visualization of the effects of IAN combined with Trp and with H2O2 on the morphology of SH-SY5Y cells over 24, 48, and 72 h. Cells were treated with (A,H,O) 0.3% DMSO (vehicle), (B,I,P) IAN 0.01 µM + Trp 500 µM + H2O2 132 µM, (C,J,Q) IAN 0.1 µM + Trp 500 µM + H2O2 132 µM, (D,K,R) IAN 1 µM + Trp 500 µM + H2O2 132 µM, (E,L,S) IAN 10 µM + Trp 500 µM + H2O2 132 µM, (F,M,T) IAN 50 µM + Trp 500 µM + H2O2 132 µM, and (G,N,U) IAN 100 µM + Trp 500 µM + H2O2 132 µM. Representative images were obtained with 100× total magnification from three independent experiments. Scale bar: 50 µM.
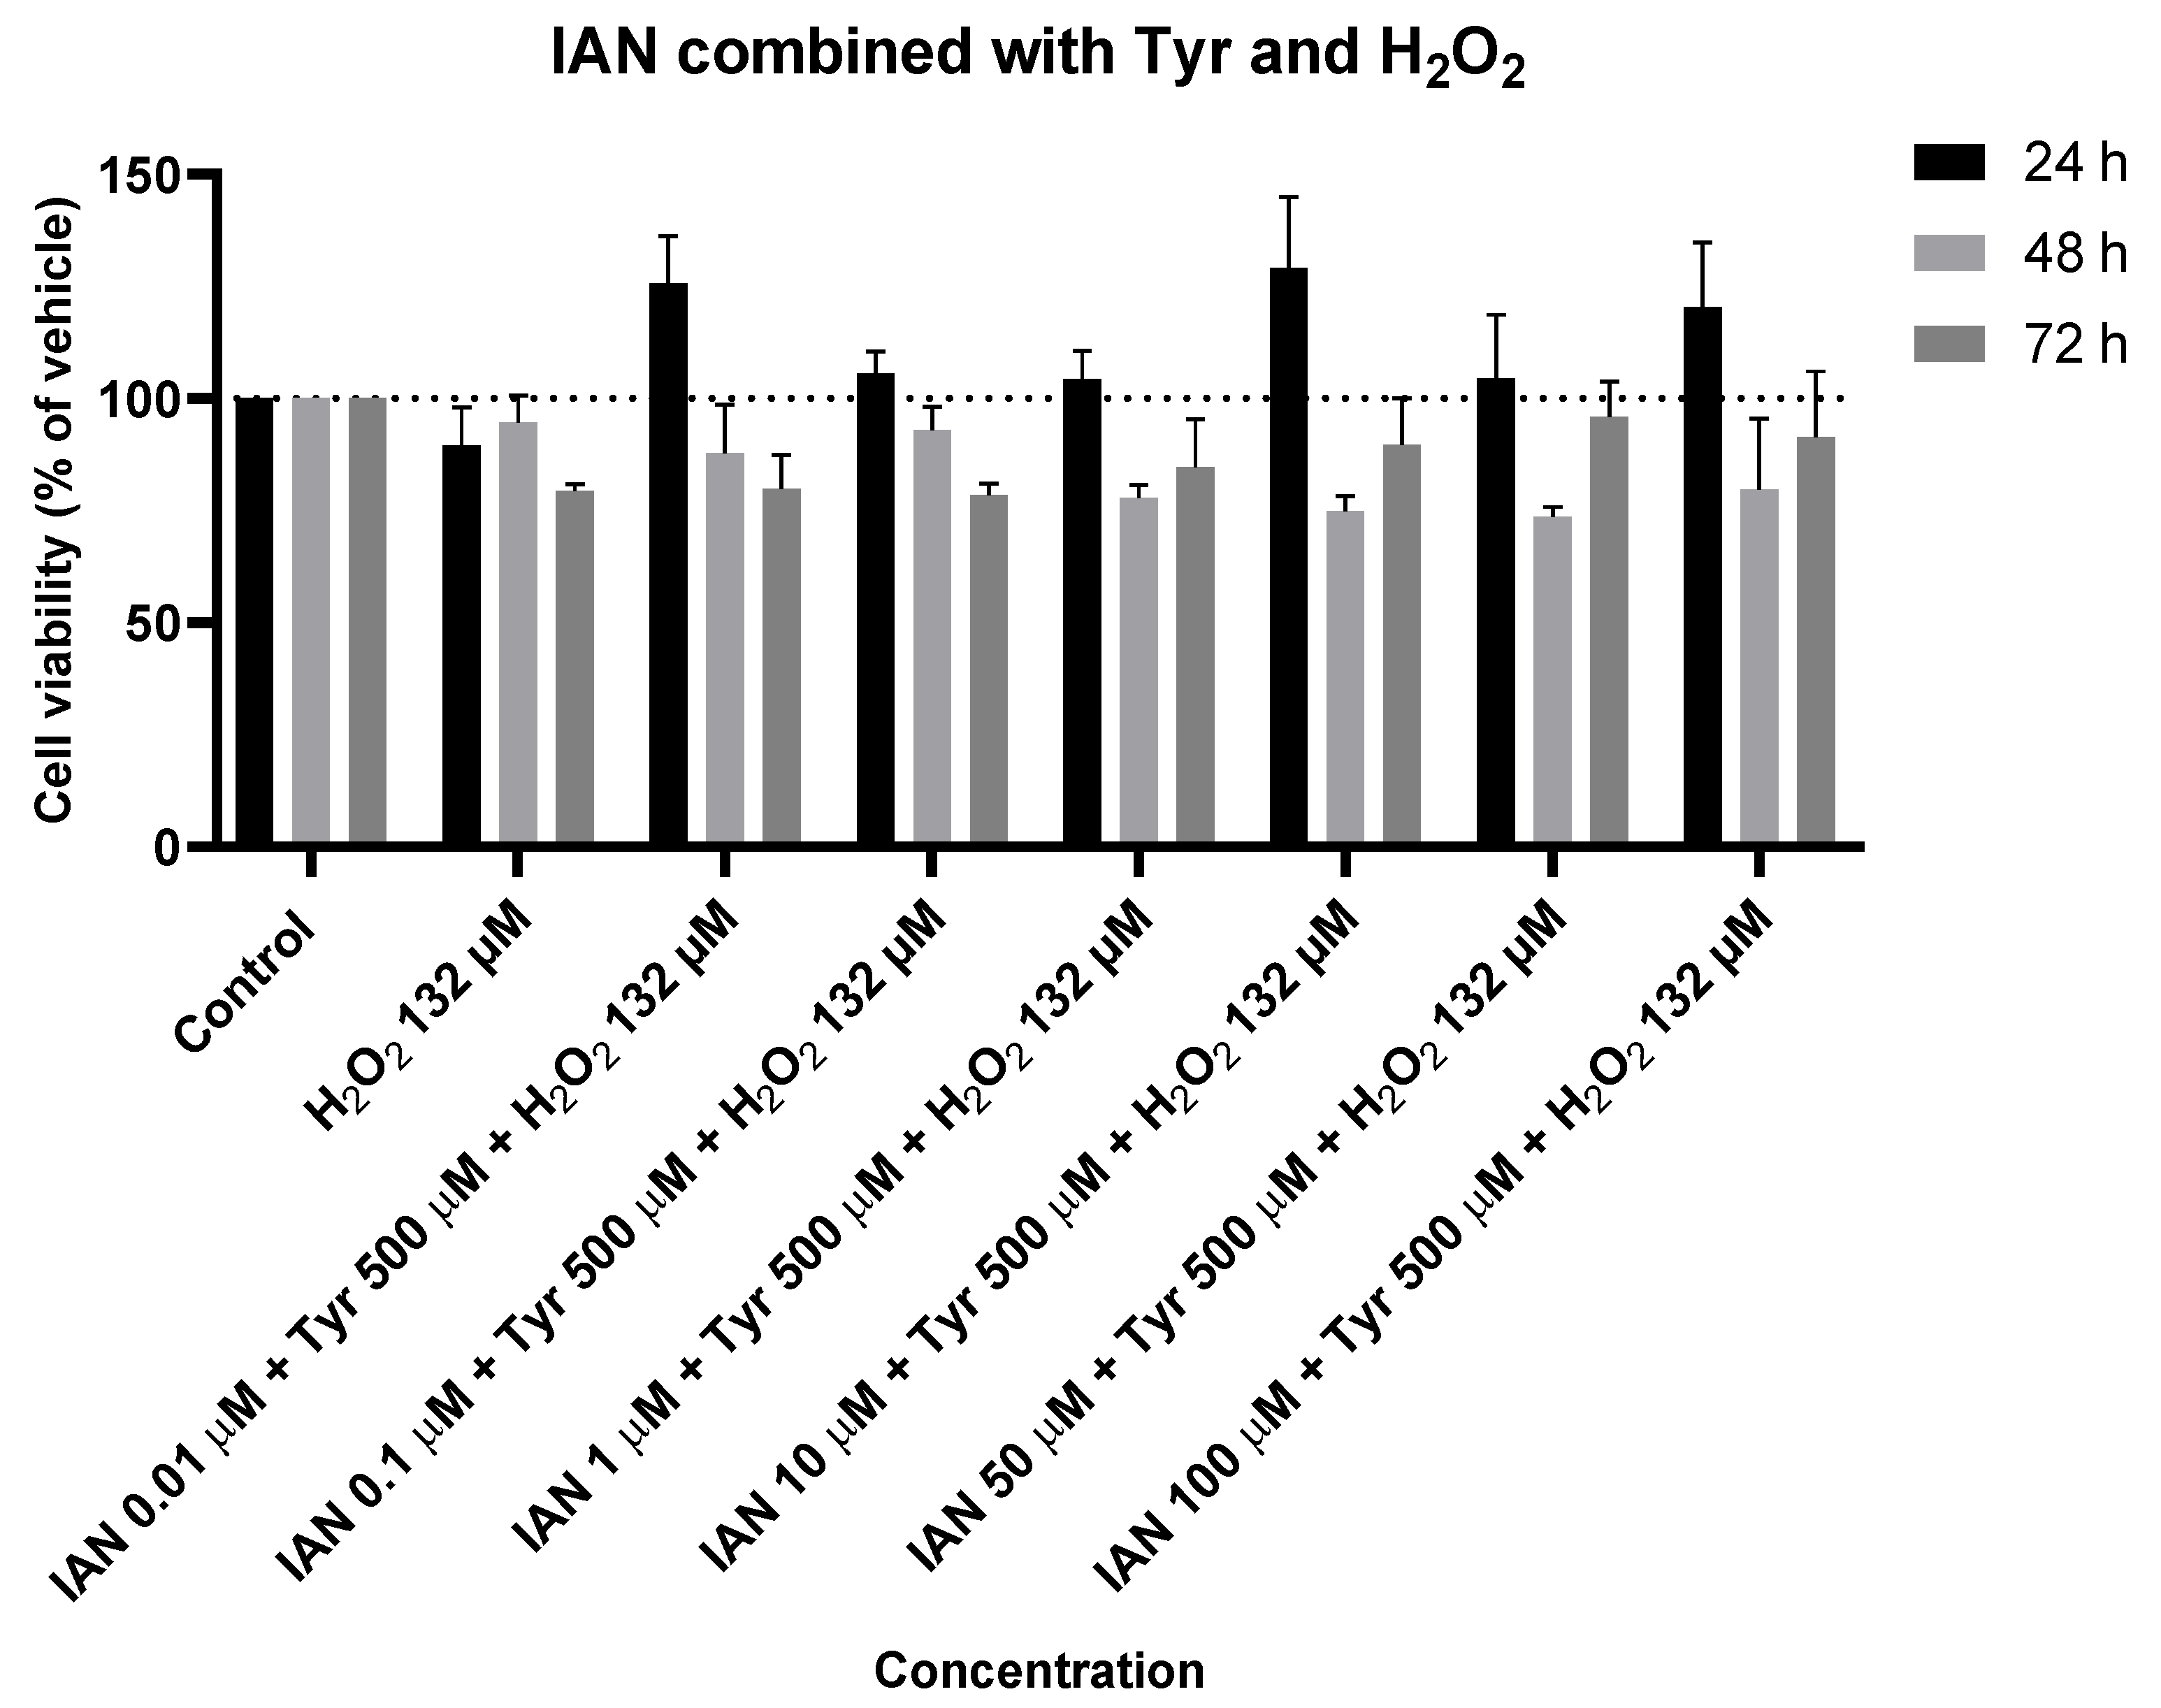
Figure 19.
Effect of IAN combined with Tyr and with H2O2 on the viability of SH-SY5Y cells. The cells were cultured in the presence of increasing concentrations of IAN, maintaining a constant Tyr concentration of 500 µM and a fixed H2O2 concentration of 132 µM, and treated for 24, 48, and 72 h. Then, cell viability was determined using the MTT assay. Results are expressed as a percentage of the vehicle-treated control ± SEM of three separate experiments.
Figure 20.
Effect of IAN combined with Trp and with H2O2 on the viability of SH-SY5Y cells. The cells were cultured in the presence of increasing concentrations of IAN, maintaining a constant Trp concentration of 500 µM and a fixed H2O2 concentration of 132 µM, and treated for 24, 48, and 72 h. Then, cell viability was determined using the MTT assay. Results are expressed as a percentage of the vehicle-treated control ± SEM of three separate experiments. * Statistically significant vs. control at p < 0.05.
Table 1.
Percentage of SH-SY5Y cells at different conditions using Trp, IAN, combinations of both, and combinations of both with H2O2 evaluated at 24 and 72 h.
Table 1.
Percentage of SH-SY5Y cells at different conditions using Trp, IAN, combinations of both, and combinations of both with H2O2 evaluated at 24 and 72 h.
| Conditions | % of Cells at 24 h | % of Cells at 72 h |
|---|
| Control | 100 | 100 |
| Trp 500 µM | 116 | 103 |
| IAN 100 µM | 94 | 88 |
| Trp 500 µM + IAN 100 µM | 99 | 85 |
| Trp 500 µM + H2O2 132 µM | 94 | 74 |
| IAN 100 µM + H2O2 132 µM | 99 | 71 |
| Trp 500 µM + IAN 100 µM + H2O2 132 µM | 86 | 79 |
Table 2.
Percentage of SH-SY5Y cells at different conditions using Tyr, IAN, combinations of both, and combinations of both with H2O2 evaluated at 24 and 72 h.
Table 2.
Percentage of SH-SY5Y cells at different conditions using Tyr, IAN, combinations of both, and combinations of both with H2O2 evaluated at 24 and 72 h.
| Conditions | % of Cells at 24 h | % of Cells at 72 h |
|---|
| Control | 100 | 100 |
| Tyr 500 µM | 106 | 83 |
| IAN 100 µM | 94 | 88 |
| Tyr 500 µM + IAN 100 µM | 99 | 84 |
| Tyr 500 µM + H2O2 132 µM | 111 | 102 |
| IAN 100 µM + H2O2 132 µM | 99 | 71 |
| Tyr 500 µM + IAN 100 µM + H2O2 132 µM | 120 | 91 |


