Article

Cannabidiol Modulates M-Type K+ and Hyperpolarization-Activated Cation Currents

1
Department of Anesthesiology, Kaohsiung Medical University Hospital, Kaohsiung 80756, Taiwan
2
Department of Anesthesiology, School of Post-Baccalaureate, College of Medicine, Kaohsiung Medical University, Kaohsiung 80756, Taiwan
3
Department of Anesthesiology, National Cheng Kung University Hospital, College of Medicine, National Cheng Kung University, Tainan 701401, Taiwan
4
Department of Anesthesia, An-Nan Hospital, China Medical University, Tainan 70965, Taiwan
5
Department of Physiology, National Cheng Kung University Medical College, Tainan 70101, Taiwan
6
School of Medicine, National Sun-Yat Sen University College of Medicine, Kaohsiung 80424, Taiwan
7
Department of Research and Education, An-Nan Hospital, China Medical University, Tainan 70965, Taiwan
*
Author to whom correspondence should be addressed.
Biomedicines 2023, 11(10), 2651; https://doi.org/10.3390/biomedicines11102651
Submission received: 3 August 2023 / Revised: 15 September 2023 / Accepted: 19 September 2023 / Published: 27 September 2023

Abstract

:
Cannabidiol (CBD) is a naturally occurring compound found in the Cannabis plant that is known for its potential therapeutic effects. However, its impact on membrane ionic currents remains a topic of debate. This study aimed to investigate how CBD modifies various types of ionic currents in pituitary GH3 cells. Results showed that exposure to CBD led to a concentration-dependent decrease in M-type K+ currents (IK(M)), with an IC50 of 3.6 μM, and caused the quasi-steady-state activation curve of the current to shift to a more depolarized potential with no changes in the curve’s steepness. The CBD-mediated block of IK(M) was not reversed by naloxone, suggesting that it was not mediated by opioid receptors. The IK(M) elicited by pulse-train stimulation was also decreased upon exposure to CBD. The magnitude of erg-mediated K+ currents was slightly reduced by adding CBD (10 μM), while the density of voltage-gated Na+ currents elicited by a short depolarizing pulse was not affected by it. Additionally, CBD decreased the magnitude of hyperpolarization-activated cation currents (Ih) with an IC50 of 3.3 μM, and the decrease was reversed by oxaliplatin. The quasi-steady-state activation curve of Ih was shifted in the leftward direction with no changes in the slope factor of the curve. CBD also diminished the strength of voltage-dependent hysteresis on Ih elicited by upright isosceles-triangular ramp voltage. Collectively, these findings suggest that CBD’s modification of ionic currents presented herein is independent of cannabinoid or opioid receptors and may exert a significant impact on the functional activities of excitable cells occurring in vitro or in vivo.

1. Introduction

Cannabidiol (CBD) is a non-psychoactive cannabinoid derived from the Cannabis plant, known for its potential therapeutic effects. It is among over 100 cannabinoids present in the plant and has been shown to be effective in treating various medical conditions, such as epilepsy, bipolar disorder, inflammation, and cancer [1,2,3,4,5]. Recent studies have demonstrated that CBD can modify the activity in the hypothalamic–pituitary–adrenal axis [6,7] and can modulate different types of transmembrane ionic currents in electrically excitable cells, including the voltage-gated Na+ current (INa) and the M-type K+ currents (IK(M)) [5,8,9]. Thus, further clarification is necessary to determine the effects of CBD or related compounds on ionic currents present in the membranes of electrically excitable cells.
The KCNQ2, KCNQ3, and KCNQ5 genes encode the core subunits of KV7.2, KV7.3, and KV7.5 channels, respectively [10]. These potassium (K+) channels, when activated, generate the M-type K+ current (IK(M)), which is characterized by its low threshold voltage activation and by slow activation and deactivation properties [11,12]. The modulation of IK(M) has gained significant recognition as an additional therapeutic approach for treating a range of neurological disorders characterized by excessive neuronal activity. These disorders encompass conditions like cognitive dysfunction, neuropathic pain, and epilepsy [10,13,14,15]. Furthermore, the magnitude of IK(M) is believed to regulate the availability of voltage-gated Na+ (NaV) channels during prolonged high-frequency firing [16]. Previous studies have shown that CBD can modify the magnitude of IK(M) [9,17]. However, it is still largely unclear whether and how exposure to CBD can perturb the magnitude or gating properties of IK(M).
The hyperpolarization-activated cation current (Ih), also known as the “funny current” (If), plays a crucial role in regulating repetitive electrical activity in cardiac cells, various types of central neurons, and endocrine or neuroendocrine cells [11,18,19,20,21]. This ionic current exhibits unique characteristics, including slow voltage-dependent activation kinetics and a mixed Na+/K+ current that flows inwardly, and it can be blocked by CsCl or ivabradine [20,22]. Activation of Ih may lead to depolarization of the resting potential, reaching the threshold required for generating or triggering an action potential. Consequently, it influences pacemaker activity and impulse propagation [22]. Additionally, the slow kinetics of Ih in response to prolonged hyperpolarization can result in long-lasting, activity-dependent modulation of membrane excitability across various types of excitable cells [23]. Ih is mediated by channels encoded by members of the hyperpolarization-activated cyclic-nucleotide-gated (HCN) gene family, and studies have demonstrated that the activity of these channels underlies the ionic mechanisms associated with both convulsive disorders and inflammatory pain disorders [24,25,26].
Therefore, based on the aforementioned information, our aim was to investigate the effects of CBD or other related compounds on perturbations in various ionic currents (such as INa, IK(M), Ih, and IK(erg)) in pituitary GH3 cells. The findings from this study highlight the evidence showing that CBD can directly and effectively inhibit the magnitude of IK(M) and Ih in a concentration- and voltage-dependent manner. Such suppression of ionic currents appears to be direct and is highly unlikely to be linked to its binding to cannabinoid receptors.

2. Materials and Methods

2.1. Chemicals, Drugs, and Solutions Used for This Work

Cannabidiol (CBD, 2-[(1R,6R)-3-methyl-6-(prop-1-en-2-yl)cyclohex-2-en-1-yl]-5-pentylbenzene-1,3-diol) and cannabichromene were acquired from Sigma-Aldrich (Cerilliant Corp., Darmstadt, Germany). Linopirdine (Lino), naloxone, NS1643, oxaliplatin (OXAL), tefluthrin (Tef), tetraethylammonium chloride (TEA), tetrodotoxin (TTX), and thyrotropin-releasing hormone (TRH) were supplied by Sigma-Aldrich (Merck, Darmstadt, Germany). Liraglutinide was obtained from Novo Nordisk® (Bagsværd, Denmark), telmisartan (TEL) was obtained from Tocris (Bristol, UK), and liraglutinide (Saxenda®) was obtained from MedChemExpress (Genechain, Kaohsiung, Taiwan).
Unless stated otherwise, the cell culture materials, such as Ham’s F-12 medium, L-glutamine, horse serum, and fetal calf serum, were obtained from HyCloneTM (Thermo Fisher; Level Biotech, Tainan, Taiwan). All other chemicals and reagents, such as CdCl2, CsCl, CsOH, HEPES, and aspartic acid, were commercially available and of analytical reagent grade.
The HEPES-buffered normal Tyrode’s solution used in this study had the following composition (in mM): NaCl 136.5, KCl 5.4, CaCl2 1.8, MgCl2 0.53, glucose 5.5, and HEPES-NaOH buffer 5.5 (pH 7.4). For recording Ih, IK(M), or IK(erg), the recording pipettes were filled up with the following solution (in mM): K-aspartate 130, KCl 20, KH2PO4 1, MgCl2 1, EGTA 0.1, Na2ATP 3, Na2GTP 0.1, and HEPES-KOH buffer 5 (pH 7.2). To measure whole-cell IK(M) or IK(erg), high-K+ bathing solution was used with the following composition (in mM): KCl 145, MgCl2 0.53, and HEPES-KOH 5 (pH 7.4). All solutions were prepared using deionized water obtained from a Milli-Q® water purification system (APS Water Services, Inc., Van Nuys, CA, USA). On the day of use, the pipette solution and culture media were filtered through an Acrodisc® syringe filter with 0.2 μm of Supor® membrane (Palll Bio-Check, Tainan, Taiwan).

2.2. Preparation of Pituitary GH3 Cells

GH3 pituitary tumor cells, originally derived from ATCC [CCL-82TM] and obtained from the Bioresources Collection and Research Center (BCRC-60015) in Hsinchu, Taiwan, were cultured in Ham’s F-12 medium supplemented with 15% (v/v) horse serum, 2.5% (v/v) fetal calf serum, and 2 mM L-glutamine in a humidified environment with 5% CO2/95% air [19]. The verification of GH3 cells was conducted by measuring the level of prolactin in the culture medium. Experiments were conducted 5 to 6 days after the cells had reached 60–80% confluence.

2.3. Electrophysiological Recordings Using Patch-Clamp Technique

The GH3 cells were dispersed just before each measurement with care. Then, a small amount of the cell suspension was rapidly transferred to a custom-made chamber, where the cells were allowed to settle on the bottom surface. A DM-IL inverted microscope (Leica; Highrise Instrument, Taichung, Taiwan) was used to monitor cell size during the experiments. A custom-made chamber was tightly placed on the microscope’s stage, and a video camera system with a magnification of 1500× was connected to the microscope. The cells that were examined were maintained in a bath of normal Tyrode’s solution with a concentration of 1.8 mM CaCl2, at room temperature (20–25 °C).
The patch electrodes were meticulously fashioned from Kimax-51 capillaries with an outer diameter of 1.5–1.8 mm (#34500; Kimble, Dogger, New Taipei City, Taiwan) using a two-stage PP-830 puller (Narishige; Taiwan Instrument, Tainan, Taiwan). The electrode tips were then fire-polished using an MF-83 microforge (Narishige). Typically, the filled electrodes had tip resistances ranging from 2 to 4 MΩ. For standard patch-clamp recordings in a modified whole-cell configuration [19,20], we employed an RK-400 patch amplifier (Bio-Logic, Claix, France). The cell capacitance was measured to be 34 ± 6 pA (n = 32). Junction potentials, which arise at the electrode tip due to differences in composition between the internal solution and the bath solution, were nullified shortly before establishing a seal formation. Junction potential corrections were subsequently applied to the whole-cell data. During the recording process, the signal output data (i.e., potential or current tracings) were acquired and stored online at a frequency of 10 kHz or higher kHz. This was achieved using an ASUSPRO-BN401 LG laptop computer (ASUS, Yuan-Dai, Tainan, Taiwan) equipped with a Digidata 1440A (Molecular Devices; Advanced Biotech, New Taipei City, Taiwan). The entire system was controlled by pClamp 10.6 software (Molecular Devices).

2.4. Analyses of Whole-Cell Recordings

We analyzed the concentration–response curves of CBD-induced inhibition on the density of IK(M) or Ih in GH3 cells. To elicit the slowly activating IK(M), cells were placed in high-K+, Ca2+-free solution, and we applied a 1 s depolarizing pulse to −10 mV from a holding potential of −50 mV, as described previously [11]. The current densities were measured at the end of the depolarizing pulse in the presence or absence of exposure to different CBD concentrations. To evoke Ih, cells were bathed in Ca2+-free Tyrode’s solution and subjected to a 2 s hyperpolarizing pulse to −110 mV from a holding potential of −40 mV. The Ih density was measured with or without CBD at the end of the hyperpolarizing pulse. The concentration of CBD needed to inhibit 50% of the IK(M) or Ih (i.e., IC50) was approximated using a Hill function as follows:
p e r c e n t a g e     d e c r e a s e % = [ C B D ] n H × E m a x I C 50 n H + [ C B D ] n H
where [CBD] is the CBD concentration applied, IC50 is the half-maximal concentration of CBD, nH is the Hill coefficient, and Emax is the maximal decrease in IK(M) or Ih caused by the CBD presence.
To analyze the steady activation curve of IK(M) or Ih in the absence and presence of CBD, we fitted the data using a Boltzmann function. The Boltzmann equation is defined as:
G G m a x = 1 1 + e x p ± V V 1 / 2 / k
where Gmax is the maximal conductance of either IK(M) or Ih acquired from the absence or presence of 3 μM CBD, and V and V1/2 represent the membrane potential in mV and the half-point of the activation curve of IK(M) or Ih, respectively. The slope factor of the activation of IK(M) or Ih is represented by k.

2.5. Methods for Curve-Fitting and Statistical Analyses

Continuous curves were fitted to the experimental data using linear or nonlinear regression methods, such as exponential or sigmoidal function. The software tools used for this purpose included pClamp 10.6 software (Molecular Devices), 64-bit OriginPro 2022b software (OriginLab®; Scientific Formosa, Kaohsiung, Taiwan), and Microsoft Excel (part of the Microsoft 365 suite) (Microsoft, Redmond, WA, USA) with the “Solver” add-in function.
The experimental data obtained from the experiments comprised various types of ionic currents and were presented using the mean value with corresponding standard error of the mean (SEM). The sample size (n) denoted the number of cells from which data were gathered, and the SEM error bars were included in the plots. The Kolmogorov–Smirnov test for normality suggested that the data distribution was acceptable and could be assumed as normal. Paired or unpaired Student’s t-tests between the two groups were applied. To assess differences between more than two groups, we used an analysis of variance (ANOVA-1 or ANOVA-2) with or without repeated measures, followed by a post-hoc Fisher’s least significant difference test. Differences were considered statistically significant at a p value < 0.05 (* or ** in the figures denote significance).

3. Results

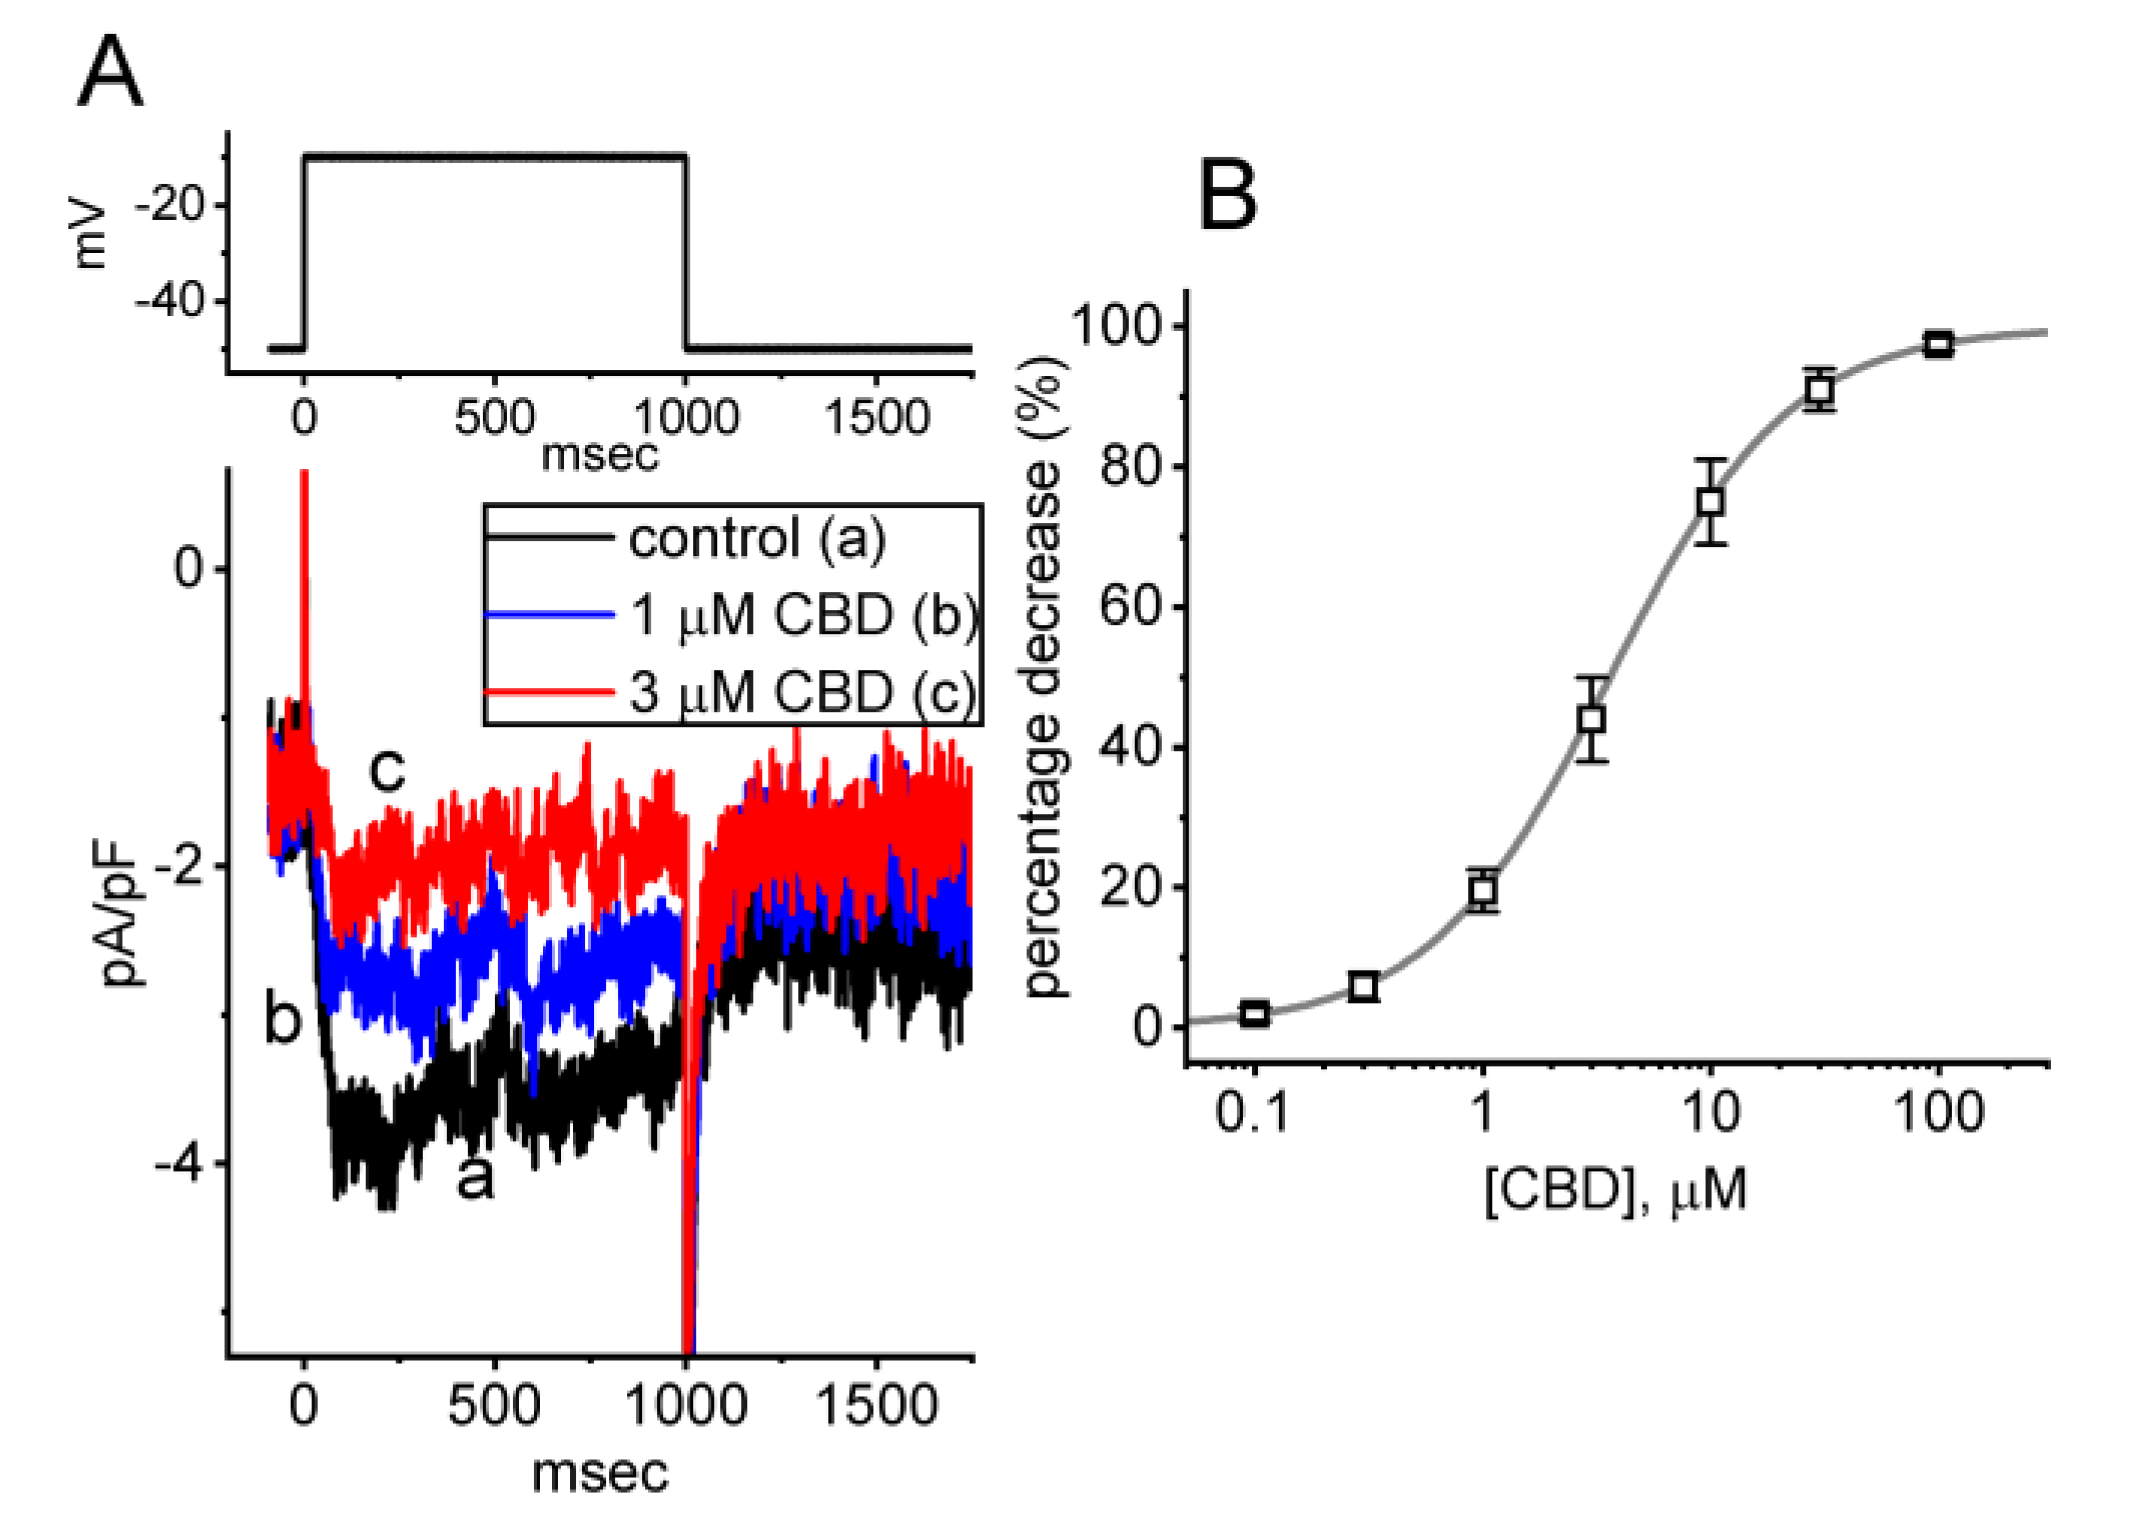
3.1. Effect of Cannabidiol (CBD) on the M-Type K+ Current (IK(M)) Identified in Pituitary GH3 Cells

In the initial whole-cell current recordings, we first investigated whether CBD had an effect on the density of IK(M) in these cells. To assess whether CBD caused any perturbations in IK(M), we exposed the cells to a high-K+, Ca2+-free solution containing 1 μM tetrodotoxin (TTX). The measuring electrode was filled with a K+-enriched solution, and we then held the examined cell at the level of −50 mV, and a 1 s depolarizing pulse to −10 mV was applied to evoke IK(M). Under the experimental conditions described above, the activation of IK(M) was indicated by a slowly activating time course in response to long-lasting step depolarization. As the reversal potential of K+ ions was around 0 mV, the resulting IK(M) was a slowly activating inward K+ current that directed the flow of K+ ions into the interior of the cell [11,12]. Of interest, we observed a progressive reduction in the density of IK(M) following a 1 s membrane depolarization from −50 to −10 mV. This reduction was observed one minute after cells were subjected to the increasing concentrations of CBD (Figure 1A). For instance, when cells were exposed to 1 or 3 μM CBD, the density of IK(M) measured at the end of a 1 s membrane depolarization decreased to 3.8 ± 0.4 pA/pF (n = 8, p < 0.05) or 1.9 ± 0.2 pA/pF (n = 8, p < 0.05), respectively, from a control value of 3.9 ± 0.4 pA/pF (n = 8). Following the cessation of CBD exposure and subsequent washout, the current density returned to 3.7 ± 0.3 pA/pF (n = 8). Additionally, Figure 1B displays the concentration–response curve for the CBD-induced inhibition of the density of IK(M), which was constructed with an IC50 value of 3.6 μM. The results reflect that exposing GH3 cells to CBD can cause a concentration-dependent decrease in the density of IK(M), indicating a depressant action.

3.2. Effect of CBD on the Current Density Versus Voltage Relationship and the Quasi-Steady-State Activation Curve of IK(M) in GH3 Cells

To further investigate the inhibitory effect of CBD on IK(M), we analyzed the current density versus voltage relationship of IK(M) with and without CBD addition. Figure 2A illustrates the quasi-steady-state current density versus voltage relationship of IK(M) obtained during the control period and after exposure to 3 μM CBD in these cells. We observed a marked decrease in the density of IK(M) elicited by depolarizing steps, particularly at voltage levels ranging between −30 and −10 mV, upon the addition of CBD.
Moreover, the quasi-steady-state activation curve of IK(M) in the absence and presence of 3 μM CBD was constructed and plotted in Figure 2B. The normalized conductance of IK(M) with or without the presence of CBD was fitted to a Boltzmann function using the method described in Section 2. In the control, V1/2 = −17.5 ± 0.8 mV, k = 4.9 ± 0.5 (n = 7), while in the presence of 3 μM CBD, V1/2 = −10.4 ± 0.8 mV, k = 4.9 ± 0.5 (n = 7). The data reflected that CBD not only decreased the maximal magnitude of IK(M), but it also shifted the quasi-steady-state activation curve of IK(M) to more depolarized potential (i.e., in the rightward direction) by approximately 7 mV. However, we found no clear adjustments in the slope factor (k value or steepness) of the curve when exposed to CBD, suggesting that there was no change in the gating charge of the curve during its exposure. Alternatively, the CBD-induced inhibition of IK(M) in unclamped cells could depend on the pre-existing resting membrane.

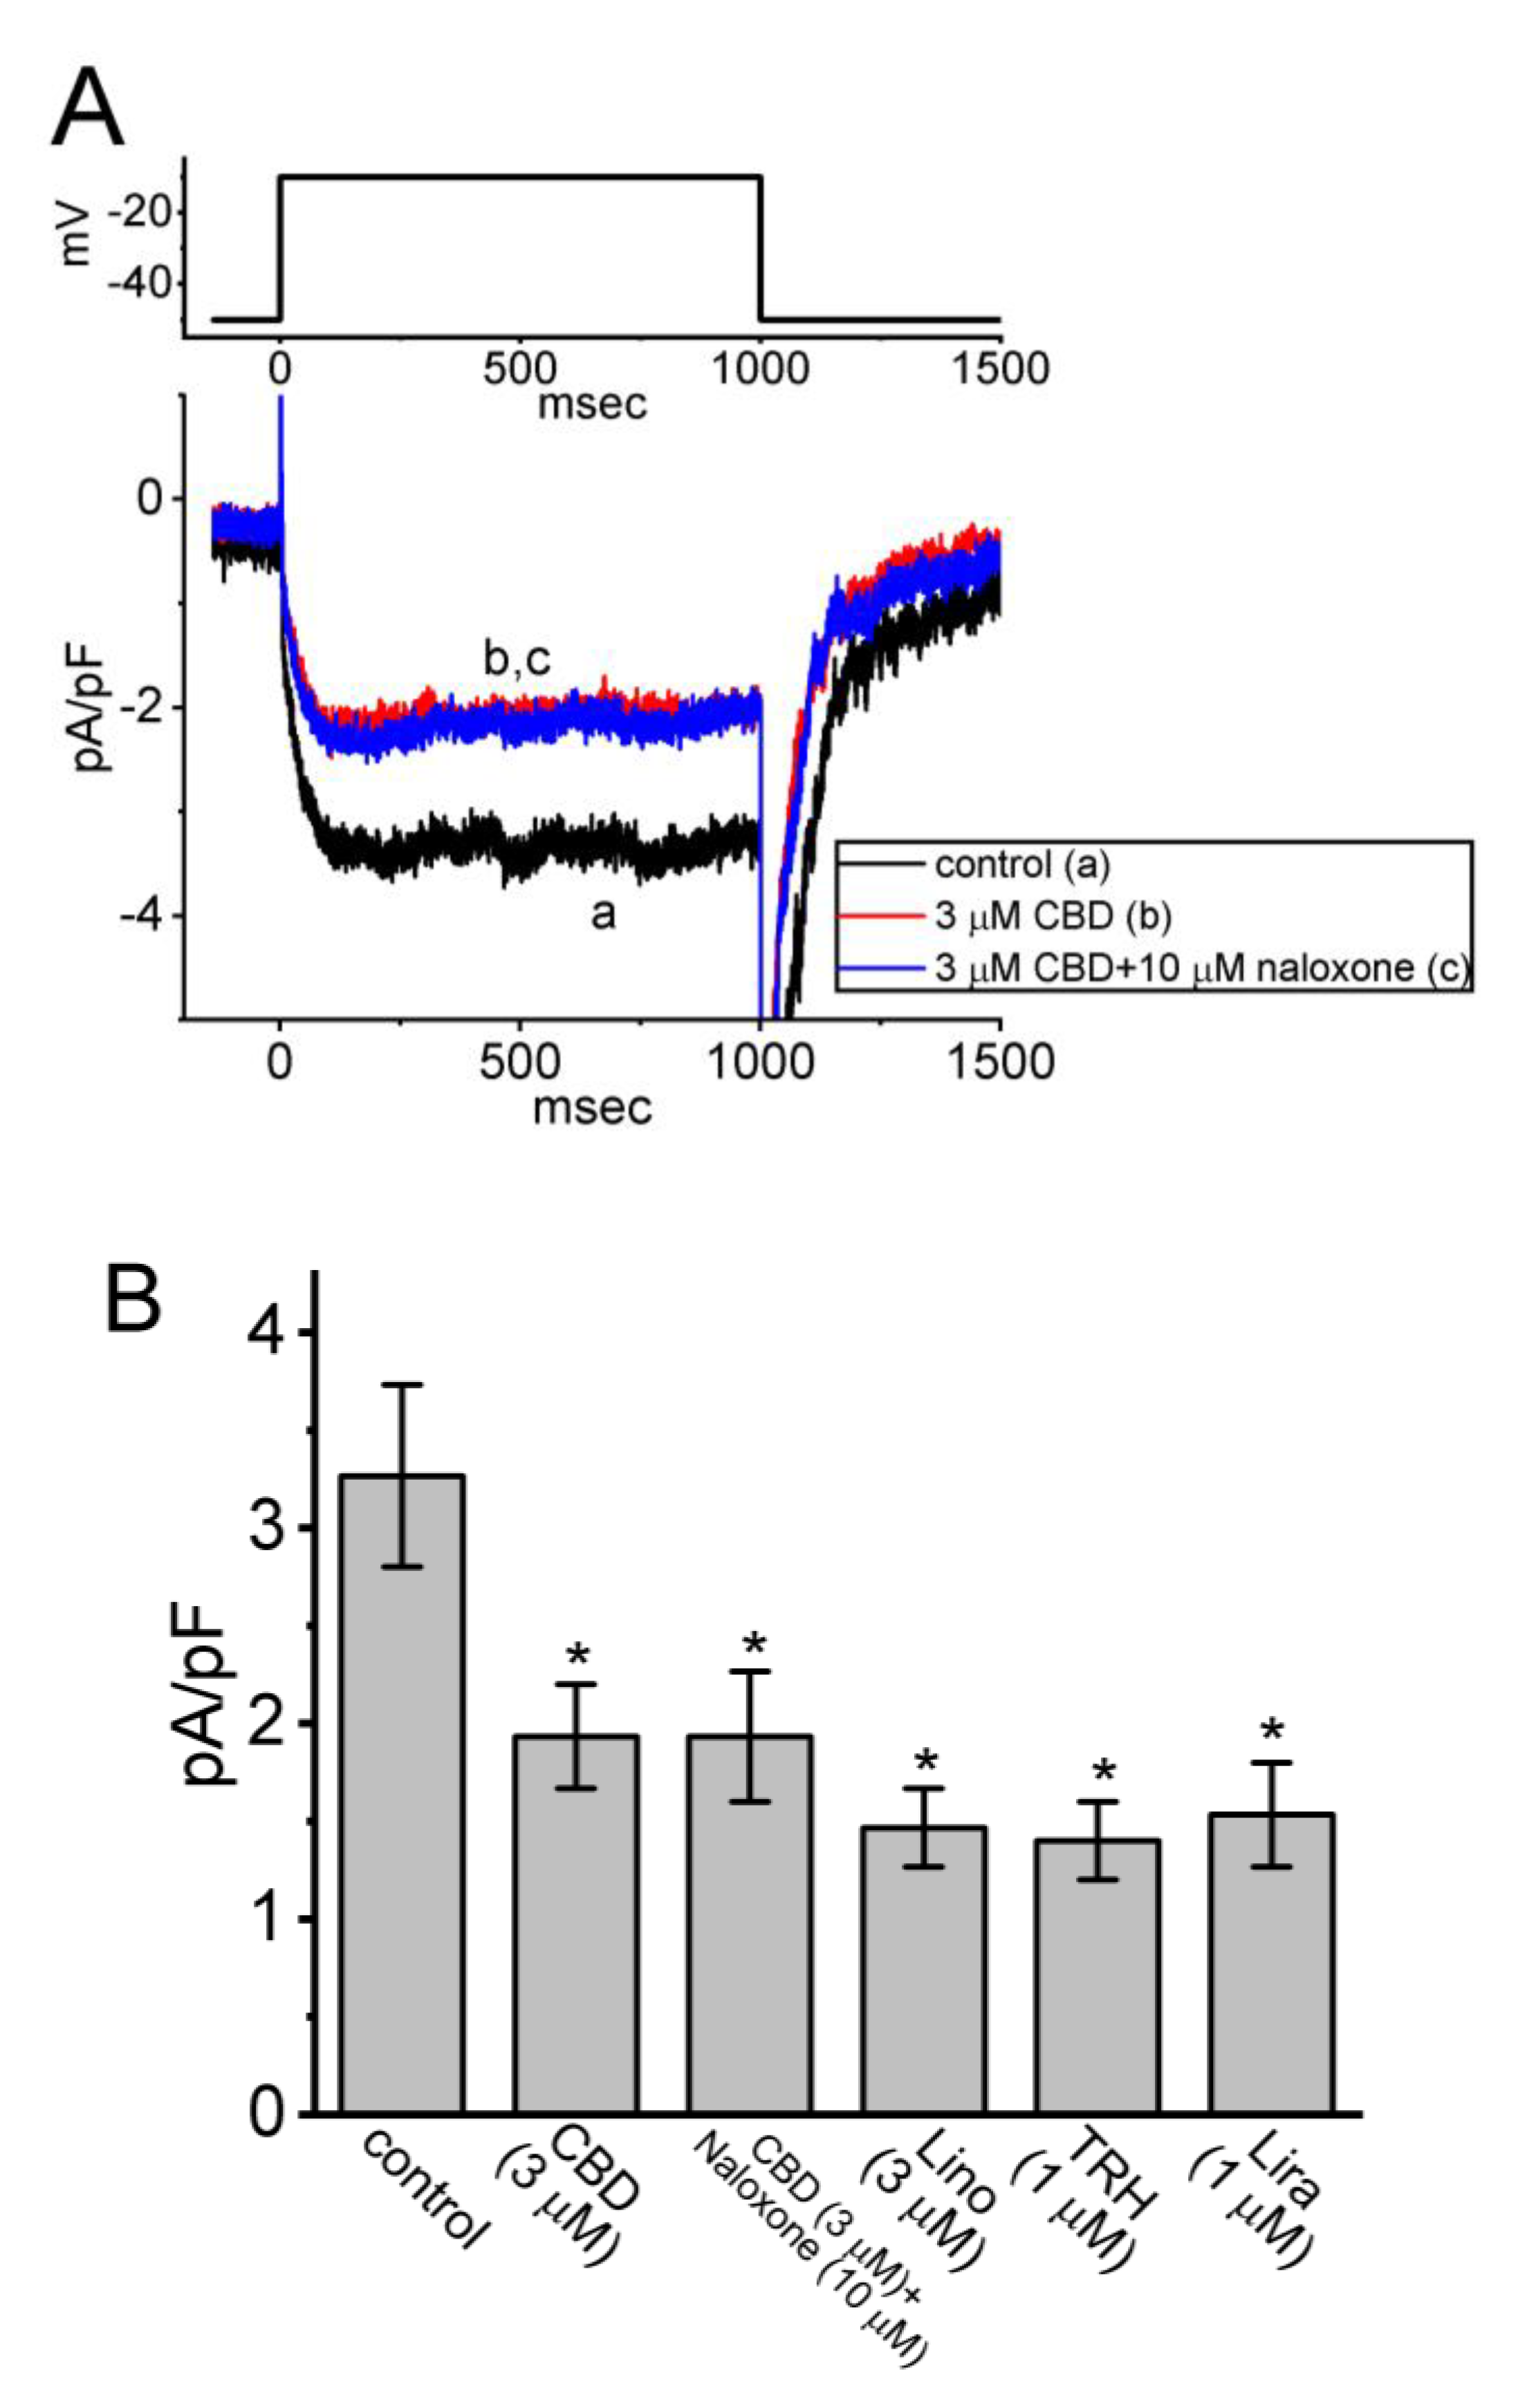
3.3. Comparisons among Effects of CBD, CBD plus Naloxone, Linopirdine (Lino), Thyrotropin-Releasing Hormone (TRH), and Liraglutinide (Lira) on the Density of IK(M) in GH3 Cells

In another series of whole-cell experiments, we tested the possible effects of CBD, CBD plus naloxone, Lino, TRH, and Lira on the density of IK(M) elicited by membrane depolarization from −50 to −10 mV. Lino has been demonstrated to inhibit IK(M) potently [27], while TRH can suppress the magnitude of IK(M) [11]. Lira was known to be an agonist of glucagon-like peptide-1 (GLP-1) receptor [28,29]. As demonstrated in Figure 3A,B, CBD at a concentration of 3 μM produced an inhibitory effect on the IK(M) density; however, a subsequent addition of 10 μM naloxone failed to counteract CBD-induced inhibition of IK(M). Meanwhile, the presence of Lino (3 μM), TRH (1 μM), or Lira (1 μM) was effective at suppressing the magnitude of IK(M) (Figure 3B). Naloxone is known to block opioid receptors. Naloxone at a concentration of 30 μM also did not cause any effect on the CBD-induced decrease in IK(M). Hence, similar to TRH, Lira can suppress IK(M) possibly through its binding to GLP-1 receptors in pituitary cells [28]. However, further addition of naloxone exerted no effect on the CBD-mediated decrease in IK(M), suggesting that the CBD effect on IK(M) is independent of binding to opioid receptors.

3.4. Modification by CBD of IK(M) Elicited by Pulse-Train (PT) Stimulation

Previous work has shown the capability of IK(M) to maintain the availability of voltage-gated Na+ (NaV) channels during prolonged high-frequency firing [16]. Therefore, we further examined whether the CBD presence may modify the extent of IK(M) during PT depolarizing stimuli from −50 to −10 mV in GH3 cells. As depicted in Figure 4, a one-minute exposure to 3 μM CBD resulted in a reduction in the density of both activating and deactivating IK(M) during 1 s PT stimulation. For instance, the presence of CBD (3 μM) decreased the density of activating IK(M) from 7.0 ± 1.1 to 3.7 ± 0.6 pA/pF (n = 7, p < 0.05) and the density of deactivating IK(M) from 25.8 ± 3.8 to 7.7 ± 1.2 pA/pF (n = 7, p < 0.05). Subsequent to the washout of the CBD, the densities of activating and deactivating IK(M) were restored to 6.8 ± 0.9 (n = 6) and 24.9 ± 3.5 pA/pF (n = 6), respectively. The obtained data provided insights into the persistent effectiveness of CBD-induced inhibition of IK(M) even under conditions of high PT stimulation. Thus, it is plausible to consider that the presence of NaV channels during high-frequency firing in unclamped excitable cells may experience additional inhibition during CBD exposure, despite CBD’s previously descried potential to suppress NaV channel activity [8].

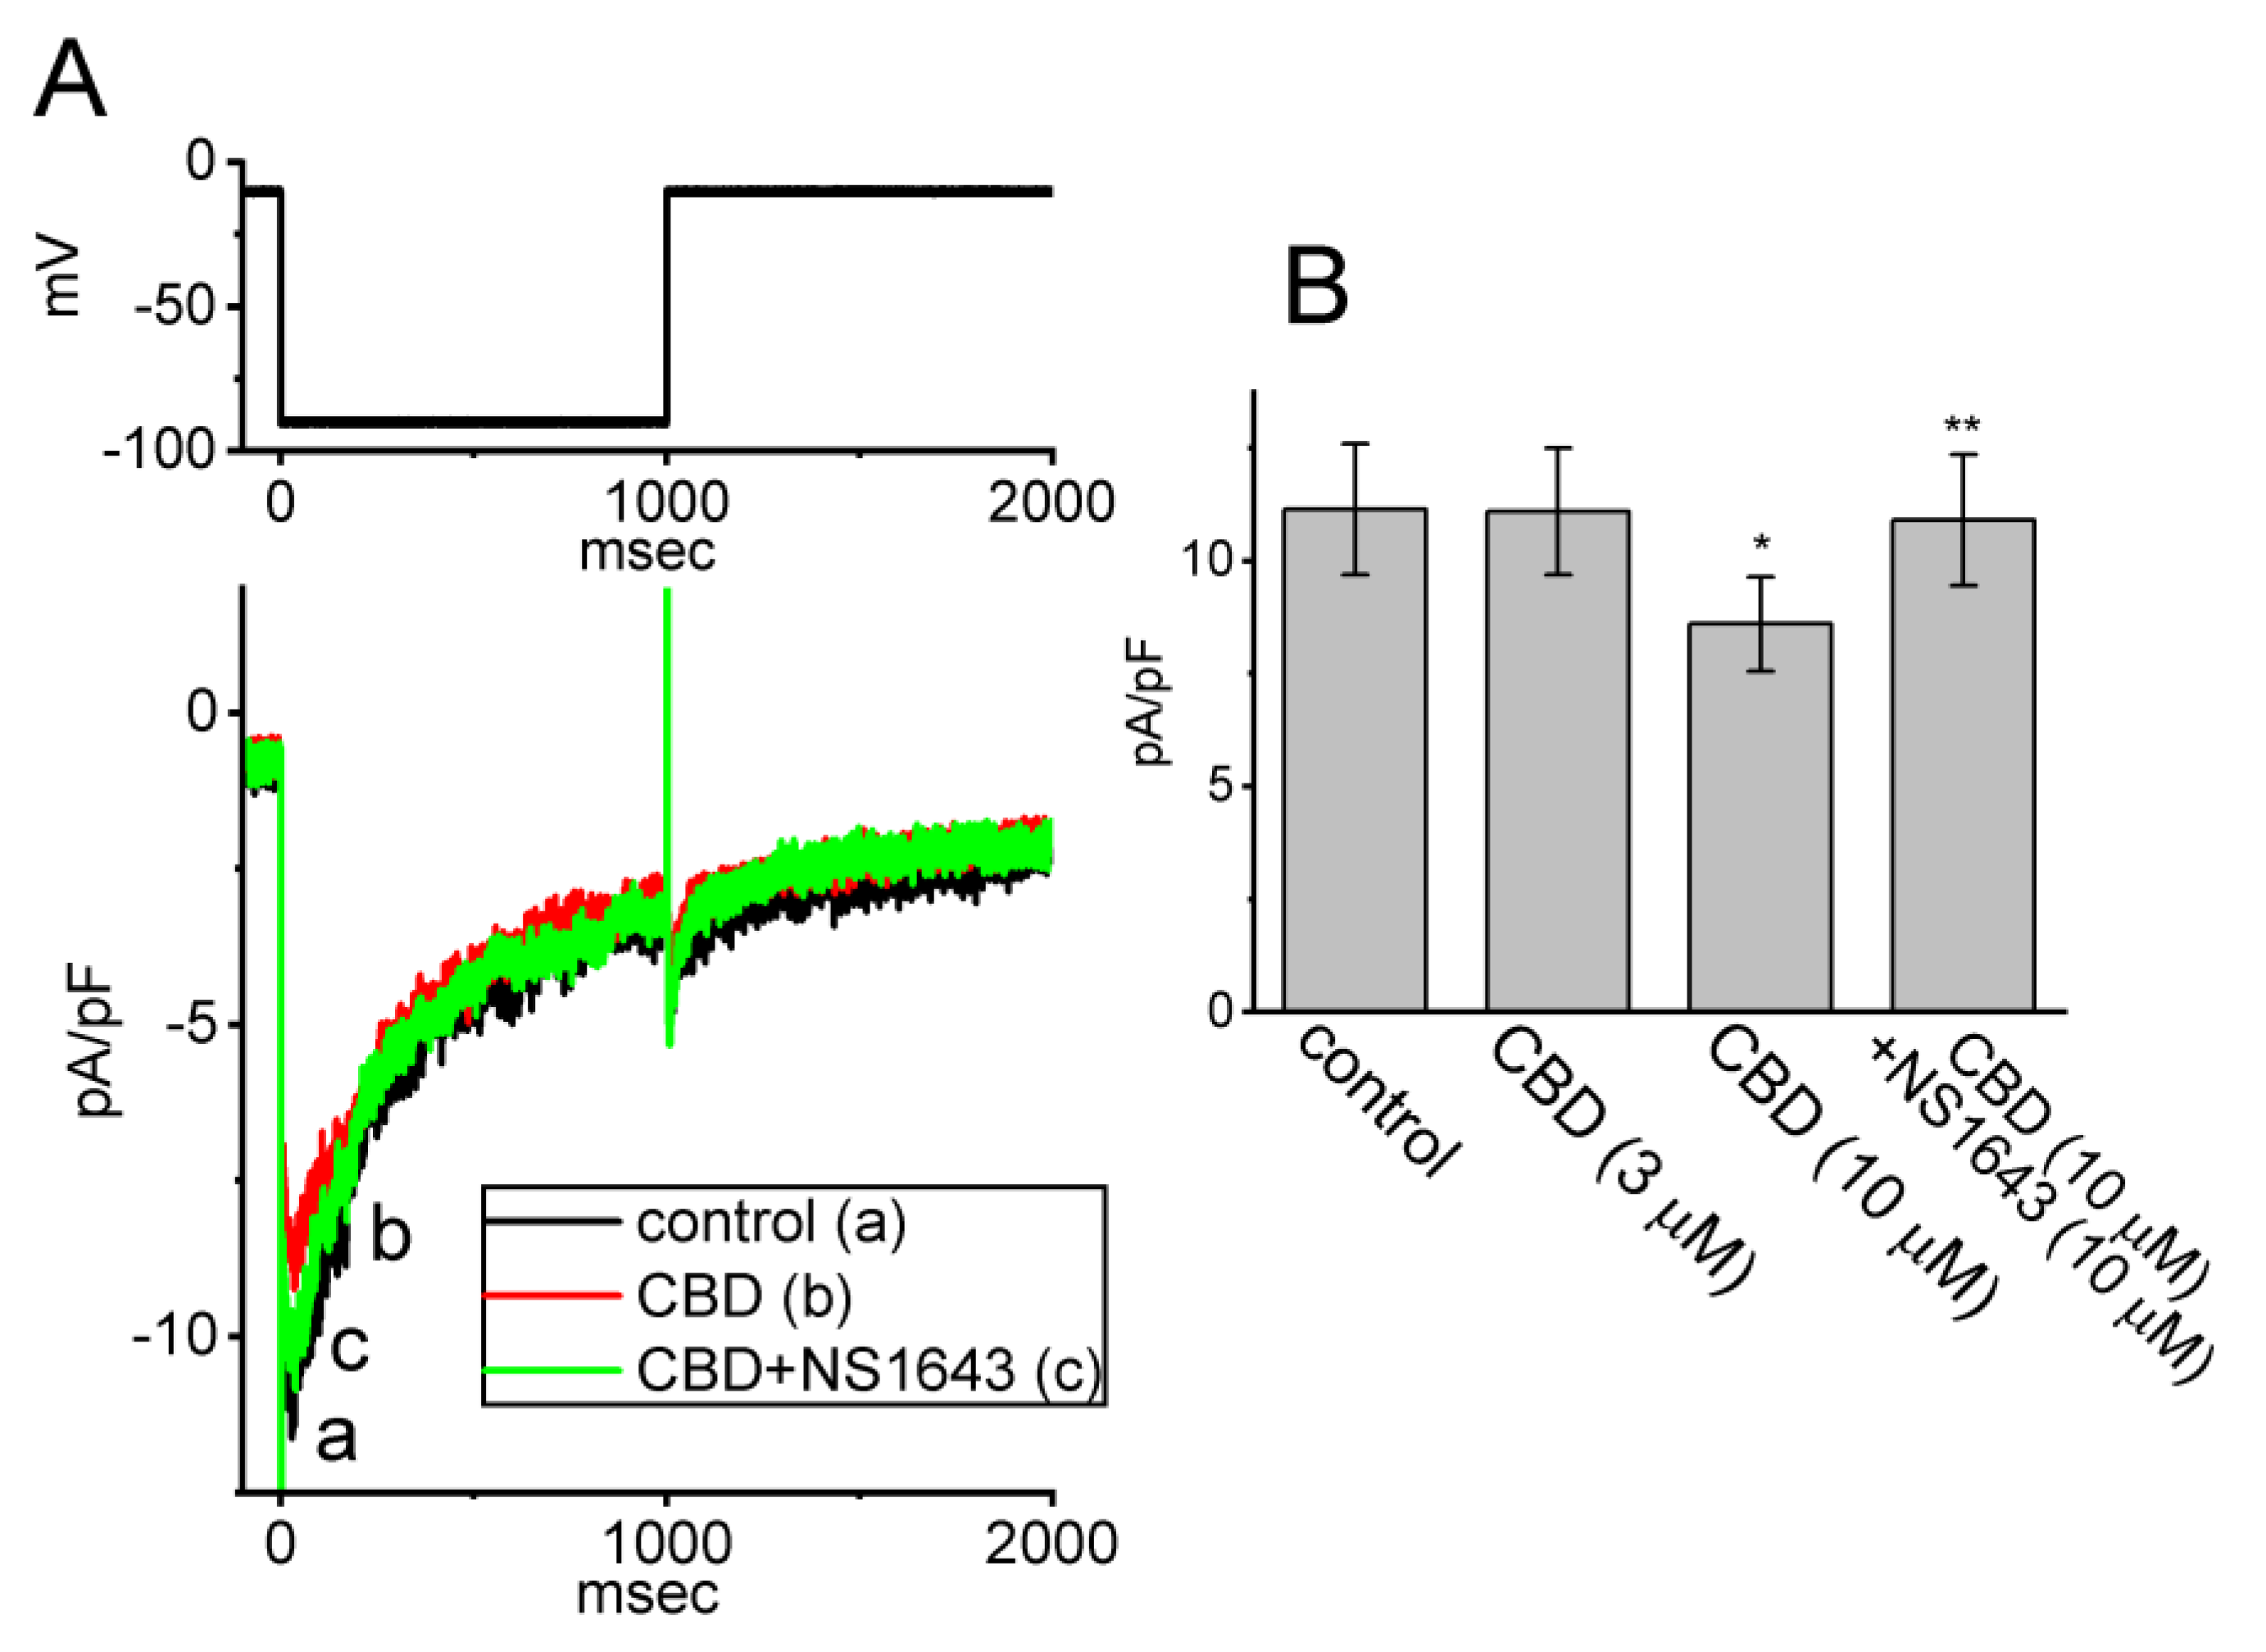
3.5. Mild Inhibitory Effect of CBD on the erg-Mediated K+ Current (IK(erg)) in GH3 Cells

We continued by exploring whether CBD can exert any effect on another type of K+ currents (i.e., IK(erg)) enriched in these cells. Cells were kept in high-K+, Ca2+-free solution and we filled up the measuring electrode with K+-enriched solution. To evoke IK(erg), we held the tested cell at the level of −10 mV and a hyperpolarizing step to −90 mV for a duration of 1 s was applied to it. As shown in Figure 5, one minute after being exposed to CBD (10 μM), the density of IK(erg) in response to membrane hyperpolarization was significantly decreased to 8.6 ± 1.1 pA/pF (n = 8, p < 0.05) from a control value of 11.2 ± 1.5 pA/pF (n = 8), while CBD at a concentration of 3 μM did not have a clear effect on IK(erg) density elicited by membrane hyperpolarization. Following the removal of the 10 μM CBD and subsequent washout, the IK(erg) density returned to 11.0 ± 1.4 pA/pF (n = 8). Moreover, during continued exposure to 10 μM CBD, a further addition of NS1643 (10 μM) was capable of attenuating CBD-mediated inhibition of IK(erg) (10.9 ± 1.5 pA/pF, n = 8, p < 0.05) in these cells. NS1643 has been reported to stimulate IK(erg) [30]. The results therefore indicate that exposure to CBD slightly suppressed the density of IK(erg) in GH3 cells.

3.6. Failure of CBD Effect on Voltage-Gated Na+ Current (INa) in GH3 Cells

CBD was recently reported to suppress the magnitude of NaV1.4-encoded INa [8]. In our study, we conducted additional experiments to investigate whether the presence of CBD can also modify INa in GH3 cells. As shown in Figure 6, in whole-cell current recordings, the magnitude of INa elicited in response to a short depolarizing pulse to −10 from a holding potential of −100 mV was robustly observed; however, the INa density remained unaltered during a 2 min continued exposure to 10 μM CBD. Similarly, cannabichromene, a compound known to bind to cannabinoid receptor 1 [1], did not have any effect on the density of INa. Moreover, with continued presence of 10 μM CBD, the further addition of ranolazine (Ran, 10 μM) was effective at suppressing INa density, while the addition of either tefluthrin (Tef, 10 μM) or telmisartan (TEL, 10 μM) enhanced current density. Ran is an inhibitor of late INa [31], while Tef or TEL can stimulate INa effectively [32]. Therefore, unlike NaV1.4-encoded currents [8], the INa observed in GH3 cells appears to be resistant to modulation by CBD.

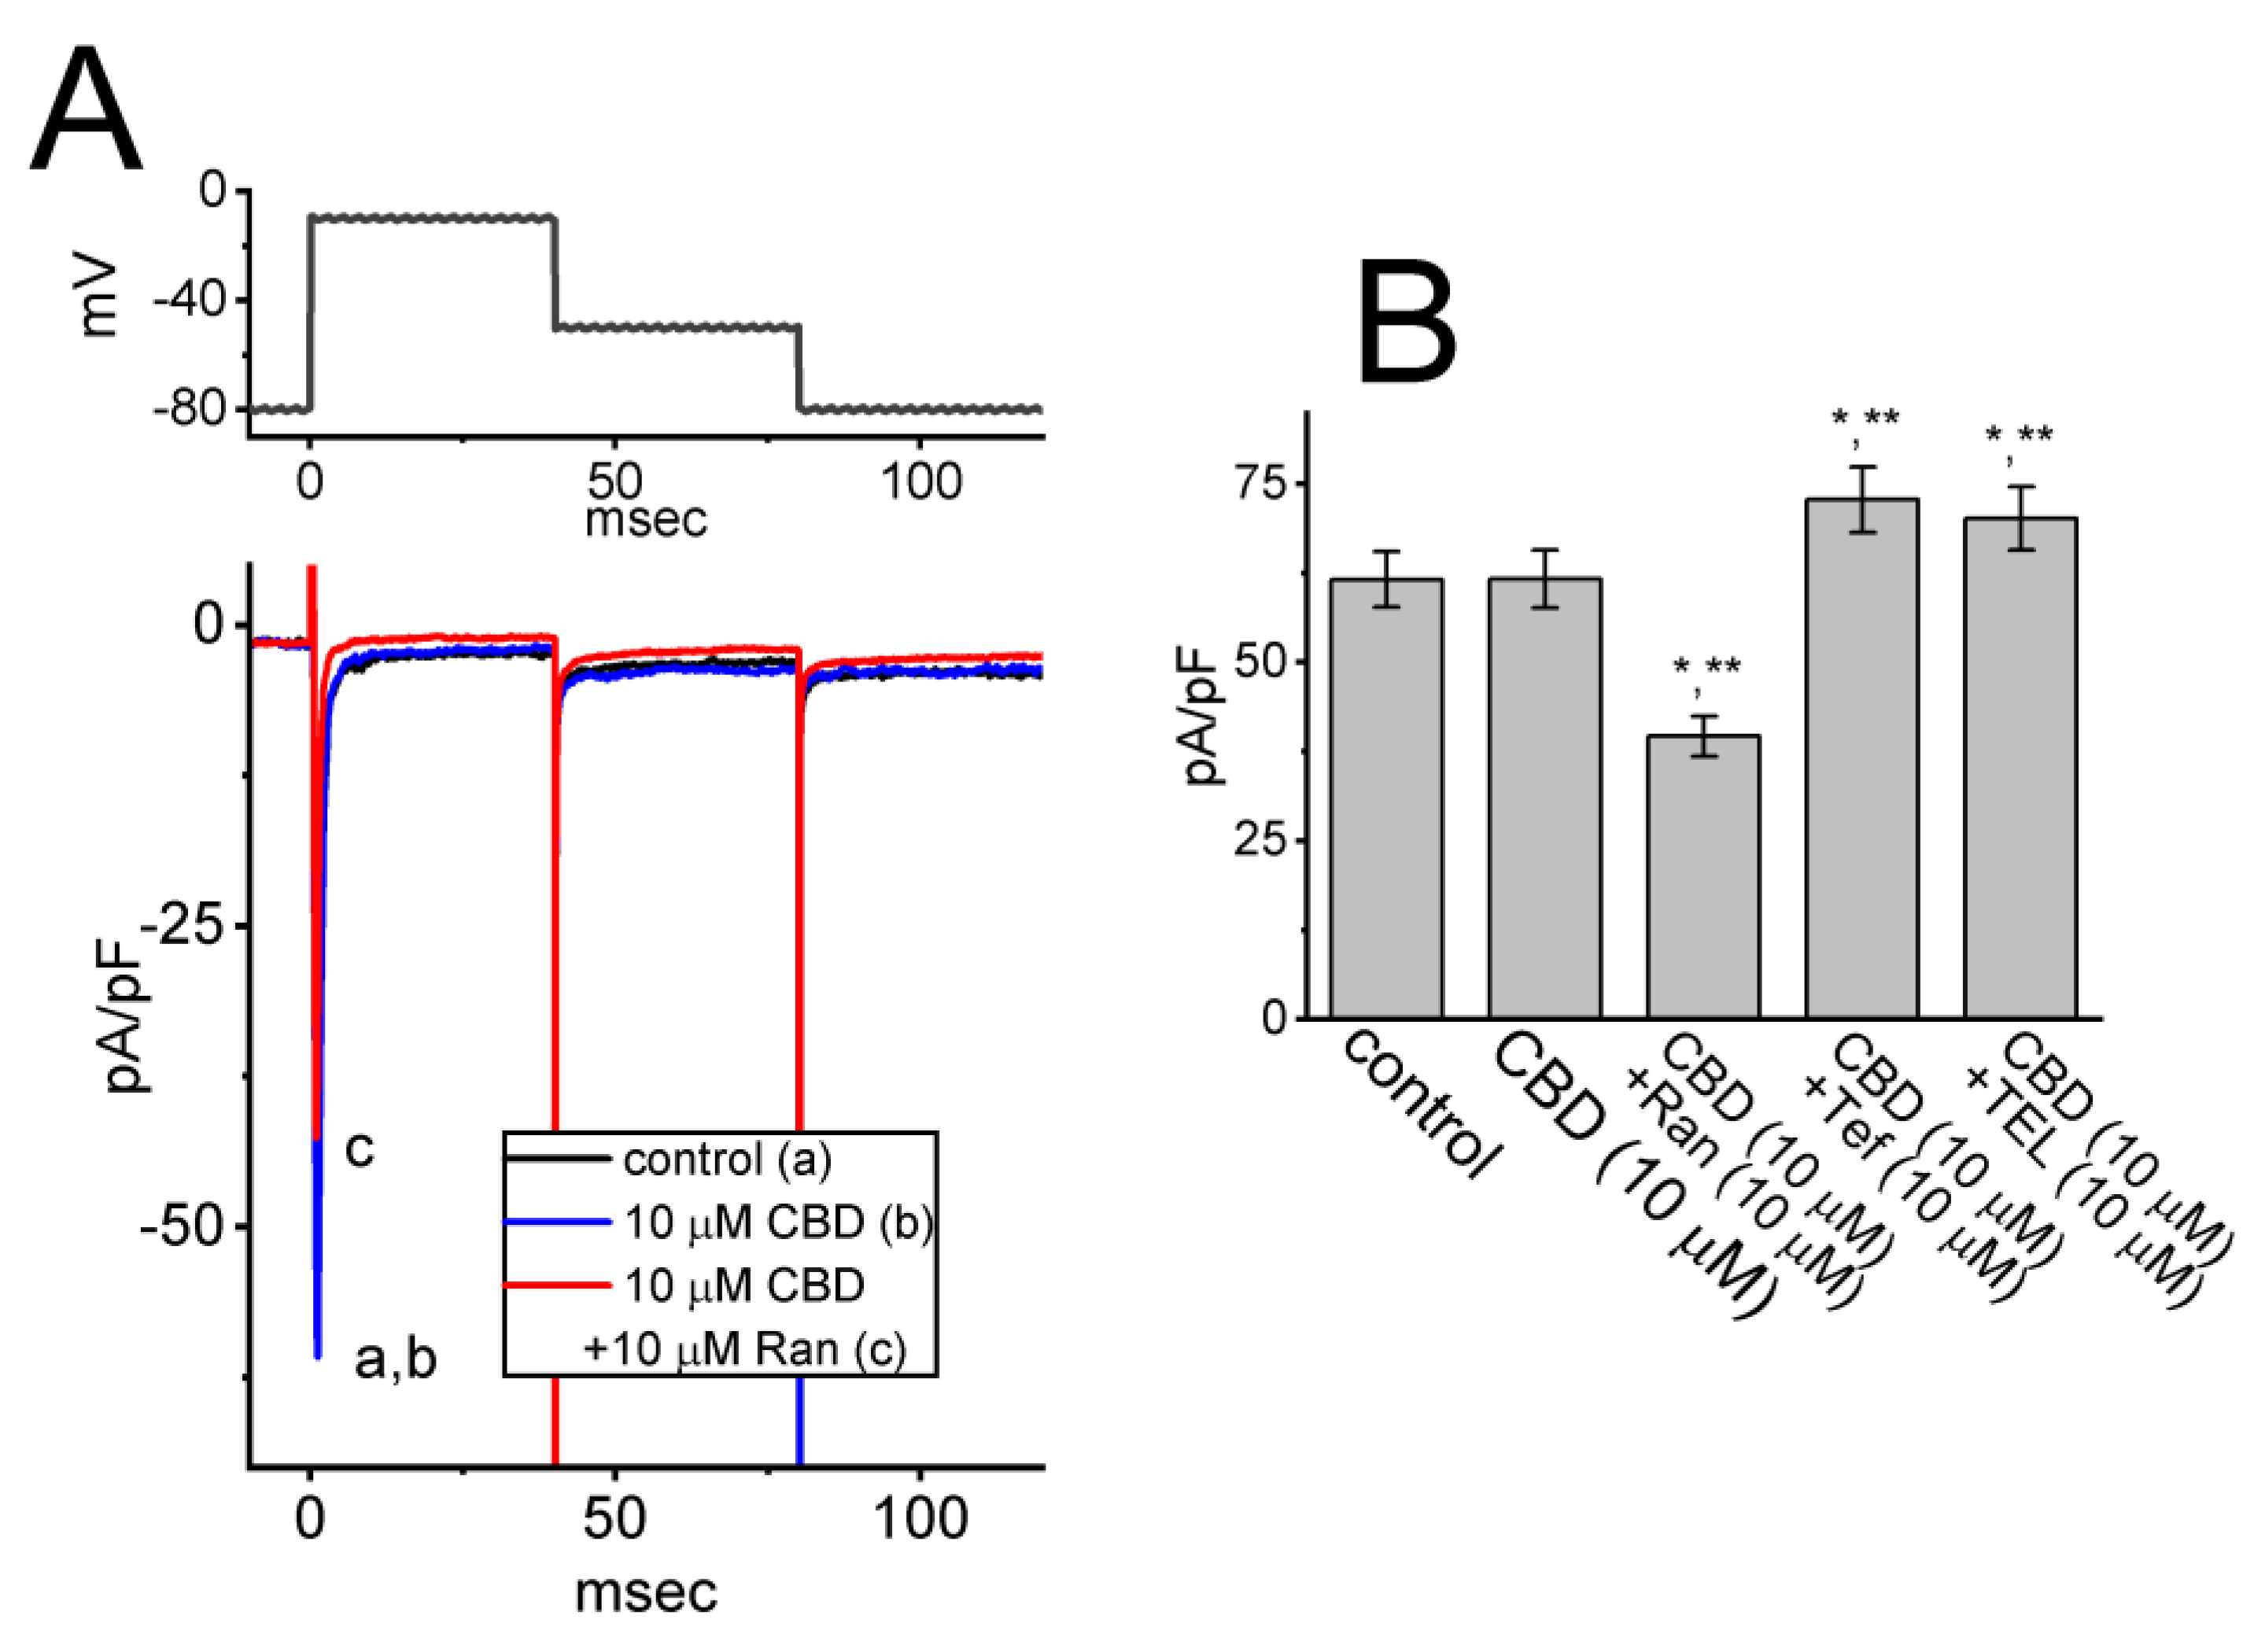
3.7. Effect of CBD on Hyperpolarization-Activated Cation Current (Ih) Measured in GH3 Cells

We continued to examine the perturbations caused by CBD in Ih in these cells. To investigate the effects of CBD on Ih, we performed experiments under specific conditions. First, we placed the cells in Ca2+-free Tyrode’s solution containing 0.5 mM CdCl2 and 1 μM TTX. We used CdCl2 and TTX to block voltage-gated Ca2+ and Na+ currents, respectively. The measuring electrode was backfilled with K+-enriched internal solution to evoke Ih. As the whole-cell mode was established, the tested cell was maintained at the level of −40 mV in voltage-clamp mode, and the voltage steps were subsequently applied (2 s in duration) to a series of voltages ranging between −110 and −20 mV in 10 mV increments. As demonstrated in Figure 7A, one minute after cells were exposed to 3 μM CBD, the Ih density elicited by 2 s membrane hyperpolarization to −110 mV from a holding potential of −40 mV was decreased. However, even with continued exposure to 3 μM CBD, the subsequent addition of 10 μM naloxone failed to reverse the CBD-induced decrease in Ih density. Moreover, the quasi-steady-state current remained largely unaltered during CBD exposure.
Of interest, one minute after cell exposure to 3 μM CBD, the density of Ih evoked by the 2 s long step hyperpolarization progressively decreased (Figure 7B,C). For instance, at the levels of −100 and −110 mV, it was observed that following a one-minute exposure to 3 μM CBD, the density of Ih diminished to 4.6 ± 0.8 pA/pF (n = 7, p < 0.05) and 7.6 ± 1.1 pA/pF (n = 7, p < 0.05), respectively. These values were reduced from the control values of 9.7 ± 1.4 pA/pF (n = 7) and 15.6 ± 1.7 pA/pF (n = 7). When CBD was removed, the Ih density at −100 and −110 mV returned to 9.3 ± 1.1 pA/pF (n = 7) and 15.2 ± 1.6 pA/pF (n = 7), respectively. Additionally, the activating time constant (τact) of Ih activated by the 2 s hyperpolarizing step from −40 to −110 mV decreased to 1.81 ± 0.04 s (n = 7, p < 0.05) from a control value of 1.07 ± 0.03 s (n =7). Moreover, with continued exposure to 3 μM CBD, a further addition of naloxone (10 μM) failed to reverse the CBD-mediated decrease in Ih density.
Figure 7D illustrates the quasi-steady-state activation curve of Ih acquired in the control period and during exposure to 3 μM CBD. According to the least-squares minimization procedure, the best fitting parameters (i.e., V1/2 and k) for such a steady-state activation curve of the current were convergently acquired with or without the addition of CBD. In the presence of 3 μM CBD, the value of V1/2 for the activation curve of the current was −101 ± 4 mV (n = 7), which was significantly distinguishable from that in the control period, −89 ± 4 mV (n = 7, p < 0.05). However, the k values in the absence (7.2 ± 0.3, n = 7) and presence of 3 μM CBD (7.3 ± 0.3, n = 7, p > 0.05) did not differ significantly. The experimental results showed that during exposure to 3 μM CBD, the activation curve of Ih was shifted toward more hyperpolarized potential with no change in the slope factor of the curve (i.e., the steepness of the activation curve). Therefore, it appears likely that no change in the gating charge of Ih activation curve was altered by CBD exposure. The responsiveness of Ih to CBD is influenced by varying levels of pre-existing resting membrane potential.
As illustrated in Figure 7E, the presence of various concentrations of CBD can suppress the density of Ih in a concentration-dependent manner. By virtue of a non-linear least-squares fit to the experimental data, the IC50 value for the inhibitory effect of CBD on Ih was 3.3 μM, a value that is similar to that needed to suppress IK(M) density described above. These results indicate that CBD can exercise a depressant action on Ih elicited by membrane hyperpolarization in these cells.

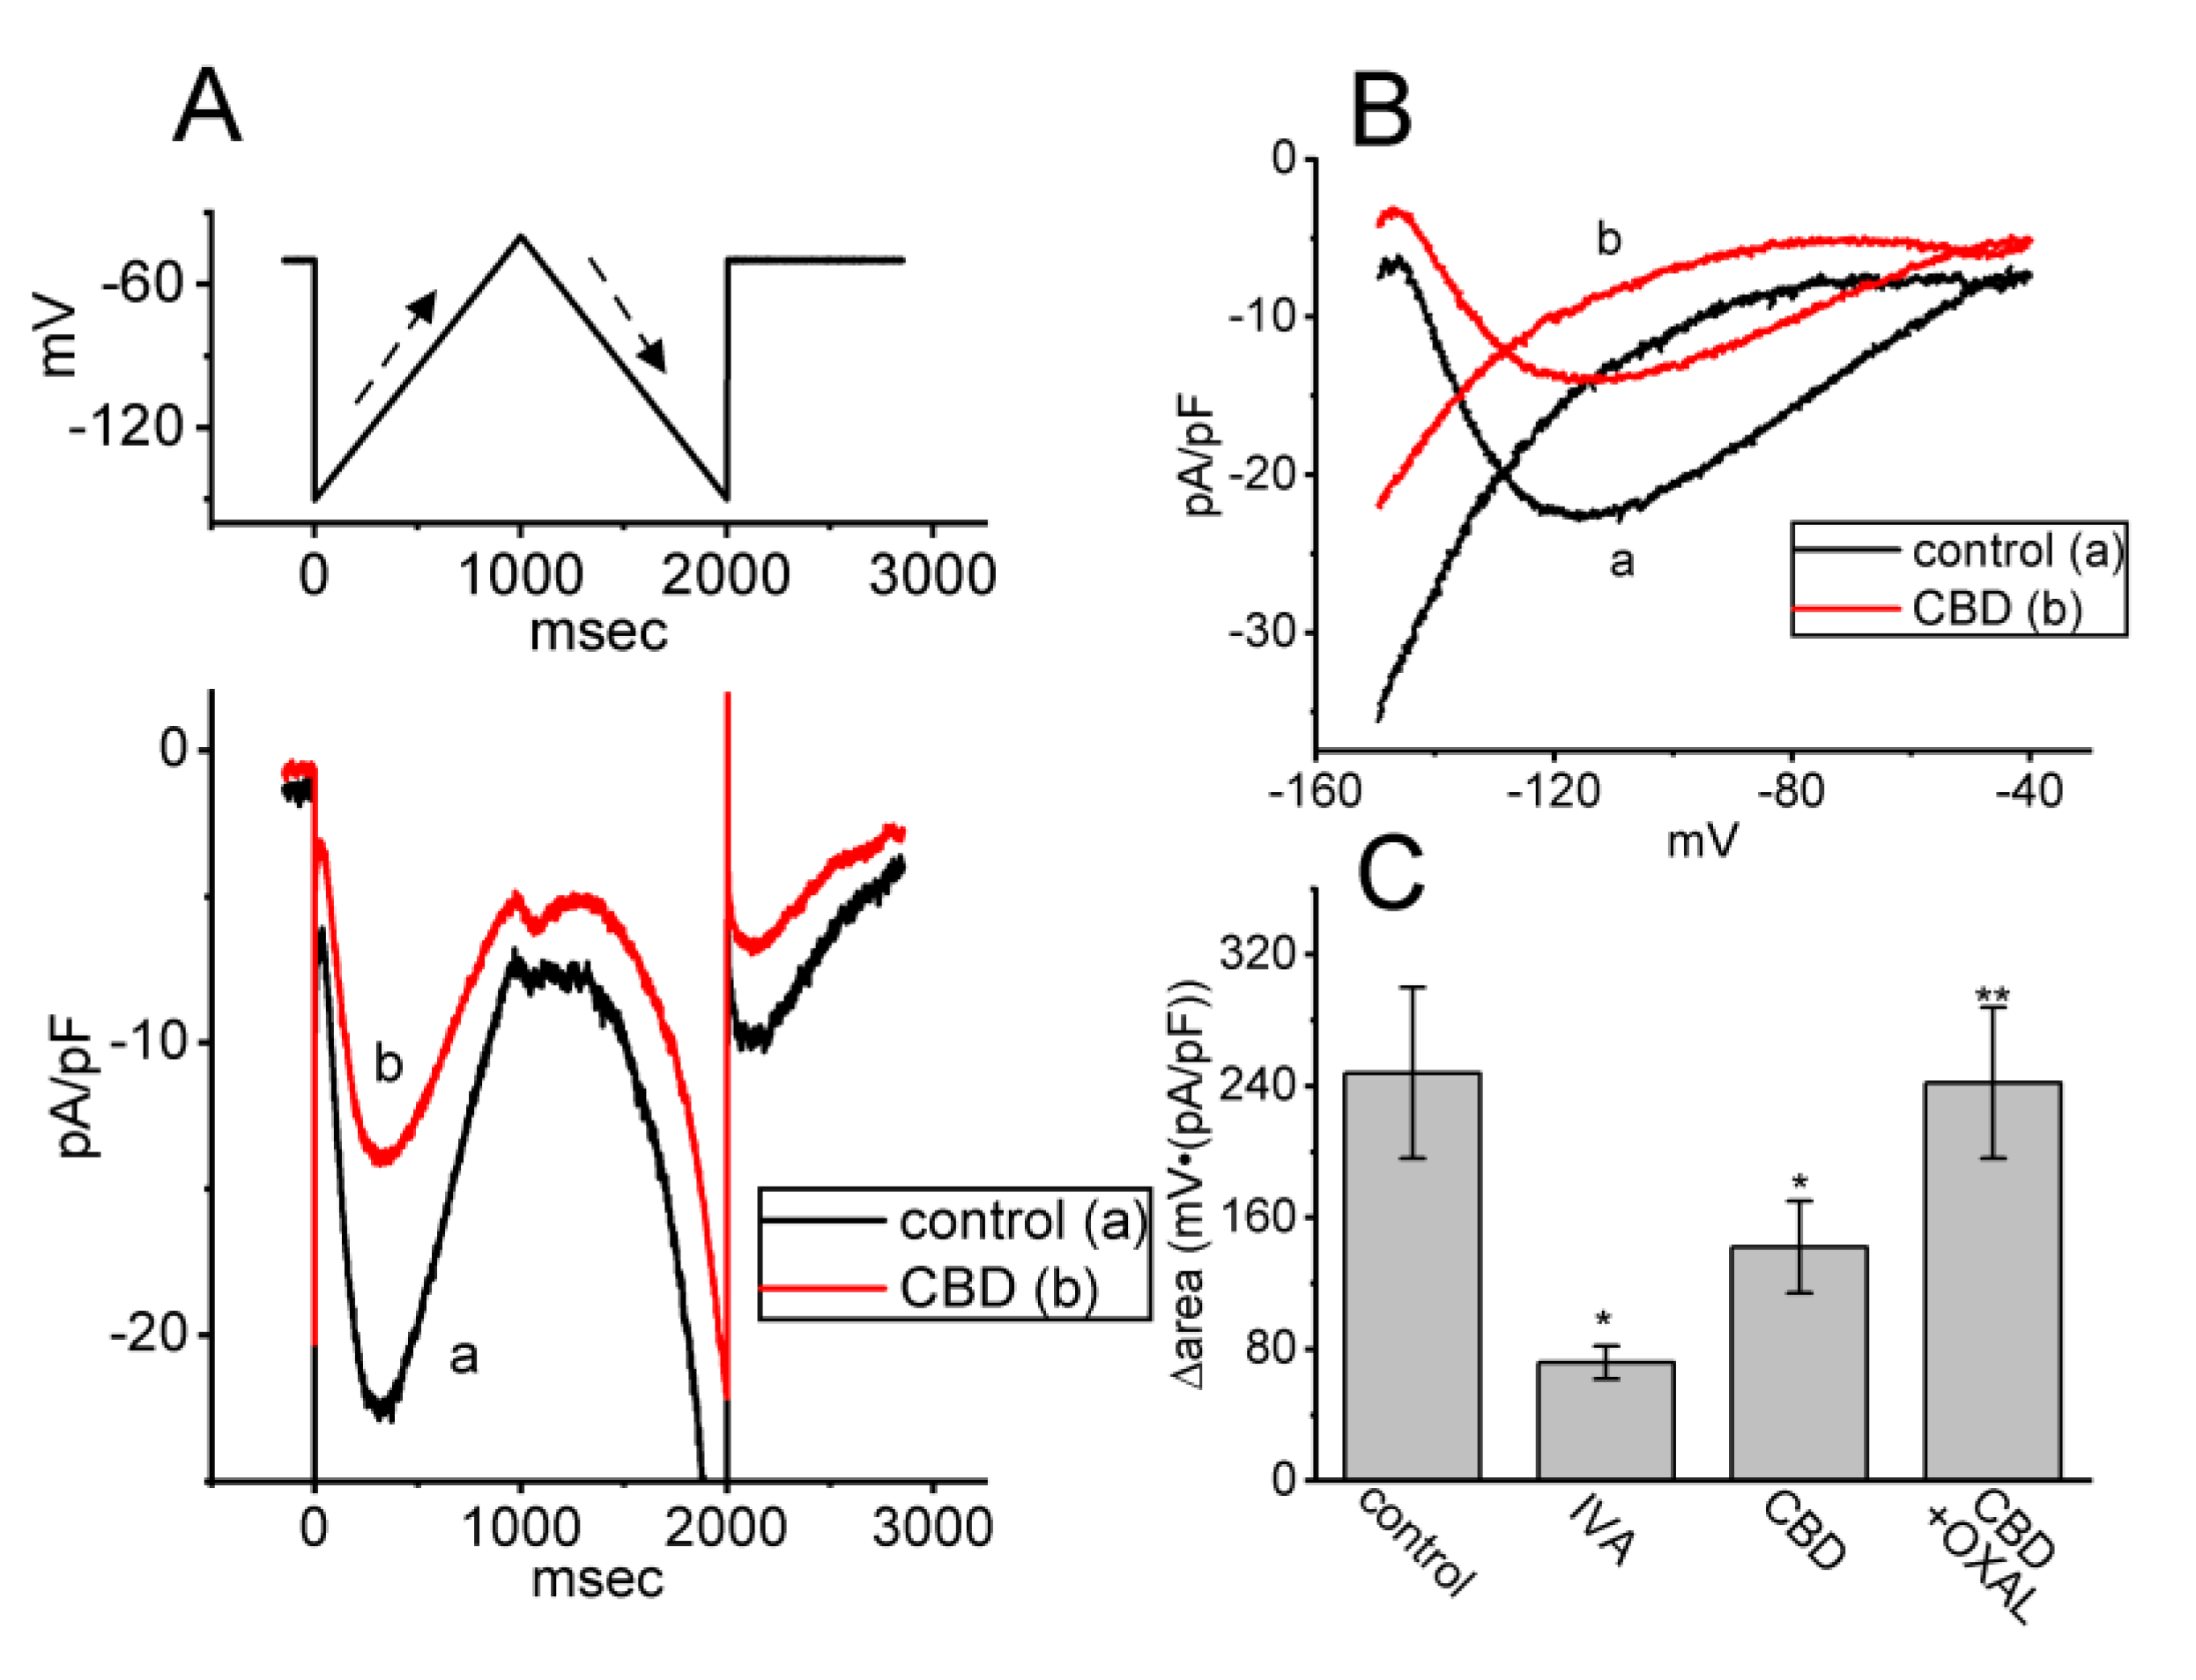
3.8. Effect of CBD on the Hysteretic Behavior (i.e., Voltage-Dependent Hysteresis (Hys(V))) of Ih Elicited by Isosceles-Triangular Ramp Voltage (Vramp) in GH3 Cells

Previous work has demonstrated the effectiveness of Ih’s Hys(V) strength in affecting either various patterns of bursting firing or action potential configuration in varying types of excitable cells [33,34]. Therefore, we continued by determining whether and how the presence of CBD may adjust the Ih strength activated in response to long-lasting triangular Vramp. In this series of experiments, in the control period (i.e., absence of CBD), we maintained the tested cell at the level of −40 mV, and an upsloping (forward) limb from −150 to −40 mV followed by a downsloping (backward) limb back to −150 mV (i.e., upright isosceles-triangular Vramp) for a total duration of 2 s with a ramp speed of ±55 mV/s was thereafter applied to evoke Ih’s hysteresis (Hys(V)) (Figure 8A,B). In accordance with previous studies [21,33,34], the Hys(V) of Ih in response to such double Vramp was robustly observed and sensitive to suppression by ivabradine (IVA), an inhibitor of Ih [19,20,26]. Of additional interest, upon cell exposure to 3 μM CBD, the strength of Ih’s Hys(V) responding to both rising and falling limbs of double Vramp progressively became depressed (Figure 8C). For instance, as the triangular Vramp was applied, the value of ∆area (i.e., the difference in area enclosed by the curve in the forward and backward direction) for Hys(V) in the control period was 248 ± 52 mV·(pA/pF) (n = 7), while the ∆area value of Ih in the presence of 3 μM CBD was significantly reduced to 142 ± 28 mV·(pA/pF) (n = 7, p < 0.05). Moreover, a subsequent addition of oxaliplatin (OXAL, 10 μM) effectively reversed the CBD-induced decrease in Hys(V)’s strength. OXAL has been reported to activate Ih [25,35]. Therefore, the results indicate that cell exposure to CBD can modify the magnitude and gating properties of Ih observed in GH3 cells.

4. Discussion

This study identified seven significant findings. (1) Cannabinoid (CBD) exposure resulted in a concentration-dependent suppression of M-type K+ current (IK(M)) in pituitary GH3 cells, with an IC50 of 3.6 μM. (2) The presence of CBD caused a rightward shift in the quasi-steady-state activation curve of IK(M) without changes in the slope factor (i.e., k value) of the curve. (3) The CBD-induced block of IK(M) was not reversible by further addition of naloxone. (4) CBD exposure also suppressed IK(M) elicited by pulse-train (PT) depolarizing stimuli. (5) CBD slightly reduced the magnitude of erg-mediated K+ current (IK(erg)) but did not affect voltage-gated Na+ current (INa) in GH3 cells. (6) Cell exposure to CBD resulted in the inhibition of hyperpolarization-activated cation current (Ih) with an IC50 of 3.3 μM. (7) The quasi-steady-state activation curve of Ih was shifted to a more hyperpolarized potential without changes in the curve’s slope factor. Based on the findings of this study, it can be inferred that CBD exerts a significant impact on transmembrane ionic currents, particularly IK(M) and Ih. Assuming that these effects would occur in vivo, they would likely influence the firing frequency of action potential generation in cells. Therefore, further research is necessary to determine the possible mechanisms of action of CBD or other structurally similar compounds in the body, such as the anxiolytic effects [3,6,7].
Different to some extent from a previous study [17], the current study found that the presence of CBD could suppress the magnitude of IK(M). The IC50 value for CBD to inhibit the density of IK(M) in GH3 cells was 3.6 μM. The quasi-steady-state activation curve of IK(M) in GH3 cells shifted towards a more depolarized potential, without changes in the curve’s steepness. Additionally, the CBD presence could suppress the IK(M) elicited by PT stimulation. These findings suggest that the responsiveness of IK(M) in unclamped cells is influenced by various confounding factors, including the level of the pre-existing resting membrane potential, CBD concentration, patterns of action potential firing, or combinations of these variables.
It needs to be mentioned that, concerning the steady-state activation curve of IK(M), it is important to have a sufficiently long step duration to accurately assess the slope factor and V1/2 values. This is essential for a more precise determination of the activation curve of this current, followed by the application of the Boltzmann equation to deduce V1/2 and the slope factor, subsequently allowing to predict the gating charge value. However, in the cells we have investigated (such as GH3 cells), when we employed a voltage-clamp protocol that exceeds 1 sec, we often observed the appearance of the inactivation process from other types of K+ currents. This phenomenon, to a certain extent, led to confusion with the inactivation of other delayed-rectifier K+ currents. The primary reason behind this is that GH3 cells, in addition to IK(M), still possess various types of delayed-rectifier K+ currents. This is a common issue encountered when conducting experiments on native excitable cells. Using cells with KCNQx-encoded currents may help mitigate these complications. Nonetheless, the exposure of CBD to GH3 cells did suppress the strength of IK(M) and shift the quasi-steady-state activation curve of IK(M) to a more depolarized potential without affecting the curve’s slope factor.
Previous research has shown that a train of depolarizing pulses can effectively alter the magnitude of INa, which is a current that decays exponentially over time [16]. More recently, it has been demonstrated that the magnitude of IK(M) can regulate the availability of NaV channels during prolonged high-frequency firing [16]. In our study, we found that exposure of GH3 cells to CBD suppressed the magnitude of IK(M) during PT depolarizing stimuli. As a result, the availability of NaV channels during sustained high-frequency firing may be reduced, leading to a decrease in reliable presynaptic spiking and synaptic transmission at high frequencies [9,10,14].
Our study observed that CBD did not significantly alter the magnitude of INa in GH3 cells, nor did cannabichromene, an agonist of cannabinoid receptor 1 [1]. These results appear to differ from the findings of a previous study conducted by Huang et al. [8]. They reported the suppression of the density of NaV1.4 currents by CBD. The reason for this discrepancy is not yet understood; however, it is possible that NaV1.4 currents affected by CBD [8] are primarily expressed in skeletal muscle cells rather than endocrine or neuroendocrine cells. It is thus pertinent to conduct further investigation to determine if the effects of CBD on INa are specific to certain tissues.
Four mammalian isoforms of HCN, which are HCN1, HCN2, HCN3, and HCN4, make up the macroscopic Ih (or If) [22,33]. Among them, HCN2, HCN3, and a combination of HCN2 and HCN3 channels are highly expressed in GH3 cells and other types of endocrine or neuroendocrine cells [36]. In our study, we observed that CBD caused a suppressive effect on Ih in a concentration- and voltage-dependent manner. The IC50 value for CBD to suppress Ih was estimated as 3.3 μM, and the quasi-steady-state activation curve of Ih was shifted to a more hyperpolarizing potential with no changes in the curve’s steepness. The CBD exposure also resulted in a considerable reduction in the strength of Ih’s Hys(V) elicited by long-lasting triangular Vramp. The effect of CBD on this Hys(V) behavior would be linked to its effect on the gating mechanism of HCN channels [37,38]. Therefore, apart from its effectiveness in inhibiting IK(M), as detailed above, CBD can also induce changes in the magnitude, gating kinetics, and Hys(V) behavior of Ih in a manner that may have pharmacological, therapeutic, or toxicological significance. It is worth noting that clinically achievable levels of CBD have been reported [39].
It is important to mention that, as CBD affects ion channels on the cell membrane with similar potency, it appears unlikely that these effects are solely mediated by CBD binding to cannabinoid receptors. If these effects were due largely to binding to cannabinoid receptors, the specificity of the effects should be particularly evident. Indeed, the subsequent addition of naloxone, an antagonist of opioid receptors, was not found to reverse CBD-induced inhibition of IK(M), despite the ability of CBD to modulate the activity of μ- and δ-opioid receptors [4,40]. Therefore, CBD’s influence on these currents is likely to be rapid and direct, rather than dependent on binding to cannabinoid or opioid receptors. Our findings offer substantial promise in terms of utilizing CBD in fundamental neuroscience and clinical research. As for how CBD modulates ionic currents and potentially disrupts specific downstream signaling pathways, further in-depth research is warranted in the future.

Author Contributions

Conceptualization, Y.-C.L.; Methodology, E.C.S.; Software, S.-N.W.; Validation, S.-N.W.; Formal analysis, S.-N.W.; Investigation, Y.-C.L.; Resources, E.C.S.; Writing—original draft, Y.-C.L.; Writing—review and editing, S.-N.W.; Project administration, E.C.S. All authors have read and agreed to the published version of the manuscript.

Funding

The research described in this paper was partly supported by grants from the Nation Science and Technology Council (NSTCC-110-2320-B-006-028, NSTC-111-2314-B-006-028, and NSTC-112-2923-B-006-001 to S.-N. Wu), Taiwan. Additionally, financial support was provided by An Nan Hospital, Taiwan, though grants ANHRF112-42, ANHRF112-43, and ANHRF112-44, which also played a role in supporting S.-N. Wu. The funders of this research were not involved in the study design, data collection, analyses, or interpretation.

Institutional Review Board Statement

Not applicable.

Informed Consent Statement

Not applicable.

Data Availability Statement

Data was available by request.

Acknowledgments

The authors of this paper acknowledge Meng-Cheng Yu for providing technical assistance.

Conflicts of Interest

The authors declare that the research was conducted in the absence of any commercial or financial relationships that could be construed as potential conflicts of interest.

References

  1. Howlett, A.C.; Abood, M.E. CB(1) and CB(2) Receptor Pharmacology. Adv. Pharmacol. 2017, 80, 169–206. [Google Scholar] [CrossRef] [PubMed]
  2. Fraguas-Sánchez, A.I.; Torres-Suárez, A.I. Medical Use of Cannabinoids. Drugs 2018, 78, 1665–1703. [Google Scholar] [CrossRef] [PubMed]
  3. Schurman, L.D.; Lu, D.; Kendall, D.A.; Howlett, A.C.; Lichtman, A.H. Molecular Mechanism and Cannabinoid Pharmacology. Handb. Exp. Pharmacol. 2020, 258, 323–353. [Google Scholar] [CrossRef] [PubMed]
  4. Britch, S.C.; Babalonis, S.; Walsh, S.L. Cannabidiol: Pharmacology and therapeutic targets. Psychopharmacology 2021, 238, 9–28. [Google Scholar] [CrossRef] [PubMed]
  5. Ghovanloo, M.R.; Ruben, P.C. Cannabidiol and Sodium Channel Pharmacology: General Overview, Mechanism, and Clinical Implications. Neuroscientist 2022, 28, 318–334. [Google Scholar] [CrossRef]
  6. Viudez-Martínez, A.; García-Gutiérrez, M.S.; Manzanares, J. Cannabidiol regulates the expression of hypothalamus-pituitary-adrenal axis-related genes in response to acute restraint stress. J. Psychopharmacol. 2018, 32, 1379–1384. [Google Scholar] [CrossRef]
  7. Lopresti, A.L.; Smith, S.J.; Drummond, P.D. Modulation of the hypothalamic-pituitary-adrenal (HPA) axis by plants and phytonutrients: A systematic review of human trials. Nutr. Neurosci. 2022, 25, 1704–1730. [Google Scholar] [CrossRef]
  8. Huang, C.W.; Lin, P.C.; Chen, J.L.; Lee, M.J. Cannabidiol Selectively Binds to the Voltage-Gated Sodium Channel Na(v)1.4 in Its Slow-Inactivated State and Inhibits Sodium Current. Biomedicines 2021, 9, 1141. [Google Scholar] [CrossRef]
  9. Zhan, X.; Drummond-Main, C.; Greening, D.; Yao, J.; Chen, S.W.R.; Appendino, J.P.; Au, P.Y.B.; Turner, R.W. Cannabidiol counters the effects of a dominant-negative pathogenic Kv7.2 variant. iScience 2022, 25, 105092. [Google Scholar] [CrossRef]
  10. Miceli, F.; Soldovieri, M.V.; Martire, M.; Taglialatela, M. Molecular pharmacology and therapeutic potential of neuronal Kv7-modulating drugs. Curr. Opin. Pharmacol. 2008, 8, 65–74. [Google Scholar] [CrossRef]
  11. Sankaranarayanan, S.; Simasko, S.M. Characterization of an M-like current modulated by thyrotropin-releasing hormone in normal rat lactotrophs. J. Neurosci. 1996, 16, 1668–1678. [Google Scholar] [CrossRef] [PubMed]
  12. Selyanko, A.A.; Hadley, J.K.; Wood, I.C.; Abogadie, F.C.; Delmas, P.; Buckley, N.J.; London, B.; Brown, D.A. Two types of K(+) channel subunit, Erg1 and KCNQ2/3, contribute to the M-like current in a mammalian neuronal cell. J. Neurosci. 1999, 19, 7742–7756. [Google Scholar] [CrossRef] [PubMed]
  13. Gribkoff, V.K. The therapeutic potential of neuronal KCNQ channel modulators. Expert Opin. Ther. Targets 2003, 7, 737–748. [Google Scholar] [CrossRef] [PubMed]
  14. Baculis, B.C.; Zhang, J.; Chung, H.J. The Role of K(v)7 Channels in Neural Plasticity and Behavior. Front. Physiol. 2020, 11, 568667. [Google Scholar] [CrossRef]
  15. Nappi, P.; Miceli, F.; Soldovieri, M.V.; Ambrosino, P.; Barrese, V.; Taglialatela, M. Epileptic channelopathies caused by neuronal Kv7 (KCNQ) channel dysfunction. Pflügers Arch. Eur. J. Physiol. 2020, 472, 881–898. [Google Scholar] [CrossRef]
  16. Zhang, Y.; Li, D.; Darwish, Y.; Fu, X.; Trussell, L.O.; Huang, H. KCNQ Channels Enable Reliable Presynaptic Spiking and Synaptic Transmission at High Frequency. J. Neurosci. 2022, 42, 3305–3315. [Google Scholar] [CrossRef]
  17. Zhang, H.B.; Heckman, L.; Niday, Z.; Jo, S.; Fujita, A.; Shim, J.; Pandey, R.; Al Jandal, H.; Jayakar, S.; Barrett, L.B.; et al. Cannabidiol activates neuronal Kv7 channels. eLife 2022, 11, e73246. [Google Scholar] [CrossRef]
  18. Irisawa, H.; Brown, H.F.; Giles, W. Cardiac pacemaking in the sinoatrial node. Physiol. Rev. 1993, 73, 197–227. [Google Scholar] [CrossRef]
  19. Liu, Y.C.; Wang, Y.J.; Wu, P.Y.; Wu, S.N. Tramadol-induced block of hyperpolarization-activated cation current in rat pituitary lactotrophs. Naunyn-Schmiedeberg’s Arch. Pharmacol. 2009, 379, 127–135. [Google Scholar] [CrossRef]
  20. Hsiao, H.T.; Liu, Y.C.; Liu, P.Y.; Wu, S.N. Concerted suppression of I(h) and activation of I(K(M)) by ivabradine, an HCN-channel inhibitor, in pituitary cells and hippocampal neurons. Brain Res. Bull. 2019, 149, 11–20. [Google Scholar] [CrossRef]
  21. Chuang, C.W.; Chang, K.P.; Cho, H.Y.; Chuang, T.H.; Yu, M.C.; Wu, C.L.; Wu, S.N. Characterization of Inhibitory Capability on Hyperpolarization-Activated Cation Current Caused by Lutein (β,ε-Carotene-3,3’-Diol), a Dietary Xanthophyll Carotenoid. Int. J. Mol. Sci. 2022, 23, 7186. [Google Scholar] [CrossRef] [PubMed]
  22. Peters, C.H.; Singh, R.K.; Bankston, J.R.; Proenza, C. Regulation of HCN Channels by Protein Interactions. Front. Physiol. 2022, 13, 928507. [Google Scholar] [CrossRef] [PubMed]
  23. Mäki-Marttunen, T.; Mäki-Marttunen, V. Excitatory and inhibitory effects of HCN channel modulation on excitability of layer V pyramidal cells. PLoS Comput. Biol. 2022, 18, e1010506. [Google Scholar] [CrossRef] [PubMed]
  24. Surges, R.; Kukley, M.; Brewster, A.; Rüschenschmidt, C.; Schramm, J.; Baram, T.Z.; Beck, H.; Dietrich, D. Hyperpolarization-activated cation current Ih of dentate gyrus granule cells is upregulated in human and rat temporal lobe epilepsy. Biochem. Biophys. Res. Commun. 2012, 420, 156–160. [Google Scholar] [CrossRef] [PubMed]
  25. Yongning, Z.; Xianguang, L.; Hengling, C.; Su, C.; Fang, L.; Chenhong, L. The hyperpolarization-activated cyclic nucleotide-gated channel currents contribute to oxaliplatin-induced hyperexcitability of DRG neurons. Somatosens. Mot. Res. 2021, 38, 11–19. [Google Scholar] [CrossRef]
  26. Ohashi, N.; Uta, D.; Ohashi, M.; Baba, H. Analgesic effect of ivabradine against inflammatory pain mediated by hyperpolarization-activated cyclic nucleotide-gated cation channels expressed on primary afferent terminals in the spinal dorsal horn. Pain 2022, 163, 1356–1369. [Google Scholar] [CrossRef]
  27. Noda, M.; Obana, M.; Akaike, N. Inhibition of M-type K+ current by linopirdine, a neurotransmitter-release enhancer, in NG108-15 neuronal cells and rat cerebral neurons in culture. Brain Res. 1998, 794, 274–280. [Google Scholar] [CrossRef]
  28. Dods, R.L.; Donnelly, D. The peptide agonist-binding site of the glucagon-like peptide-1 (GLP-1) receptor based on site-directed mutagenesis and knowledge-based modelling. Biosci. Rep. 2015, 36, e00285. [Google Scholar] [CrossRef]
  29. Drucker, D.J. GLP-1 physiology informs the pharmacotherapy of obesity. Mol. Metab. 2022, 57, 101351. [Google Scholar] [CrossRef]
  30. Casis, O.; Olesen, S.P.; Sanguinetti, M.C. Mechanism of action of a novel human ether-a-go-go-related gene channel activator. Mol. Pharmacol. 2006, 69, 658–665. [Google Scholar] [CrossRef]
  31. Chen, B.S.; Lo, Y.C.; Peng, H.; Hsu, T.I.; Wu, S.N. Effects of ranolazine, a novel anti-anginal drug, on ion currents and membrane potential in pituitary tumor GH(3) cells and NG108-15 neuronal cells. J. Pharmacol. Sci. 2009, 110, 295–305. [Google Scholar] [CrossRef] [PubMed]
  32. So, E.C.; Wu, S.N.; Lo, Y.C.; Su, K. Differential regulation of tefluthrin and telmisartan on the gating charges of I(Na) activation and inactivation as well as on resurgent and persistent I(Na) in a pituitary cell line (GH(3)). Toxicol. Lett. 2018, 285, 104–112. [Google Scholar] [CrossRef] [PubMed]
  33. Männikkö, R.; Pandey, S.; Larsson, H.P.; Elinder, F. Hysteresis in the voltage dependence of HCN channels: Conversion between two modes affects pacemaker properties. J. Gen. Physiol. 2005, 125, 305–326. [Google Scholar] [CrossRef]
  34. Xiao, Y.F.; Chandler, N.; Dobrzynski, H.; Richardson, E.S.; Tenbroek, E.M.; Wilhelm, J.J.; Sharma, V.; Varghese, A.; Boyett, M.R.; Iaizzo, P.A.; et al. Hysteresis in human HCN4 channels: A crucial feature potentially affecting sinoatrial node pacemaking. Sheng Li Xue Bao 2010, 62, 1–13. [Google Scholar] [PubMed]
  35. Chang, W.T.; Gao, Z.H.; Li, S.W.; Liu, P.Y.; Lo, Y.C.; Wu, S.N. Characterization in Dual Activation by Oxaliplatin, a Platinum-Based Chemotherapeutic Agent of Hyperpolarization-Activated Cation and Electroporation-Induced Currents. Int. J. Mol. Sci. 2020, 21, 396. [Google Scholar] [CrossRef]
  36. Kretschmannova, K.; Gonzalez-Iglesias, A.E.; Tomić, M.; Stojilkovic, S.S. Dependence of hyperpolarisation-activated cyclic nucleotide-gated channel activity on basal cyclic adenosine monophosphate production in spontaneously firing GH3 cells. J. Neuroendocrinol. 2006, 18, 484–493. [Google Scholar] [CrossRef]
  37. Robinson, R.B.; Siegelbaum, S.A. Hyperpolarization-activated cation currents: From molecules to physiological function. Annu. Rev. Physiol. 2003, 65, 453–480. [Google Scholar] [CrossRef]
  38. Ramentol, R.; Perez, M.E.; Larsson, H.P. Gating mechanism of hyperpolarization-activated HCN pacemaker channels. Nat. Commun. 2020, 11, 332a. [Google Scholar] [CrossRef]
  39. Millar, S.A.; Stone, N.L.; Yates, A.S.; O’Sullivan, S.E. A Systematic Review on the Pharmacokinetics of Cannabidiol in Humans. Front. Pharmacol. 2018, 9, 1365. [Google Scholar] [CrossRef]
  40. Kathmann, M.; Flau, K.; Redmer, A.; Tränkle, C.; Schlicker, E. Cannabidiol is an allosteric modulator at mu- and delta-opioid receptors. Naunyn Schmiedeberg’s Arch. Pharmacol. 2006, 372, 354–361. [Google Scholar] [CrossRef]
Figure 1. Effect of cannabidiol (CBD) on M-type K+ current (IK(M)) identified in pituitary GH3 cells. In this set of experiments, we bathed cells in high-K+, Ca2+-free solution, which contained 1 μM tetrodotoxin (TTX), and the measuring electrode used was filled up with a K+-enriched solution. (A) Representative current traces acquired in the control period (a) (i.e., absence of CBD) and during cell exposure to 1 μM CBD (b) or 3 μM CBD (c). The upper part indicates the voltage-clamp protocol applied. (B) Concentration–response curve of CBD-induced block of IK(M) density observed in GH3 cells (mean ± SEM; n = 8 for each point). The sigmoidal line drawn represents the goodness-of-fit to the Hill equation, as described in Section 2. The IC50 values for the CBD-mediated inhibition of IK(M) was optimally estimated to be 3.6 μM.
Biomedicines 11 02651 g001
Figure 2. Effect of CBD on mean current density versus voltage relationship (A) and the quasi-steady-state activation curve (B) of IK(M). The experimental procedures employed in these experiments were similar to those outlined in Figure 1. The examined cell was maintained at −50 mV and a series of command voltages ranging from −50 to 0 mV in 10 mV steps were applied to it. (A) Mean current density versus voltage relationship of IK(M) in the absence (black filled squares) and presence (red open squares) of 3 μM CBD (mean ± SEM; n = 7 for each point). Current density was measured at the end of each voltage step. (B) Quasi-steady-state activation curve of IK(M) in the control (black filled squares) and during exposure to 3 μM CBD (red open squares) (mean ± SEM; n = 7 for each point). The smooth lines described in Section 2 were optimally generated by fitting the Boltzmann equation for the activation curve of the current using a least-squares method. The statistical analyses in (A) and (B) were undertaken by ANOVA-2 for repeated measures, p (factor 1, groups among data taken at different levels of membrane potential) < 0.05, p (factor 2, groups between the absence and presence of CBD) < 0.05, p (interaction) < 0.05, followed by post-hoc Fisher’s test, p < 0.05. Of note, exposure to 3 μM CBD resulted in a rightward shift of the activation curve of IK(M) with no change in the slope factor of the curve.
Biomedicines 11 02651 g002
Figure 3. Comparison among the impact of CBD, CBD plus naloxone, linopirdine (Lino), thyrotropin-releasing hormone (TRH), and liraglutinide (Lira) on the observed density of IK(M) in GH3 cells. (A) Representative current traces acquired in the control period (a) and during exposure to 3 μM CBD (b) or 3 μM CBD plus 10 μM naloxone (c). The upper part shows the voltage-clamp protocol applied. (B) Summary bar graph showing effect of CBD, CBD plus naloxone, linopirdine, thyrotropin-releasing hormone, and liraglutinide on IK(M) in GH3 cells. Current density was measured at the end of 1 s depolarizing pulse from −50 to −10 mV. Each bar indicates the mean ± SEM (n = 7). Data analysis was performed by ANOVA-1 (p < 0.05). * Significantly different from control (p < 0.05).
Biomedicines 11 02651 g003
Figure 4. Impact of CBD on the activation of IK(M) through pulse-train (PT) stimulation in GH3 cells. To conduct the experiment, cells were placed in a high-K+, Ca2+-free solution, and the PT stimulation protocol involved a series of 40 depolarizing pulses lasting 20 ms each, applied at −10 mV with 5 ms intervals, for a total duration of 1 s. (A) Representative current traces are presented, depicting recordings acquired during the control period (upper trace in black) and in the presence of 3 μM CBD (lower trace in red). The top portion of the figure shows the applied voltage-clamp protocol. The * symbol indicates the activating IK(M), while ** represents the deactivating (or tail) component of IK(M) obtained after returning to −50 mV. Summary bar graphs in (B,C) display the activating and deactivating densities of IK(M), respectively, in the absence and presence of 1 or 3 μM CBD. The values are presented as mean ± SEM, with each bar representing data from seven independent experiments. The activating density of IK(M) was measured at the end of the PT depolarizing pulses from −50 to −10 mV, while the deactivating density was measured following the return to −50 mV. Data analyses in (B) and (C) were performed by ANOVA-1 (p < 0.05). The * symbol indicates statistical significance when compared to the control group (p < 0.05), while ** denotes statistical significance when compared to the CBD (1 μM) alone group (p < 0.05).
Biomedicines 11 02651 g004
Figure 5. Mild inhibitory effect of CBD on erg-mediated K+ current (IK(erg)) in GH3 cells. We placed cells in high-K+, Ca2+-free solution containing 1 μM TTX, and the measuring pipette was filled with a K+-enriched solution. (A) Representative current traces obtained in the control period (a, black color), and during cell exposure to 10 μM CBD (b, red color) or to 10 μM CBD plus 10 μM NS1643 (c, green color). The voltage protocol applied is illustrated in the upper part. (B) Summary bar graph demonstrating effects of CBD (3 or 10 μM) and 10 μM CBD plus 10 μM NS1643 on the density of IK(erg) (mean ± SEM; n = 8 for each bar). Current density (i.e., deactivating IK(erg)) was measured at the beginning of 1 s step hyperpolarization from −10 to −90 mV. Data analysis was performed by ANOVA-1 (p < 0.05). * Significantly different from control (p < 0.05) and ** significantly different from CBD (10 μM) alone group (p < 0.05).
Biomedicines 11 02651 g005
Figure 6. Inability of CBD to modify the density of voltage-gated Na+ current (INa) in GH3 cells. In these experiments, we placed cells in Ca2+-free Tyrode’s solution that contained 10 mM tetraethylammonium chloride, and the recording electrode was filled with a Cs+-enriched solution. (A) Representative current traces acquired in the control period (a, black color) and during cell exposure to either 10 μM CBD alone (b, blue color) or 10 μM CBD plus 10 μM ranolazine (Ran) (c, red color). The voltage-clamp protocol applied is indicated in the upper part. (B) Summary bar graph demonstrating effects of CBD, CBD plus ranolazine, CBD plus tefluthrin (Tef), and CBD plus telmisartan (TEL) on the peak density of INa (mean ± SEM; n = 7 for each bar). Of note, the presence of CBD (10 μM) did not cause any effect on the peak INa; however, further addition of Ran decreased INa density, while that of either Tef or TEL increased it. Data analysis was performed by ANOVA-1 (p < 0.05). * Significantly different from control (p < 0.05) and ** significantly different from CBD (10 μM) alone group (p < 0.05).
Biomedicines 11 02651 g006
Figure 7. Inhibitory effect of CBD on mean current density versus voltage relationship of hyperpolarization-activated cation current (Ih) recorded in GH3 cells. In this set of measurements, cells were kept in Ca2+-free Tyrode’s solution that contained 1 μM TTX, and the measuring electrode was filled up with a K+-enriched solution. (A) Representative current traces acquired in the control period (a) and during exposure to 3 μM CBD (b) or 3 μM CBD plus 10 μM naloxone (c). The upper part indicates the voltage-clamp protocol used. (B) Representative current traces obtained in the control period (upper part) and during the presence of 3 μM CBD (lower part). The uppermost part represents the voltage-clamp protocol used, while the different colors correspond to different evoked currents (shown in the figure below). (C) Mean current density versus voltage relationship of Ih acquired in the absence (black filled squares) and presence (red open squares) of Ih density (mean ± SEM; n = 7 for each point). Current density was measured at the end of each hyperpolarizing pulse for a duration of 2 s. (D) Quasi-steady-state activation curve of Ih obtained in the control period (black filled squares) and during exposure to 3 μM CBD (red open squares) (mean ± SEM; n = 7 for each point). The sigmoid curve in the figure represents the Boltzmann equation (shown in Section 2), which was fit to the data using least-squares minimization. The statistical analyses for (C,D) were undertaken by ANOVA-2 for repeated measures, p (factor 1, groups among data taken at different levels of membrane potential) < 0.05, p (factor 2, groups between the absence and presence of CBD) < 0.05, p (interaction) < 0.05, followed by post-hoc Fisher’s test, p < 0.05. (E) Concentration–response curve of CBD-induced inhibition of Ih density (mean ± SEM; n = 8 for each point). Current densities in the presence of different CBD concentrations were taken at the end of a 2 s hyperpolarizing pulse from −40 to −110 mV. The smooth curve was generated using the least-squares method and fitted to the Hill equation, as detailed in Section 2.
Biomedicines 11 02651 g007
Figure 8. Impact of CBD on Ih elicited by long-lasting triangular ramp voltage (Vramp) in GH3 cells. (A) Representative current traces acquired without (a, black color) or with (b, red color) the presence of 3 μM CBD. The upper part indicates the Vramp protocol applied, while dashed arrows show the ascending and descending limbs of Vramp as a function of time. (B) Representative current versus voltage relationship (i.e., voltage-dependent hysteresis, Hys(V)) of Ih elicited by 2 s triangular Vramp with or without the addition of 3 μM CBD. The dashed arrow indicates current trajectory which passes over time during triangular Vramp. (C) Summary bar graph showing effects of ivabradine (IVA, 3 μM), CBD (3 μM), and CBD (3 μM) plus oxaliplatin (OXAL, 10 μM) on the area (Δarea) of Vramp-induced Hys(V) in Ih (mean ± SEM; n = 7 for each bar). The Δarea represents the area enclosed by the upward (ascending) and downward (descending) limbs of the Ih elicited using an isosceles triangular Vramp usually ranging between −50 and −130 mV. Data analysis was performed by ANOVA-1 (p < 0.05). * Significantly different from control (p < 0.05) and ** significantly different from CBD (3 μM) alone group (p < 0.05).
Biomedicines 11 02651 g008
Disclaimer/Publisher’s Note: The statements, opinions and data contained in all publications are solely those of the individual author(s) and contributor(s) and not of MDPI and/or the editor(s). MDPI and/or the editor(s) disclaim responsibility for any injury to people or property resulting from any ideas, methods, instructions or products referred to in the content.

